Collierville, CA Map & Demographics
Collierville Map
Collierville Overview
$41,284
PER CAPITA INCOME
$96,431
AVG FAMILY INCOME
$95,403
AVG HOUSEHOLD INCOME
24.0%
WAGE / INCOME GAP [ % ]
76.0¢/ $1
WAGE / INCOME GAP [ $ ]
0.41
INEQUALITY / GINI INDEX
2,104
TOTAL POPULATION
1,114
MALE POPULATION
990
FEMALE POPULATION
112.53
MALES / 100 FEMALES
88.87
FEMALES / 100 MALES
35.1
MEDIAN AGE
3.7
AVG FAMILY SIZE
3.2
AVG HOUSEHOLD SIZE
1,132
LABOR FORCE [ PEOPLE ]
73.1%
PERCENT IN LABOR FORCE
5.1%
UNEMPLOYMENT RATE
Income in Collierville
Income Overview in Collierville
Per Capita Income in Collierville is $41,284, while median incomes of families and households are $96,431 and $95,403 respectively.
| Characteristic | Number | Measure |
| Per Capita Income | 2,104 | $41,284 |
| Median Family Income | 521 | $96,431 |
| Mean Family Income | 521 | $146,215 |
| Median Household Income | 656 | $95,403 |
| Mean Household Income | 656 | $131,572 |
| Income Deficit | 521 | $0 |
| Wage / Income Gap (%) | 2,104 | 23.99% |
| Wage / Income Gap ($) | 2,104 | 76.01¢ per $1 |
| Gini / Inequality Index | 2,104 | 0.41 |
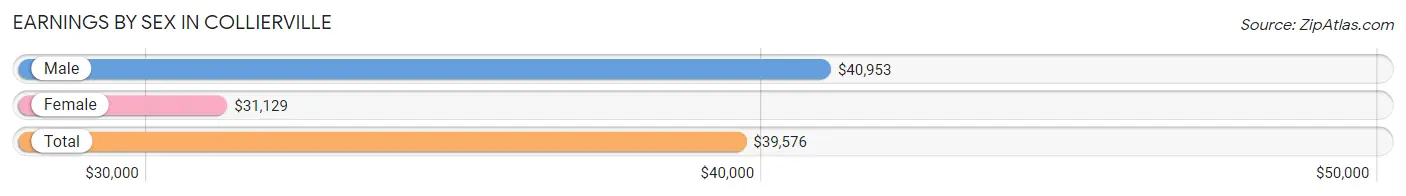
Earnings by Sex in Collierville
Average Earnings in Collierville are $39,576, $40,953 for men and $31,129 for women, a difference of 24.0%.
| Sex | Number | Average Earnings |
| Male | 649 (59.0%) | $40,953 |
| Female | 452 (41.0%) | $31,129 |
| Total | 1,101 (100.0%) | $39,576 |
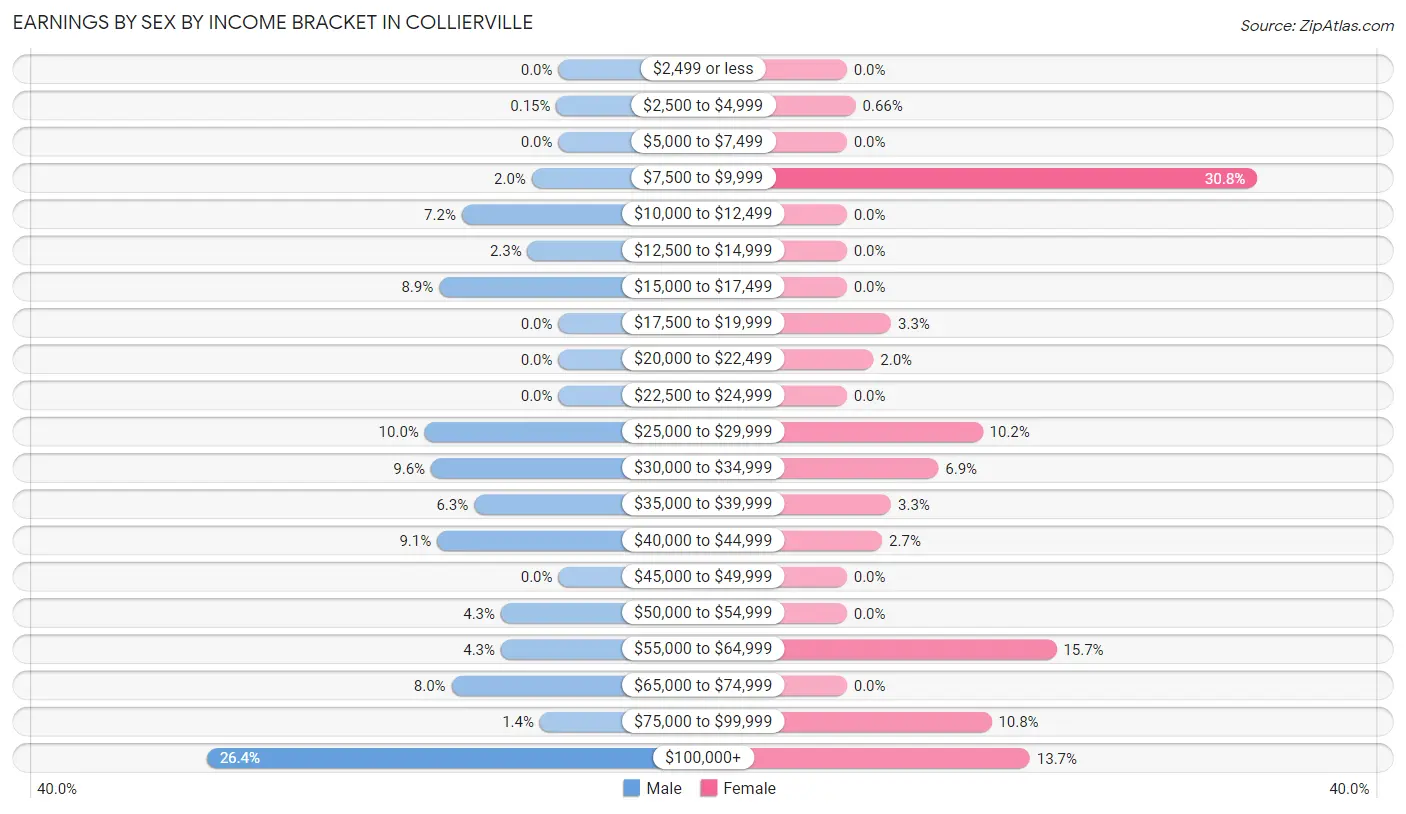
Earnings by Sex by Income Bracket in Collierville
The most common earnings brackets in Collierville are $100,000+ for men (171 | 26.4%) and $7,500 to $9,999 for women (139 | 30.7%).
| Income | Male | Female |
| $2,499 or less | 0 (0.0%) | 0 (0.0%) |
| $2,500 to $4,999 | 1 (0.2%) | 3 (0.7%) |
| $5,000 to $7,499 | 0 (0.0%) | 0 (0.0%) |
| $7,500 to $9,999 | 13 (2.0%) | 139 (30.7%) |
| $10,000 to $12,499 | 47 (7.2%) | 0 (0.0%) |
| $12,500 to $14,999 | 15 (2.3%) | 0 (0.0%) |
| $15,000 to $17,499 | 58 (8.9%) | 0 (0.0%) |
| $17,500 to $19,999 | 0 (0.0%) | 15 (3.3%) |
| $20,000 to $22,499 | 0 (0.0%) | 9 (2.0%) |
| $22,500 to $24,999 | 0 (0.0%) | 0 (0.0%) |
| $25,000 to $29,999 | 65 (10.0%) | 46 (10.2%) |
| $30,000 to $34,999 | 62 (9.6%) | 31 (6.9%) |
| $35,000 to $39,999 | 41 (6.3%) | 15 (3.3%) |
| $40,000 to $44,999 | 59 (9.1%) | 12 (2.6%) |
| $45,000 to $49,999 | 0 (0.0%) | 0 (0.0%) |
| $50,000 to $54,999 | 28 (4.3%) | 0 (0.0%) |
| $55,000 to $64,999 | 28 (4.3%) | 71 (15.7%) |
| $65,000 to $74,999 | 52 (8.0%) | 0 (0.0%) |
| $75,000 to $99,999 | 9 (1.4%) | 49 (10.8%) |
| $100,000+ | 171 (26.4%) | 62 (13.7%) |
| Total | 649 (100.0%) | 452 (100.0%) |
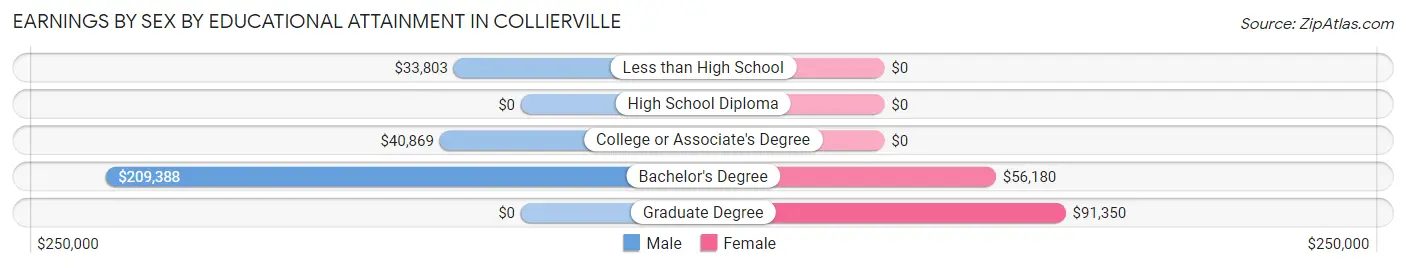
Earnings by Sex by Educational Attainment in Collierville
Average earnings in Collierville are $41,335 for men and $41,146 for women, a difference of 0.5%. Men with an educational attainment of bachelor's degree enjoy the highest average annual earnings of $209,388, while those with less than high school education earn the least with $33,803. Women with an educational attainment of graduate degree earn the most with the average annual earnings of $91,350, while those with bachelor's degree education have the smallest earnings of $56,180.
| Educational Attainment | Male Income | Female Income |
| Less than High School | $33,803 | $0 |
| High School Diploma | - | - |
| College or Associate's Degree | $40,869 | $0 |
| Bachelor's Degree | $209,388 | $56,180 |
| Graduate Degree | - | - |
| Total | $41,335 | $41,146 |
Family Income in Collierville
Family Income Brackets in Collierville
According to the Collierville family income data, there are 149 families falling into the $200,000+ income range, which is the most common income bracket and makes up 28.6% of all families.
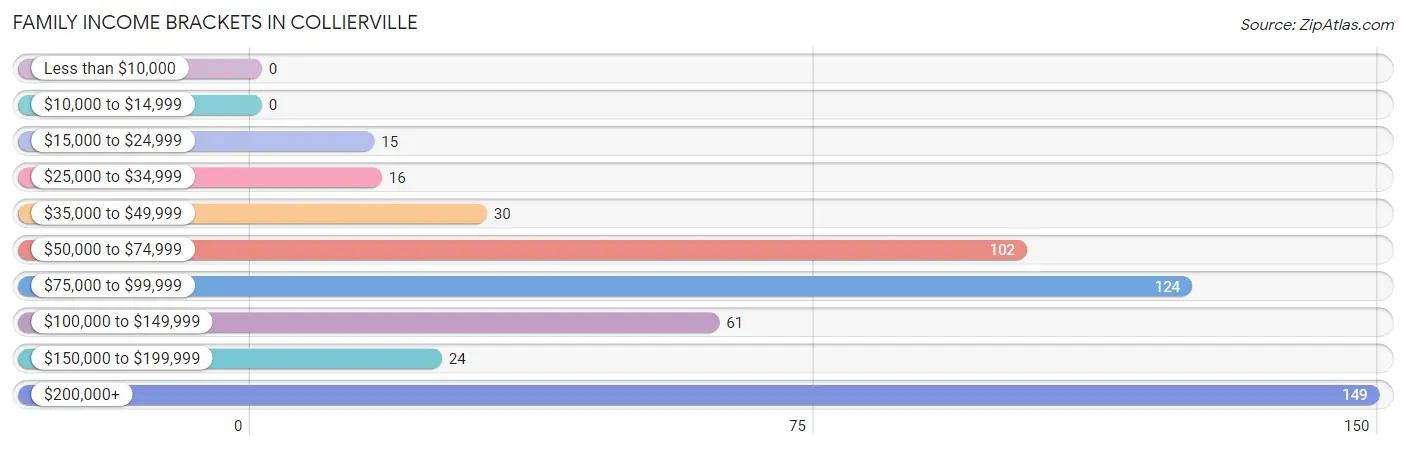
| Income Bracket | # Families | % Families |
| Less than $10,000 | 0 | 0.0% |
| $10,000 to $14,999 | 0 | 0.0% |
| $15,000 to $24,999 | 15 | 2.9% |
| $25,000 to $34,999 | 16 | 3.1% |
| $35,000 to $49,999 | 30 | 5.8% |
| $50,000 to $74,999 | 102 | 19.6% |
| $75,000 to $99,999 | 124 | 23.8% |
| $100,000 to $149,999 | 61 | 11.7% |
| $150,000 to $199,999 | 24 | 4.6% |
| $200,000+ | 149 | 28.6% |
Family Income by Famaliy Size in Collierville
5-person families (90 | 17.3%) account for the highest median family income in Collierville with $117,000 per family, while 2-person families (103 | 19.8%) have the highest median income of $48,084 per family member.
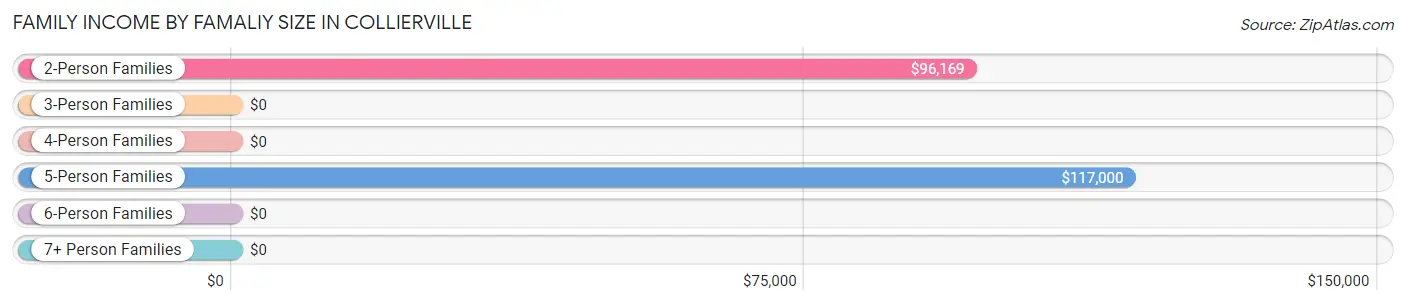
| Income Bracket | # Families | Median Income |
| 2-Person Families | 103 (19.8%) | $96,169 |
| 3-Person Families | 188 (36.1%) | $0 |
| 4-Person Families | 97 (18.6%) | $0 |
| 5-Person Families | 90 (17.3%) | $117,000 |
| 6-Person Families | 43 (8.3%) | $0 |
| 7+ Person Families | 0 (0.0%) | $0 |
| Total | 521 (100.0%) | $96,431 |
Family Income by Number of Earners in Collierville
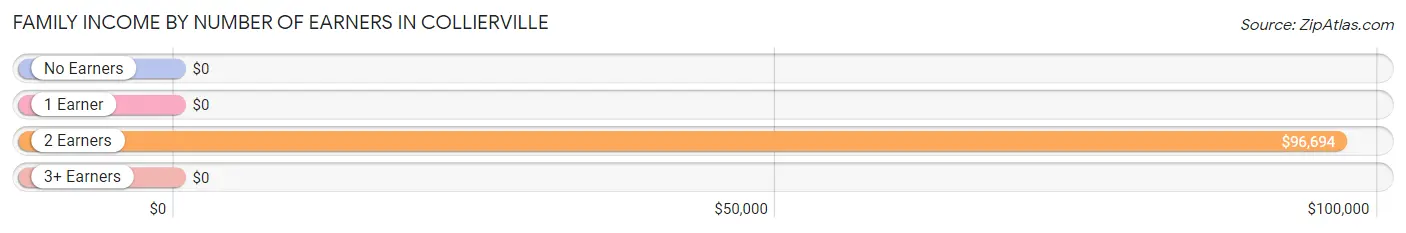
| Number of Earners | # Families | Median Income |
| No Earners | 42 (8.1%) | $0 |
| 1 Earner | 89 (17.1%) | $0 |
| 2 Earners | 292 (56.0%) | $96,694 |
| 3+ Earners | 98 (18.8%) | $0 |
| Total | 521 (100.0%) | $96,431 |
Household Income in Collierville
Household Income Brackets in Collierville
With 149 households falling in the category, the $200,000+ income range is the most frequent in Collierville, accounting for 22.7% of all households.
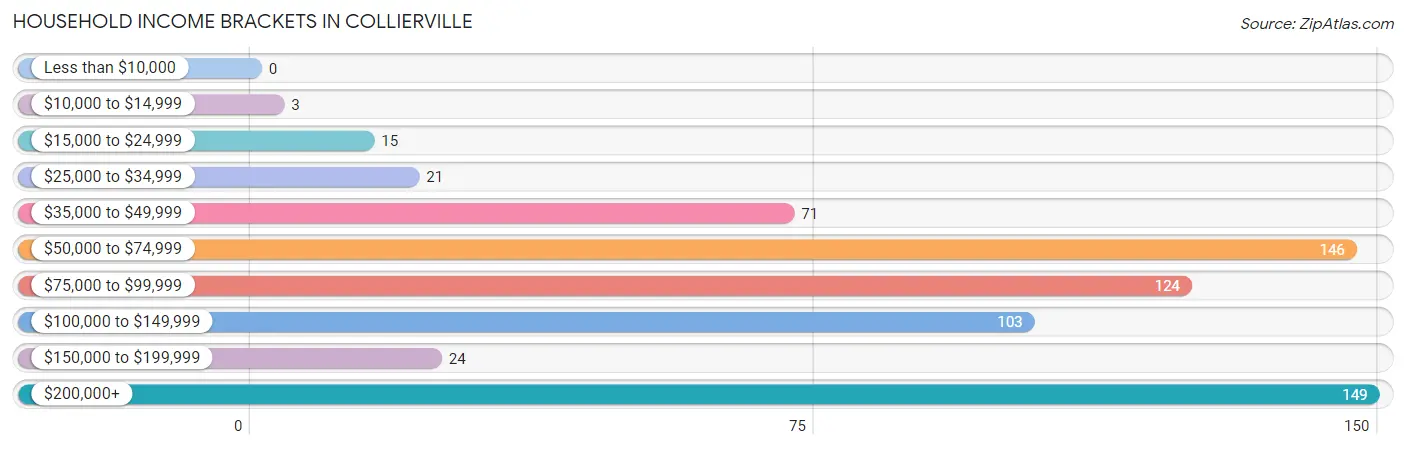
| Income Bracket | # Households | % Households |
| Less than $10,000 | 0 | 0.0% |
| $10,000 to $14,999 | 3 | 0.5% |
| $15,000 to $24,999 | 15 | 2.3% |
| $25,000 to $34,999 | 21 | 3.2% |
| $35,000 to $49,999 | 71 | 10.8% |
| $50,000 to $74,999 | 146 | 22.3% |
| $75,000 to $99,999 | 124 | 18.9% |
| $100,000 to $149,999 | 103 | 15.7% |
| $150,000 to $199,999 | 24 | 3.7% |
| $200,000+ | 149 | 22.7% |
Household Income by Householder Age in Collierville
The median household income in Collierville is $95,403, with the highest median household income of $101,500 found in the 45 to 64 years age bracket for the primary householder. A total of 326 households (49.7%) fall into this category.
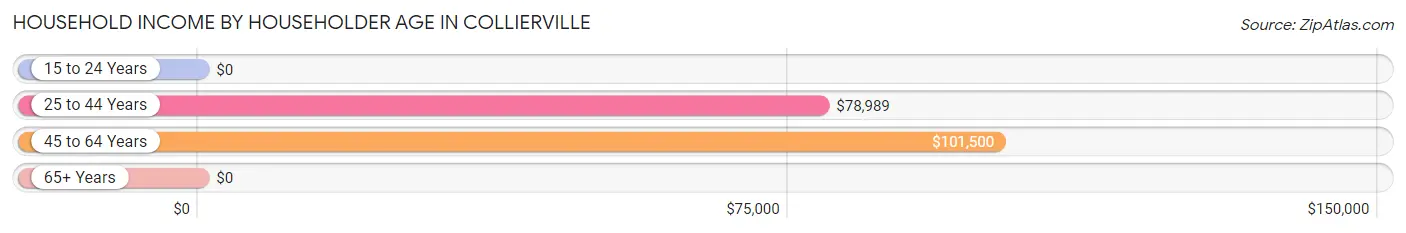
| Income Bracket | # Households | Median Income |
| 15 to 24 Years | 0 (0.0%) | $0 |
| 25 to 44 Years | 242 (36.9%) | $78,989 |
| 45 to 64 Years | 326 (49.7%) | $101,500 |
| 65+ Years | 88 (13.4%) | $0 |
| Total | 656 (100.0%) | $95,403 |
Poverty in Collierville
Income Below Poverty by Sex and Age in Collierville
With 3.7% poverty level for males and 1.7% for females among the residents of Collierville, 16 and 17 year old males and 35 to 44 year old females are the most vulnerable to poverty, with 13 males (35.1%) and 14 females (9.8%) in their respective age groups living below the poverty level.
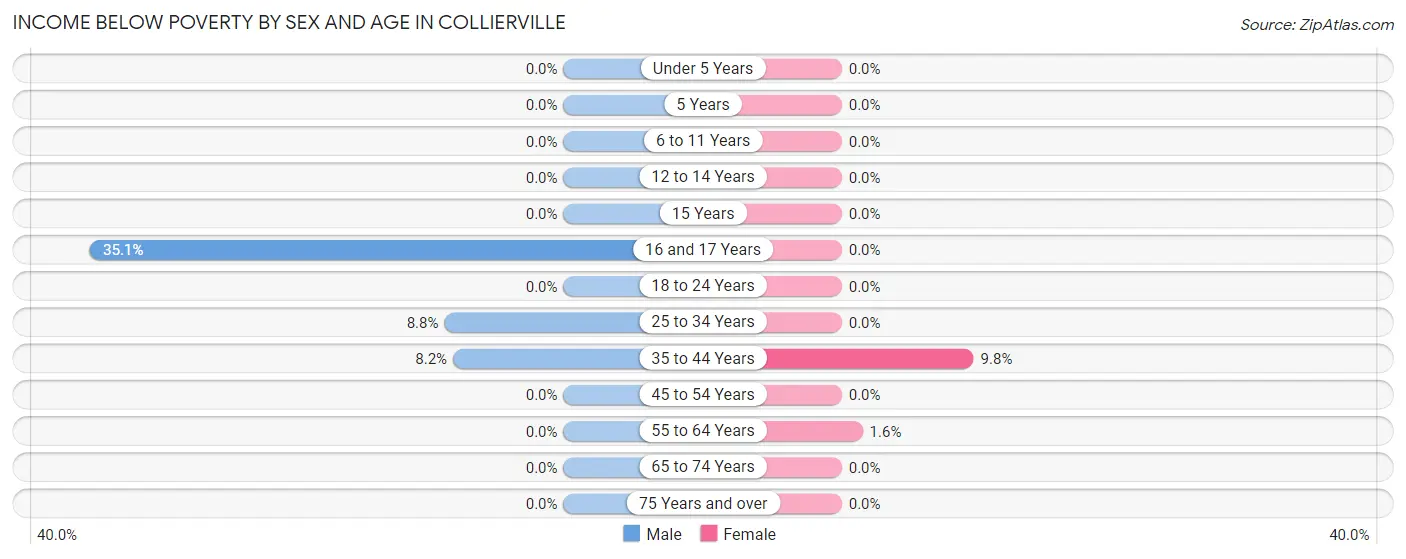
| Age Bracket | Male | Female |
| Under 5 Years | 0 (0.0%) | 0 (0.0%) |
| 5 Years | 0 (0.0%) | 0 (0.0%) |
| 6 to 11 Years | 0 (0.0%) | 0 (0.0%) |
| 12 to 14 Years | 0 (0.0%) | 0 (0.0%) |
| 15 Years | 0 (0.0%) | 0 (0.0%) |
| 16 and 17 Years | 13 (35.1%) | 0 (0.0%) |
| 18 to 24 Years | 0 (0.0%) | 0 (0.0%) |
| 25 to 34 Years | 13 (8.8%) | 0 (0.0%) |
| 35 to 44 Years | 15 (8.2%) | 14 (9.8%) |
| 45 to 54 Years | 0 (0.0%) | 0 (0.0%) |
| 55 to 64 Years | 0 (0.0%) | 3 (1.5%) |
| 65 to 74 Years | 0 (0.0%) | 0 (0.0%) |
| 75 Years and over | 0 (0.0%) | 0 (0.0%) |
| Total | 41 (3.7%) | 17 (1.7%) |
Income Above Poverty by Sex and Age in Collierville
According to the poverty statistics in Collierville, males aged under 5 years and females aged under 5 years are the age groups that are most secure financially, with 100.0% of males and 100.0% of females in these age groups living above the poverty line.
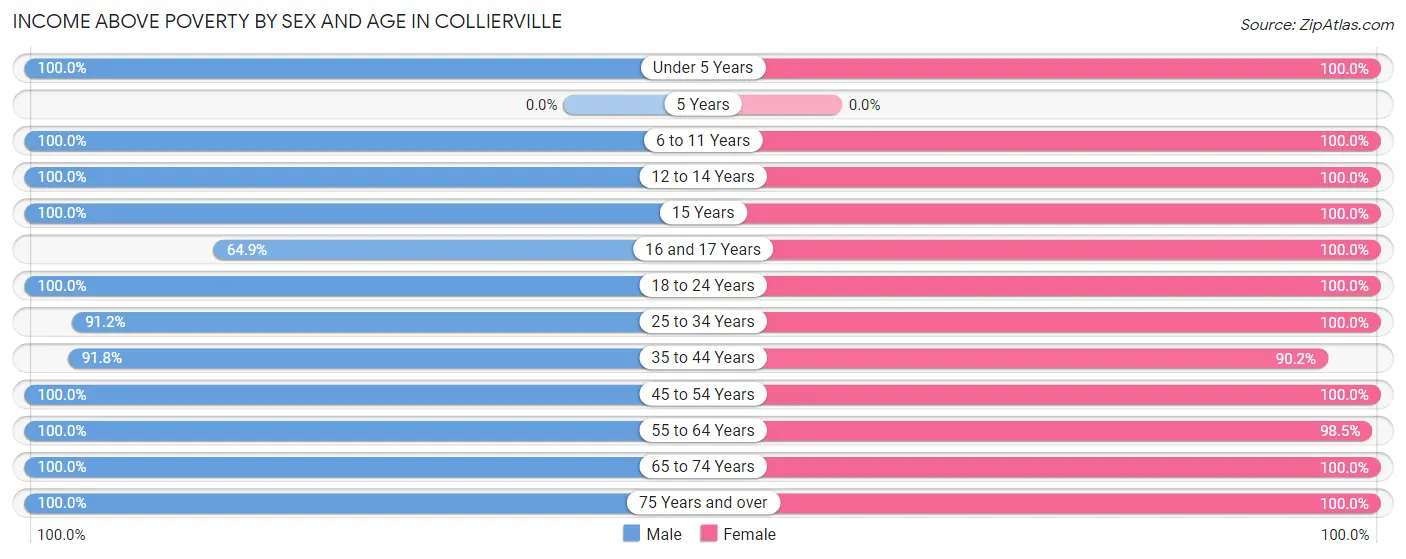
| Age Bracket | Male | Female |
| Under 5 Years | 193 (100.0%) | 18 (100.0%) |
| 5 Years | 0 (0.0%) | 0 (0.0%) |
| 6 to 11 Years | 95 (100.0%) | 107 (100.0%) |
| 12 to 14 Years | 47 (100.0%) | 55 (100.0%) |
| 15 Years | 19 (100.0%) | 21 (100.0%) |
| 16 and 17 Years | 24 (64.9%) | 65 (100.0%) |
| 18 to 24 Years | 37 (100.0%) | 75 (100.0%) |
| 25 to 34 Years | 134 (91.2%) | 132 (100.0%) |
| 35 to 44 Years | 168 (91.8%) | 129 (90.2%) |
| 45 to 54 Years | 103 (100.0%) | 75 (100.0%) |
| 55 to 64 Years | 158 (100.0%) | 191 (98.5%) |
| 65 to 74 Years | 91 (100.0%) | 62 (100.0%) |
| 75 Years and over | 4 (100.0%) | 43 (100.0%) |
| Total | 1,073 (96.3%) | 973 (98.3%) |
Income Below Poverty Among Married-Couple Families in Collierville
The poverty statistics for married-couple families in Collierville show that 3.5% or 15 of the total 428 families live below the poverty line. Families with 1 or 2 children have the highest poverty rate of 8.7%, comprising of 15 families. On the other hand, families with no children have the lowest poverty rate of 0.0%, which includes 0 families.
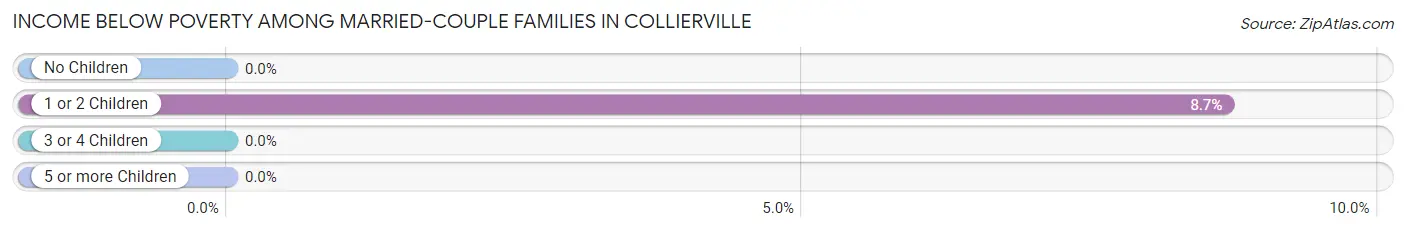
| Children | Above Poverty | Below Poverty |
| No Children | 139 (100.0%) | 0 (0.0%) |
| 1 or 2 Children | 158 (91.3%) | 15 (8.7%) |
| 3 or 4 Children | 116 (100.0%) | 0 (0.0%) |
| 5 or more Children | 0 (0.0%) | 0 (0.0%) |
| Total | 413 (96.5%) | 15 (3.5%) |
Income Below Poverty Among Single-Parent Households in Collierville
| Children | Single Father | Single Mother |
| No Children | 0 (0.0%) | 0 (0.0%) |
| 1 or 2 Children | 0 (0.0%) | 0 (0.0%) |
| 3 or 4 Children | 0 (0.0%) | 0 (0.0%) |
| 5 or more Children | 0 (0.0%) | 0 (0.0%) |
| Total | 0 (0.0%) | 0 (0.0%) |
Income Below Poverty Among Married-Couple vs Single-Parent Households in Collierville
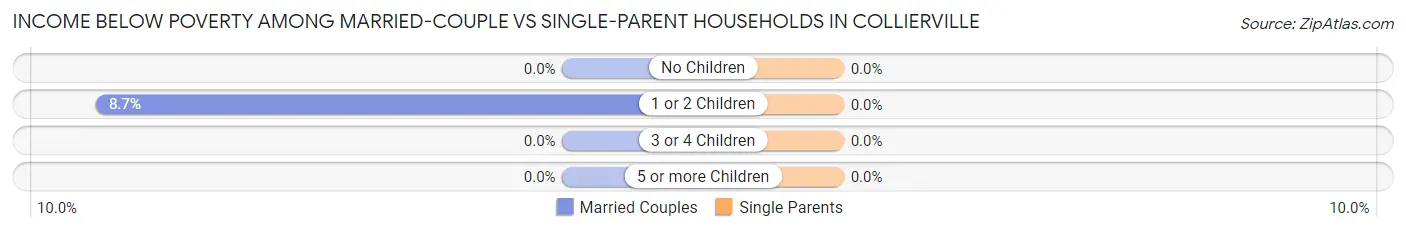
| Children | Married-Couple Families | Single-Parent Households |
| No Children | 0 (0.0%) | 0 (0.0%) |
| 1 or 2 Children | 15 (8.7%) | 0 (0.0%) |
| 3 or 4 Children | 0 (0.0%) | 0 (0.0%) |
| 5 or more Children | 0 (0.0%) | 0 (0.0%) |
| Total | 15 (3.5%) | 0 (0.0%) |
Race in Collierville
The most populous races in Collierville are White / Caucasian (1,659 | 78.8%), Hispanic or Latino (345 | 16.4%), and Two or more Races (227 | 10.8%).
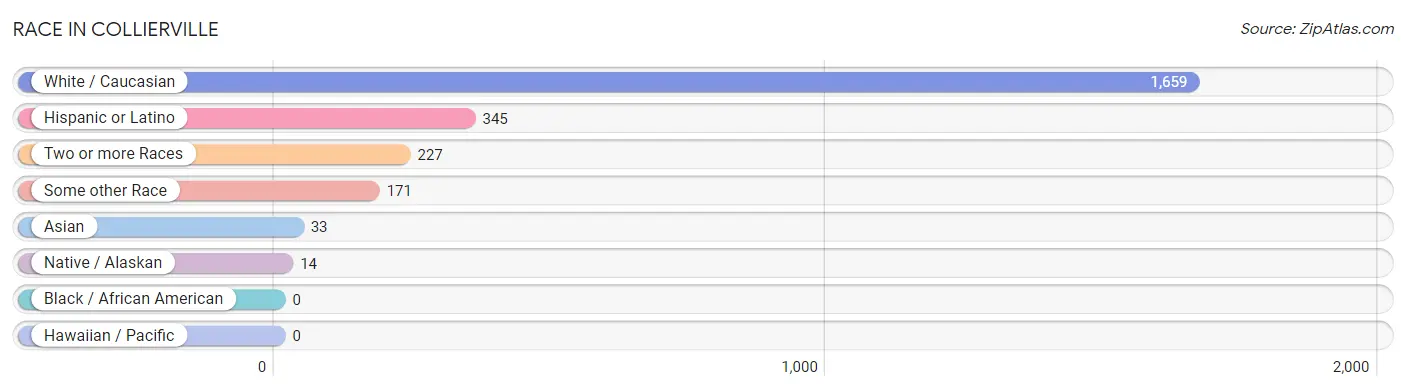
| Race | # Population | % Population |
| Asian | 33 | 1.6% |
| Black / African American | 0 | 0.0% |
| Hawaiian / Pacific | 0 | 0.0% |
| Hispanic or Latino | 345 | 16.4% |
| Native / Alaskan | 14 | 0.7% |
| White / Caucasian | 1,659 | 78.8% |
| Two or more Races | 227 | 10.8% |
| Some other Race | 171 | 8.1% |
| Total | 2,104 | 100.0% |
Ancestry in Collierville
The most populous ancestries reported in Collierville are German (434 | 20.6%), Mexican (331 | 15.7%), Belgian (231 | 11.0%), French (220 | 10.5%), and European (165 | 7.8%), together accounting for 65.6% of all Collierville residents.
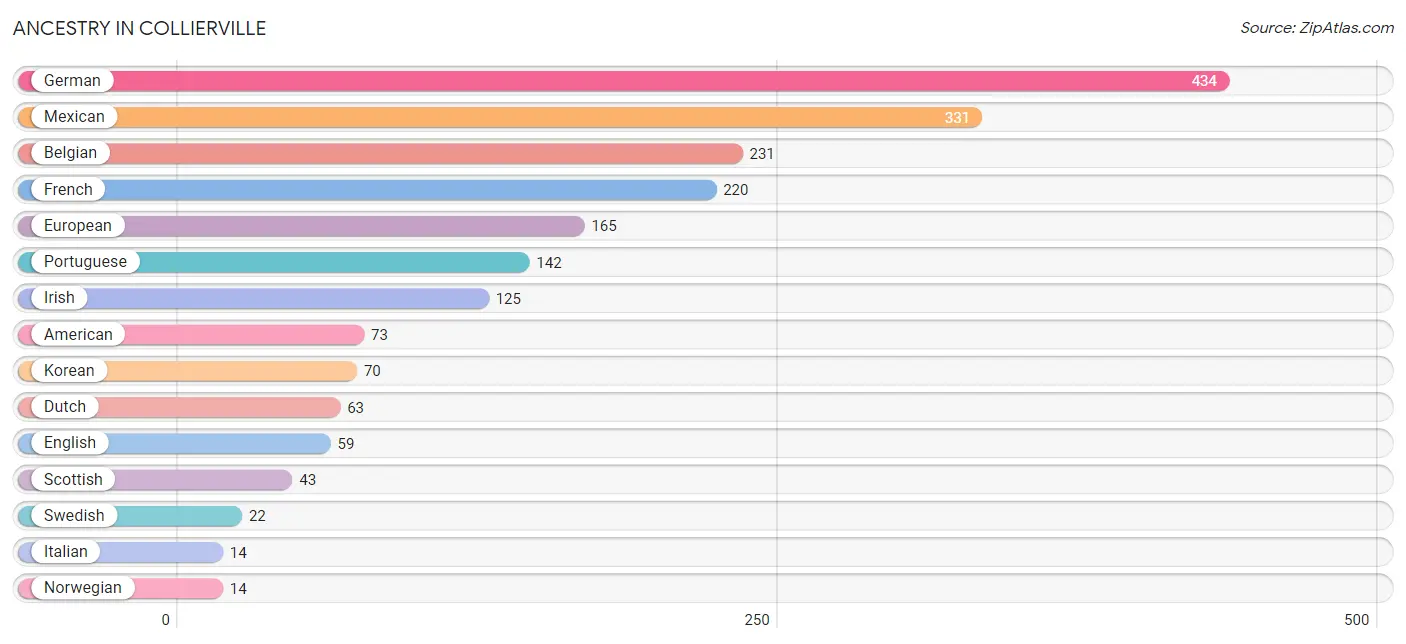
| Ancestry | # Population | % Population |
| American | 73 | 3.5% |
| Belgian | 231 | 11.0% |
| Cherokee | 13 | 0.6% |
| Danish | 5 | 0.2% |
| Dutch | 63 | 3.0% |
| English | 59 | 2.8% |
| European | 165 | 7.8% |
| French | 220 | 10.5% |
| German | 434 | 20.6% |
| Irish | 125 | 5.9% |
| Italian | 14 | 0.7% |
| Korean | 70 | 3.3% |
| Mexican | 331 | 15.7% |
| Norwegian | 14 | 0.7% |
| Portuguese | 142 | 6.8% |
| Romanian | 3 | 0.1% |
| Scottish | 43 | 2.0% |
| Spaniard | 14 | 0.7% |
| Swedish | 22 | 1.1% |
| Welsh | 2 | 0.1% | View All 20 Rows |
Immigrants in Collierville
The most numerous immigrant groups reported in Collierville came from Central America (206 | 9.8%), Latin America (206 | 9.8%), Mexico (206 | 9.8%), Asia (33 | 1.6%), and Philippines (33 | 1.6%), together accounting for 32.5% of all Collierville residents.
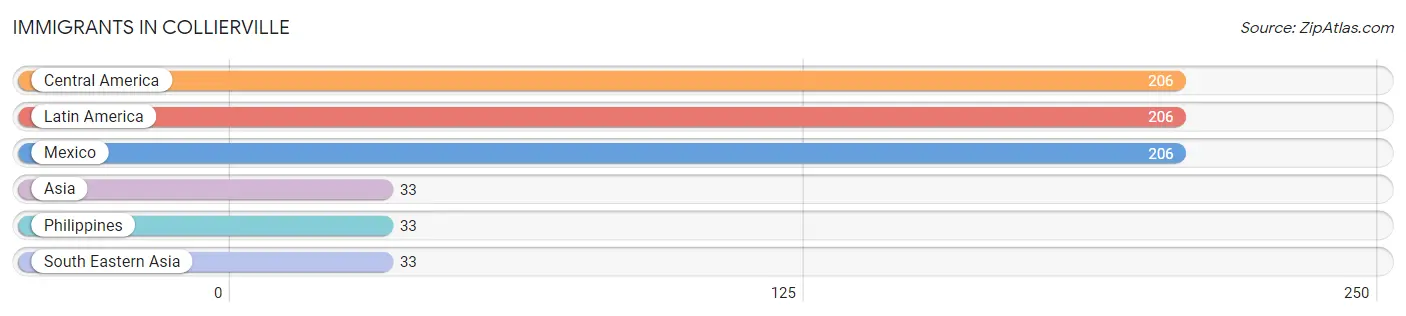
| Immigration Origin | # Population | % Population |
| Asia | 33 | 1.6% |
| Central America | 206 | 9.8% |
| Latin America | 206 | 9.8% |
| Mexico | 206 | 9.8% |
| Philippines | 33 | 1.6% |
| South Eastern Asia | 33 | 1.6% | View All 6 Rows |
Sex and Age in Collierville
Sex and Age in Collierville
The most populous age groups in Collierville are Under 5 Years (193 | 17.3%) for men and 55 to 59 Years (126 | 12.7%) for women.
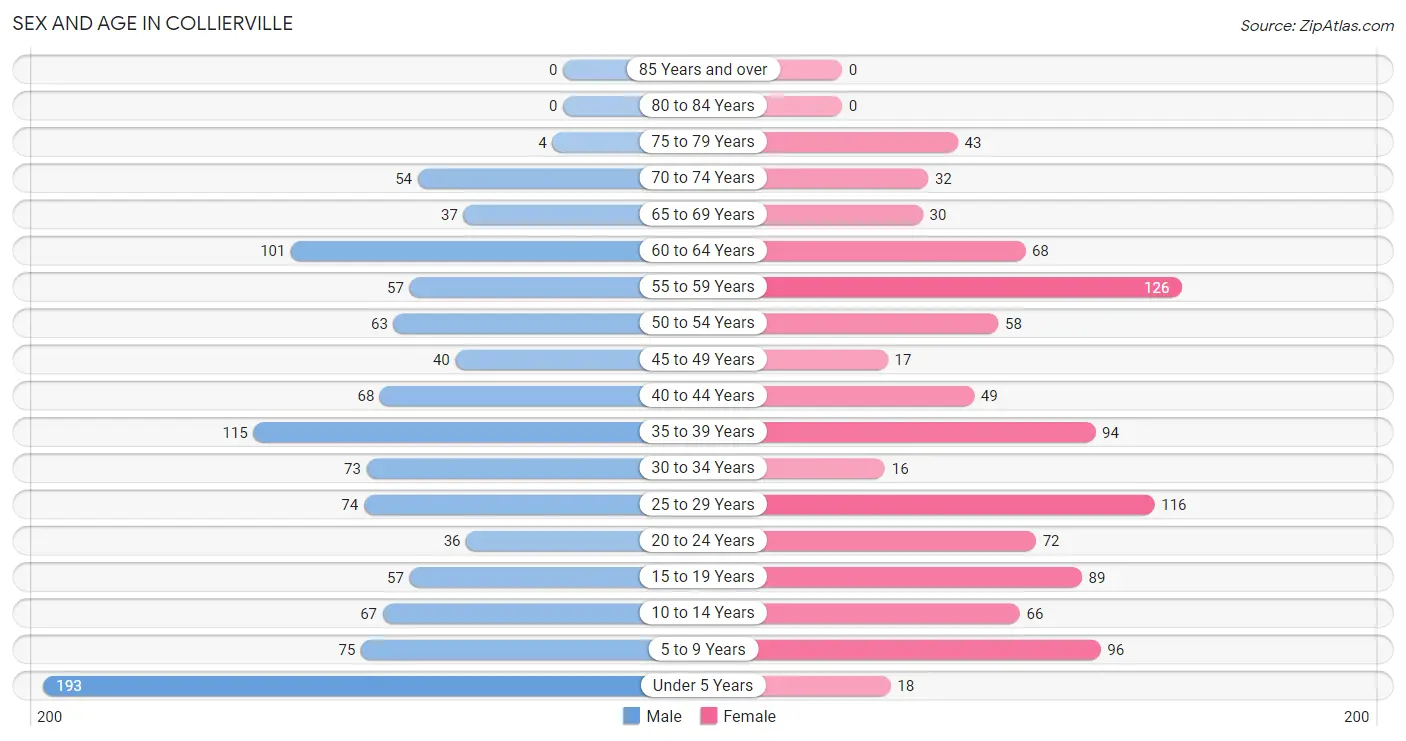
| Age Bracket | Male | Female |
| Under 5 Years | 193 (17.3%) | 18 (1.8%) |
| 5 to 9 Years | 75 (6.7%) | 96 (9.7%) |
| 10 to 14 Years | 67 (6.0%) | 66 (6.7%) |
| 15 to 19 Years | 57 (5.1%) | 89 (9.0%) |
| 20 to 24 Years | 36 (3.2%) | 72 (7.3%) |
| 25 to 29 Years | 74 (6.6%) | 116 (11.7%) |
| 30 to 34 Years | 73 (6.6%) | 16 (1.6%) |
| 35 to 39 Years | 115 (10.3%) | 94 (9.5%) |
| 40 to 44 Years | 68 (6.1%) | 49 (5.0%) |
| 45 to 49 Years | 40 (3.6%) | 17 (1.7%) |
| 50 to 54 Years | 63 (5.7%) | 58 (5.9%) |
| 55 to 59 Years | 57 (5.1%) | 126 (12.7%) |
| 60 to 64 Years | 101 (9.1%) | 68 (6.9%) |
| 65 to 69 Years | 37 (3.3%) | 30 (3.0%) |
| 70 to 74 Years | 54 (4.9%) | 32 (3.2%) |
| 75 to 79 Years | 4 (0.4%) | 43 (4.3%) |
| 80 to 84 Years | 0 (0.0%) | 0 (0.0%) |
| 85 Years and over | 0 (0.0%) | 0 (0.0%) |
| Total | 1,114 (100.0%) | 990 (100.0%) |
Families and Households in Collierville
Median Family Size in Collierville
The median family size in Collierville is 3.71 persons per family, with single female/mother families (46 | 8.8%) accounting for the largest median family size of 5.02 persons per family. On the other hand, single male/father families (47 | 9.0%) represent the smallest median family size with 3.04 persons per family.
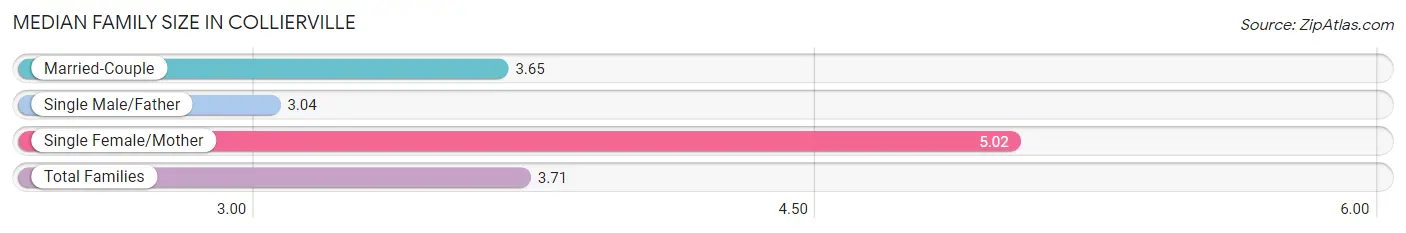
| Family Type | # Families | Family Size |
| Married-Couple | 428 (82.2%) | 3.65 |
| Single Male/Father | 47 (9.0%) | 3.04 |
| Single Female/Mother | 46 (8.8%) | 5.02 |
| Total Families | 521 (100.0%) | 3.71 |
Median Household Size in Collierville
The median household size in Collierville is 3.21 persons per household, with single female/mother households (46 | 7.0%) accounting for the largest median household size of 5.02 persons per household. non-family households (135 | 20.6%) represent the smallest median household size with 1.25 persons per household.
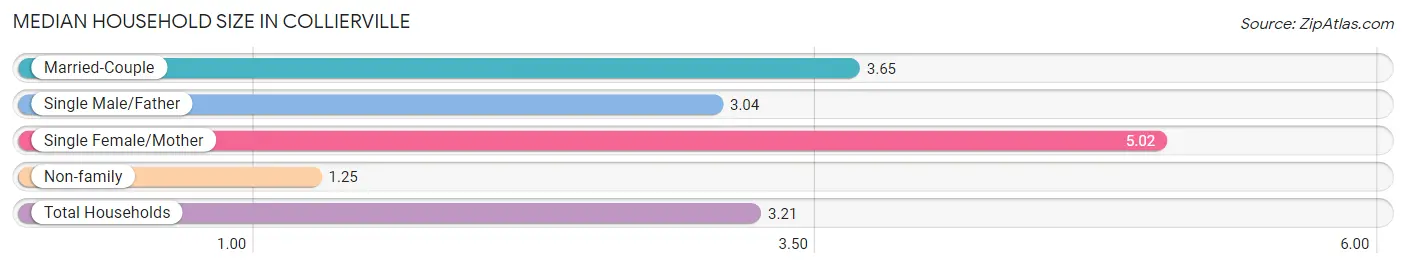
| Household Type | # Households | Household Size |
| Married-Couple | 428 (65.2%) | 3.65 |
| Single Male/Father | 47 (7.2%) | 3.04 |
| Single Female/Mother | 46 (7.0%) | 5.02 |
| Non-family | 135 (20.6%) | 1.25 |
| Total Households | 656 (100.0%) | 3.21 |
Household Size by Marriage Status in Collierville
Out of a total of 656 households in Collierville, 521 (79.4%) are family households, while 135 (20.6%) are nonfamily households. The most numerous type of family households are 3-person households, comprising 188, and the most common type of nonfamily households are 1-person households, comprising 103.
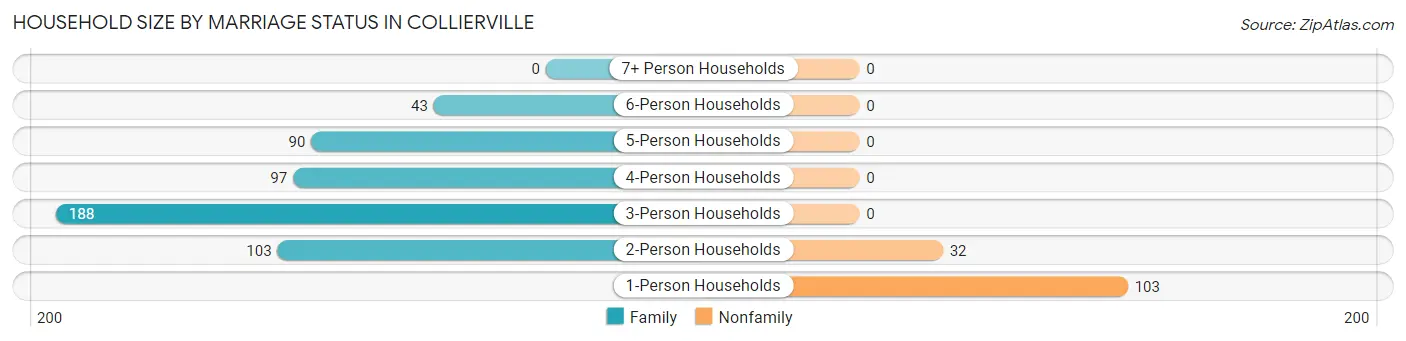
| Household Size | Family Households | Nonfamily Households |
| 1-Person Households | - | 103 (15.7%) |
| 2-Person Households | 103 (15.7%) | 32 (4.9%) |
| 3-Person Households | 188 (28.7%) | 0 (0.0%) |
| 4-Person Households | 97 (14.8%) | 0 (0.0%) |
| 5-Person Households | 90 (13.7%) | 0 (0.0%) |
| 6-Person Households | 43 (6.6%) | 0 (0.0%) |
| 7+ Person Households | 0 (0.0%) | 0 (0.0%) |
| Total | 521 (79.4%) | 135 (20.6%) |
Female Fertility in Collierville
Fertility by Age in Collierville
Average fertility rate in Collierville is 93.0 births per 1,000 women. Women in the age bracket of 20 to 34 years have the highest fertility rate with 225.0 births per 1,000 women. Women in the age bracket of 20 to 34 years acount for 100.0% of all women with births.
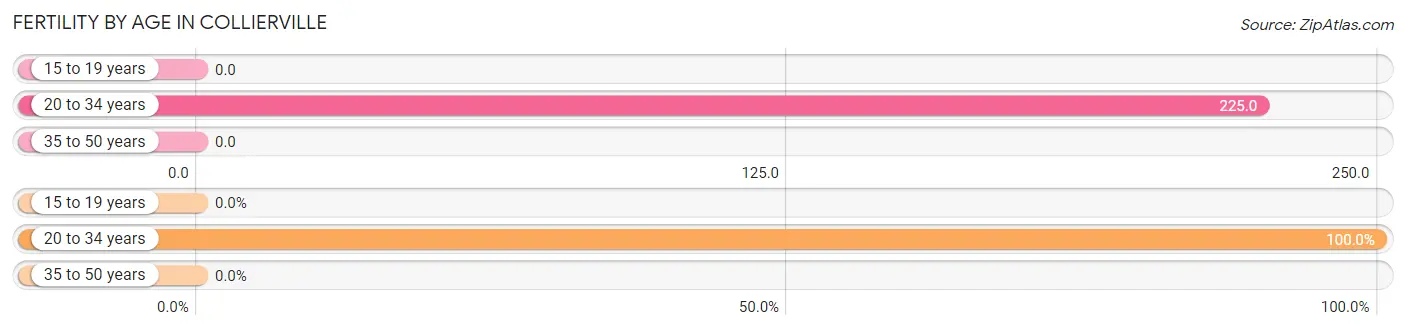
| Age Bracket | Women with Births | Births / 1,000 Women |
| 15 to 19 years | 0 (0.0%) | 0.0 |
| 20 to 34 years | 46 (100.0%) | 225.0 |
| 35 to 50 years | 0 (0.0%) | 0.0 |
| Total | 46 (100.0%) | 93.0 |
Fertility by Age by Marriage Status in Collierville
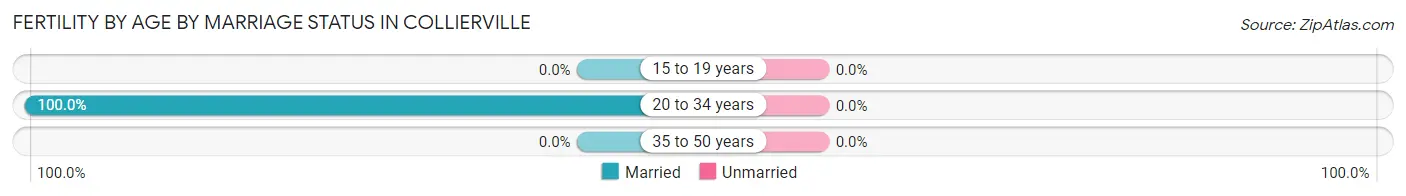
| Age Bracket | Married | Unmarried |
| 15 to 19 years | 0 (0.0%) | 0 (0.0%) |
| 20 to 34 years | 46 (100.0%) | 0 (0.0%) |
| 35 to 50 years | 0 (0.0%) | 0 (0.0%) |
| Total | 46 (100.0%) | 0 (0.0%) |
Fertility by Education in Collierville
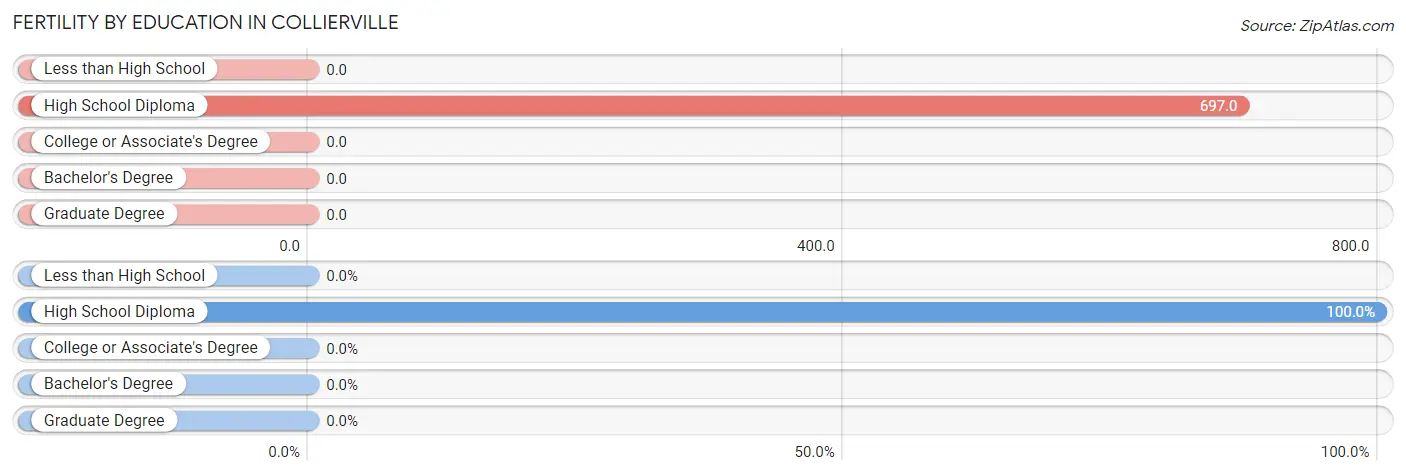
| Educational Attainment | Women with Births | Births / 1,000 Women |
| Less than High School | 0 (0.0%) | 0.0 |
| High School Diploma | 46 (100.0%) | 697.0 |
| College or Associate's Degree | 0 (0.0%) | 0.0 |
| Bachelor's Degree | 0 (0.0%) | 0.0 |
| Graduate Degree | 0 (0.0%) | 0.0 |
| Total | 46 (100.0%) | 93.0 |
Fertility by Education by Marriage Status in Collierville
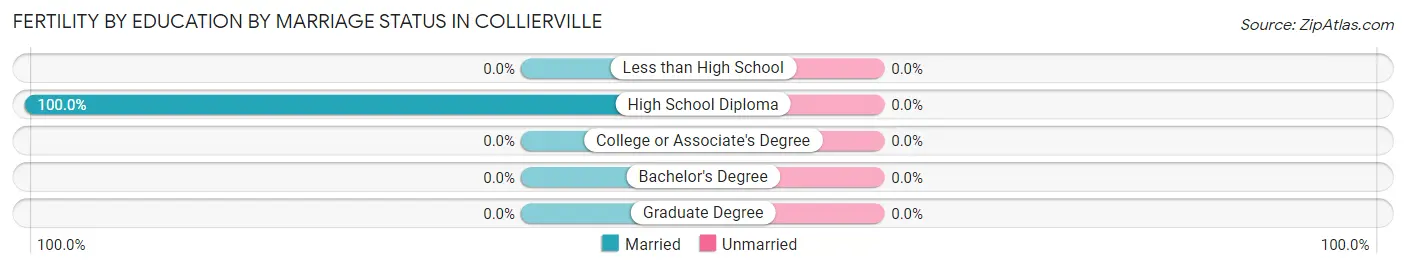
| Educational Attainment | Married | Unmarried |
| Less than High School | 0 (0.0%) | 0 (0.0%) |
| High School Diploma | 46 (100.0%) | 0 (0.0%) |
| College or Associate's Degree | 0 (0.0%) | 0 (0.0%) |
| Bachelor's Degree | 0 (0.0%) | 0 (0.0%) |
| Graduate Degree | 0 (0.0%) | 0 (0.0%) |
| Total | 46 (100.0%) | 0 (0.0%) |
Employment Characteristics in Collierville
Employment by Class of Employer in Collierville
Among the 896 employed individuals in Collierville, private company employees (534 | 59.6%), self-employed (not incorporated) (177 | 19.8%), and state government employees (54 | 6.0%) make up the most common classes of employment.
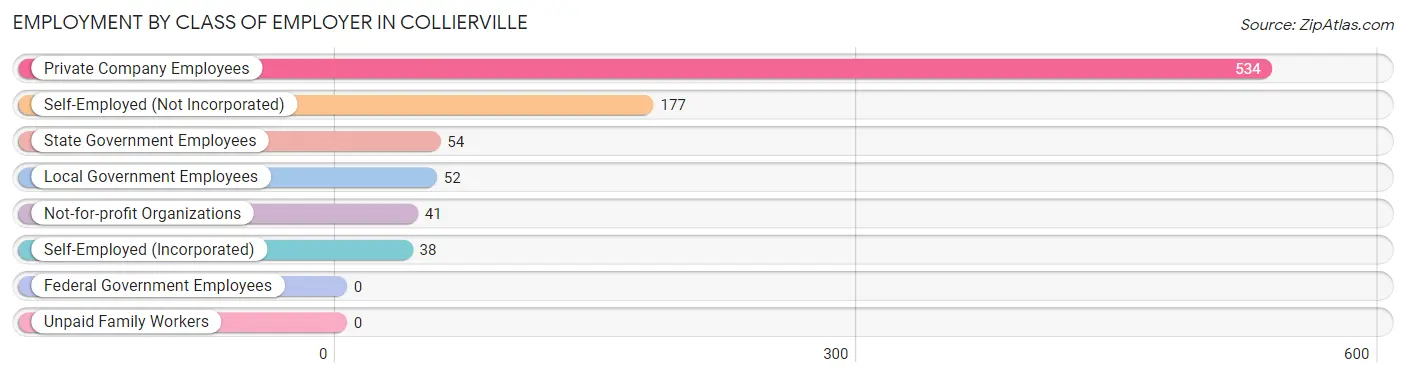
| Employer Class | # Employees | % Employees |
| Private Company Employees | 534 | 59.6% |
| Self-Employed (Incorporated) | 38 | 4.2% |
| Self-Employed (Not Incorporated) | 177 | 19.8% |
| Not-for-profit Organizations | 41 | 4.6% |
| Local Government Employees | 52 | 5.8% |
| State Government Employees | 54 | 6.0% |
| Federal Government Employees | 0 | 0.0% |
| Unpaid Family Workers | 0 | 0.0% |
| Total | 896 | 100.0% |
Employment Status by Age in Collierville
According to the labor force statistics for Collierville, out of the total population over 16 years of age (1,549), 73.1% or 1,132 individuals are in the labor force, with 5.1% or 58 of them unemployed. The age group with the highest labor force participation rate is 35 to 44 years, with 94.5% or 308 individuals in the labor force. Within the labor force, the 30 to 34 years age range has the highest percentage of unemployed individuals, with 17.8% or 13 of them being unemployed.
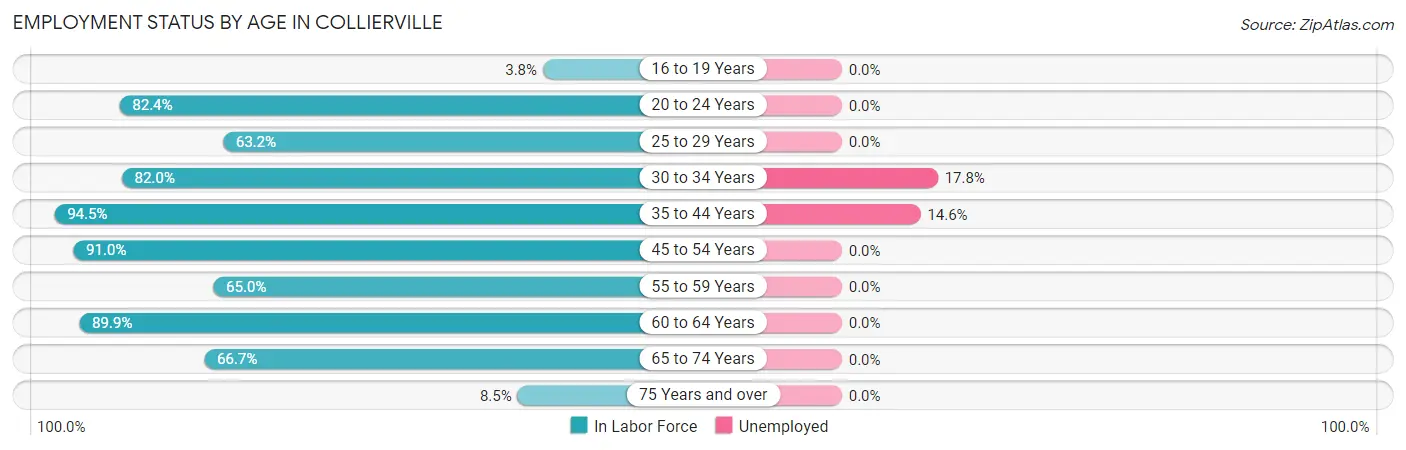
| Age Bracket | In Labor Force | Unemployed |
| 16 to 19 Years | 4 (3.8%) | 0 (0.0%) |
| 20 to 24 Years | 89 (82.4%) | 0 (0.0%) |
| 25 to 29 Years | 120 (63.2%) | 0 (0.0%) |
| 30 to 34 Years | 73 (82.0%) | 13 (17.8%) |
| 35 to 44 Years | 308 (94.5%) | 45 (14.6%) |
| 45 to 54 Years | 162 (91.0%) | 0 (0.0%) |
| 55 to 59 Years | 119 (65.0%) | 0 (0.0%) |
| 60 to 64 Years | 152 (89.9%) | 0 (0.0%) |
| 65 to 74 Years | 102 (66.7%) | 0 (0.0%) |
| 75 Years and over | 4 (8.5%) | 0 (0.0%) |
| Total | 1,132 (73.1%) | 58 (5.1%) |
Employment Status by Educational Attainment in Collierville
According to labor force statistics for Collierville, 82.3% of individuals (934) out of the total population between 25 and 64 years of age (1,135) are in the labor force, with 6.2% or 58 of them being unemployed. The group with the highest labor force participation rate are those with the educational attainment of bachelor's degree or higher, with 95.0% or 303 individuals in the labor force. Within the labor force, individuals with college / associate degree education have the highest percentage of unemployment, with 12.0% or 30 of them being unemployed.
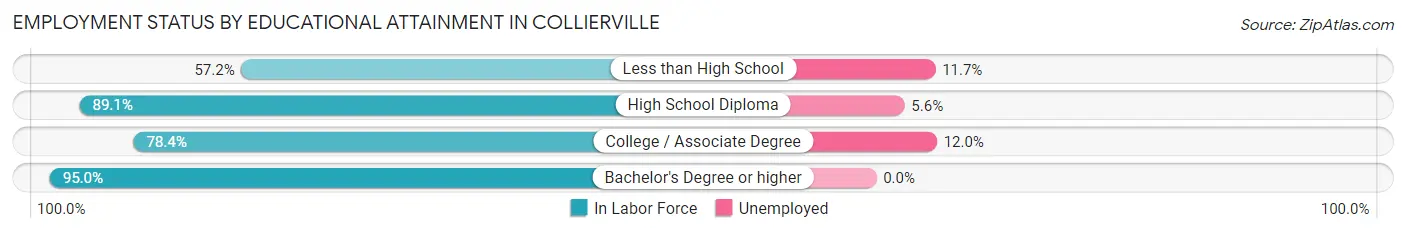
| Educational Attainment | In Labor Force | Unemployed |
| Less than High School | 111 (57.2%) | 23 (11.7%) |
| High School Diploma | 270 (89.1%) | 17 (5.6%) |
| College / Associate Degree | 250 (78.4%) | 38 (12.0%) |
| Bachelor's Degree or higher | 303 (95.0%) | 0 (0.0%) |
| Total | 934 (82.3%) | 70 (6.2%) |
Employment Occupations by Sex in Collierville
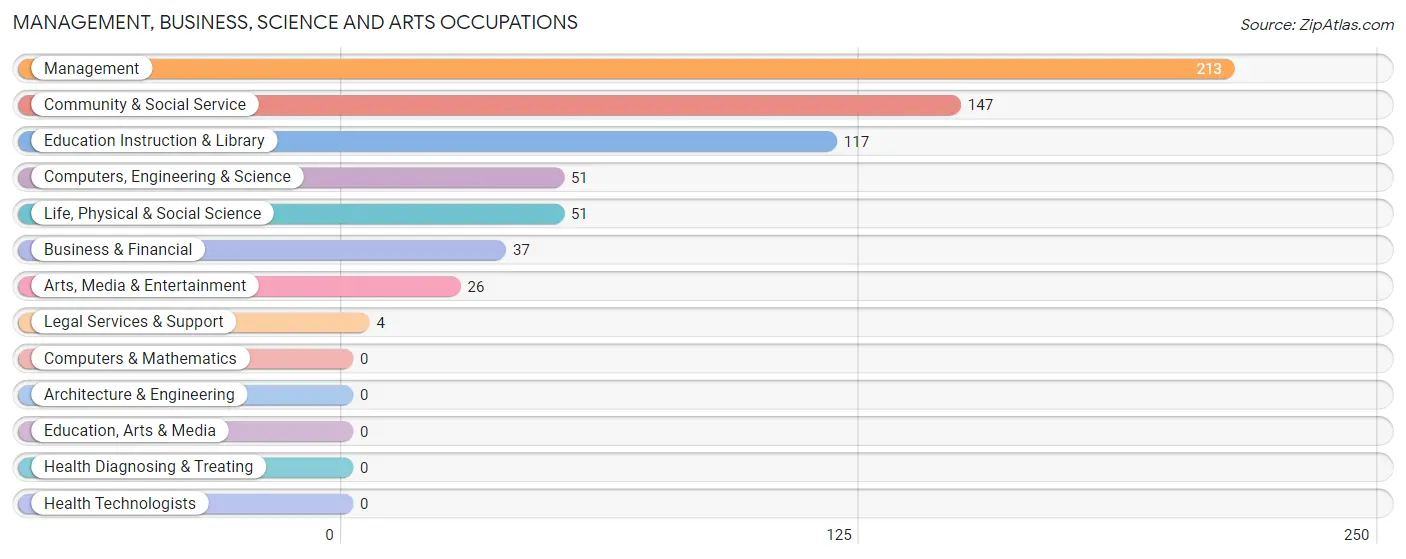
Management, Business, Science and Arts Occupations
The most common Management, Business, Science and Arts occupations in Collierville are Management (213 | 19.8%), Community & Social Service (147 | 13.7%), Education Instruction & Library (117 | 10.9%), Computers, Engineering & Science (51 | 4.7%), and Life, Physical & Social Science (51 | 4.7%).
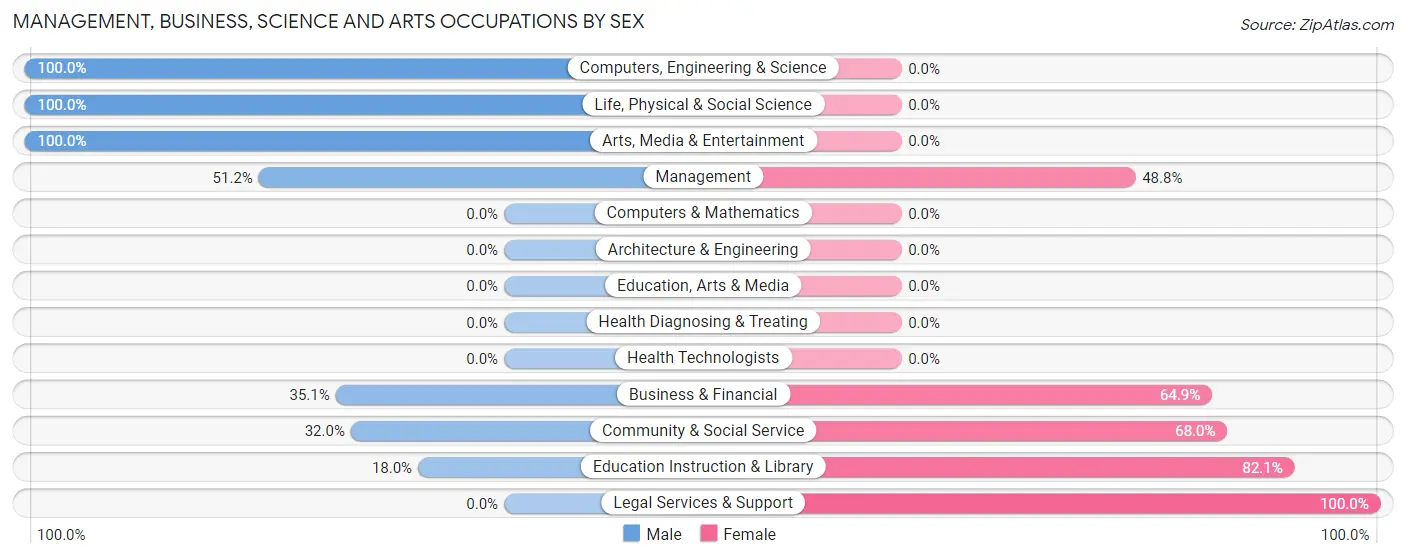
Management, Business, Science and Arts Occupations by Sex
Within the Management, Business, Science and Arts occupations in Collierville, the most male-oriented occupations are Computers, Engineering & Science (100.0%), Life, Physical & Social Science (100.0%), and Arts, Media & Entertainment (100.0%), while the most female-oriented occupations are Legal Services & Support (100.0%), Education Instruction & Library (82.1%), and Community & Social Service (68.0%).
| Occupation | Male | Female |
| Management | 109 (51.2%) | 104 (48.8%) |
| Business & Financial | 13 (35.1%) | 24 (64.9%) |
| Computers, Engineering & Science | 51 (100.0%) | 0 (0.0%) |
| Computers & Mathematics | 0 (0.0%) | 0 (0.0%) |
| Architecture & Engineering | 0 (0.0%) | 0 (0.0%) |
| Life, Physical & Social Science | 51 (100.0%) | 0 (0.0%) |
| Community & Social Service | 47 (32.0%) | 100 (68.0%) |
| Education, Arts & Media | 0 (0.0%) | 0 (0.0%) |
| Legal Services & Support | 0 (0.0%) | 4 (100.0%) |
| Education Instruction & Library | 21 (17.9%) | 96 (82.1%) |
| Arts, Media & Entertainment | 26 (100.0%) | 0 (0.0%) |
| Health Diagnosing & Treating | 0 (0.0%) | 0 (0.0%) |
| Health Technologists | 0 (0.0%) | 0 (0.0%) |
| Total (Category) | 220 (49.1%) | 228 (50.9%) |
| Total (Overall) | 623 (58.0%) | 452 (42.0%) |
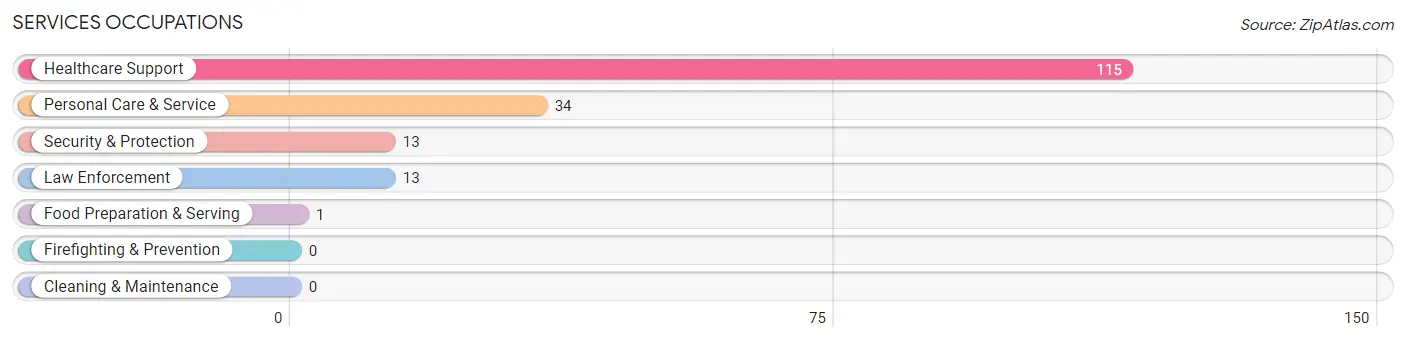
Services Occupations
The most common Services occupations in Collierville are Healthcare Support (115 | 10.7%), Personal Care & Service (34 | 3.2%), Security & Protection (13 | 1.2%), Law Enforcement (13 | 1.2%), and Food Preparation & Serving (1 | 0.1%).
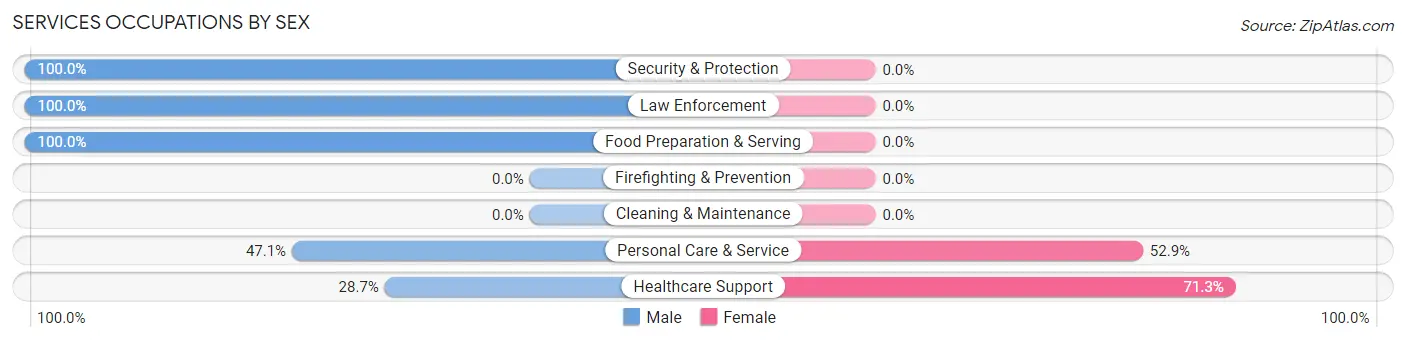
Services Occupations by Sex
Within the Services occupations in Collierville, the most male-oriented occupations are Security & Protection (100.0%), Law Enforcement (100.0%), and Food Preparation & Serving (100.0%), while the most female-oriented occupations are Healthcare Support (71.3%), and Personal Care & Service (52.9%).
| Occupation | Male | Female |
| Healthcare Support | 33 (28.7%) | 82 (71.3%) |
| Security & Protection | 13 (100.0%) | 0 (0.0%) |
| Firefighting & Prevention | 0 (0.0%) | 0 (0.0%) |
| Law Enforcement | 13 (100.0%) | 0 (0.0%) |
| Food Preparation & Serving | 1 (100.0%) | 0 (0.0%) |
| Cleaning & Maintenance | 0 (0.0%) | 0 (0.0%) |
| Personal Care & Service | 16 (47.1%) | 18 (52.9%) |
| Total (Category) | 63 (38.7%) | 100 (61.4%) |
| Total (Overall) | 623 (58.0%) | 452 (42.0%) |
Sales and Office Occupations
The most common Sales and Office occupations in Collierville are Sales & Related (76 | 7.1%), and Office & Administration (48 | 4.5%).
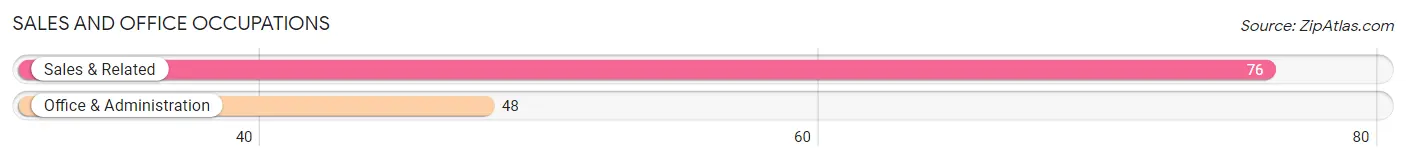
Sales and Office Occupations by Sex

| Occupation | Male | Female |
| Sales & Related | 59 (77.6%) | 17 (22.4%) |
| Office & Administration | 0 (0.0%) | 48 (100.0%) |
| Total (Category) | 59 (47.6%) | 65 (52.4%) |
| Total (Overall) | 623 (58.0%) | 452 (42.0%) |
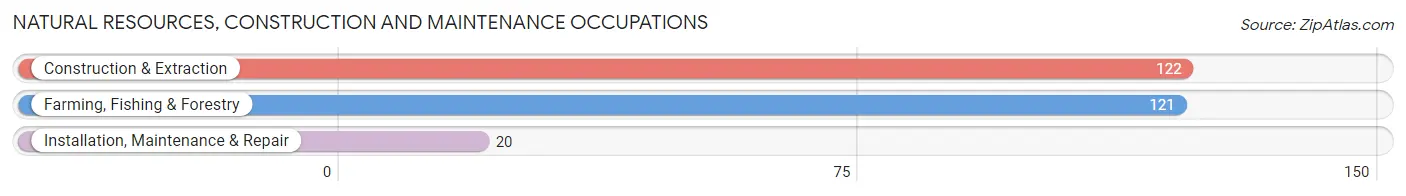
Natural Resources, Construction and Maintenance Occupations
The most common Natural Resources, Construction and Maintenance occupations in Collierville are Construction & Extraction (122 | 11.4%), Farming, Fishing & Forestry (121 | 11.3%), and Installation, Maintenance & Repair (20 | 1.9%).
Natural Resources, Construction and Maintenance Occupations by Sex
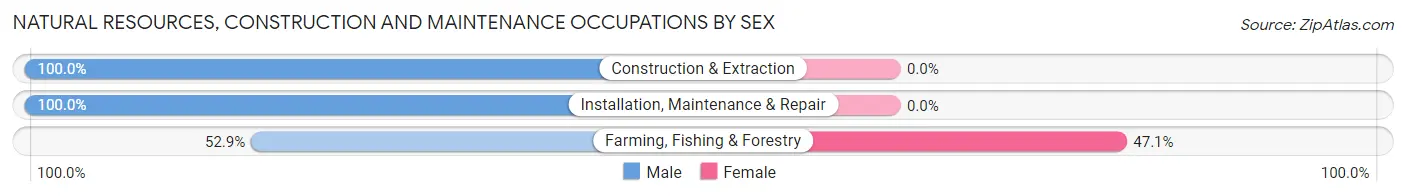
| Occupation | Male | Female |
| Farming, Fishing & Forestry | 64 (52.9%) | 57 (47.1%) |
| Construction & Extraction | 122 (100.0%) | 0 (0.0%) |
| Installation, Maintenance & Repair | 20 (100.0%) | 0 (0.0%) |
| Total (Category) | 206 (78.3%) | 57 (21.7%) |
| Total (Overall) | 623 (58.0%) | 452 (42.0%) |
Production, Transportation and Moving Occupations
The most common Production, Transportation and Moving occupations in Collierville are Material Moving (47 | 4.4%), Transportation (26 | 2.4%), and Production (4 | 0.4%).
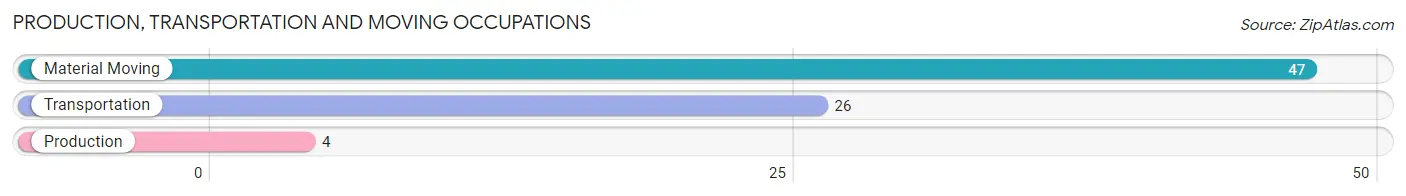
Production, Transportation and Moving Occupations by Sex
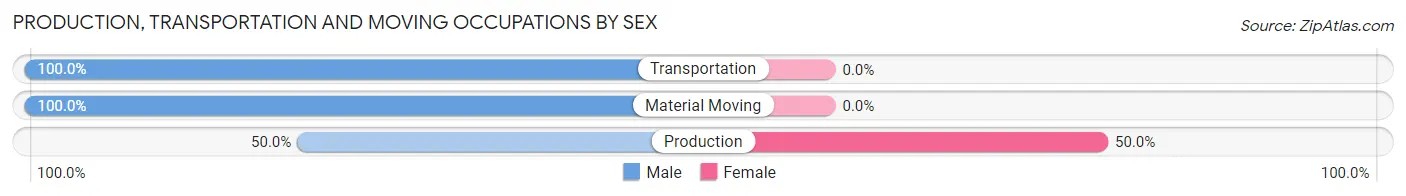
| Occupation | Male | Female |
| Production | 2 (50.0%) | 2 (50.0%) |
| Transportation | 26 (100.0%) | 0 (0.0%) |
| Material Moving | 47 (100.0%) | 0 (0.0%) |
| Total (Category) | 75 (97.4%) | 2 (2.6%) |
| Total (Overall) | 623 (58.0%) | 452 (42.0%) |
Employment Industries by Sex in Collierville
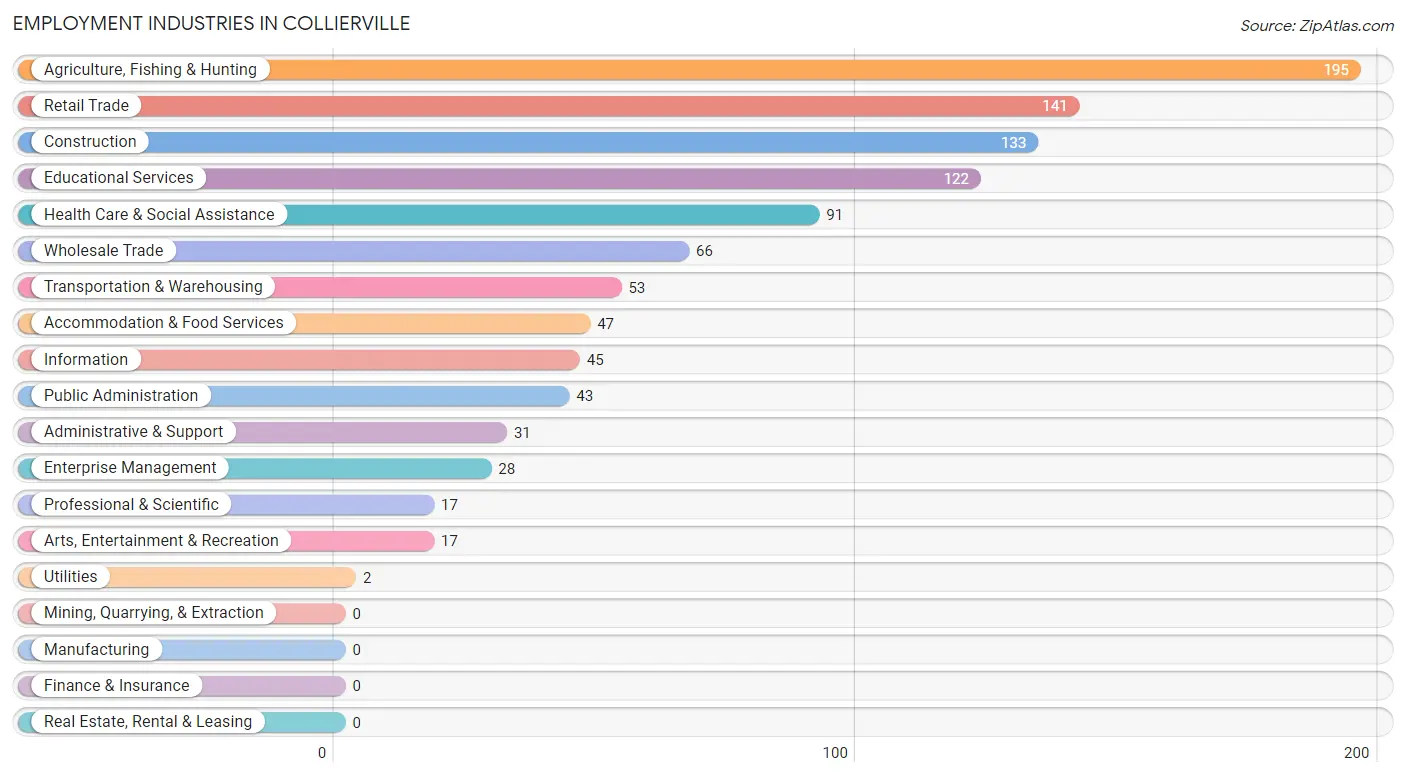
Employment Industries in Collierville
The major employment industries in Collierville include Agriculture, Fishing & Hunting (195 | 18.1%), Retail Trade (141 | 13.1%), Construction (133 | 12.4%), Educational Services (122 | 11.4%), and Health Care & Social Assistance (91 | 8.5%).
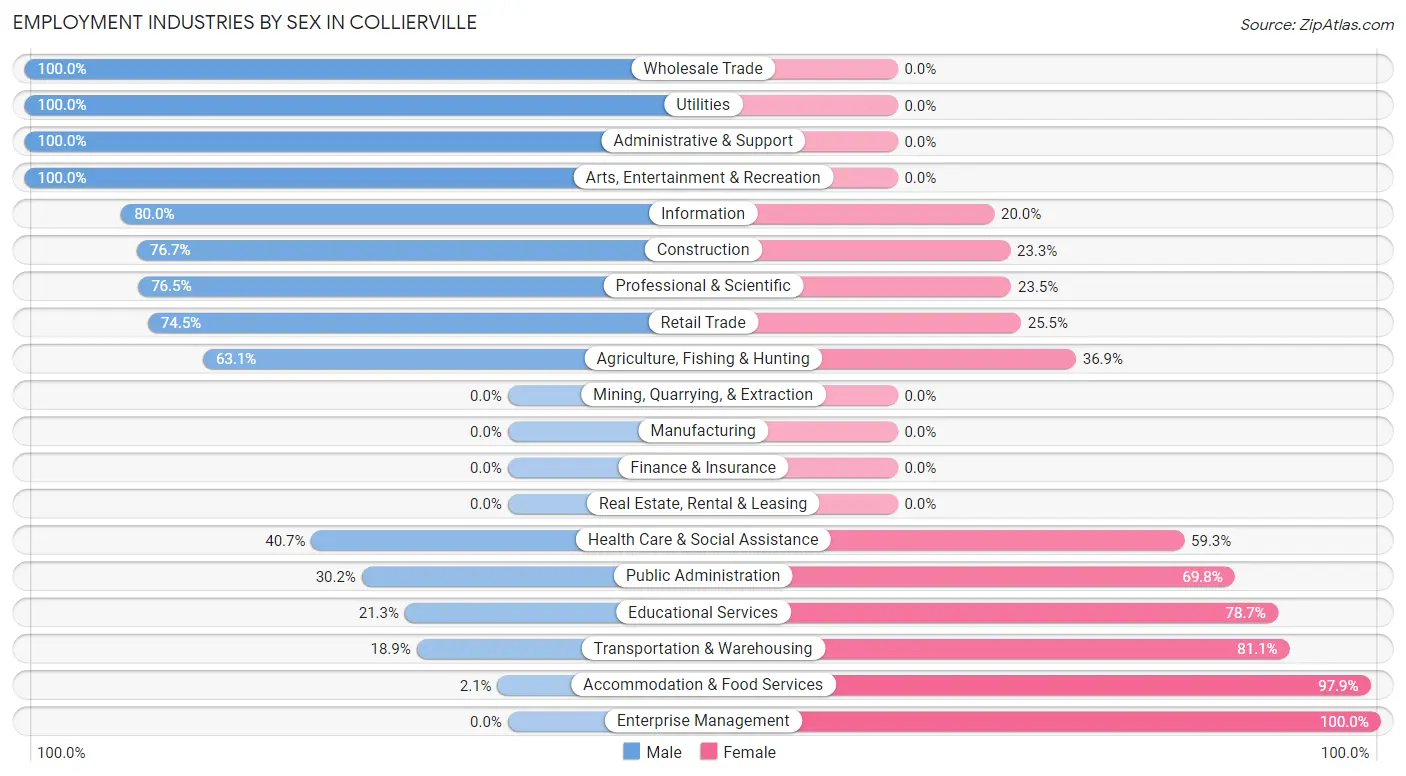
Employment Industries by Sex in Collierville
The Collierville industries that see more men than women are Wholesale Trade (100.0%), Utilities (100.0%), and Administrative & Support (100.0%), whereas the industries that tend to have a higher number of women are Enterprise Management (100.0%), Accommodation & Food Services (97.9%), and Transportation & Warehousing (81.1%).
| Industry | Male | Female |
| Agriculture, Fishing & Hunting | 123 (63.1%) | 72 (36.9%) |
| Mining, Quarrying, & Extraction | 0 (0.0%) | 0 (0.0%) |
| Construction | 102 (76.7%) | 31 (23.3%) |
| Manufacturing | 0 (0.0%) | 0 (0.0%) |
| Wholesale Trade | 66 (100.0%) | 0 (0.0%) |
| Retail Trade | 105 (74.5%) | 36 (25.5%) |
| Transportation & Warehousing | 10 (18.9%) | 43 (81.1%) |
| Utilities | 2 (100.0%) | 0 (0.0%) |
| Information | 36 (80.0%) | 9 (20.0%) |
| Finance & Insurance | 0 (0.0%) | 0 (0.0%) |
| Real Estate, Rental & Leasing | 0 (0.0%) | 0 (0.0%) |
| Professional & Scientific | 13 (76.5%) | 4 (23.5%) |
| Enterprise Management | 0 (0.0%) | 28 (100.0%) |
| Administrative & Support | 31 (100.0%) | 0 (0.0%) |
| Educational Services | 26 (21.3%) | 96 (78.7%) |
| Health Care & Social Assistance | 37 (40.7%) | 54 (59.3%) |
| Arts, Entertainment & Recreation | 17 (100.0%) | 0 (0.0%) |
| Accommodation & Food Services | 1 (2.1%) | 46 (97.9%) |
| Public Administration | 13 (30.2%) | 30 (69.8%) |
| Total | 623 (58.0%) | 452 (42.0%) |
Education in Collierville
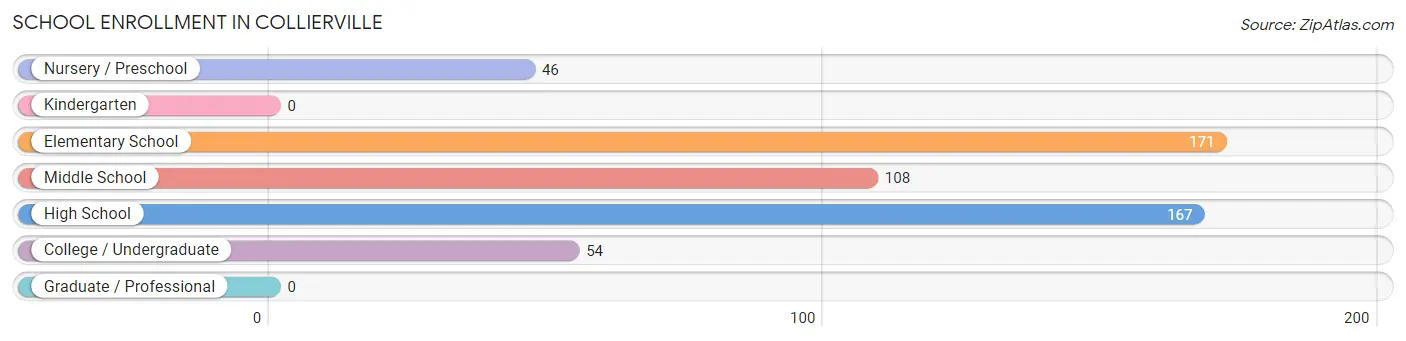
School Enrollment in Collierville
The most common levels of schooling among the 546 students in Collierville are elementary school (171 | 31.3%), high school (167 | 30.6%), and middle school (108 | 19.8%).
| School Level | # Students | % Students |
| Nursery / Preschool | 46 | 8.4% |
| Kindergarten | 0 | 0.0% |
| Elementary School | 171 | 31.3% |
| Middle School | 108 | 19.8% |
| High School | 167 | 30.6% |
| College / Undergraduate | 54 | 9.9% |
| Graduate / Professional | 0 | 0.0% |
| Total | 546 | 100.0% |
School Enrollment by Age by Funding Source in Collierville
Out of a total of 546 students who are enrolled in schools in Collierville, 133 (24.4%) attend a private institution, while the remaining 413 (75.6%) are enrolled in public schools. The age group of 3 to 4 year olds has the highest likelihood of being enrolled in private schools, with 46 (100.0% in the age bracket) enrolled. Conversely, the age group of 10 to 14 year olds has the lowest likelihood of being enrolled in a private school, with 133 (100.0% in the age bracket) attending a public institution.
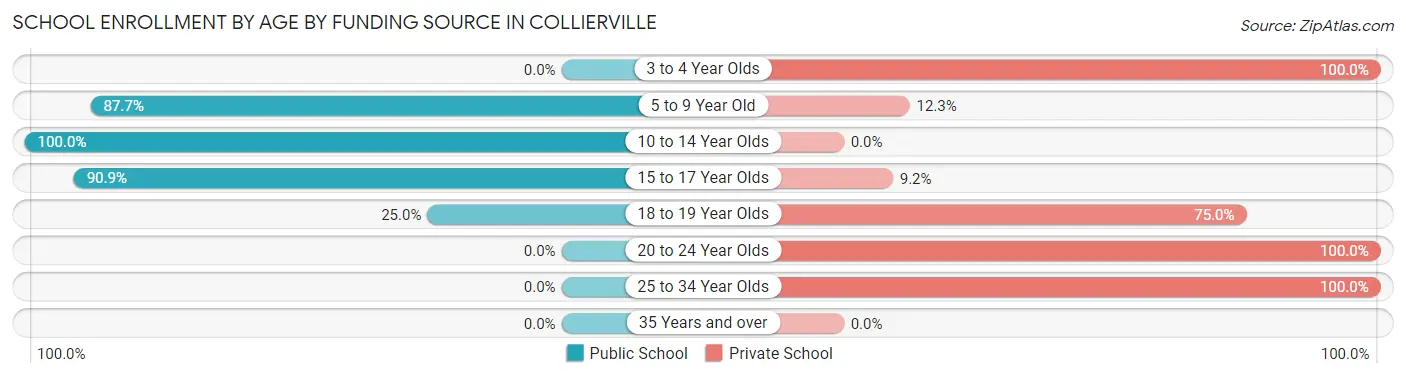
| Age Bracket | Public School | Private School |
| 3 to 4 Year Olds | 0 (0.0%) | 46 (100.0%) |
| 5 to 9 Year Old | 150 (87.7%) | 21 (12.3%) |
| 10 to 14 Year Olds | 133 (100.0%) | 0 (0.0%) |
| 15 to 17 Year Olds | 129 (90.8%) | 13 (9.1%) |
| 18 to 19 Year Olds | 1 (25.0%) | 3 (75.0%) |
| 20 to 24 Year Olds | 0 (0.0%) | 17 (100.0%) |
| 25 to 34 Year Olds | 0 (0.0%) | 33 (100.0%) |
| 35 Years and over | 0 (0.0%) | 0 (0.0%) |
| Total | 413 (75.6%) | 133 (24.4%) |
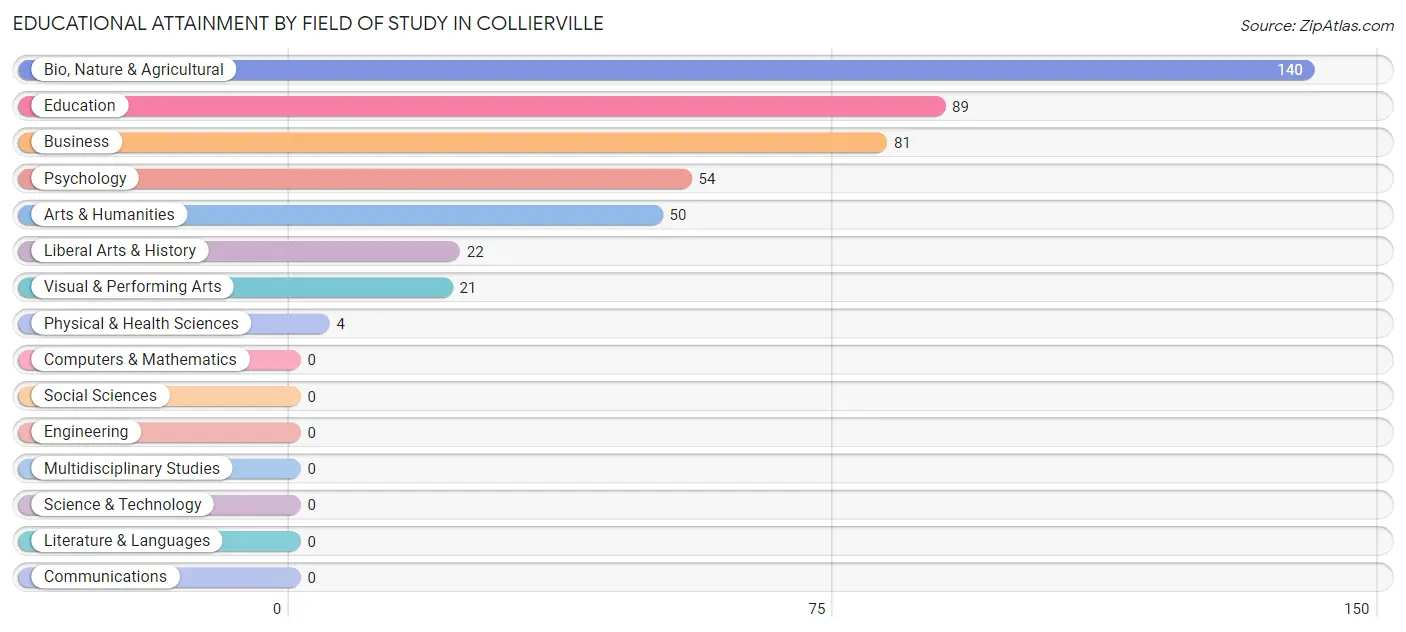
Educational Attainment by Field of Study in Collierville
Bio, nature & agricultural (140 | 30.4%), education (89 | 19.3%), business (81 | 17.6%), psychology (54 | 11.7%), and arts & humanities (50 | 10.8%) are the most common fields of study among 461 individuals in Collierville who have obtained a bachelor's degree or higher.
| Field of Study | # Graduates | % Graduates |
| Computers & Mathematics | 0 | 0.0% |
| Bio, Nature & Agricultural | 140 | 30.4% |
| Physical & Health Sciences | 4 | 0.9% |
| Psychology | 54 | 11.7% |
| Social Sciences | 0 | 0.0% |
| Engineering | 0 | 0.0% |
| Multidisciplinary Studies | 0 | 0.0% |
| Science & Technology | 0 | 0.0% |
| Business | 81 | 17.6% |
| Education | 89 | 19.3% |
| Literature & Languages | 0 | 0.0% |
| Liberal Arts & History | 22 | 4.8% |
| Visual & Performing Arts | 21 | 4.6% |
| Communications | 0 | 0.0% |
| Arts & Humanities | 50 | 10.8% |
| Total | 461 | 100.0% |
Transportation & Commute in Collierville
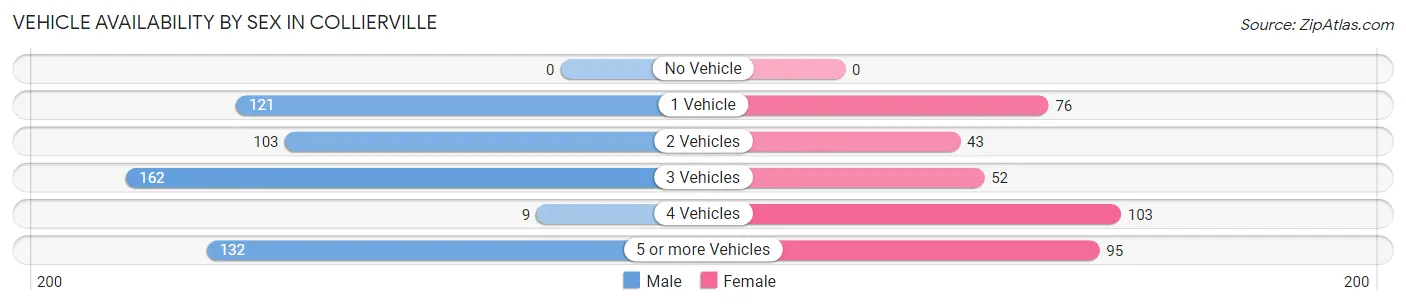
Vehicle Availability by Sex in Collierville
The most prevalent vehicle ownership categories in Collierville are males with 3 vehicles (162, accounting for 30.7%) and females with 3 vehicles (52, making up 43.9%).
| Vehicles Available | Male | Female |
| No Vehicle | 0 (0.0%) | 0 (0.0%) |
| 1 Vehicle | 121 (23.0%) | 76 (20.6%) |
| 2 Vehicles | 103 (19.5%) | 43 (11.7%) |
| 3 Vehicles | 162 (30.7%) | 52 (14.1%) |
| 4 Vehicles | 9 (1.7%) | 103 (27.9%) |
| 5 or more Vehicles | 132 (25.1%) | 95 (25.8%) |
| Total | 527 (100.0%) | 369 (100.0%) |
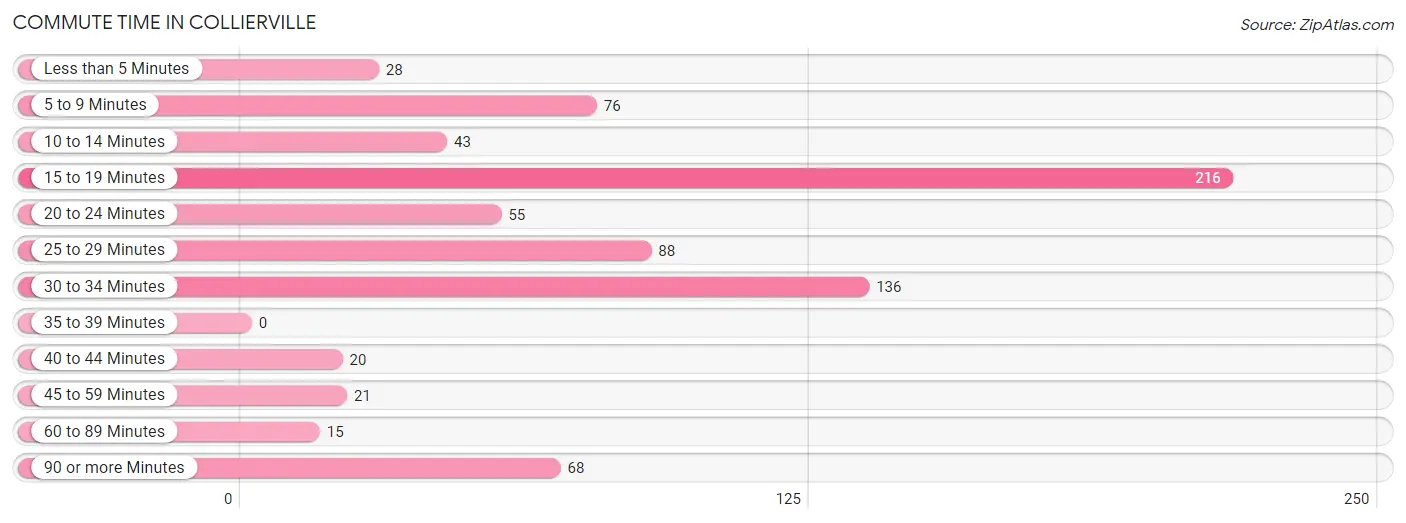
Commute Time in Collierville
The most frequently occuring commute durations in Collierville are 15 to 19 minutes (216 commuters, 28.2%), 30 to 34 minutes (136 commuters, 17.7%), and 25 to 29 minutes (88 commuters, 11.5%).
| Commute Time | # Commuters | % Commuters |
| Less than 5 Minutes | 28 | 3.7% |
| 5 to 9 Minutes | 76 | 9.9% |
| 10 to 14 Minutes | 43 | 5.6% |
| 15 to 19 Minutes | 216 | 28.2% |
| 20 to 24 Minutes | 55 | 7.2% |
| 25 to 29 Minutes | 88 | 11.5% |
| 30 to 34 Minutes | 136 | 17.7% |
| 35 to 39 Minutes | 0 | 0.0% |
| 40 to 44 Minutes | 20 | 2.6% |
| 45 to 59 Minutes | 21 | 2.7% |
| 60 to 89 Minutes | 15 | 2.0% |
| 90 or more Minutes | 68 | 8.9% |
Commute Time by Sex in Collierville
The most common commute times in Collierville are 15 to 19 minutes (107 commuters, 23.8%) for males and 15 to 19 minutes (109 commuters, 34.4%) for females.
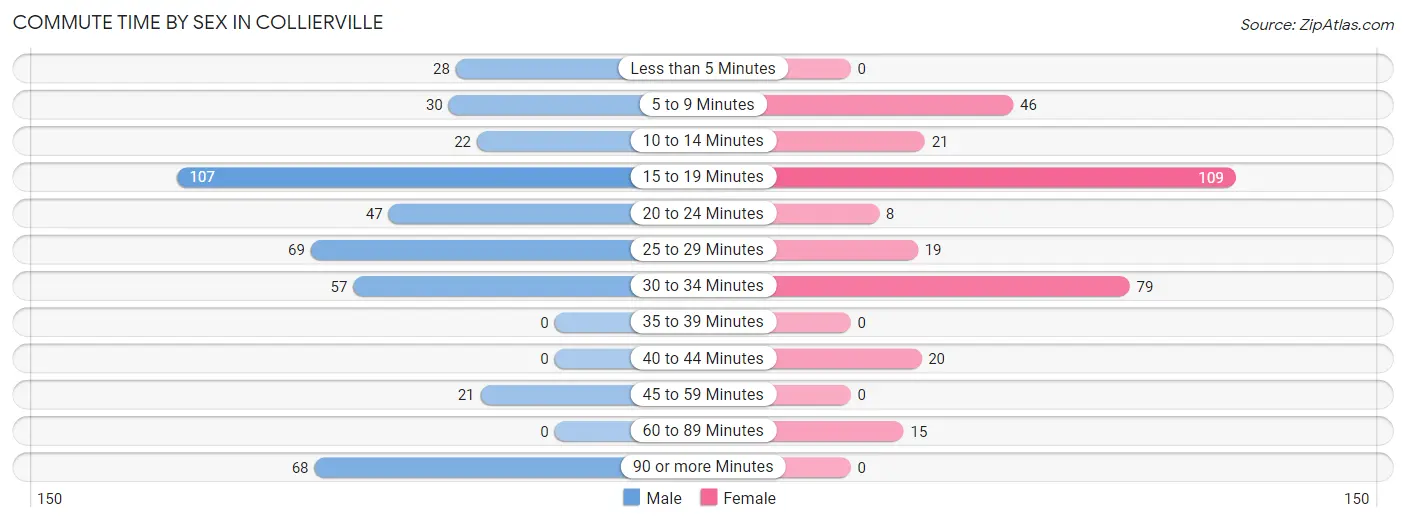
| Commute Time | Male | Female |
| Less than 5 Minutes | 28 (6.2%) | 0 (0.0%) |
| 5 to 9 Minutes | 30 (6.7%) | 46 (14.5%) |
| 10 to 14 Minutes | 22 (4.9%) | 21 (6.6%) |
| 15 to 19 Minutes | 107 (23.8%) | 109 (34.4%) |
| 20 to 24 Minutes | 47 (10.5%) | 8 (2.5%) |
| 25 to 29 Minutes | 69 (15.4%) | 19 (6.0%) |
| 30 to 34 Minutes | 57 (12.7%) | 79 (24.9%) |
| 35 to 39 Minutes | 0 (0.0%) | 0 (0.0%) |
| 40 to 44 Minutes | 0 (0.0%) | 20 (6.3%) |
| 45 to 59 Minutes | 21 (4.7%) | 0 (0.0%) |
| 60 to 89 Minutes | 0 (0.0%) | 15 (4.7%) |
| 90 or more Minutes | 68 (15.1%) | 0 (0.0%) |
Time of Departure to Work by Sex in Collierville
The most frequent times of departure to work in Collierville are 8:00 AM to 8:29 AM (103, 22.9%) for males and 7:00 AM to 7:29 AM (66, 20.8%) for females.
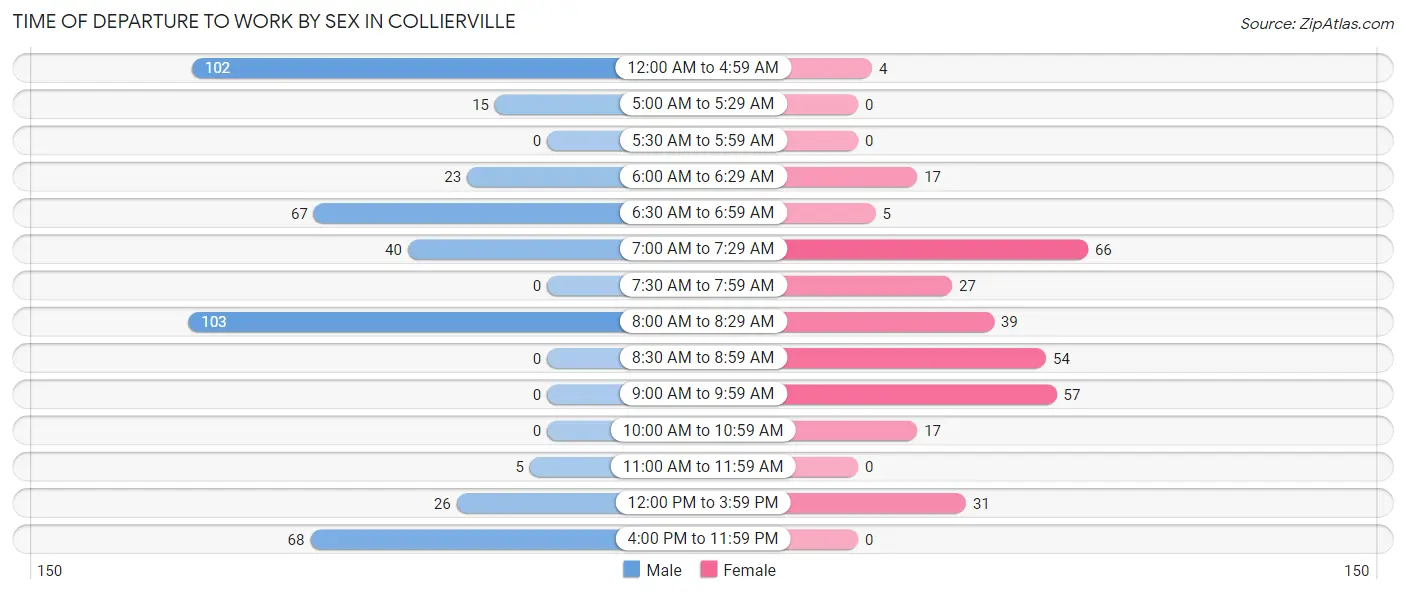
| Time of Departure | Male | Female |
| 12:00 AM to 4:59 AM | 102 (22.7%) | 4 (1.3%) |
| 5:00 AM to 5:29 AM | 15 (3.3%) | 0 (0.0%) |
| 5:30 AM to 5:59 AM | 0 (0.0%) | 0 (0.0%) |
| 6:00 AM to 6:29 AM | 23 (5.1%) | 17 (5.4%) |
| 6:30 AM to 6:59 AM | 67 (14.9%) | 5 (1.6%) |
| 7:00 AM to 7:29 AM | 40 (8.9%) | 66 (20.8%) |
| 7:30 AM to 7:59 AM | 0 (0.0%) | 27 (8.5%) |
| 8:00 AM to 8:29 AM | 103 (22.9%) | 39 (12.3%) |
| 8:30 AM to 8:59 AM | 0 (0.0%) | 54 (17.0%) |
| 9:00 AM to 9:59 AM | 0 (0.0%) | 57 (18.0%) |
| 10:00 AM to 10:59 AM | 0 (0.0%) | 17 (5.4%) |
| 11:00 AM to 11:59 AM | 5 (1.1%) | 0 (0.0%) |
| 12:00 PM to 3:59 PM | 26 (5.8%) | 31 (9.8%) |
| 4:00 PM to 11:59 PM | 68 (15.1%) | 0 (0.0%) |
| Total | 449 (100.0%) | 317 (100.0%) |
Housing Occupancy in Collierville
Occupancy by Ownership in Collierville
Of the total 656 dwellings in Collierville, owner-occupied units account for 422 (64.3%), while renter-occupied units make up 234 (35.7%).
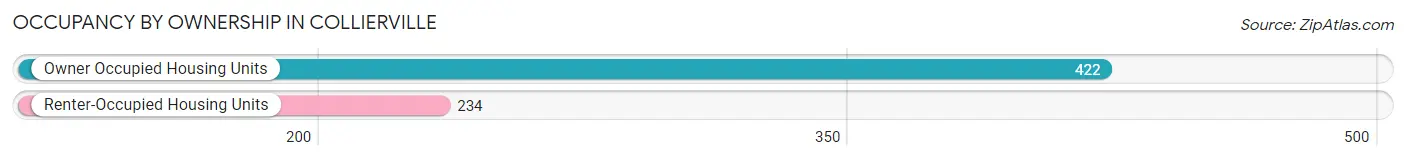
| Occupancy | # Housing Units | % Housing Units |
| Owner Occupied Housing Units | 422 | 64.3% |
| Renter-Occupied Housing Units | 234 | 35.7% |
| Total Occupied Housing Units | 656 | 100.0% |
Occupancy by Household Size in Collierville
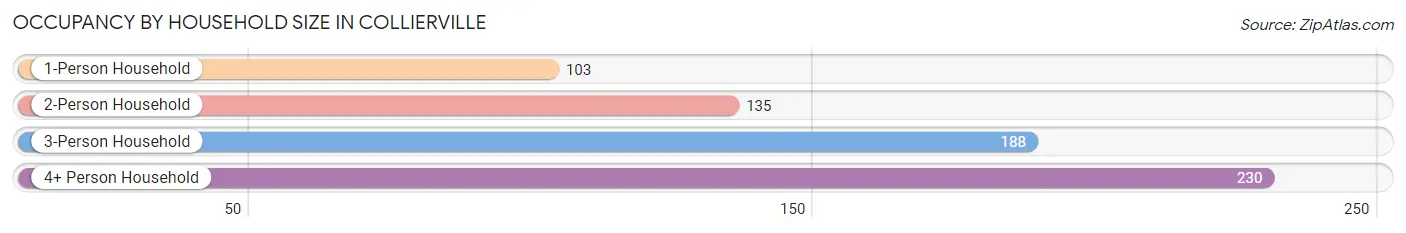
| Household Size | # Housing Units | % Housing Units |
| 1-Person Household | 103 | 15.7% |
| 2-Person Household | 135 | 20.6% |
| 3-Person Household | 188 | 28.7% |
| 4+ Person Household | 230 | 35.1% |
| Total Housing Units | 656 | 100.0% |
Occupancy by Ownership by Household Size in Collierville
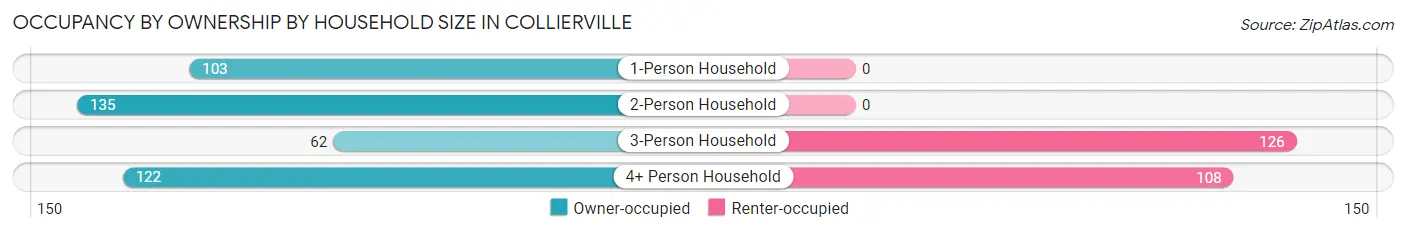
| Household Size | Owner-occupied | Renter-occupied |
| 1-Person Household | 103 (100.0%) | 0 (0.0%) |
| 2-Person Household | 135 (100.0%) | 0 (0.0%) |
| 3-Person Household | 62 (33.0%) | 126 (67.0%) |
| 4+ Person Household | 122 (53.0%) | 108 (47.0%) |
| Total Housing Units | 422 (64.3%) | 234 (35.7%) |
Occupancy by Educational Attainment in Collierville
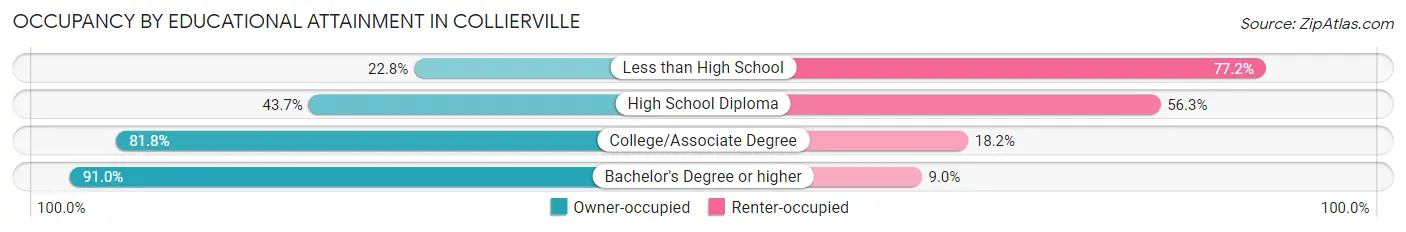
| Household Size | Owner-occupied | Renter-occupied |
| Less than High School | 23 (22.8%) | 78 (77.2%) |
| High School Diploma | 83 (43.7%) | 107 (56.3%) |
| College/Associate Degree | 144 (81.8%) | 32 (18.2%) |
| Bachelor's Degree or higher | 172 (91.0%) | 17 (9.0%) |
Occupancy by Age of Householder in Collierville
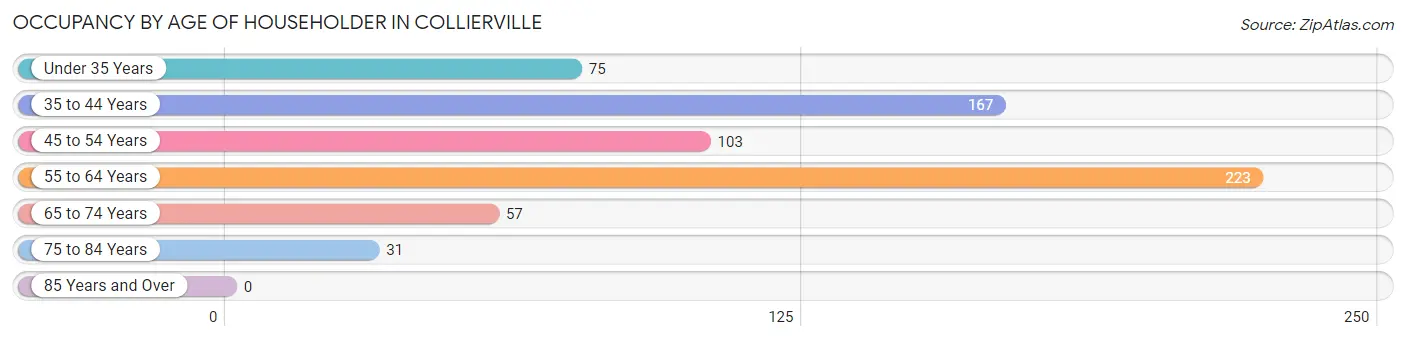
| Age Bracket | # Households | % Households |
| Under 35 Years | 75 | 11.4% |
| 35 to 44 Years | 167 | 25.5% |
| 45 to 54 Years | 103 | 15.7% |
| 55 to 64 Years | 223 | 34.0% |
| 65 to 74 Years | 57 | 8.7% |
| 75 to 84 Years | 31 | 4.7% |
| 85 Years and Over | 0 | 0.0% |
| Total | 656 | 100.0% |
Housing Finances in Collierville
Median Income by Occupancy in Collierville
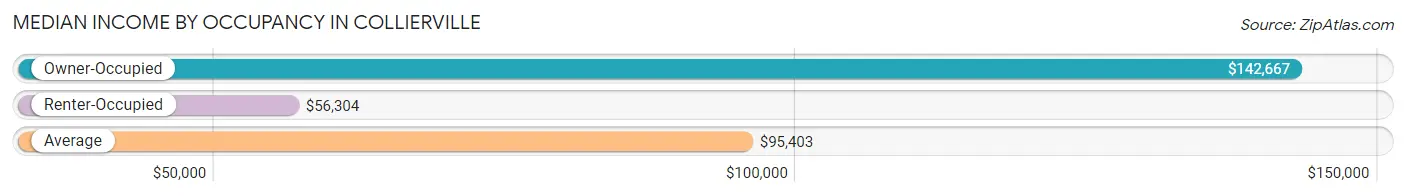
| Occupancy Type | # Households | Median Income |
| Owner-Occupied | 422 (64.3%) | $142,667 |
| Renter-Occupied | 234 (35.7%) | $56,304 |
| Average | 656 (100.0%) | $95,403 |
Occupancy by Householder Income Bracket in Collierville
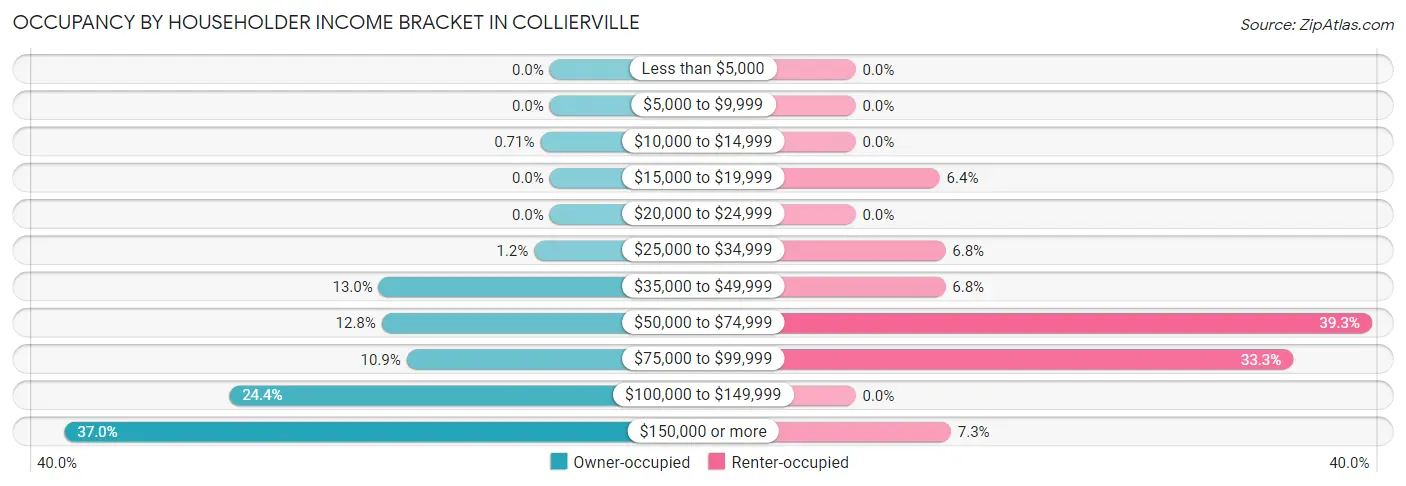
| Income Bracket | Owner-occupied | Renter-occupied |
| Less than $5,000 | 0 (0.0%) | 0 (0.0%) |
| $5,000 to $9,999 | 0 (0.0%) | 0 (0.0%) |
| $10,000 to $14,999 | 3 (0.7%) | 0 (0.0%) |
| $15,000 to $19,999 | 0 (0.0%) | 15 (6.4%) |
| $20,000 to $24,999 | 0 (0.0%) | 0 (0.0%) |
| $25,000 to $34,999 | 5 (1.2%) | 16 (6.8%) |
| $35,000 to $49,999 | 55 (13.0%) | 16 (6.8%) |
| $50,000 to $74,999 | 54 (12.8%) | 92 (39.3%) |
| $75,000 to $99,999 | 46 (10.9%) | 78 (33.3%) |
| $100,000 to $149,999 | 103 (24.4%) | 0 (0.0%) |
| $150,000 or more | 156 (37.0%) | 17 (7.3%) |
| Total | 422 (100.0%) | 234 (100.0%) |
Monthly Housing Cost Tiers in Collierville
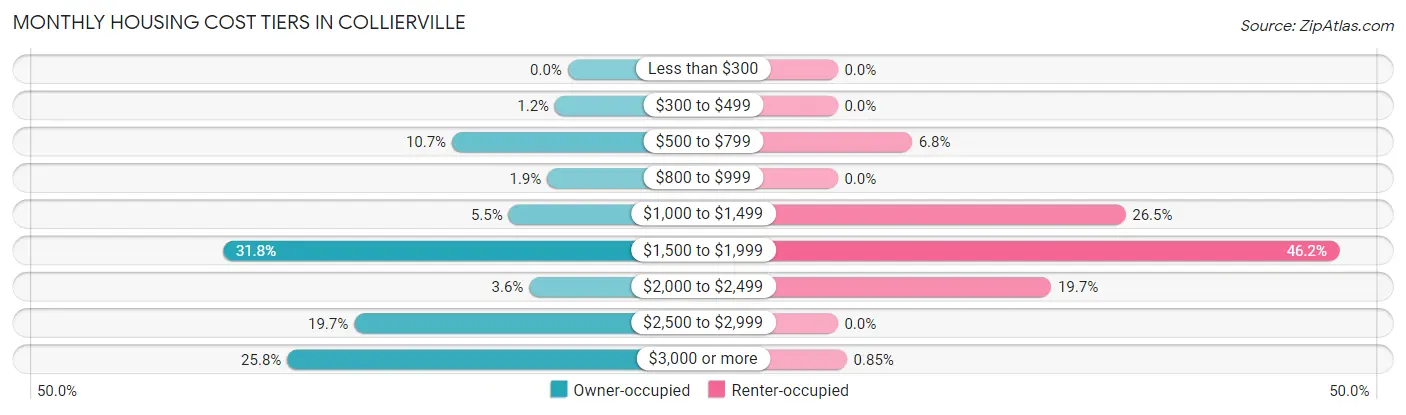
| Monthly Cost | Owner-occupied | Renter-occupied |
| Less than $300 | 0 (0.0%) | 0 (0.0%) |
| $300 to $499 | 5 (1.2%) | 0 (0.0%) |
| $500 to $799 | 45 (10.7%) | 16 (6.8%) |
| $800 to $999 | 8 (1.9%) | 0 (0.0%) |
| $1,000 to $1,499 | 23 (5.4%) | 62 (26.5%) |
| $1,500 to $1,999 | 134 (31.8%) | 108 (46.2%) |
| $2,000 to $2,499 | 15 (3.5%) | 46 (19.7%) |
| $2,500 to $2,999 | 83 (19.7%) | 0 (0.0%) |
| $3,000 or more | 109 (25.8%) | 2 (0.9%) |
| Total | 422 (100.0%) | 234 (100.0%) |
Physical Housing Characteristics in Collierville
Housing Structures in Collierville
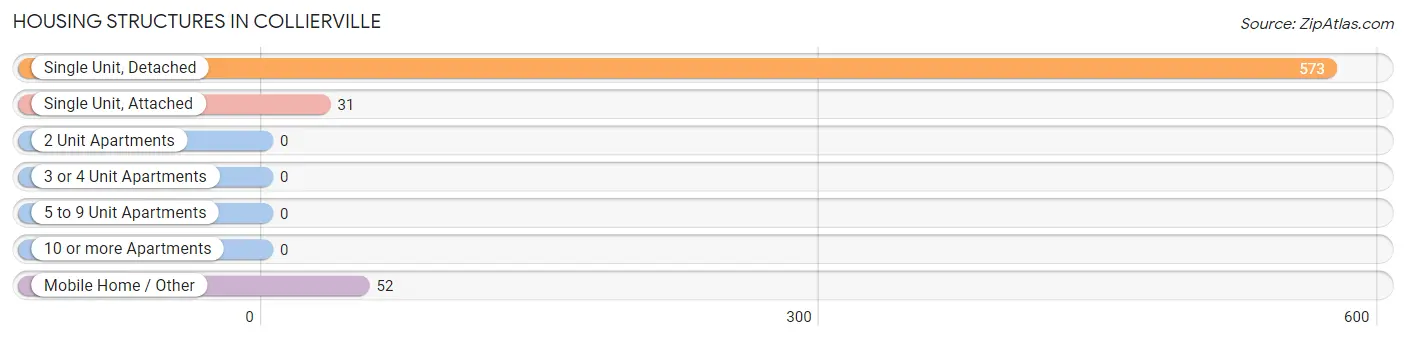
| Structure Type | # Housing Units | % Housing Units |
| Single Unit, Detached | 573 | 87.4% |
| Single Unit, Attached | 31 | 4.7% |
| 2 Unit Apartments | 0 | 0.0% |
| 3 or 4 Unit Apartments | 0 | 0.0% |
| 5 to 9 Unit Apartments | 0 | 0.0% |
| 10 or more Apartments | 0 | 0.0% |
| Mobile Home / Other | 52 | 7.9% |
| Total | 656 | 100.0% |
Housing Structures by Occupancy in Collierville
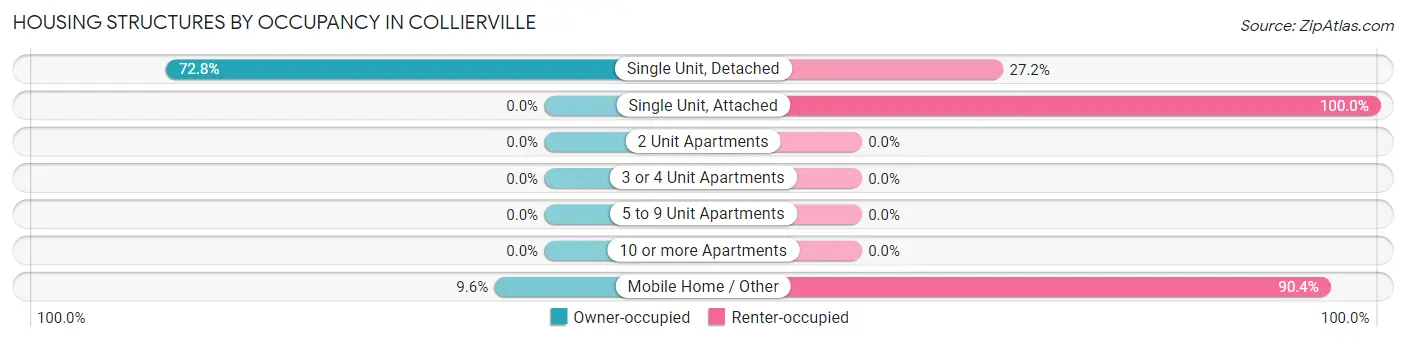
| Structure Type | Owner-occupied | Renter-occupied |
| Single Unit, Detached | 417 (72.8%) | 156 (27.2%) |
| Single Unit, Attached | 0 (0.0%) | 31 (100.0%) |
| 2 Unit Apartments | 0 (0.0%) | 0 (0.0%) |
| 3 or 4 Unit Apartments | 0 (0.0%) | 0 (0.0%) |
| 5 to 9 Unit Apartments | 0 (0.0%) | 0 (0.0%) |
| 10 or more Apartments | 0 (0.0%) | 0 (0.0%) |
| Mobile Home / Other | 5 (9.6%) | 47 (90.4%) |
| Total | 422 (64.3%) | 234 (35.7%) |
Housing Structures by Number of Rooms in Collierville
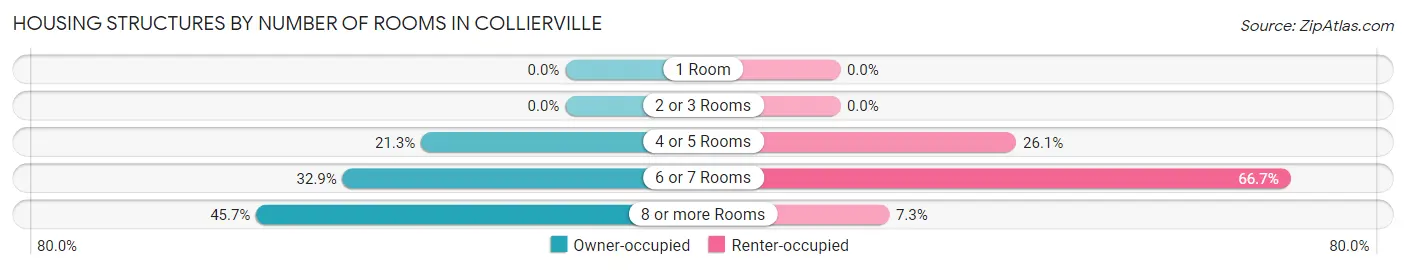
| Number of Rooms | Owner-occupied | Renter-occupied |
| 1 Room | 0 (0.0%) | 0 (0.0%) |
| 2 or 3 Rooms | 0 (0.0%) | 0 (0.0%) |
| 4 or 5 Rooms | 90 (21.3%) | 61 (26.1%) |
| 6 or 7 Rooms | 139 (32.9%) | 156 (66.7%) |
| 8 or more Rooms | 193 (45.7%) | 17 (7.3%) |
| Total | 422 (100.0%) | 234 (100.0%) |
Housing Structure by Heating Type in Collierville
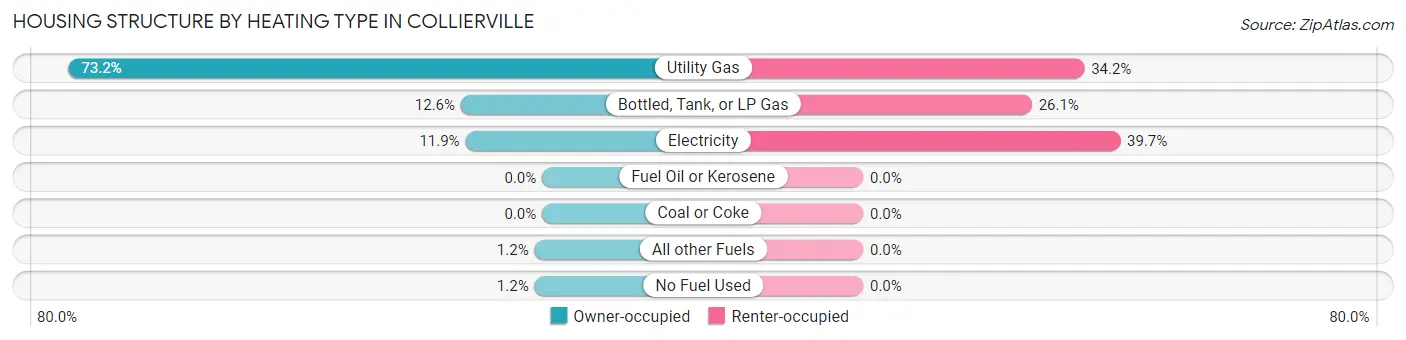
| Heating Type | Owner-occupied | Renter-occupied |
| Utility Gas | 309 (73.2%) | 80 (34.2%) |
| Bottled, Tank, or LP Gas | 53 (12.6%) | 61 (26.1%) |
| Electricity | 50 (11.8%) | 93 (39.7%) |
| Fuel Oil or Kerosene | 0 (0.0%) | 0 (0.0%) |
| Coal or Coke | 0 (0.0%) | 0 (0.0%) |
| All other Fuels | 5 (1.2%) | 0 (0.0%) |
| No Fuel Used | 5 (1.2%) | 0 (0.0%) |
| Total | 422 (100.0%) | 234 (100.0%) |
Household Vehicle Usage in Collierville
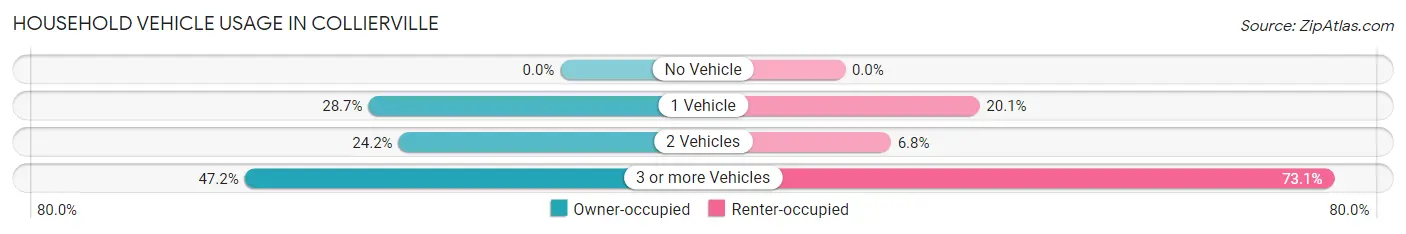
| Vehicles per Household | Owner-occupied | Renter-occupied |
| No Vehicle | 0 (0.0%) | 0 (0.0%) |
| 1 Vehicle | 121 (28.7%) | 47 (20.1%) |
| 2 Vehicles | 102 (24.2%) | 16 (6.8%) |
| 3 or more Vehicles | 199 (47.2%) | 171 (73.1%) |
| Total | 422 (100.0%) | 234 (100.0%) |
Real Estate & Mortgages in Collierville
Real Estate and Mortgage Overview in Collierville
| Characteristic | Without Mortgage | With Mortgage |
| Housing Units | 78 | 344 |
| Median Property Value | $778,400 | $772,300 |
| Median Household Income | $96,452 | $139 |
| Monthly Housing Costs | $721 | $109 |
| Real Estate Taxes | $5,417 | $0 |
Property Value by Mortgage Status in Collierville
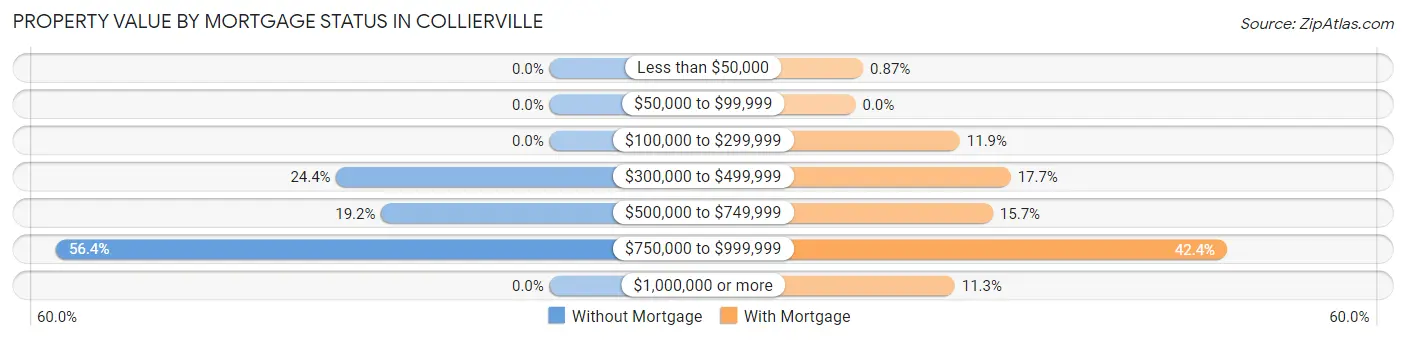
| Property Value | Without Mortgage | With Mortgage |
| Less than $50,000 | 0 (0.0%) | 3 (0.9%) |
| $50,000 to $99,999 | 0 (0.0%) | 0 (0.0%) |
| $100,000 to $299,999 | 0 (0.0%) | 41 (11.9%) |
| $300,000 to $499,999 | 19 (24.4%) | 61 (17.7%) |
| $500,000 to $749,999 | 15 (19.2%) | 54 (15.7%) |
| $750,000 to $999,999 | 44 (56.4%) | 146 (42.4%) |
| $1,000,000 or more | 0 (0.0%) | 39 (11.3%) |
| Total | 78 (100.0%) | 344 (100.0%) |
Household Income by Mortgage Status in Collierville
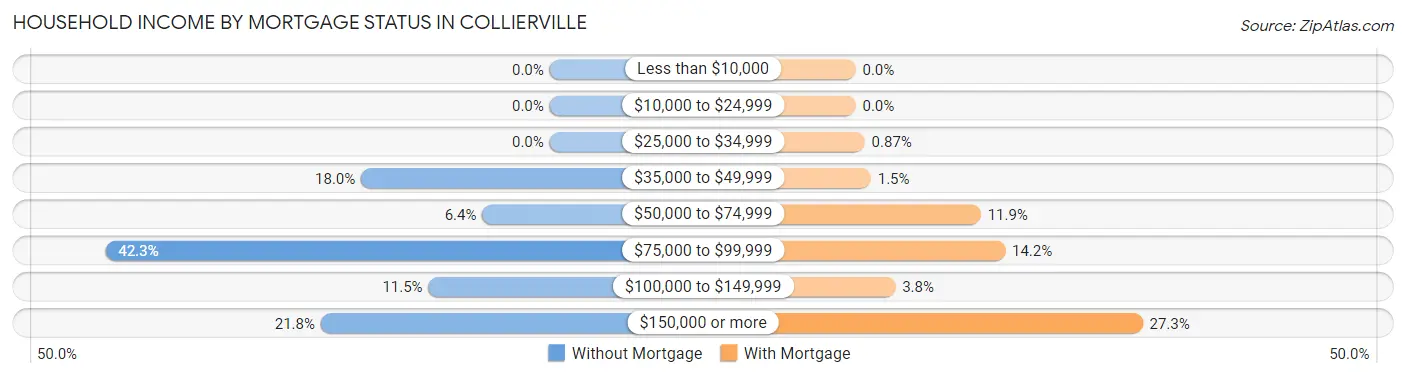
| Household Income | Without Mortgage | With Mortgage |
| Less than $10,000 | 0 (0.0%) | 0 (0.0%) |
| $10,000 to $24,999 | 0 (0.0%) | 0 (0.0%) |
| $25,000 to $34,999 | 0 (0.0%) | 3 (0.9%) |
| $35,000 to $49,999 | 14 (17.9%) | 5 (1.5%) |
| $50,000 to $74,999 | 5 (6.4%) | 41 (11.9%) |
| $75,000 to $99,999 | 33 (42.3%) | 49 (14.2%) |
| $100,000 to $149,999 | 9 (11.5%) | 13 (3.8%) |
| $150,000 or more | 17 (21.8%) | 94 (27.3%) |
| Total | 78 (100.0%) | 344 (100.0%) |
Property Value to Household Income Ratio in Collierville
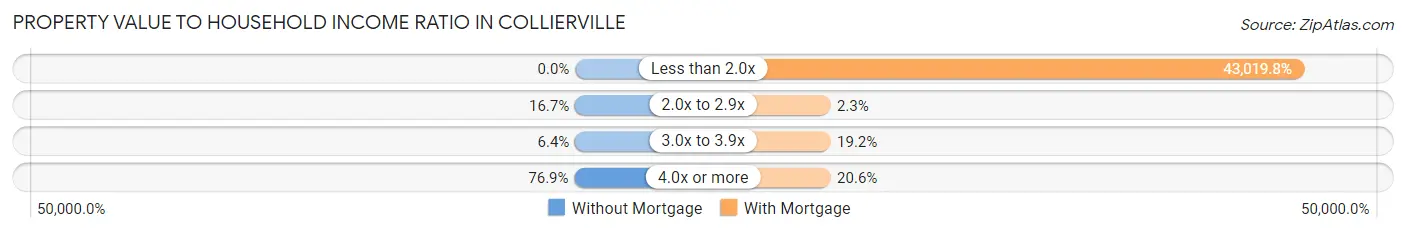
| Value-to-Income Ratio | Without Mortgage | With Mortgage |
| Less than 2.0x | 0 (0.0%) | 147,988 (43,019.8%) |
| 2.0x to 2.9x | 13 (16.7%) | 8 (2.3%) |
| 3.0x to 3.9x | 5 (6.4%) | 66 (19.2%) |
| 4.0x or more | 60 (76.9%) | 71 (20.6%) |
| Total | 78 (100.0%) | 344 (100.0%) |
Real Estate Taxes by Mortgage Status in Collierville
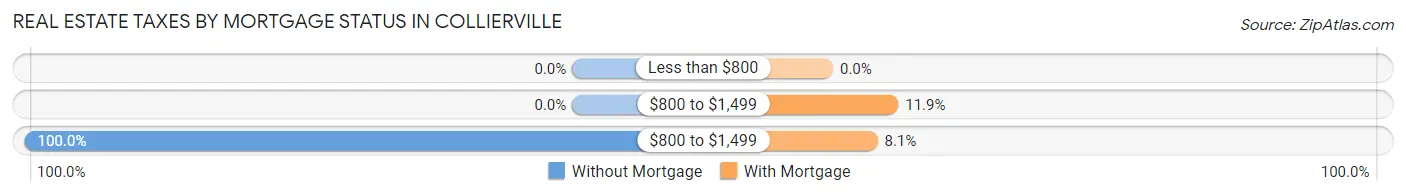
| Property Taxes | Without Mortgage | With Mortgage |
| Less than $800 | 0 (0.0%) | 0 (0.0%) |
| $800 to $1,499 | 0 (0.0%) | 41 (11.9%) |
| $800 to $1,499 | 78 (100.0%) | 28 (8.1%) |
| Total | 78 (100.0%) | 344 (100.0%) |
Health & Disability in Collierville
Health Insurance Coverage by Age in Collierville
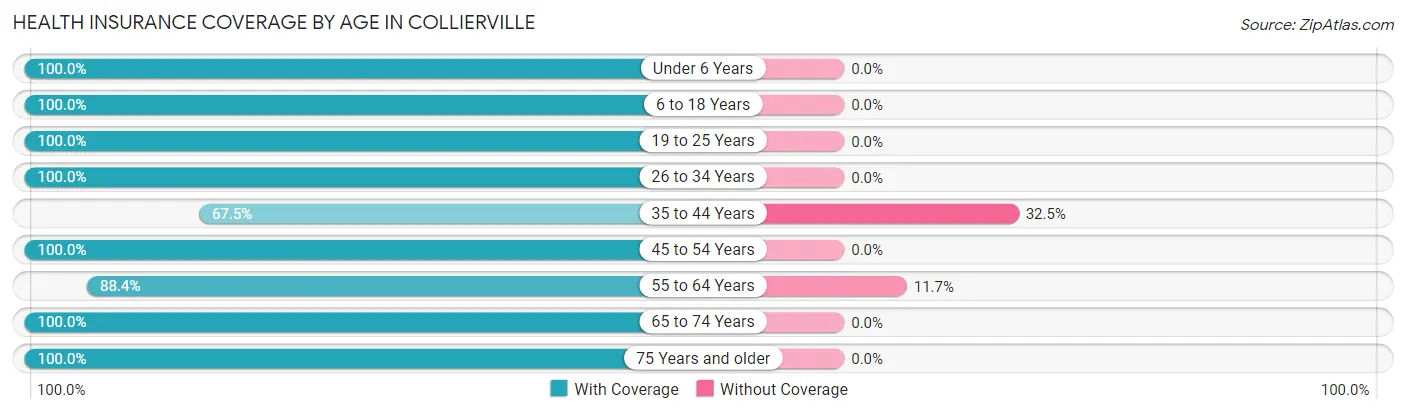
| Age Bracket | With Coverage | Without Coverage |
| Under 6 Years | 211 (100.0%) | 0 (0.0%) |
| 6 to 18 Years | 446 (100.0%) | 0 (0.0%) |
| 19 to 25 Years | 158 (100.0%) | 0 (0.0%) |
| 26 to 34 Years | 233 (100.0%) | 0 (0.0%) |
| 35 to 44 Years | 220 (67.5%) | 106 (32.5%) |
| 45 to 54 Years | 178 (100.0%) | 0 (0.0%) |
| 55 to 64 Years | 311 (88.3%) | 41 (11.7%) |
| 65 to 74 Years | 153 (100.0%) | 0 (0.0%) |
| 75 Years and older | 47 (100.0%) | 0 (0.0%) |
| Total | 1,957 (93.0%) | 147 (7.0%) |
Health Insurance Coverage by Citizenship Status in Collierville

| Citizenship Status | With Coverage | Without Coverage |
| Native Born | 211 (100.0%) | 0 (0.0%) |
| Foreign Born, Citizen | 446 (100.0%) | 0 (0.0%) |
| Foreign Born, not a Citizen | 158 (100.0%) | 0 (0.0%) |
Health Insurance Coverage by Household Income in Collierville
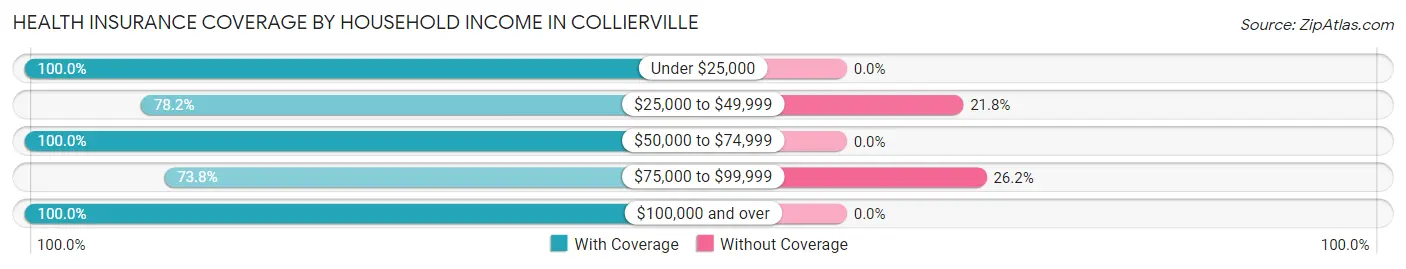
| Household Income | With Coverage | Without Coverage |
| Under $25,000 | 45 (100.0%) | 0 (0.0%) |
| $25,000 to $49,999 | 147 (78.2%) | 41 (21.8%) |
| $50,000 to $74,999 | 410 (100.0%) | 0 (0.0%) |
| $75,000 to $99,999 | 299 (73.8%) | 106 (26.2%) |
| $100,000 and over | 1,056 (100.0%) | 0 (0.0%) |
Public vs Private Health Insurance Coverage by Age in Collierville
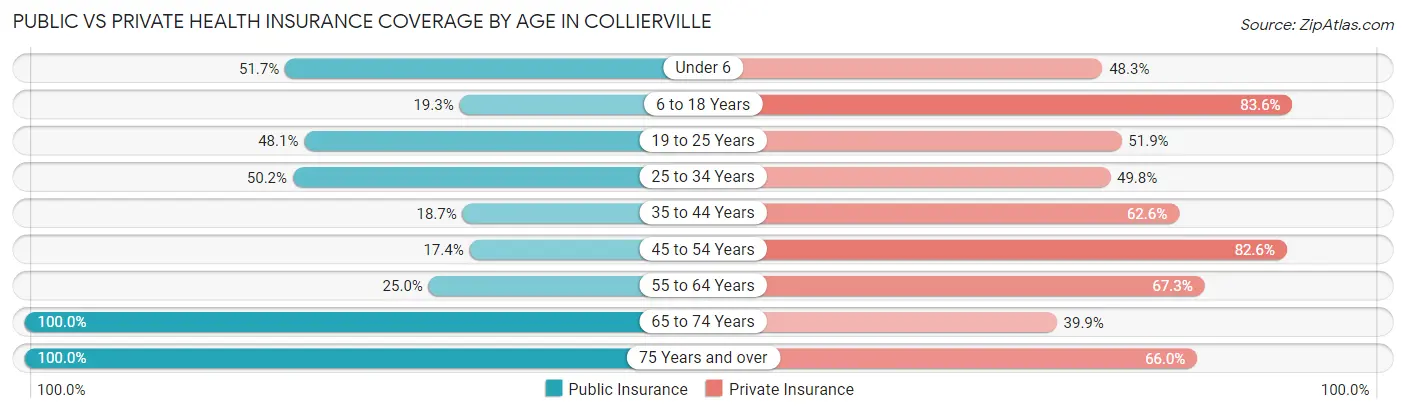
| Age Bracket | Public Insurance | Private Insurance |
| Under 6 | 109 (51.7%) | 102 (48.3%) |
| 6 to 18 Years | 86 (19.3%) | 373 (83.6%) |
| 19 to 25 Years | 76 (48.1%) | 82 (51.9%) |
| 25 to 34 Years | 117 (50.2%) | 116 (49.8%) |
| 35 to 44 Years | 61 (18.7%) | 204 (62.6%) |
| 45 to 54 Years | 31 (17.4%) | 147 (82.6%) |
| 55 to 64 Years | 88 (25.0%) | 237 (67.3%) |
| 65 to 74 Years | 153 (100.0%) | 61 (39.9%) |
| 75 Years and over | 47 (100.0%) | 31 (66.0%) |
| Total | 768 (36.5%) | 1,353 (64.3%) |
Disability Status by Sex by Age in Collierville
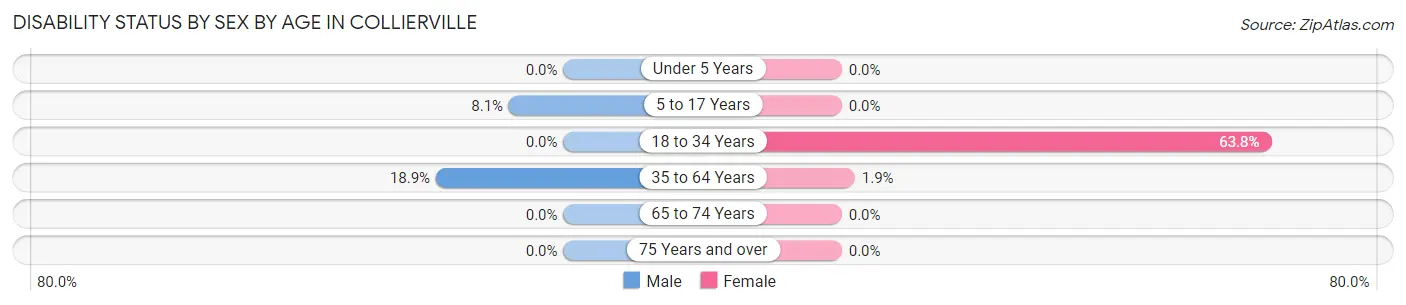
| Age Bracket | Male | Female |
| Under 5 Years | 0 (0.0%) | 0 (0.0%) |
| 5 to 17 Years | 16 (8.1%) | 0 (0.0%) |
| 18 to 34 Years | 0 (0.0%) | 132 (63.8%) |
| 35 to 64 Years | 84 (18.9%) | 8 (1.9%) |
| 65 to 74 Years | 0 (0.0%) | 0 (0.0%) |
| 75 Years and over | 0 (0.0%) | 0 (0.0%) |
Disability Class by Sex by Age in Collierville
Disability Class: Hearing Difficulty
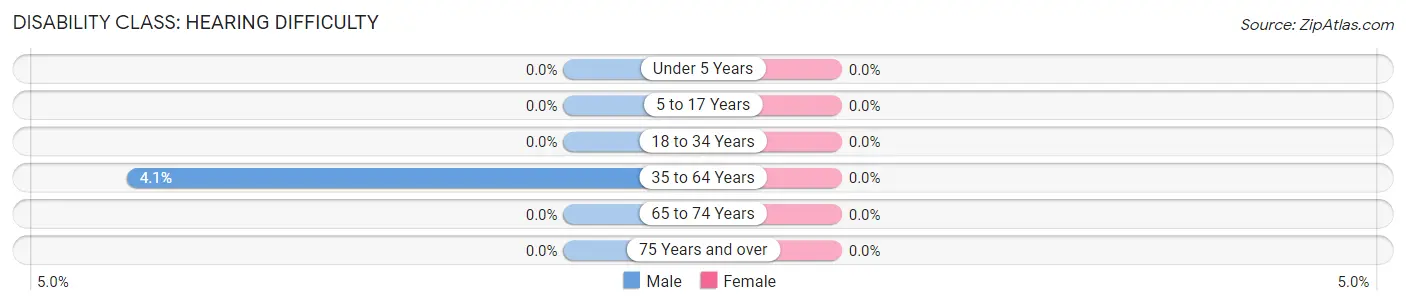
| Age Bracket | Male | Female |
| Under 5 Years | 0 (0.0%) | 0 (0.0%) |
| 5 to 17 Years | 0 (0.0%) | 0 (0.0%) |
| 18 to 34 Years | 0 (0.0%) | 0 (0.0%) |
| 35 to 64 Years | 18 (4.1%) | 0 (0.0%) |
| 65 to 74 Years | 0 (0.0%) | 0 (0.0%) |
| 75 Years and over | 0 (0.0%) | 0 (0.0%) |
Disability Class: Vision Difficulty
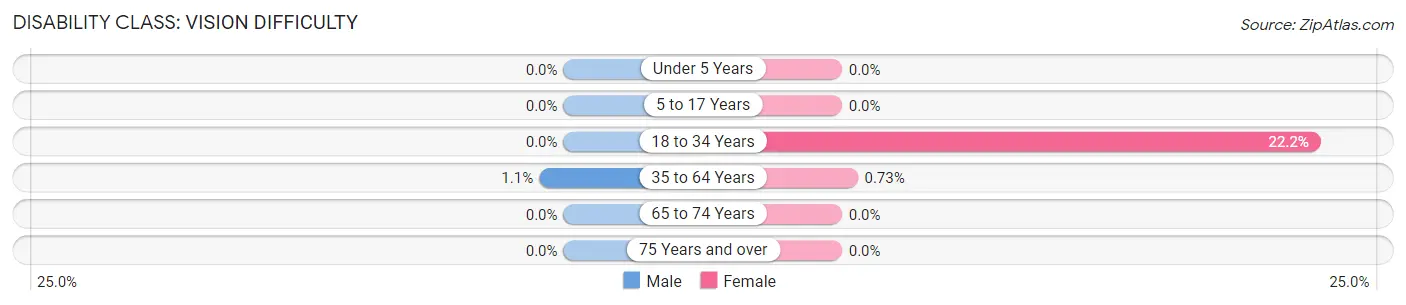
| Age Bracket | Male | Female |
| Under 5 Years | 0 (0.0%) | 0 (0.0%) |
| 5 to 17 Years | 0 (0.0%) | 0 (0.0%) |
| 18 to 34 Years | 0 (0.0%) | 46 (22.2%) |
| 35 to 64 Years | 5 (1.1%) | 3 (0.7%) |
| 65 to 74 Years | 0 (0.0%) | 0 (0.0%) |
| 75 Years and over | 0 (0.0%) | 0 (0.0%) |
Disability Class: Cognitive Difficulty
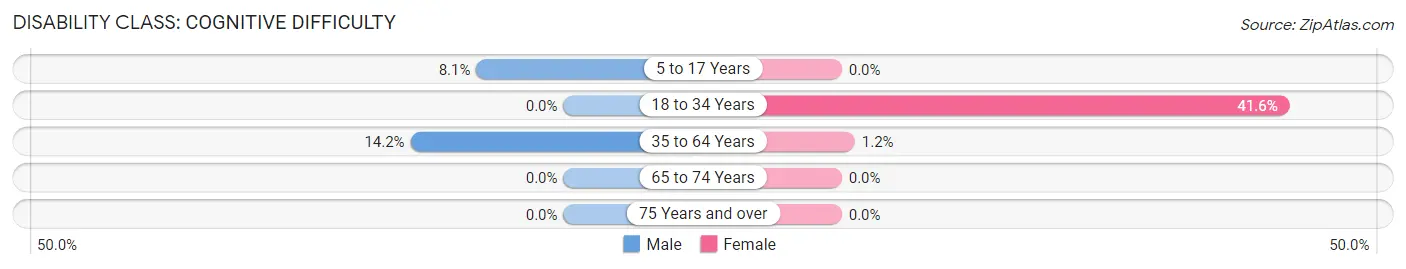
| Age Bracket | Male | Female |
| 5 to 17 Years | 16 (8.1%) | 0 (0.0%) |
| 18 to 34 Years | 0 (0.0%) | 86 (41.5%) |
| 35 to 64 Years | 63 (14.2%) | 5 (1.2%) |
| 65 to 74 Years | 0 (0.0%) | 0 (0.0%) |
| 75 Years and over | 0 (0.0%) | 0 (0.0%) |
Disability Class: Ambulatory Difficulty
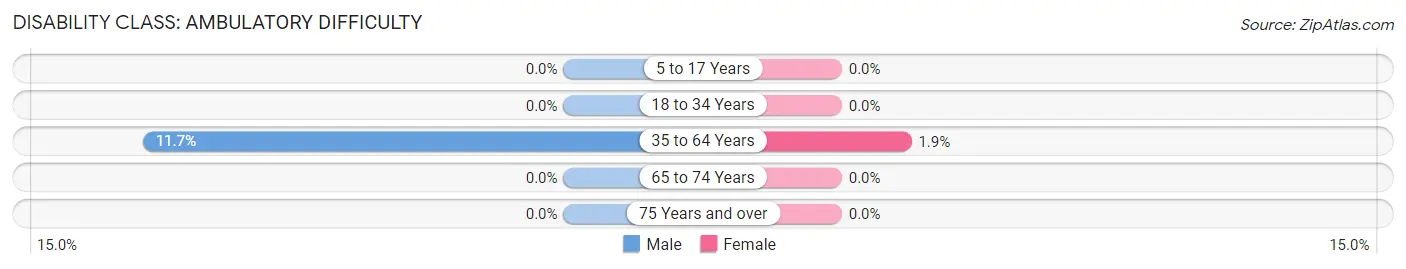
| Age Bracket | Male | Female |
| 5 to 17 Years | 0 (0.0%) | 0 (0.0%) |
| 18 to 34 Years | 0 (0.0%) | 0 (0.0%) |
| 35 to 64 Years | 52 (11.7%) | 8 (1.9%) |
| 65 to 74 Years | 0 (0.0%) | 0 (0.0%) |
| 75 Years and over | 0 (0.0%) | 0 (0.0%) |
Disability Class: Self-Care Difficulty
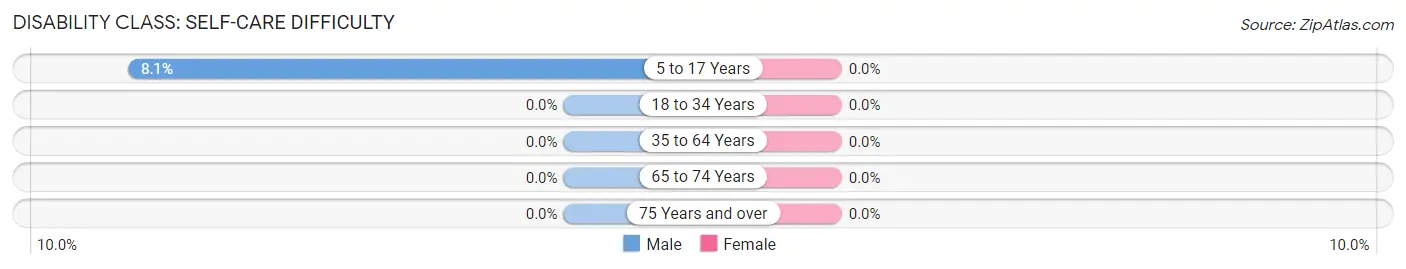
| Age Bracket | Male | Female |
| 5 to 17 Years | 16 (8.1%) | 0 (0.0%) |
| 18 to 34 Years | 0 (0.0%) | 0 (0.0%) |
| 35 to 64 Years | 0 (0.0%) | 0 (0.0%) |
| 65 to 74 Years | 0 (0.0%) | 0 (0.0%) |
| 75 Years and over | 0 (0.0%) | 0 (0.0%) |
Technology Access in Collierville
Computing Device Access in Collierville
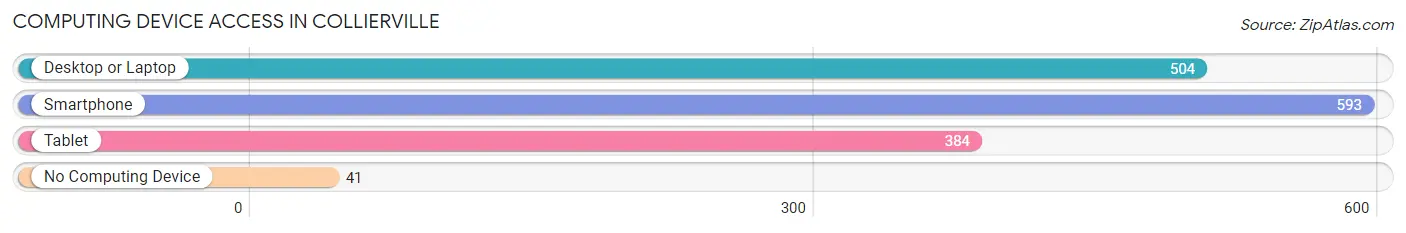
| Device Type | # Households | % Households |
| Desktop or Laptop | 504 | 76.8% |
| Smartphone | 593 | 90.4% |
| Tablet | 384 | 58.5% |
| No Computing Device | 41 | 6.2% |
| Total | 656 | 100.0% |
Internet Access in Collierville
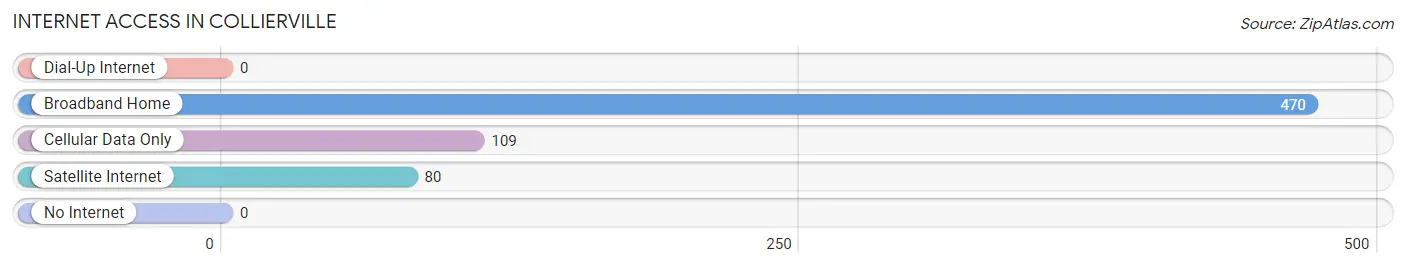
| Internet Type | # Households | % Households |
| Dial-Up Internet | 0 | 0.0% |
| Broadband Home | 470 | 71.7% |
| Cellular Data Only | 109 | 16.6% |
| Satellite Internet | 80 | 12.2% |
| No Internet | 0 | 0.0% |
| Total | 656 | 100.0% |
Collierville Summary
Collierville, California is a small town located in the San Joaquin Valley of California. It is situated in the foothills of the Sierra Nevada Mountains, about 30 miles east of Fresno. The town has a population of about 1,500 people and is known for its rural charm and agricultural heritage.
History
Collierville was founded in 1872 by a group of settlers from the Midwest. The town was named after the Collier family, who were among the first settlers. The Colliers were farmers and ranchers, and the town quickly became a center for agricultural production. The town was incorporated in 1891 and has remained a small, rural community ever since.
Geography
Collierville is located in the San Joaquin Valley of California, about 30 miles east of Fresno. The town is situated in the foothills of the Sierra Nevada Mountains, and is surrounded by rolling hills and farmland. The climate is mild and dry, with hot summers and cool winters.
Economy
Collierville’s economy is largely based on agriculture. The town is home to several large farms and ranches, and produces a variety of crops including grapes, almonds, and olives. The town also has a small manufacturing sector, with several small businesses producing furniture, clothing, and other goods.
Demographics
As of the 2010 census, Collierville had a population of 1,500 people. The town is predominantly white, with a small Hispanic population. The median household income is $45,000, and the median age is 37. The town has a low unemployment rate, and most of the population is employed in the agricultural sector.
Collierville is a small, rural town with a rich history and a strong agricultural heritage. The town is known for its rural charm and its friendly, welcoming atmosphere. The town is home to a diverse population, and is a great place to live and work.
Common Questions
What is Per Capita Income in Collierville?
Per Capita income in Collierville is $41,284.
What is the Median Family Income in Collierville?
Median Family Income in Collierville is $96,431.
What is the Median Household income in Collierville?
Median Household Income in Collierville is $95,403.
What is Income or Wage Gap in Collierville?
Income or Wage Gap in Collierville is 24.0%.
Women in Collierville earn 76.0 cents for every dollar earned by a man.
What is Inequality or Gini Index in Collierville?
Inequality or Gini Index in Collierville is 0.41.
What is the Total Population of Collierville?
Total Population of Collierville is 2,104.
What is the Total Male Population of Collierville?
Total Male Population of Collierville is 1,114.
What is the Total Female Population of Collierville?
Total Female Population of Collierville is 990.
What is the Ratio of Males per 100 Females in Collierville?
There are 112.53 Males per 100 Females in Collierville.
What is the Ratio of Females per 100 Males in Collierville?
There are 88.87 Females per 100 Males in Collierville.
What is the Median Population Age in Collierville?
Median Population Age in Collierville is 35.1 Years.
What is the Average Family Size in Collierville
Average Family Size in Collierville is 3.7 People.
What is the Average Household Size in Collierville
Average Household Size in Collierville is 3.2 People.
How Large is the Labor Force in Collierville?
There are 1,132 People in the Labor Forcein in Collierville.
What is the Percentage of People in the Labor Force in Collierville?
73.1% of People are in the Labor Force in Collierville.
What is the Unemployment Rate in Collierville?
Unemployment Rate in Collierville is 5.1%.