Cities with the Highest Percentage of Population Employed in Life, Physical & Social Science in Mississippi
RELATED REPORTS & OPTIONS
Life, Physical & Social Science
Mississippi
Compare Cities
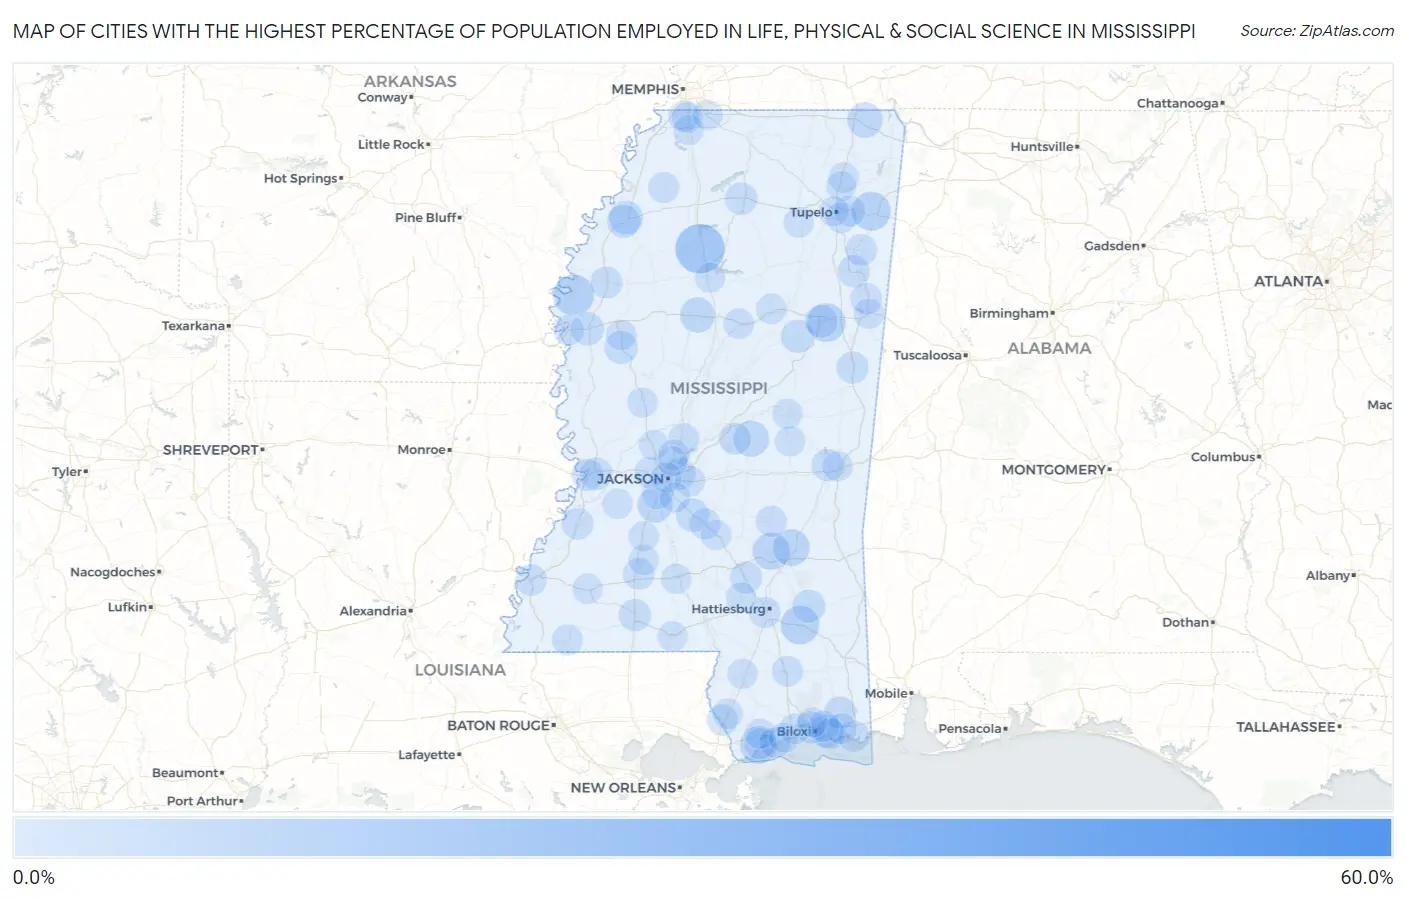
Map of Cities with the Highest Percentage of Population Employed in Life, Physical & Social Science in Mississippi
0.0%
60.0%
Cities with the Highest Percentage of Population Employed in Life, Physical & Social Science in Mississippi
| City | % Employed | vs State | vs National | |
| 1. | Bolivar | 54.2% | 0.76%(+53.4)#1 | 1.1%(+53.1)#14 |
| 2. | Harperville | 47.6% | 0.76%(+46.9)#2 | 1.1%(+46.5)#19 |
| 3. | Winterville | 44.4% | 0.76%(+43.7)#3 | 1.1%(+43.4)#21 |
| 4. | Tillatoba | 15.8% | 0.76%(+15.0)#4 | 1.1%(+14.7)#105 |
| 5. | Benoit | 8.9% | 0.76%(+8.16)#5 | 1.1%(+7.84)#287 |
| 6. | Bogue Chitto | 7.8% | 0.76%(+7.02)#6 | 1.1%(+6.69)#357 |
| 7. | Fulton | 7.4% | 0.76%(+6.59)#7 | 1.1%(+6.26)#389 |
| 8. | New Augusta | 7.1% | 0.76%(+6.31)#8 | 1.1%(+5.98)#422 |
| 9. | Mississippi State | 7.0% | 0.76%(+6.28)#9 | 1.1%(+5.96)#428 |
| 10. | Waveland | 6.3% | 0.76%(+5.55)#10 | 1.1%(+5.22)#529 |
| 11. | Soso | 5.9% | 0.76%(+5.09)#11 | 1.1%(+4.76)#606 |
| 12. | Sharon | 5.7% | 0.76%(+4.92)#12 | 1.1%(+4.59)#638 |
| 13. | Walnut Grove | 4.9% | 0.76%(+4.17)#13 | 1.1%(+3.85)#805 |
| 14. | Farmington | 4.5% | 0.76%(+3.77)#14 | 1.1%(+3.44)#943 |
| 15. | Terry | 4.5% | 0.76%(+3.72)#15 | 1.1%(+3.39)#961 |
| 16. | Carrollton | 4.4% | 0.76%(+3.61)#16 | 1.1%(+3.28)#1,006 |
| 17. | Eudora | 4.1% | 0.76%(+3.34)#17 | 1.1%(+3.02)#1,112 |
| 18. | Lyon | 3.1% | 0.76%(+2.33)#18 | 1.1%(+2.00)#1,803 |
| 19. | Clarksdale | 2.9% | 0.76%(+2.13)#19 | 1.1%(+1.80)#1,976 |
| 20. | Isola | 2.9% | 0.76%(+2.09)#20 | 1.1%(+1.77)#2,006 |
| 21. | Braxton | 2.7% | 0.76%(+1.97)#21 | 1.1%(+1.65)#2,171 |
| 22. | Sturgis | 2.7% | 0.76%(+1.97)#22 | 1.1%(+1.65)#2,172 |
| 23. | Leland | 2.7% | 0.76%(+1.97)#23 | 1.1%(+1.65)#2,178 |
| 24. | Ocean Springs | 2.7% | 0.76%(+1.97)#24 | 1.1%(+1.65)#2,181 |
| 25. | Richton | 2.7% | 0.76%(+1.95)#25 | 1.1%(+1.62)#2,210 |
| 26. | Starkville | 2.4% | 0.76%(+1.66)#26 | 1.1%(+1.33)#2,638 |
| 27. | Beechwood | 2.3% | 0.76%(+1.56)#27 | 1.1%(+1.23)#2,824 |
| 28. | Oxford | 2.2% | 0.76%(+1.39)#28 | 1.1%(+1.06)#3,128 |
| 29. | Summit | 2.0% | 0.76%(+1.27)#29 | 1.1%(+0.948)#3,352 |
| 30. | Biloxi | 2.0% | 0.76%(+1.21)#30 | 1.1%(+0.882)#3,490 |
| 31. | Aberdeen | 1.9% | 0.76%(+1.17)#31 | 1.1%(+0.843)#3,577 |
| 32. | Seminary | 1.9% | 0.76%(+1.12)#32 | 1.1%(+0.796)#3,700 |
| 33. | Nellieburg | 1.9% | 0.76%(+1.11)#33 | 1.1%(+0.784)#3,732 |
| 34. | Vicksburg | 1.9% | 0.76%(+1.09)#34 | 1.1%(+0.764)#3,779 |
| 35. | Macon | 1.9% | 0.76%(+1.09)#35 | 1.1%(+0.760)#3,797 |
| 36. | Lena | 1.8% | 0.76%(+0.990)#36 | 1.1%(+0.663)#4,056 |
| 37. | Vancleave | 1.7% | 0.76%(+0.965)#37 | 1.1%(+0.639)#4,122 |
| 38. | Cleveland | 1.7% | 0.76%(+0.952)#38 | 1.1%(+0.626)#4,174 |
| 39. | Brookhaven | 1.6% | 0.76%(+0.816)#39 | 1.1%(+0.490)#4,555 |
| 40. | Amory | 1.5% | 0.76%(+0.734)#40 | 1.1%(+0.407)#4,842 |
| 41. | Pascagoula | 1.5% | 0.76%(+0.725)#41 | 1.1%(+0.399)#4,896 |
| 42. | Columbus Afb | 1.4% | 0.76%(+0.685)#42 | 1.1%(+0.358)#5,056 |
| 43. | Port Gibson | 1.4% | 0.76%(+0.601)#43 | 1.1%(+0.275)#5,361 |
| 44. | Byram | 1.4% | 0.76%(+0.591)#44 | 1.1%(+0.265)#5,424 |
| 45. | Flowood | 1.3% | 0.76%(+0.580)#45 | 1.1%(+0.254)#5,471 |
| 46. | Gulf Park Estates | 1.3% | 0.76%(+0.566)#46 | 1.1%(+0.239)#5,532 |
| 47. | Gulf Hills | 1.3% | 0.76%(+0.553)#47 | 1.1%(+0.227)#5,596 |
| 48. | Clinton | 1.3% | 0.76%(+0.492)#48 | 1.1%(+0.166)#5,878 |
| 49. | Natchez | 1.2% | 0.76%(+0.414)#49 | 1.1%(+0.088)#6,237 |
| 50. | Hattiesburg | 1.2% | 0.76%(+0.404)#50 | 1.1%(+0.078)#6,286 |
| 51. | Sledge | 1.1% | 0.76%(+0.353)#51 | 1.1%(+0.026)#6,529 |
| 52. | Bay Springs | 1.1% | 0.76%(+0.309)#52 | 1.1%(-0.017)#6,780 |
| 53. | Nicholson | 1.1% | 0.76%(+0.287)#53 | 1.1%(-0.039)#6,879 |
| 54. | Plantersville | 1.0% | 0.76%(+0.258)#54 | 1.1%(-0.068)#7,033 |
| 55. | Bay St Louis | 1.0% | 0.76%(+0.236)#55 | 1.1%(-0.090)#7,167 |
| 56. | Gautier | 0.99% | 0.76%(+0.222)#56 | 1.1%(-0.104)#7,260 |
| 57. | Mendenhall | 0.96% | 0.76%(+0.199)#57 | 1.1%(-0.127)#7,409 |
| 58. | Pass Christian | 0.96% | 0.76%(+0.198)#58 | 1.1%(-0.128)#7,413 |
| 59. | Canton | 0.96% | 0.76%(+0.198)#59 | 1.1%(-0.128)#7,416 |
| 60. | Madison | 0.96% | 0.76%(+0.198)#60 | 1.1%(-0.129)#7,420 |
| 61. | Wiggins | 0.93% | 0.76%(+0.168)#61 | 1.1%(-0.159)#7,597 |
| 62. | Mooreville | 0.93% | 0.76%(+0.164)#62 | 1.1%(-0.162)#7,626 |
| 63. | Greenville | 0.84% | 0.76%(+0.078)#63 | 1.1%(-0.248)#8,198 |
| 64. | Horn Lake | 0.83% | 0.76%(+0.066)#64 | 1.1%(-0.260)#8,282 |
| 65. | Centreville | 0.82% | 0.76%(+0.059)#65 | 1.1%(-0.267)#8,325 |
| 66. | Kilmichael | 0.77% | 0.76%(+0.007)#66 | 1.1%(-0.319)#8,654 |
| 67. | Inverness | 0.75% | 0.76%(-0.018)#67 | 1.1%(-0.345)#8,847 |
| 68. | Picayune | 0.72% | 0.76%(-0.043)#68 | 1.1%(-0.369)#9,034 |
| 69. | Southaven | 0.72% | 0.76%(-0.045)#69 | 1.1%(-0.372)#9,050 |
| 70. | Eupora | 0.71% | 0.76%(-0.052)#70 | 1.1%(-0.378)#9,097 |
| 71. | Gulfport | 0.71% | 0.76%(-0.055)#71 | 1.1%(-0.381)#9,116 |
| 72. | Baldwyn | 0.69% | 0.76%(-0.073)#72 | 1.1%(-0.399)#9,250 |
| 73. | Jackson | 0.69% | 0.76%(-0.077)#73 | 1.1%(-0.404)#9,278 |
| 74. | Brandon | 0.65% | 0.76%(-0.111)#74 | 1.1%(-0.437)#9,541 |
| 75. | Utica | 0.60% | 0.76%(-0.162)#75 | 1.1%(-0.489)#9,952 |
| 76. | Wesson | 0.57% | 0.76%(-0.199)#76 | 1.1%(-0.525)#10,246 |
| 77. | Hernando | 0.56% | 0.76%(-0.204)#77 | 1.1%(-0.530)#10,293 |
| 78. | Philadelphia | 0.56% | 0.76%(-0.208)#78 | 1.1%(-0.535)#10,334 |
| 79. | Monticello | 0.55% | 0.76%(-0.217)#79 | 1.1%(-0.543)#10,414 |
| 80. | Hazlehurst | 0.55% | 0.76%(-0.217)#80 | 1.1%(-0.544)#10,420 |
| 81. | Meadville | 0.54% | 0.76%(-0.221)#81 | 1.1%(-0.547)#10,439 |
| 82. | Algoma | 0.53% | 0.76%(-0.237)#82 | 1.1%(-0.563)#10,561 |
| 83. | Union | 0.53% | 0.76%(-0.238)#83 | 1.1%(-0.565)#10,573 |
| 84. | Diamondhead | 0.51% | 0.76%(-0.256)#84 | 1.1%(-0.582)#10,711 |
| 85. | Magee | 0.51% | 0.76%(-0.257)#85 | 1.1%(-0.584)#10,715 |
| 86. | Columbus | 0.50% | 0.76%(-0.261)#86 | 1.1%(-0.588)#10,738 |
| 87. | Sumrall | 0.46% | 0.76%(-0.301)#87 | 1.1%(-0.628)#11,049 |
| 88. | Tylertown | 0.46% | 0.76%(-0.308)#88 | 1.1%(-0.634)#11,096 |
| 89. | Meridian | 0.45% | 0.76%(-0.319)#89 | 1.1%(-0.645)#11,179 |
| 90. | Olive Branch | 0.44% | 0.76%(-0.320)#90 | 1.1%(-0.646)#11,187 |
| 91. | Long Beach | 0.43% | 0.76%(-0.335)#91 | 1.1%(-0.661)#11,295 |
| 92. | Poplarville | 0.42% | 0.76%(-0.345)#92 | 1.1%(-0.671)#11,362 |
| 93. | Ridgeland | 0.42% | 0.76%(-0.346)#93 | 1.1%(-0.672)#11,372 |
| 94. | Flora | 0.39% | 0.76%(-0.376)#94 | 1.1%(-0.702)#11,606 |
| 95. | Guntown | 0.38% | 0.76%(-0.384)#95 | 1.1%(-0.710)#11,678 |
| 96. | Grenada | 0.35% | 0.76%(-0.412)#96 | 1.1%(-0.738)#11,896 |
| 97. | Tupelo | 0.34% | 0.76%(-0.425)#97 | 1.1%(-0.751)#11,979 |
| 98. | Florence | 0.33% | 0.76%(-0.433)#98 | 1.1%(-0.760)#12,040 |
| 99. | D Iberville | 0.32% | 0.76%(-0.443)#99 | 1.1%(-0.769)#12,117 |
| 100. | Yazoo City | 0.32% | 0.76%(-0.447)#100 | 1.1%(-0.774)#12,146 |
Common Questions
What are the Top 10 Cities with the Highest Percentage of Population Employed in Life, Physical & Social Science in Mississippi?
Top 10 Cities with the Highest Percentage of Population Employed in Life, Physical & Social Science in Mississippi are:
#1
15.8%
#2
8.9%
#3
7.4%
#4
7.1%
#5
7.0%
#6
6.3%
#7
5.9%
#8
5.7%
#9
4.9%
#10
4.5%
What city has the Highest Percentage of Population Employed in Life, Physical & Social Science in Mississippi?
Tillatoba has the Highest Percentage of Population Employed in Life, Physical & Social Science in Mississippi with 15.8%.
What is the Percentage of Population Employed in Life, Physical & Social Science in the State of Mississippi?
Percentage of Population Employed in Life, Physical & Social Science in Mississippi is 0.76%.
What is the Percentage of Population Employed in Life, Physical & Social Science in the United States?
Percentage of Population Employed in Life, Physical & Social Science in the United States is 1.1%.