Cities with the Highest Percentage of Population Employed in Life, Physical & Social Science in Indiana
RELATED REPORTS & OPTIONS
Life, Physical & Social Science
Indiana
Compare Cities
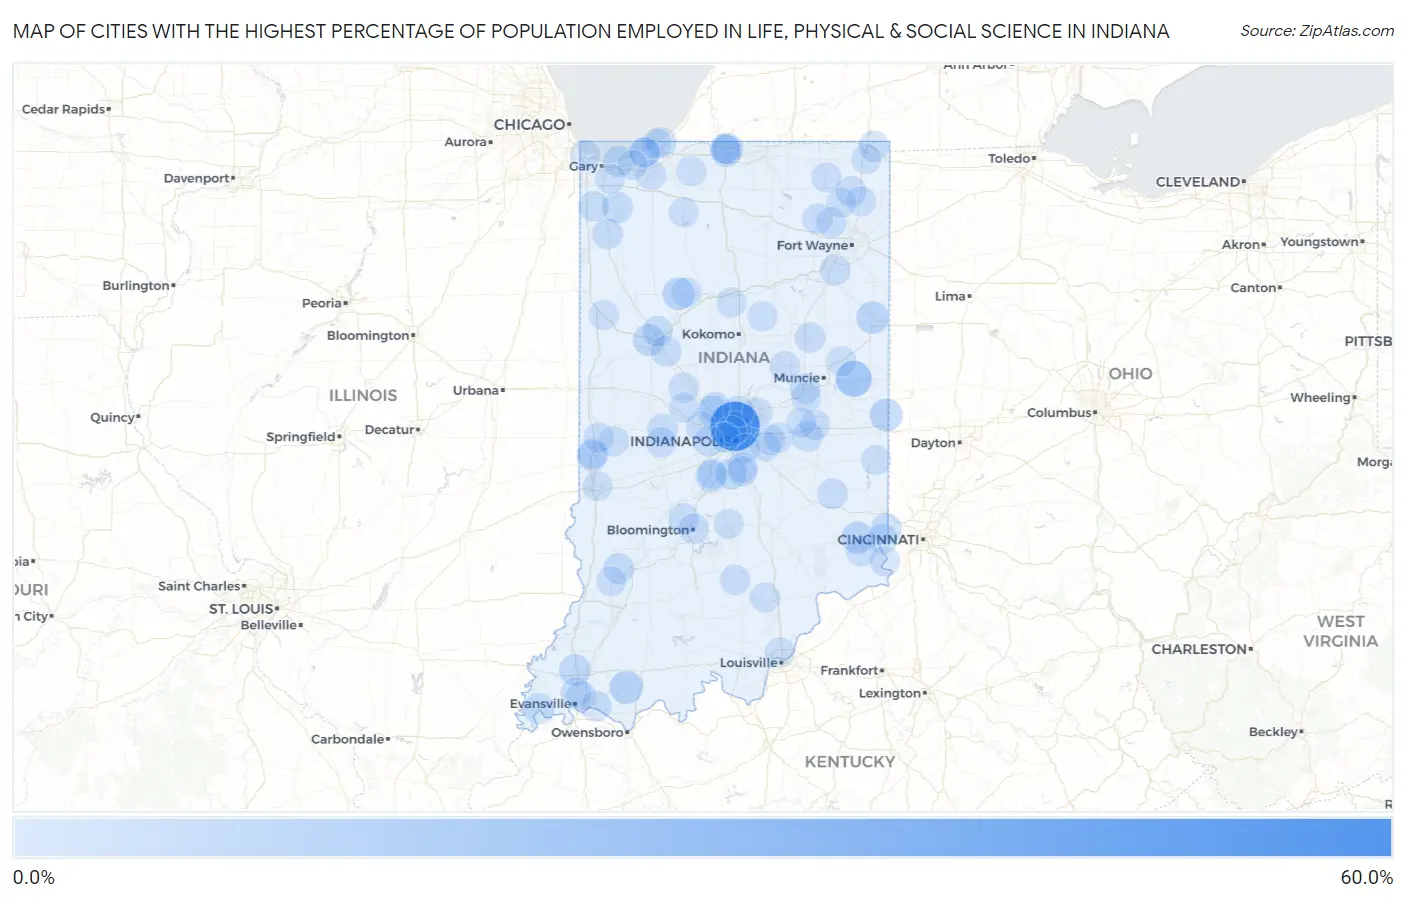
Map of Cities with the Highest Percentage of Population Employed in Life, Physical & Social Science in Indiana
0.0%
60.0%
Cities with the Highest Percentage of Population Employed in Life, Physical & Social Science in Indiana
| City | % Employed | vs State | vs National | |
| 1. | North Crows Nest | 55.8% | 0.83%(+55.0)#1 | 1.1%(+54.7)#10 |
| 2. | Groverton | 22.2% | 0.83%(+21.4)#2 | 1.1%(+21.1)#63 |
| 3. | Farmland | 17.1% | 0.83%(+16.2)#3 | 1.1%(+16.0)#96 |
| 4. | Hoffman Lake | 14.1% | 0.83%(+13.3)#4 | 1.1%(+13.1)#137 |
| 5. | Cory | 12.8% | 0.83%(+12.0)#5 | 1.1%(+11.7)#163 |
| 6. | Tennyson | 9.0% | 0.83%(+8.12)#6 | 1.1%(+7.86)#284 |
| 7. | Whitewater | 8.0% | 0.83%(+7.17)#7 | 1.1%(+6.91)#344 |
| 8. | Geneva | 7.4% | 0.83%(+6.60)#8 | 1.1%(+6.34)#382 |
| 9. | Idaville | 7.3% | 0.83%(+6.44)#9 | 1.1%(+6.18)#400 |
| 10. | Crows Nest | 6.9% | 0.83%(+6.07)#10 | 1.1%(+5.81)#444 |
| 11. | Moores Hill | 6.4% | 0.83%(+5.57)#11 | 1.1%(+5.31)#513 |
| 12. | Nineveh | 6.2% | 0.83%(+5.34)#12 | 1.1%(+5.08)#554 |
| 13. | West Lafayette | 5.8% | 0.83%(+4.95)#13 | 1.1%(+4.69)#617 |
| 14. | Haubstadt | 5.3% | 0.83%(+4.51)#14 | 1.1%(+4.25)#707 |
| 15. | Bethany | 4.8% | 0.83%(+3.93)#15 | 1.1%(+3.67)#859 |
| 16. | Notre Dame | 4.4% | 0.83%(+3.56)#16 | 1.1%(+3.30)#998 |
| 17. | Ogden Dunes | 4.0% | 0.83%(+3.21)#17 | 1.1%(+2.95)#1,137 |
| 18. | Gilmer Park | 3.9% | 0.83%(+3.10)#18 | 1.1%(+2.84)#1,208 |
| 19. | Hidden Valley | 3.8% | 0.83%(+2.99)#19 | 1.1%(+2.73)#1,265 |
| 20. | Mount Vernon | 3.8% | 0.83%(+2.97)#20 | 1.1%(+2.71)#1,275 |
| 21. | Whitestown | 3.7% | 0.83%(+2.90)#21 | 1.1%(+2.64)#1,301 |
| 22. | Hebron | 3.7% | 0.83%(+2.89)#22 | 1.1%(+2.63)#1,313 |
| 23. | Indian Village | 3.7% | 0.83%(+2.87)#23 | 1.1%(+2.61)#1,327 |
| 24. | Sandborn | 3.7% | 0.83%(+2.85)#24 | 1.1%(+2.59)#1,346 |
| 25. | Wynnedale | 3.5% | 0.83%(+2.65)#25 | 1.1%(+2.39)#1,499 |
| 26. | Bargersville | 3.5% | 0.83%(+2.64)#26 | 1.1%(+2.38)#1,506 |
| 27. | Knightstown | 3.4% | 0.83%(+2.58)#27 | 1.1%(+2.32)#1,546 |
| 28. | Ellettsville | 3.4% | 0.83%(+2.53)#28 | 1.1%(+2.27)#1,570 |
| 29. | Dayton | 3.3% | 0.83%(+2.51)#29 | 1.1%(+2.25)#1,580 |
| 30. | Carmel | 3.2% | 0.83%(+2.33)#30 | 1.1%(+2.07)#1,727 |
| 31. | Roselawn | 3.1% | 0.83%(+2.27)#31 | 1.1%(+2.01)#1,791 |
| 32. | Fremont | 2.8% | 0.83%(+1.93)#32 | 1.1%(+1.67)#2,139 |
| 33. | Lake Santee | 2.7% | 0.83%(+1.88)#33 | 1.1%(+1.62)#2,213 |
| 34. | Avon | 2.7% | 0.83%(+1.85)#34 | 1.1%(+1.59)#2,242 |
| 35. | Clinton | 2.6% | 0.83%(+1.82)#35 | 1.1%(+1.56)#2,283 |
| 36. | Newburgh | 2.6% | 0.83%(+1.81)#36 | 1.1%(+1.55)#2,295 |
| 37. | Lake Dalecarlia | 2.6% | 0.83%(+1.80)#37 | 1.1%(+1.54)#2,314 |
| 38. | Roachdale | 2.6% | 0.83%(+1.78)#38 | 1.1%(+1.53)#2,331 |
| 39. | Zanesville | 2.6% | 0.83%(+1.74)#39 | 1.1%(+1.48)#2,394 |
| 40. | Zionsville | 2.6% | 0.83%(+1.73)#40 | 1.1%(+1.47)#2,404 |
| 41. | Battle Ground | 2.6% | 0.83%(+1.72)#41 | 1.1%(+1.46)#2,430 |
| 42. | Bloomington | 2.5% | 0.83%(+1.69)#42 | 1.1%(+1.43)#2,487 |
| 43. | Orestes | 2.5% | 0.83%(+1.68)#43 | 1.1%(+1.42)#2,499 |
| 44. | Whiting | 2.4% | 0.83%(+1.58)#44 | 1.1%(+1.32)#2,657 |
| 45. | Daleville | 2.4% | 0.83%(+1.56)#45 | 1.1%(+1.30)#2,701 |
| 46. | Beverly Shores | 2.4% | 0.83%(+1.55)#46 | 1.1%(+1.29)#2,714 |
| 47. | Upland | 2.4% | 0.83%(+1.55)#47 | 1.1%(+1.29)#2,729 |
| 48. | Dillsboro | 2.3% | 0.83%(+1.45)#48 | 1.1%(+1.19)#2,888 |
| 49. | Bainbridge | 2.3% | 0.83%(+1.44)#49 | 1.1%(+1.18)#2,897 |
| 50. | Michiana Shores | 2.2% | 0.83%(+1.38)#50 | 1.1%(+1.12)#3,021 |
| 51. | Corunna | 2.2% | 0.83%(+1.37)#51 | 1.1%(+1.11)#3,042 |
| 52. | Highland | 2.2% | 0.83%(+1.36)#52 | 1.1%(+1.10)#3,051 |
| 53. | Tri Lakes | 2.2% | 0.83%(+1.35)#53 | 1.1%(+1.09)#3,074 |
| 54. | Fairview Park | 2.2% | 0.83%(+1.34)#54 | 1.1%(+1.08)#3,106 |
| 55. | Spring Lake | 2.0% | 0.83%(+1.21)#55 | 1.1%(+0.950)#3,346 |
| 56. | Churubusco | 2.0% | 0.83%(+1.17)#56 | 1.1%(+0.913)#3,418 |
| 57. | Pittsboro | 2.0% | 0.83%(+1.15)#57 | 1.1%(+0.888)#3,475 |
| 58. | Greensboro | 1.9% | 0.83%(+1.09)#58 | 1.1%(+0.832)#3,603 |
| 59. | Rockville | 1.9% | 0.83%(+1.06)#59 | 1.1%(+0.796)#3,696 |
| 60. | Lawrenceburg | 1.8% | 0.83%(+0.959)#60 | 1.1%(+0.699)#3,946 |
| 61. | Medora | 1.7% | 0.83%(+0.918)#61 | 1.1%(+0.658)#4,071 |
| 62. | Fishers | 1.7% | 0.83%(+0.894)#62 | 1.1%(+0.635)#4,132 |
| 63. | Roseland | 1.7% | 0.83%(+0.860)#63 | 1.1%(+0.600)#4,245 |
| 64. | Rising Sun | 1.7% | 0.83%(+0.825)#64 | 1.1%(+0.565)#4,328 |
| 65. | Greenwood | 1.6% | 0.83%(+0.799)#65 | 1.1%(+0.539)#4,407 |
| 66. | Wolcottville | 1.6% | 0.83%(+0.795)#66 | 1.1%(+0.535)#4,418 |
| 67. | Edwardsport | 1.6% | 0.83%(+0.744)#67 | 1.1%(+0.484)#4,576 |
| 68. | Melody Hill | 1.6% | 0.83%(+0.725)#68 | 1.1%(+0.465)#4,637 |
| 69. | Enchanted Hills | 1.5% | 0.83%(+0.712)#69 | 1.1%(+0.453)#4,667 |
| 70. | New Palestine | 1.5% | 0.83%(+0.700)#70 | 1.1%(+0.440)#4,728 |
| 71. | Nashville | 1.5% | 0.83%(+0.691)#71 | 1.1%(+0.431)#4,765 |
| 72. | Fish Lake | 1.5% | 0.83%(+0.671)#72 | 1.1%(+0.411)#4,824 |
| 73. | Montezuma | 1.5% | 0.83%(+0.661)#73 | 1.1%(+0.402)#4,879 |
| 74. | Auburn | 1.5% | 0.83%(+0.651)#74 | 1.1%(+0.392)#4,921 |
| 75. | Westville | 1.4% | 0.83%(+0.605)#75 | 1.1%(+0.345)#5,114 |
| 76. | Long Beach | 1.4% | 0.83%(+0.600)#76 | 1.1%(+0.340)#5,134 |
| 77. | Albany | 1.4% | 0.83%(+0.598)#77 | 1.1%(+0.339)#5,141 |
| 78. | Thorntown | 1.4% | 0.83%(+0.543)#78 | 1.1%(+0.284)#5,328 |
| 79. | Onward | 1.4% | 0.83%(+0.539)#79 | 1.1%(+0.279)#5,348 |
| 80. | Brooklyn | 1.4% | 0.83%(+0.528)#80 | 1.1%(+0.268)#5,396 |
| 81. | Middletown | 1.4% | 0.83%(+0.527)#81 | 1.1%(+0.267)#5,406 |
| 82. | Knox | 1.3% | 0.83%(+0.518)#82 | 1.1%(+0.258)#5,453 |
| 83. | Greenfield | 1.3% | 0.83%(+0.512)#83 | 1.1%(+0.253)#5,475 |
| 84. | Shirley | 1.3% | 0.83%(+0.508)#84 | 1.1%(+0.248)#5,486 |
| 85. | Town Of Pines | 1.3% | 0.83%(+0.507)#85 | 1.1%(+0.247)#5,493 |
| 86. | Avilla | 1.3% | 0.83%(+0.503)#86 | 1.1%(+0.243)#5,510 |
| 87. | Clarksville | 1.3% | 0.83%(+0.501)#87 | 1.1%(+0.241)#5,523 |
| 88. | Advance | 1.3% | 0.83%(+0.479)#88 | 1.1%(+0.219)#5,629 |
| 89. | Burnettsville | 1.3% | 0.83%(+0.476)#89 | 1.1%(+0.216)#5,640 |
| 90. | Beech Grove | 1.3% | 0.83%(+0.470)#90 | 1.1%(+0.211)#5,665 |
| 91. | Angola | 1.3% | 0.83%(+0.439)#91 | 1.1%(+0.179)#5,810 |
| 92. | New Whiteland | 1.3% | 0.83%(+0.424)#92 | 1.1%(+0.164)#5,885 |
| 93. | Amboy | 1.2% | 0.83%(+0.411)#93 | 1.1%(+0.151)#5,931 |
| 94. | Fowler | 1.2% | 0.83%(+0.409)#94 | 1.1%(+0.150)#5,941 |
| 95. | Hobart | 1.2% | 0.83%(+0.392)#95 | 1.1%(+0.132)#6,016 |
| 96. | Terre Haute | 1.2% | 0.83%(+0.377)#96 | 1.1%(+0.117)#6,089 |
| 97. | Speedway | 1.2% | 0.83%(+0.347)#97 | 1.1%(+0.087)#6,241 |
| 98. | Liberty | 1.2% | 0.83%(+0.345)#98 | 1.1%(+0.086)#6,246 |
| 99. | Chesterton | 1.2% | 0.83%(+0.344)#99 | 1.1%(+0.084)#6,256 |
| 100. | Little York | 1.2% | 0.83%(+0.332)#100 | 1.1%(+0.072)#6,317 |
Common Questions
What are the Top 10 Cities with the Highest Percentage of Population Employed in Life, Physical & Social Science in Indiana?
Top 10 Cities with the Highest Percentage of Population Employed in Life, Physical & Social Science in Indiana are:
#1
55.8%
#2
17.1%
#3
9.0%
#4
8.0%
#5
7.4%
#6
7.3%
#7
6.9%
#8
6.4%
#9
5.8%
#10
5.3%
What city has the Highest Percentage of Population Employed in Life, Physical & Social Science in Indiana?
North Crows Nest has the Highest Percentage of Population Employed in Life, Physical & Social Science in Indiana with 55.8%.
What is the Percentage of Population Employed in Life, Physical & Social Science in the State of Indiana?
Percentage of Population Employed in Life, Physical & Social Science in Indiana is 0.83%.
What is the Percentage of Population Employed in Life, Physical & Social Science in the United States?
Percentage of Population Employed in Life, Physical & Social Science in the United States is 1.1%.