Cities with the Highest Percentage of Population Employed in Life, Physical & Social Science in Kentucky
RELATED REPORTS & OPTIONS
Life, Physical & Social Science
Kentucky
Compare Cities
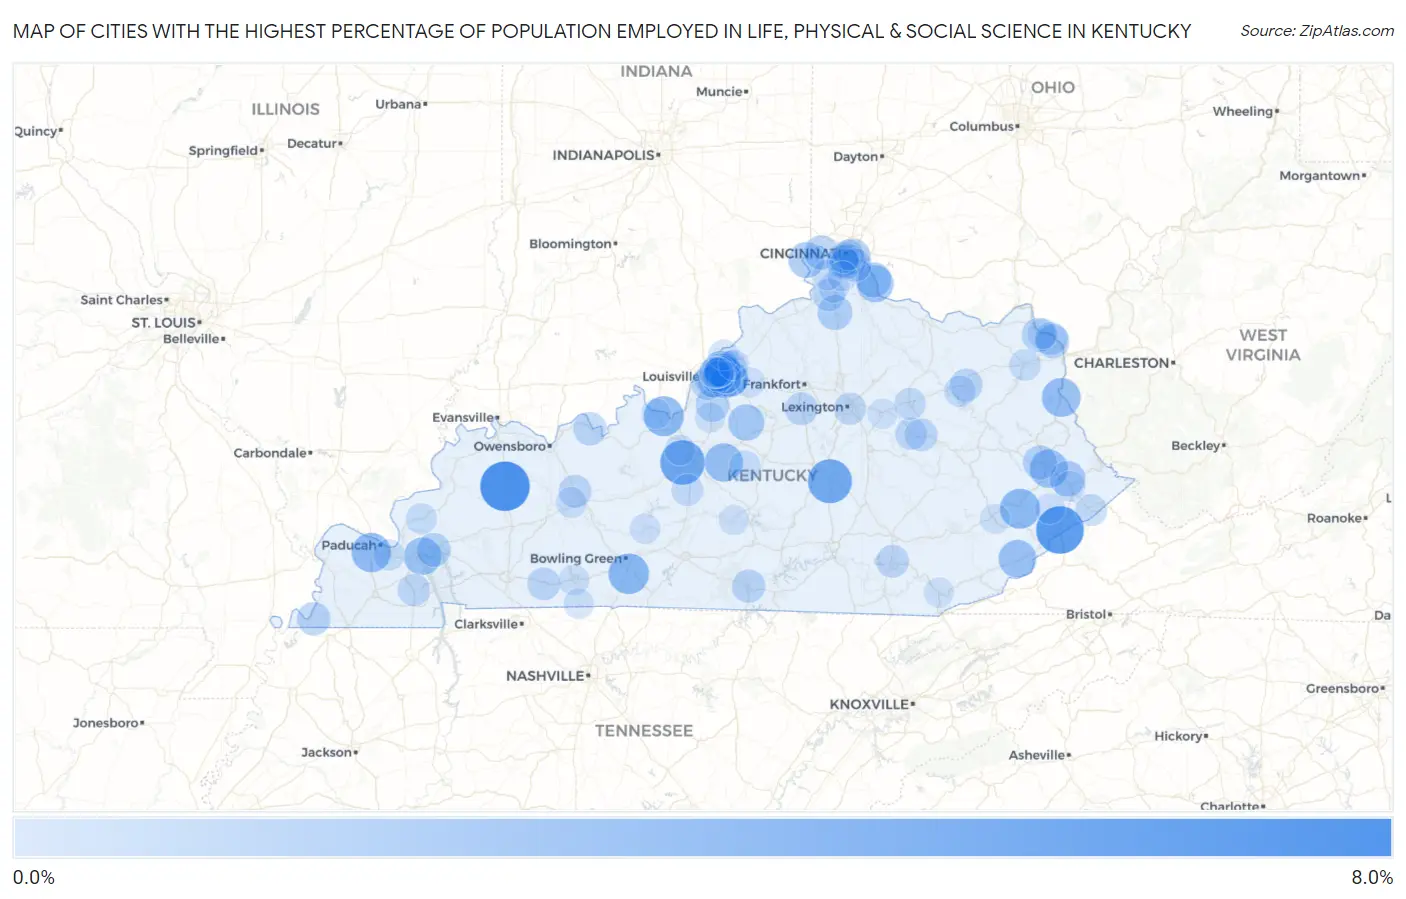
Map of Cities with the Highest Percentage of Population Employed in Life, Physical & Social Science in Kentucky
0.0%
8.0%
Cities with the Highest Percentage of Population Employed in Life, Physical & Social Science in Kentucky
| City | % Employed | vs State | vs National | |
| 1. | Slaughters | 7.7% | 0.77%(+6.93)#1 | 1.1%(+6.60)#366 |
| 2. | Jenkins | 7.0% | 0.77%(+6.26)#2 | 1.1%(+5.94)#431 |
| 3. | Cecilia | 5.9% | 0.77%(+5.15)#3 | 1.1%(+4.83)#595 |
| 4. | Stanford | 5.7% | 0.77%(+4.96)#4 | 1.1%(+4.64)#625 |
| 5. | Plano | 4.5% | 0.77%(+3.73)#5 | 1.1%(+3.41)#951 |
| 6. | Hindman | 4.3% | 0.77%(+3.58)#6 | 1.1%(+3.26)#1,020 |
| 7. | Doe Valley | 4.3% | 0.77%(+3.56)#7 | 1.1%(+3.24)#1,031 |
| 8. | Massac | 4.1% | 0.77%(+3.31)#8 | 1.1%(+2.99)#1,124 |
| 9. | Louisa | 3.9% | 0.77%(+3.13)#9 | 1.1%(+2.81)#1,225 |
| 10. | New Haven | 3.8% | 0.77%(+2.99)#10 | 1.1%(+2.67)#1,294 |
| 11. | Allen | 3.7% | 0.77%(+2.94)#11 | 1.1%(+2.61)#1,326 |
| 12. | Spring Valley | 3.5% | 0.77%(+2.78)#12 | 1.1%(+2.45)#1,442 |
| 13. | Cumberland | 3.5% | 0.77%(+2.76)#13 | 1.1%(+2.44)#1,455 |
| 14. | Grand Rivers | 3.4% | 0.77%(+2.68)#14 | 1.1%(+2.36)#1,515 |
| 15. | Mentor | 3.3% | 0.77%(+2.54)#15 | 1.1%(+2.21)#1,610 |
| 16. | Fairfield | 3.0% | 0.77%(+2.26)#16 | 1.1%(+1.94)#1,867 |
| 17. | Middletown | 2.9% | 0.77%(+2.14)#17 | 1.1%(+1.82)#1,961 |
| 18. | Woodland Hills | 2.9% | 0.77%(+2.14)#18 | 1.1%(+1.82)#1,963 |
| 19. | Petersburg | 2.8% | 0.77%(+2.08)#19 | 1.1%(+1.76)#2,016 |
| 20. | Coal Run Village | 2.8% | 0.77%(+2.02)#20 | 1.1%(+1.70)#2,106 |
| 21. | Fort Thomas | 2.8% | 0.77%(+1.99)#21 | 1.1%(+1.66)#2,150 |
| 22. | California | 2.6% | 0.77%(+1.86)#22 | 1.1%(+1.54)#2,313 |
| 23. | Dry Ridge | 2.6% | 0.77%(+1.79)#23 | 1.1%(+1.46)#2,434 |
| 24. | Manor Creek | 2.5% | 0.77%(+1.78)#24 | 1.1%(+1.46)#2,439 |
| 25. | Norwood | 2.5% | 0.77%(+1.77)#25 | 1.1%(+1.45)#2,459 |
| 26. | Wilder | 2.5% | 0.77%(+1.71)#26 | 1.1%(+1.39)#2,550 |
| 27. | Langdon Place | 2.5% | 0.77%(+1.70)#27 | 1.1%(+1.37)#2,582 |
| 28. | Seneca Gardens | 2.4% | 0.77%(+1.67)#28 | 1.1%(+1.35)#2,623 |
| 29. | Prestonsburg | 2.4% | 0.77%(+1.61)#29 | 1.1%(+1.28)#2,735 |
| 30. | Francisville | 2.4% | 0.77%(+1.59)#30 | 1.1%(+1.27)#2,756 |
| 31. | Greenup | 2.3% | 0.77%(+1.49)#31 | 1.1%(+1.17)#2,924 |
| 32. | Murray Hill | 2.3% | 0.77%(+1.49)#32 | 1.1%(+1.16)#2,936 |
| 33. | Kuttawa | 2.2% | 0.77%(+1.46)#33 | 1.1%(+1.13)#2,998 |
| 34. | Hillview | 2.2% | 0.77%(+1.43)#34 | 1.1%(+1.11)#3,045 |
| 35. | Bellefonte | 2.2% | 0.77%(+1.40)#35 | 1.1%(+1.07)#3,112 |
| 36. | Thornhill | 2.1% | 0.77%(+1.36)#36 | 1.1%(+1.04)#3,175 |
| 37. | Hickman | 2.1% | 0.77%(+1.31)#37 | 1.1%(+0.988)#3,266 |
| 38. | Barbourmeade | 2.1% | 0.77%(+1.30)#38 | 1.1%(+0.973)#3,288 |
| 39. | Burkesville | 2.0% | 0.77%(+1.27)#39 | 1.1%(+0.950)#3,336 |
| 40. | Hawesville | 2.0% | 0.77%(+1.27)#40 | 1.1%(+0.946)#3,356 |
| 41. | Cold Spring | 2.0% | 0.77%(+1.25)#41 | 1.1%(+0.926)#3,396 |
| 42. | Meadowbrook Farm | 2.0% | 0.77%(+1.23)#42 | 1.1%(+0.909)#3,430 |
| 43. | Hartford | 1.9% | 0.77%(+1.17)#43 | 1.1%(+0.847)#3,565 |
| 44. | Lawrenceburg | 1.9% | 0.77%(+1.16)#44 | 1.1%(+0.833)#3,594 |
| 45. | Russell | 1.9% | 0.77%(+1.11)#45 | 1.1%(+0.790)#3,713 |
| 46. | Coldstream | 1.8% | 0.77%(+1.08)#46 | 1.1%(+0.758)#3,802 |
| 47. | North Corbin | 1.8% | 0.77%(+1.08)#47 | 1.1%(+0.756)#3,807 |
| 48. | Elkton | 1.8% | 0.77%(+1.08)#48 | 1.1%(+0.756)#3,808 |
| 49. | Morehead | 1.8% | 0.77%(+1.06)#49 | 1.1%(+0.738)#3,852 |
| 50. | Stanton | 1.8% | 0.77%(+1.04)#50 | 1.1%(+0.713)#3,910 |
| 51. | Cambridge | 1.8% | 0.77%(+1.03)#51 | 1.1%(+0.711)#3,918 |
| 52. | Audubon Park | 1.8% | 0.77%(+1.02)#52 | 1.1%(+0.697)#3,952 |
| 53. | Verona | 1.8% | 0.77%(+1.01)#53 | 1.1%(+0.682)#4,006 |
| 54. | Fort Wright | 1.8% | 0.77%(+1.00)#54 | 1.1%(+0.680)#4,011 |
| 55. | Wildwood | 1.8% | 0.77%(+0.987)#55 | 1.1%(+0.663)#4,054 |
| 56. | Woodlawn Park | 1.7% | 0.77%(+0.944)#56 | 1.1%(+0.621)#4,184 |
| 57. | Hardin | 1.7% | 0.77%(+0.918)#57 | 1.1%(+0.594)#4,257 |
| 58. | Kingsley | 1.7% | 0.77%(+0.914)#58 | 1.1%(+0.590)#4,276 |
| 59. | St Matthews | 1.7% | 0.77%(+0.908)#59 | 1.1%(+0.584)#4,293 |
| 60. | Clay City | 1.7% | 0.77%(+0.903)#60 | 1.1%(+0.579)#4,301 |
| 61. | Lexington | 1.7% | 0.77%(+0.887)#61 | 1.1%(+0.563)#4,334 |
| 62. | Jeffersontown | 1.6% | 0.77%(+0.872)#62 | 1.1%(+0.548)#4,381 |
| 63. | Riverwood | 1.6% | 0.77%(+0.789)#63 | 1.1%(+0.466)#4,635 |
| 64. | Mount Sterling | 1.5% | 0.77%(+0.778)#64 | 1.1%(+0.454)#4,664 |
| 65. | Upton | 1.5% | 0.77%(+0.776)#65 | 1.1%(+0.452)#4,673 |
| 66. | Elkhorn City | 1.5% | 0.77%(+0.739)#66 | 1.1%(+0.415)#4,815 |
| 67. | Grayson | 1.5% | 0.77%(+0.705)#67 | 1.1%(+0.381)#4,965 |
| 68. | Lakeview Heights | 1.5% | 0.77%(+0.703)#68 | 1.1%(+0.380)#4,975 |
| 69. | Loretto | 1.5% | 0.77%(+0.687)#69 | 1.1%(+0.364)#5,040 |
| 70. | Blue Ridge Manor | 1.4% | 0.77%(+0.639)#70 | 1.1%(+0.315)#5,223 |
| 71. | Reidland | 1.4% | 0.77%(+0.604)#71 | 1.1%(+0.280)#5,344 |
| 72. | Beechwood Village | 1.3% | 0.77%(+0.554)#72 | 1.1%(+0.231)#5,573 |
| 73. | Salem | 1.3% | 0.77%(+0.503)#73 | 1.1%(+0.179)#5,814 |
| 74. | Mchenry | 1.2% | 0.77%(+0.475)#74 | 1.1%(+0.151)#5,932 |
| 75. | Covington | 1.2% | 0.77%(+0.453)#75 | 1.1%(+0.130)#6,027 |
| 76. | Park Hills | 1.2% | 0.77%(+0.438)#76 | 1.1%(+0.114)#6,097 |
| 77. | Northfield | 1.2% | 0.77%(+0.435)#77 | 1.1%(+0.111)#6,118 |
| 78. | Russellville | 1.2% | 0.77%(+0.429)#78 | 1.1%(+0.105)#6,148 |
| 79. | Rineyville | 1.2% | 0.77%(+0.418)#79 | 1.1%(+0.095)#6,204 |
| 80. | Newport | 1.2% | 0.77%(+0.411)#80 | 1.1%(+0.087)#6,240 |
| 81. | Pikeville | 1.2% | 0.77%(+0.408)#81 | 1.1%(+0.084)#6,257 |
| 82. | Walton | 1.2% | 0.77%(+0.408)#82 | 1.1%(+0.084)#6,260 |
| 83. | Goshen | 1.2% | 0.77%(+0.403)#83 | 1.1%(+0.080)#6,278 |
| 84. | Old Brownsboro Place | 1.2% | 0.77%(+0.389)#84 | 1.1%(+0.065)#6,339 |
| 85. | Indian Hills | 1.1% | 0.77%(+0.372)#85 | 1.1%(+0.048)#6,421 |
| 86. | Crestwood | 1.1% | 0.77%(+0.371)#86 | 1.1%(+0.048)#6,424 |
| 87. | Union | 1.1% | 0.77%(+0.342)#87 | 1.1%(+0.019)#6,588 |
| 88. | Wheelwright | 1.1% | 0.77%(+0.338)#88 | 1.1%(+0.014)#6,605 |
| 89. | Brownsville | 1.1% | 0.77%(+0.308)#89 | 1.1%(-0.016)#6,772 |
| 90. | Wurtland | 1.1% | 0.77%(+0.288)#90 | 1.1%(-0.036)#6,858 |
| 91. | Adairville | 1.1% | 0.77%(+0.286)#91 | 1.1%(-0.038)#6,870 |
| 92. | Simpsonville | 1.0% | 0.77%(+0.268)#92 | 1.1%(-0.055)#6,955 |
| 93. | Shepherdsville | 1.0% | 0.77%(+0.265)#93 | 1.1%(-0.058)#6,971 |
| 94. | Independence | 1.0% | 0.77%(+0.258)#94 | 1.1%(-0.066)#7,020 |
| 95. | Winchester | 1.0% | 0.77%(+0.243)#95 | 1.1%(-0.081)#7,111 |
| 96. | Greensburg | 1.0% | 0.77%(+0.235)#96 | 1.1%(-0.088)#7,156 |
| 97. | Brandenburg | 1.0% | 0.77%(+0.234)#97 | 1.1%(-0.090)#7,166 |
| 98. | Hazard | 1.00% | 0.77%(+0.232)#98 | 1.1%(-0.092)#7,188 |
| 99. | Pineville | 0.99% | 0.77%(+0.223)#99 | 1.1%(-0.101)#7,233 |
| 100. | Crossgate | 0.99% | 0.77%(+0.223)#100 | 1.1%(-0.101)#7,240 |
Common Questions
What are the Top 10 Cities with the Highest Percentage of Population Employed in Life, Physical & Social Science in Kentucky?
Top 10 Cities with the Highest Percentage of Population Employed in Life, Physical & Social Science in Kentucky are:
#1
7.7%
#2
7.0%
#3
5.9%
#4
5.7%
#5
4.5%
#6
4.3%
#7
4.3%
#8
4.1%
#9
3.9%
#10
3.8%
What city has the Highest Percentage of Population Employed in Life, Physical & Social Science in Kentucky?
Slaughters has the Highest Percentage of Population Employed in Life, Physical & Social Science in Kentucky with 7.7%.
What is the Percentage of Population Employed in Life, Physical & Social Science in the State of Kentucky?
Percentage of Population Employed in Life, Physical & Social Science in Kentucky is 0.77%.
What is the Percentage of Population Employed in Life, Physical & Social Science in the United States?
Percentage of Population Employed in Life, Physical & Social Science in the United States is 1.1%.