Cities with the Highest Percentage of Population Employed in Life, Physical & Social Science in Minnesota
RELATED REPORTS & OPTIONS
Life, Physical & Social Science
Minnesota
Compare Cities
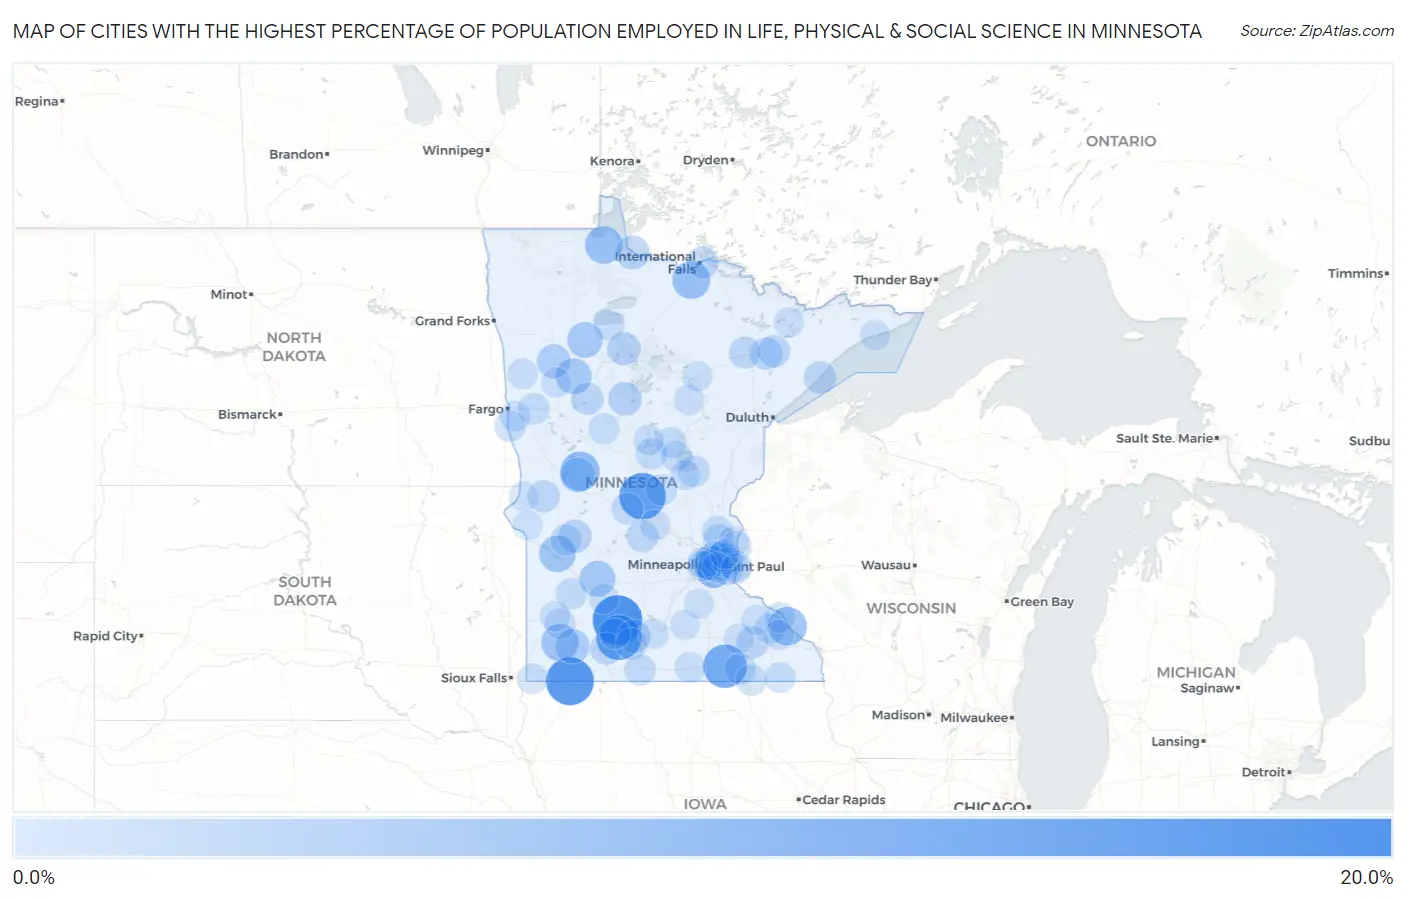
Map of Cities with the Highest Percentage of Population Employed in Life, Physical & Social Science in Minnesota
0.0%
20.0%
Cities with the Highest Percentage of Population Employed in Life, Physical & Social Science in Minnesota
| City | % Employed | vs State | vs National | |
| 1. | Cobden | 15.4% | 1.2%(+14.1)#1 | 1.1%(+14.3)#111 |
| 2. | Bigelow | 14.2% | 1.2%(+12.9)#2 | 1.1%(+13.1)#136 |
| 3. | Bowlus | 13.2% | 1.2%(+11.9)#3 | 1.1%(+12.1)#154 |
| 4. | Darfur | 12.2% | 1.2%(+11.0)#4 | 1.1%(+11.2)#169 |
| 5. | Mapleview | 11.1% | 1.2%(+9.88)#5 | 1.1%(+10.0)#195 |
| 6. | Urbank | 8.0% | 1.2%(+6.76)#6 | 1.1%(+6.91)#346 |
| 7. | Minneiska | 7.6% | 1.2%(+6.34)#7 | 1.1%(+6.48)#374 |
| 8. | Littlefork | 7.2% | 1.2%(+5.93)#8 | 1.1%(+6.07)#412 |
| 9. | Roosevelt | 6.9% | 1.2%(+5.70)#9 | 1.1%(+5.84)#440 |
| 10. | Essig | 6.8% | 1.2%(+5.58)#10 | 1.1%(+5.73)#456 |
| 11. | Hadley | 6.7% | 1.2%(+5.43)#11 | 1.1%(+5.58)#474 |
| 12. | Milan | 6.2% | 1.2%(+4.98)#12 | 1.1%(+5.12)#550 |
| 13. | Naytahwaush | 5.7% | 1.2%(+4.48)#13 | 1.1%(+4.62)#627 |
| 14. | Renville | 5.7% | 1.2%(+4.42)#14 | 1.1%(+4.57)#641 |
| 15. | Clearbrook | 5.6% | 1.2%(+4.32)#15 | 1.1%(+4.46)#653 |
| 16. | Falcon Heights | 5.3% | 1.2%(+4.06)#16 | 1.1%(+4.20)#725 |
| 17. | Lauderdale | 5.3% | 1.2%(+4.02)#17 | 1.1%(+4.16)#736 |
| 18. | Avoca | 4.9% | 1.2%(+3.64)#18 | 1.1%(+3.79)#821 |
| 19. | Millerville | 4.8% | 1.2%(+3.60)#19 | 1.1%(+3.75)#834 |
| 20. | Bejou | 4.4% | 1.2%(+3.21)#20 | 1.1%(+3.35)#975 |
| 21. | Baudette | 4.4% | 1.2%(+3.14)#21 | 1.1%(+3.29)#1,005 |
| 22. | Mendota | 4.3% | 1.2%(+3.05)#22 | 1.1%(+3.19)#1,043 |
| 23. | Akeley | 4.2% | 1.2%(+2.97)#23 | 1.1%(+3.11)#1,079 |
| 24. | La Salle | 4.1% | 1.2%(+2.85)#24 | 1.1%(+2.99)#1,123 |
| 25. | Turtle River | 4.0% | 1.2%(+2.76)#25 | 1.1%(+2.91)#1,172 |
| 26. | Mendota Heights | 4.0% | 1.2%(+2.72)#26 | 1.1%(+2.86)#1,194 |
| 27. | Benson | 3.9% | 1.2%(+2.70)#27 | 1.1%(+2.85)#1,203 |
| 28. | Pine Point | 3.4% | 1.2%(+2.21)#28 | 1.1%(+2.36)#1,516 |
| 29. | Beaver Bay | 3.4% | 1.2%(+2.21)#29 | 1.1%(+2.36)#1,521 |
| 30. | Aurora | 3.4% | 1.2%(+2.17)#30 | 1.1%(+2.31)#1,547 |
| 31. | Bingham Lake | 3.3% | 1.2%(+2.10)#31 | 1.1%(+2.24)#1,588 |
| 32. | Hoyt Lakes | 3.3% | 1.2%(+2.09)#32 | 1.1%(+2.23)#1,595 |
| 33. | Herman | 3.3% | 1.2%(+2.04)#33 | 1.1%(+2.19)#1,629 |
| 34. | Rochester | 3.2% | 1.2%(+2.01)#34 | 1.1%(+2.15)#1,659 |
| 35. | Ranier | 3.2% | 1.2%(+1.97)#35 | 1.1%(+2.11)#1,696 |
| 36. | Mountain Iron | 3.1% | 1.2%(+1.90)#36 | 1.1%(+2.05)#1,749 |
| 37. | Watkins | 3.1% | 1.2%(+1.88)#37 | 1.1%(+2.03)#1,777 |
| 38. | Wahkon | 3.0% | 1.2%(+1.76)#38 | 1.1%(+1.91)#1,884 |
| 39. | Freeport | 3.0% | 1.2%(+1.76)#39 | 1.1%(+1.90)#1,889 |
| 40. | St James | 2.9% | 1.2%(+1.69)#40 | 1.1%(+1.84)#1,942 |
| 41. | Fairmont | 2.8% | 1.2%(+1.55)#41 | 1.1%(+1.70)#2,098 |
| 42. | Hawley | 2.8% | 1.2%(+1.53)#42 | 1.1%(+1.68)#2,130 |
| 43. | Danvers | 2.7% | 1.2%(+1.50)#43 | 1.1%(+1.65)#2,174 |
| 44. | Elkton | 2.7% | 1.2%(+1.50)#44 | 1.1%(+1.65)#2,175 |
| 45. | Baxter | 2.7% | 1.2%(+1.50)#45 | 1.1%(+1.65)#2,179 |
| 46. | Columbus | 2.7% | 1.2%(+1.48)#46 | 1.1%(+1.62)#2,209 |
| 47. | Cottonwood | 2.6% | 1.2%(+1.40)#47 | 1.1%(+1.54)#2,304 |
| 48. | Little Canada | 2.6% | 1.2%(+1.39)#48 | 1.1%(+1.54)#2,315 |
| 49. | Martin Lake | 2.6% | 1.2%(+1.39)#49 | 1.1%(+1.54)#2,318 |
| 50. | Buckman | 2.6% | 1.2%(+1.38)#50 | 1.1%(+1.52)#2,336 |
| 51. | Le Roy | 2.6% | 1.2%(+1.36)#51 | 1.1%(+1.51)#2,363 |
| 52. | Vadnais Heights | 2.6% | 1.2%(+1.35)#52 | 1.1%(+1.50)#2,375 |
| 53. | Comstock | 2.6% | 1.2%(+1.33)#53 | 1.1%(+1.47)#2,414 |
| 54. | Pine Springs | 2.5% | 1.2%(+1.30)#54 | 1.1%(+1.45)#2,458 |
| 55. | Dresbach | 2.5% | 1.2%(+1.24)#55 | 1.1%(+1.39)#2,552 |
| 56. | Harmony | 2.4% | 1.2%(+1.17)#56 | 1.1%(+1.32)#2,663 |
| 57. | Sebeka | 2.4% | 1.2%(+1.17)#57 | 1.1%(+1.32)#2,664 |
| 58. | Deerwood | 2.4% | 1.2%(+1.17)#58 | 1.1%(+1.32)#2,665 |
| 59. | Shoreview | 2.4% | 1.2%(+1.16)#59 | 1.1%(+1.30)#2,690 |
| 60. | Plainview | 2.4% | 1.2%(+1.15)#60 | 1.1%(+1.29)#2,705 |
| 61. | Balaton | 2.4% | 1.2%(+1.15)#61 | 1.1%(+1.29)#2,715 |
| 62. | Garrison | 2.4% | 1.2%(+1.15)#62 | 1.1%(+1.29)#2,718 |
| 63. | Golden Valley | 2.4% | 1.2%(+1.12)#63 | 1.1%(+1.26)#2,771 |
| 64. | Woodbury | 2.3% | 1.2%(+1.10)#64 | 1.1%(+1.25)#2,797 |
| 65. | Red Lake | 2.3% | 1.2%(+1.07)#65 | 1.1%(+1.22)#2,843 |
| 66. | Alden | 2.3% | 1.2%(+1.07)#66 | 1.1%(+1.21)#2,846 |
| 67. | Ada | 2.3% | 1.2%(+1.05)#67 | 1.1%(+1.20)#2,867 |
| 68. | Comfrey | 2.3% | 1.2%(+1.04)#68 | 1.1%(+1.18)#2,900 |
| 69. | Roseville | 2.3% | 1.2%(+1.02)#69 | 1.1%(+1.17)#2,931 |
| 70. | Kellogg | 2.2% | 1.2%(+1.01)#70 | 1.1%(+1.16)#2,953 |
| 71. | Sabin | 2.2% | 1.2%(+1.01)#71 | 1.1%(+1.15)#2,963 |
| 72. | Marine On St Croix | 2.2% | 1.2%(+0.987)#72 | 1.1%(+1.13)#2,997 |
| 73. | Lake Elmo | 2.2% | 1.2%(+0.968)#73 | 1.1%(+1.11)#3,029 |
| 74. | Hills | 2.2% | 1.2%(+0.965)#74 | 1.1%(+1.11)#3,034 |
| 75. | Lakeland | 2.2% | 1.2%(+0.955)#75 | 1.1%(+1.10)#3,056 |
| 76. | Nisswa | 2.2% | 1.2%(+0.948)#76 | 1.1%(+1.09)#3,068 |
| 77. | White Bear Lake | 2.2% | 1.2%(+0.941)#77 | 1.1%(+1.09)#3,079 |
| 78. | Minneapolis | 2.2% | 1.2%(+0.930)#78 | 1.1%(+1.07)#3,110 |
| 79. | St Augusta | 2.1% | 1.2%(+0.907)#79 | 1.1%(+1.05)#3,145 |
| 80. | St Paul | 2.1% | 1.2%(+0.864)#80 | 1.1%(+1.01)#3,225 |
| 81. | St Louis Park | 2.1% | 1.2%(+0.861)#81 | 1.1%(+1.01)#3,233 |
| 82. | Scandia | 2.1% | 1.2%(+0.856)#82 | 1.1%(+1.00)#3,243 |
| 83. | Kasson | 2.1% | 1.2%(+0.847)#83 | 1.1%(+0.991)#3,261 |
| 84. | Grand Marais | 2.1% | 1.2%(+0.845)#84 | 1.1%(+0.990)#3,264 |
| 85. | Russell | 2.1% | 1.2%(+0.834)#85 | 1.1%(+0.978)#3,281 |
| 86. | Lake St Croix Beach | 2.0% | 1.2%(+0.814)#86 | 1.1%(+0.959)#3,321 |
| 87. | Onamia | 2.0% | 1.2%(+0.805)#87 | 1.1%(+0.950)#3,338 |
| 88. | Zumbro Falls | 2.0% | 1.2%(+0.785)#88 | 1.1%(+0.929)#3,392 |
| 89. | Redwood Falls | 2.0% | 1.2%(+0.769)#89 | 1.1%(+0.913)#3,417 |
| 90. | Hill City | 2.0% | 1.2%(+0.765)#90 | 1.1%(+0.909)#3,425 |
| 91. | Waubun | 2.0% | 1.2%(+0.751)#91 | 1.1%(+0.896)#3,453 |
| 92. | Lake Crystal | 2.0% | 1.2%(+0.742)#92 | 1.1%(+0.887)#3,478 |
| 93. | Ely | 2.0% | 1.2%(+0.730)#93 | 1.1%(+0.875)#3,507 |
| 94. | Coleraine | 2.0% | 1.2%(+0.728)#94 | 1.1%(+0.872)#3,510 |
| 95. | Elba | 2.0% | 1.2%(+0.725)#95 | 1.1%(+0.870)#3,519 |
| 96. | Wheaton | 1.9% | 1.2%(+0.659)#96 | 1.1%(+0.803)#3,672 |
| 97. | Dellwood | 1.9% | 1.2%(+0.655)#97 | 1.1%(+0.799)#3,686 |
| 98. | Elysian | 1.9% | 1.2%(+0.646)#98 | 1.1%(+0.791)#3,712 |
| 99. | Clinton | 1.9% | 1.2%(+0.640)#99 | 1.1%(+0.784)#3,736 |
| 100. | Lonsdale | 1.8% | 1.2%(+0.602)#100 | 1.1%(+0.747)#3,830 |
Common Questions
What are the Top 10 Cities with the Highest Percentage of Population Employed in Life, Physical & Social Science in Minnesota?
Top 10 Cities with the Highest Percentage of Population Employed in Life, Physical & Social Science in Minnesota are:
What city has the Highest Percentage of Population Employed in Life, Physical & Social Science in Minnesota?
Cobden has the Highest Percentage of Population Employed in Life, Physical & Social Science in Minnesota with 15.4%.
What is the Percentage of Population Employed in Life, Physical & Social Science in the State of Minnesota?
Percentage of Population Employed in Life, Physical & Social Science in Minnesota is 1.2%.
What is the Percentage of Population Employed in Life, Physical & Social Science in the United States?
Percentage of Population Employed in Life, Physical & Social Science in the United States is 1.1%.