Cities with the Highest Percentage of Population with a Degree in Physical and Health Sciences in Maryland
RELATED REPORTS & OPTIONS
Physical and Health Sciences
Maryland
Compare Cities
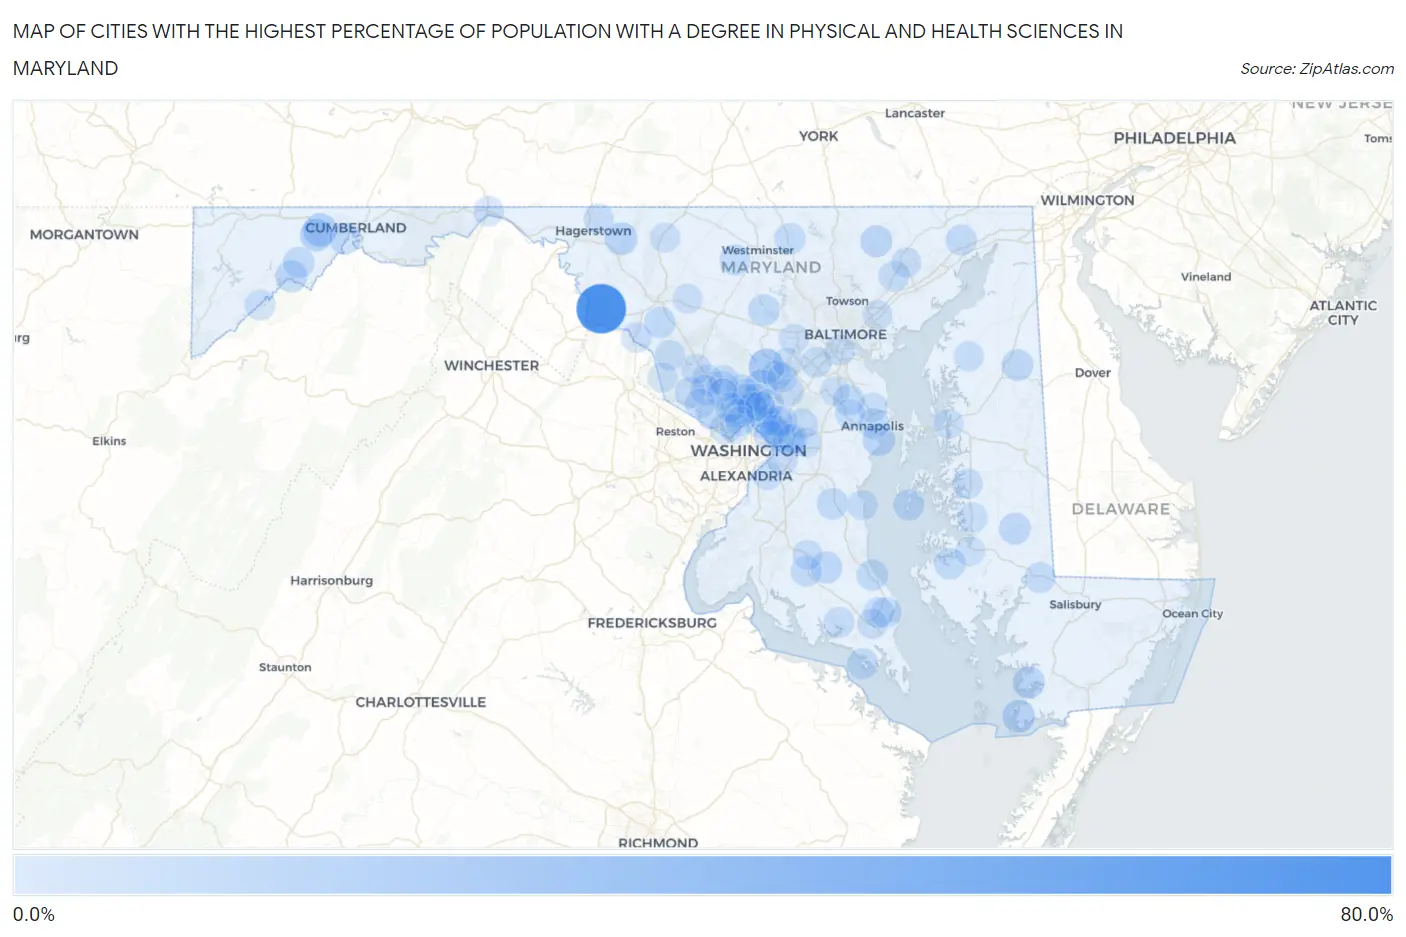
Map of Cities with the Highest Percentage of Population with a Degree in Physical and Health Sciences in Maryland
0.0%
80.0%
Cities with the Highest Percentage of Population with a Degree in Physical and Health Sciences in Maryland
| City | % Graduates | vs State | vs National | |
| 1. | Yarrowsburg | 71.7% | 3.6%(+68.1)#1 | 3.1%(+68.6)#34 |
| 2. | Highland | 20.8% | 3.6%(+17.3)#2 | 3.1%(+17.7)#510 |
| 3. | Grahamtown | 16.0% | 3.6%(+12.4)#3 | 3.1%(+12.9)#788 |
| 4. | Crisfield | 13.0% | 3.6%(+9.44)#4 | 3.1%(+9.93)#1,101 |
| 5. | Shaft | 13.0% | 3.6%(+9.38)#5 | 3.1%(+9.86)#1,108 |
| 6. | Jugtown | 12.8% | 3.6%(+9.24)#6 | 3.1%(+9.72)#1,125 |
| 7. | Fairmount | 11.6% | 3.6%(+8.06)#7 | 3.1%(+8.54)#1,273 |
| 8. | Highland Beach | 11.6% | 3.6%(+8.04)#8 | 3.1%(+8.53)#1,278 |
| 9. | Westernport | 11.1% | 3.6%(+7.48)#9 | 3.1%(+7.96)#1,370 |
| 10. | Jarrettsville | 10.9% | 3.6%(+7.29)#10 | 3.1%(+7.78)#1,395 |
| 11. | Golden Beach | 10.5% | 3.6%(+6.94)#11 | 3.1%(+7.43)#1,460 |
| 12. | Hurlock | 10.5% | 3.6%(+6.94)#12 | 3.1%(+7.43)#1,461 |
| 13. | Sudlersville | 10.0% | 3.6%(+6.42)#13 | 3.1%(+6.90)#1,604 |
| 14. | Potomac Park | 9.8% | 3.6%(+6.22)#14 | 3.1%(+6.70)#1,649 |
| 15. | Langley Park | 9.5% | 3.6%(+5.96)#15 | 3.1%(+6.44)#1,712 |
| 16. | Glenarden | 9.4% | 3.6%(+5.83)#16 | 3.1%(+6.31)#1,748 |
| 17. | Garrett Park | 9.1% | 3.6%(+5.52)#17 | 3.1%(+6.01)#1,828 |
| 18. | Dunkirk | 9.1% | 3.6%(+5.52)#18 | 3.1%(+6.00)#1,829 |
| 19. | Barton | 9.1% | 3.6%(+5.51)#19 | 3.1%(+5.99)#1,842 |
| 20. | Church Creek | 9.1% | 3.6%(+5.51)#20 | 3.1%(+5.99)#1,865 |
| 21. | Sykesville | 9.0% | 3.6%(+5.46)#21 | 3.1%(+5.95)#1,874 |
| 22. | Buckeystown | 8.9% | 3.6%(+5.27)#22 | 3.1%(+5.76)#1,937 |
| 23. | Spencerville | 8.8% | 3.6%(+5.27)#23 | 3.1%(+5.75)#1,939 |
| 24. | Arden On The Severn | 8.7% | 3.6%(+5.16)#24 | 3.1%(+5.64)#1,965 |
| 25. | Tilghman Island | 8.7% | 3.6%(+5.08)#25 | 3.1%(+5.57)#1,998 |
| 26. | Landover Hills | 8.6% | 3.6%(+5.06)#26 | 3.1%(+5.54)#2,006 |
| 27. | St Leonard | 8.5% | 3.6%(+4.96)#27 | 3.1%(+5.45)#2,044 |
| 28. | Naval Academy | 8.2% | 3.6%(+4.66)#28 | 3.1%(+5.14)#2,140 |
| 29. | Tall Timbers | 8.1% | 3.6%(+4.52)#29 | 3.1%(+5.01)#2,188 |
| 30. | Hampstead | 8.1% | 3.6%(+4.52)#30 | 3.1%(+5.00)#2,192 |
| 31. | Charlotte Hall | 8.0% | 3.6%(+4.39)#31 | 3.1%(+4.87)#2,256 |
| 32. | Leisure World | 7.6% | 3.6%(+4.06)#32 | 3.1%(+4.54)#2,406 |
| 33. | Port Deposit | 7.6% | 3.6%(+3.98)#33 | 3.1%(+4.47)#2,443 |
| 34. | Mardela Springs | 7.4% | 3.6%(+3.82)#34 | 3.1%(+4.31)#2,521 |
| 35. | New Windsor | 7.3% | 3.6%(+3.77)#35 | 3.1%(+4.25)#2,555 |
| 36. | Leonardtown | 7.3% | 3.6%(+3.73)#36 | 3.1%(+4.22)#2,564 |
| 37. | Baltimore Highlands | 7.1% | 3.6%(+3.56)#37 | 3.1%(+4.04)#2,672 |
| 38. | Drum Point | 7.1% | 3.6%(+3.47)#38 | 3.1%(+3.95)#2,752 |
| 39. | Adelphi | 7.0% | 3.6%(+3.39)#39 | 3.1%(+3.88)#2,795 |
| 40. | Layhill | 6.9% | 3.6%(+3.31)#40 | 3.1%(+3.80)#2,849 |
| 41. | Derwood | 6.8% | 3.6%(+3.20)#41 | 3.1%(+3.69)#2,916 |
| 42. | Hillandale | 6.8% | 3.6%(+3.19)#42 | 3.1%(+3.68)#2,924 |
| 43. | Glen Echo | 6.7% | 3.6%(+3.15)#43 | 3.1%(+3.64)#2,942 |
| 44. | Glenn Dale | 6.7% | 3.6%(+3.15)#44 | 3.1%(+3.63)#2,943 |
| 45. | Solomons | 6.7% | 3.6%(+3.12)#45 | 3.1%(+3.60)#2,962 |
| 46. | Kitzmiller | 6.7% | 3.6%(+3.08)#46 | 3.1%(+3.57)#2,998 |
| 47. | Gaithersburg | 6.7% | 3.6%(+3.08)#47 | 3.1%(+3.56)#3,004 |
| 48. | Darnestown | 6.6% | 3.6%(+3.03)#48 | 3.1%(+3.51)#3,023 |
| 49. | Pleasant Hills | 6.5% | 3.6%(+2.94)#49 | 3.1%(+3.42)#3,065 |
| 50. | Laurel | 6.3% | 3.6%(+2.76)#50 | 3.1%(+3.24)#3,192 |
| 51. | Elkridge | 6.2% | 3.6%(+2.62)#51 | 3.1%(+3.11)#3,304 |
| 52. | Point Of Rocks | 6.0% | 3.6%(+2.46)#52 | 3.1%(+2.94)#3,428 |
| 53. | Redland | 6.0% | 3.6%(+2.43)#53 | 3.1%(+2.92)#3,445 |
| 54. | Greenbelt | 6.0% | 3.6%(+2.37)#54 | 3.1%(+2.86)#3,496 |
| 55. | Colesville | 6.0% | 3.6%(+2.37)#55 | 3.1%(+2.86)#3,500 |
| 56. | Hancock | 5.9% | 3.6%(+2.36)#56 | 3.1%(+2.84)#3,509 |
| 57. | Glenmont | 5.9% | 3.6%(+2.31)#57 | 3.1%(+2.79)#3,546 |
| 58. | North Potomac | 5.9% | 3.6%(+2.28)#58 | 3.1%(+2.77)#3,590 |
| 59. | Calverton | 5.9% | 3.6%(+2.28)#59 | 3.1%(+2.76)#3,592 |
| 60. | California | 5.8% | 3.6%(+2.23)#60 | 3.1%(+2.71)#3,624 |
| 61. | Trappe | 5.8% | 3.6%(+2.20)#61 | 3.1%(+2.69)#3,643 |
| 62. | Berwyn Heights | 5.8% | 3.6%(+2.20)#62 | 3.1%(+2.68)#3,647 |
| 63. | Easton | 5.8% | 3.6%(+2.18)#63 | 3.1%(+2.66)#3,669 |
| 64. | North Brentwood | 5.7% | 3.6%(+2.13)#64 | 3.1%(+2.61)#3,698 |
| 65. | Kemp Mill | 5.6% | 3.6%(+2.03)#65 | 3.1%(+2.52)#3,785 |
| 66. | Paramount Long Meadow | 5.5% | 3.6%(+1.96)#66 | 3.1%(+2.44)#3,857 |
| 67. | Rockville | 5.5% | 3.6%(+1.93)#67 | 3.1%(+2.41)#3,880 |
| 68. | North Beach | 5.4% | 3.6%(+1.85)#68 | 3.1%(+2.34)#3,960 |
| 69. | Potomac | 5.4% | 3.6%(+1.83)#69 | 3.1%(+2.31)#3,982 |
| 70. | Travilah | 5.4% | 3.6%(+1.81)#70 | 3.1%(+2.30)#4,007 |
| 71. | Bel Air | 5.4% | 3.6%(+1.78)#71 | 3.1%(+2.26)#4,037 |
| 72. | Arnold | 5.3% | 3.6%(+1.71)#72 | 3.1%(+2.20)#4,103 |
| 73. | Germantown | 5.2% | 3.6%(+1.64)#73 | 3.1%(+2.12)#4,201 |
| 74. | Barnesville | 5.2% | 3.6%(+1.61)#74 | 3.1%(+2.10)#4,228 |
| 75. | White Oak | 5.2% | 3.6%(+1.60)#75 | 3.1%(+2.08)#4,237 |
| 76. | Chestertown | 5.2% | 3.6%(+1.57)#76 | 3.1%(+2.06)#4,268 |
| 77. | Green Valley | 5.1% | 3.6%(+1.56)#77 | 3.1%(+2.04)#4,287 |
| 78. | Hughesville | 5.1% | 3.6%(+1.53)#78 | 3.1%(+2.01)#4,334 |
| 79. | District Heights | 5.1% | 3.6%(+1.52)#79 | 3.1%(+2.01)#4,341 |
| 80. | Rossville | 5.1% | 3.6%(+1.49)#80 | 3.1%(+1.98)#4,364 |
| 81. | Cambridge | 5.0% | 3.6%(+1.46)#81 | 3.1%(+1.94)#4,403 |
| 82. | Thurmont | 5.0% | 3.6%(+1.45)#82 | 3.1%(+1.94)#4,409 |
| 83. | Fulton | 5.0% | 3.6%(+1.42)#83 | 3.1%(+1.90)#4,444 |
| 84. | South Kensington | 4.9% | 3.6%(+1.36)#84 | 3.1%(+1.85)#4,510 |
| 85. | Temple Hills | 4.9% | 3.6%(+1.33)#85 | 3.1%(+1.82)#4,542 |
| 86. | Poolesville | 4.9% | 3.6%(+1.31)#86 | 3.1%(+1.80)#4,582 |
| 87. | Ellicott City | 4.9% | 3.6%(+1.31)#87 | 3.1%(+1.79)#4,587 |
| 88. | Queenstown | 4.9% | 3.6%(+1.30)#88 | 3.1%(+1.79)#4,590 |
| 89. | Scaggsville | 4.8% | 3.6%(+1.18)#89 | 3.1%(+1.66)#4,779 |
| 90. | Linganore | 4.8% | 3.6%(+1.17)#90 | 3.1%(+1.66)#4,781 |
| 91. | Somerset | 4.7% | 3.6%(+1.14)#91 | 3.1%(+1.62)#4,822 |
| 92. | Springdale | 4.7% | 3.6%(+1.11)#92 | 3.1%(+1.59)#4,854 |
| 93. | Riverdale Park | 4.7% | 3.6%(+1.09)#93 | 3.1%(+1.58)#4,873 |
| 94. | Columbia | 4.6% | 3.6%(+1.04)#94 | 3.1%(+1.53)#4,937 |
| 95. | Burnt Mills | 4.6% | 3.6%(+1.03)#95 | 3.1%(+1.51)#4,967 |
| 96. | Woodmore | 4.6% | 3.6%(+1.02)#96 | 3.1%(+1.50)#4,982 |
| 97. | Crownsville | 4.6% | 3.6%(+0.990)#97 | 3.1%(+1.47)#5,028 |
| 98. | North Bethesda | 4.6% | 3.6%(+0.968)#98 | 3.1%(+1.45)#5,049 |
| 99. | Gambrills | 4.5% | 3.6%(+0.966)#99 | 3.1%(+1.45)#5,055 |
| 100. | Chevy Chase | 4.5% | 3.6%(+0.942)#100 | 3.1%(+1.43)#5,113 |
Common Questions
What are the Top 10 Cities with the Highest Percentage of Population with a Degree in Physical and Health Sciences in Maryland?
Top 10 Cities with the Highest Percentage of Population with a Degree in Physical and Health Sciences in Maryland are:
#1
71.7%
#2
20.8%
#3
16.0%
#4
13.0%
#5
13.0%
#6
12.8%
#7
11.6%
#8
11.6%
#9
11.1%
#10
10.9%
What city has the Highest Percentage of Population with a Degree in Physical and Health Sciences in Maryland?
Yarrowsburg has the Highest Percentage of Population with a Degree in Physical and Health Sciences in Maryland with 71.7%.
What is the Percentage of Population with a Degree in Physical and Health Sciences in the State of Maryland?
Percentage of Population with a Degree in Physical and Health Sciences in Maryland is 3.6%.
What is the Percentage of Population with a Degree in Physical and Health Sciences in the United States?
Percentage of Population with a Degree in Physical and Health Sciences in the United States is 3.1%.