Zip Codes with the Highest Percentage of Population with a Degree in Physical and Health Sciences in Rancho Cordova, CA
RELATED REPORTS & OPTIONS
Physical and Health Sciences
Rancho Cordova
Compare Zip Codes
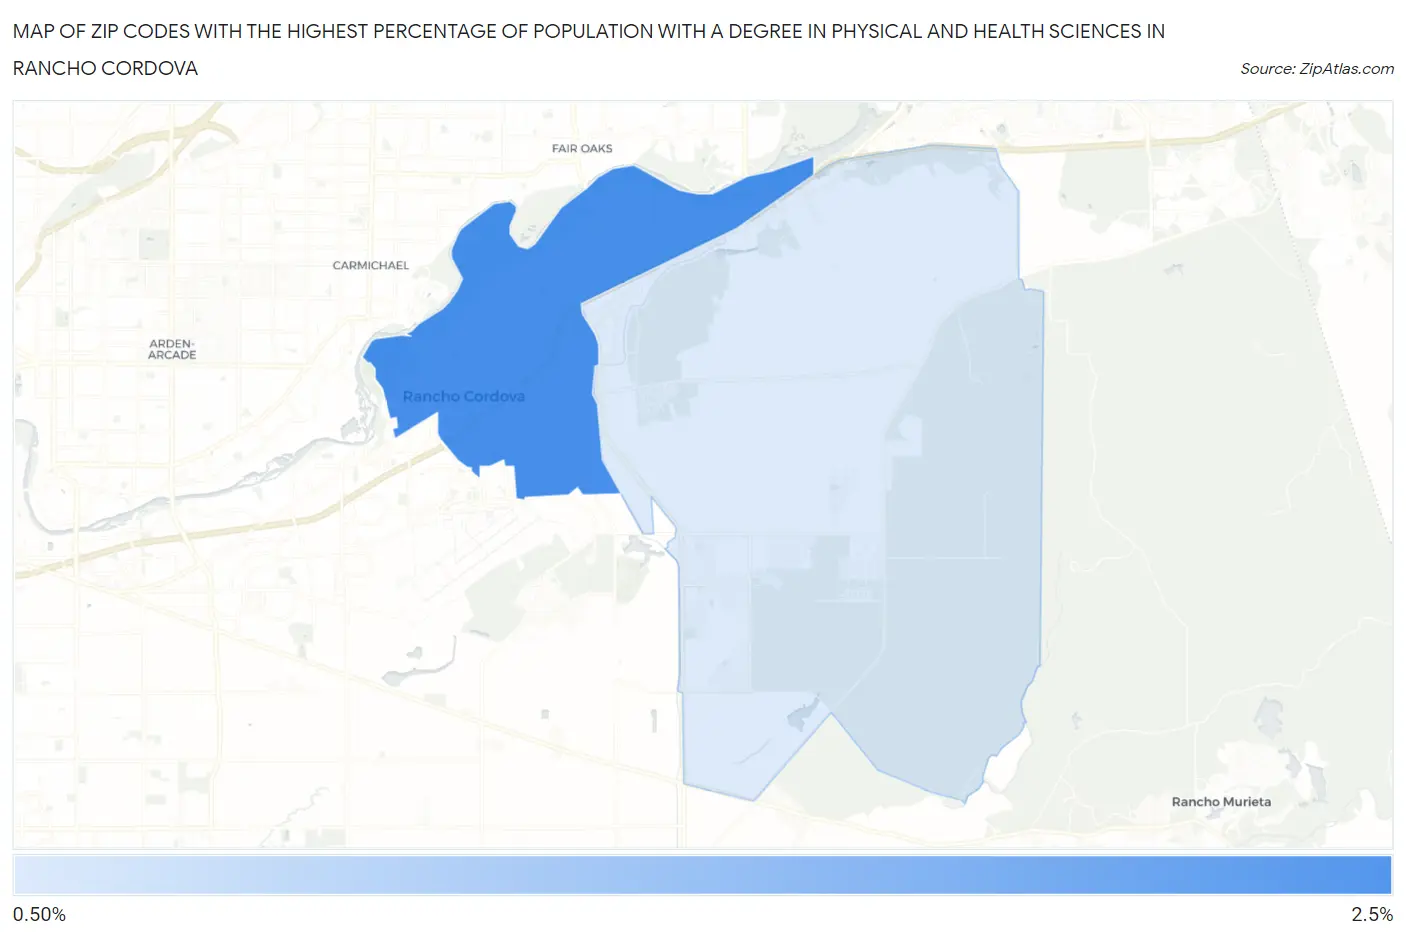
Map of Zip Codes with the Highest Percentage of Population with a Degree in Physical and Health Sciences in Rancho Cordova
1.2%
2.5%
Zip Codes with the Highest Percentage of Population with a Degree in Physical and Health Sciences in Rancho Cordova, CA
| Zip Code | % Graduates | vs State | vs National | |
| 1. | 95670 | 2.5% | 3.1%(-0.653)#825 | 3.1%(-0.638)#12,904 |
| 2. | 95742 | 1.2% | 3.1%(-1.88)#1,229 | 3.1%(-1.87)#18,404 |
1
Common Questions
What are the Top Zip Codes with the Highest Percentage of Population with a Degree in Physical and Health Sciences in Rancho Cordova, CA?
Top Zip Codes with the Highest Percentage of Population with a Degree in Physical and Health Sciences in Rancho Cordova, CA are:
What zip code has the Highest Percentage of Population with a Degree in Physical and Health Sciences in Rancho Cordova, CA?
95670 has the Highest Percentage of Population with a Degree in Physical and Health Sciences in Rancho Cordova, CA with 2.5%.
What is the Percentage of Population with a Degree in Physical and Health Sciences in Rancho Cordova, CA?
Percentage of Population with a Degree in Physical and Health Sciences in Rancho Cordova is 2.1%.
What is the Percentage of Population with a Degree in Physical and Health Sciences in California?
Percentage of Population with a Degree in Physical and Health Sciences in California is 3.1%.
What is the Percentage of Population with a Degree in Physical and Health Sciences in the United States?
Percentage of Population with a Degree in Physical and Health Sciences in the United States is 3.1%.