States with the Highest Percentage of Population with a Degree in Physical and Health Sciences
RELATED REPORTS & OPTIONS
Physical and Health Sciences
United States
Compare States
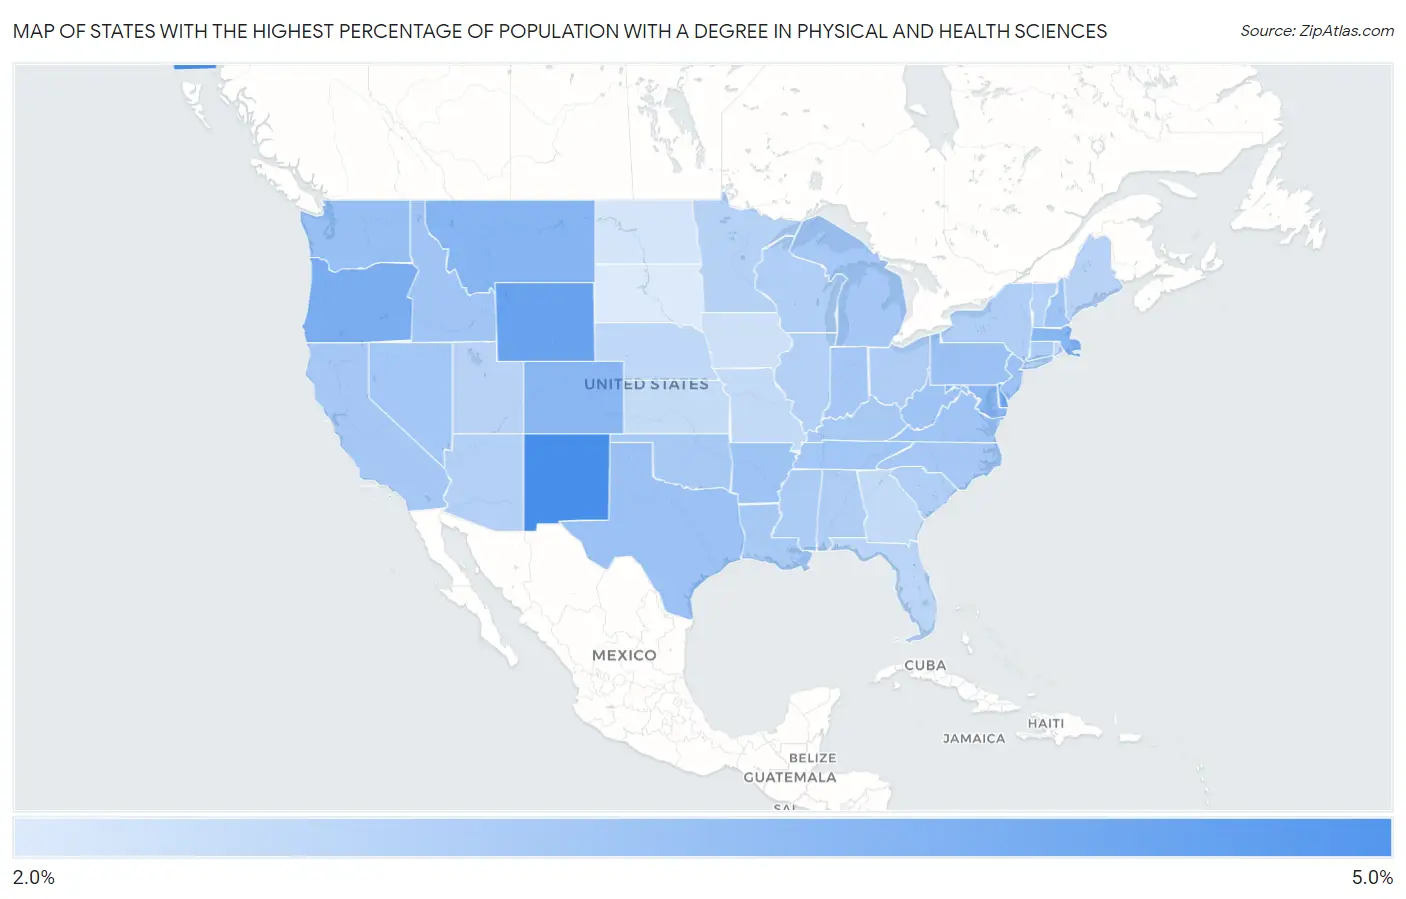
Map of States with the Highest Percentage of Population with a Degree in Physical and Health Sciences
2.0%
5.0%
States with the Highest Percentage of Population with a Degree in Physical and Health Sciences in the United States
| State | % Graduates | vs State Median | vs National | |
| 1. | New Mexico | 4.8% | 3.1% (+1.75) | 3.1%(+1.74) |
| 2. | Alaska | 4.7% | 3.1% (+1.61) | 3.1%(+1.60) |
| 3. | Wyoming | 4.3% | 3.1% (+1.16) | 3.1%(+1.16) |
| 4. | Delaware | 4.1% | 3.1% (+1.03) | 3.1%(+1.02) |
| 5. | Oregon | 3.9% | 3.1% (+0.808) | 3.1%(+0.800) |
| 6. | Montana | 3.7% | 3.1% (+0.635) | 3.1%(+0.627) |
| 7. | Massachusetts | 3.7% | 3.1% (+0.567) | 3.1%(+0.558) |
| 8. | Colorado | 3.6% | 3.1% (+0.548) | 3.1%(+0.540) |
| 9. | Maryland | 3.6% | 3.1% (+0.493) | 3.1%(+0.484) |
| 10. | Washington | 3.4% | 3.1% (+0.280) | 3.1%(+0.272) |
| 11. | New Jersey | 3.3% | 3.1% (+0.232) | 3.1%(+0.224) |
| 12. | Texas | 3.3% | 3.1% (+0.228) | 3.1%(+0.220) |
| 13. | Pennsylvania | 3.3% | 3.1% (+0.186) | 3.1%(+0.178) |
| 14. | West Virginia | 3.3% | 3.1% (+0.171) | 3.1%(+0.163) |
| 15. | New Hampshire | 3.3% | 3.1% (+0.165) | 3.1%(+0.157) |
| 16. | Arkansas | 3.2% | 3.1% (+0.147) | 3.1%(+0.139) |
| 17. | Virginia | 3.2% | 3.1% (+0.120) | 3.1%(+0.111) |
| 18. | Idaho | 3.2% | 3.1% (+0.100) | 3.1%(+0.092) |
| 19. | Nevada | 3.2% | 3.1% (+0.064) | 3.1%(+0.056) |
| 20. | Tennessee | 3.1% | 3.1% (+0.058) | 3.1%(+0.050) |
| 21. | Indiana | 3.1% | 3.1% (+0.044) | 3.1%(+0.036) |
| 22. | Michigan | 3.1% | 3.1% (+0.038) | 3.1%(+0.029) |
| 23. | California | 3.1% | 3.1% (+0.024) | 3.1%(+0.016) |
| 24. | North Carolina | 3.1% | 3.1% (+0.022) | 3.1%(+0.014) |
| 25. | Oklahoma | 3.1% | 3.1% (+0.004) | 3.1%(-0.004) |
| 26. | Kentucky | 3.1% | 3.1% (-0.004) | 3.1%(-0.012) |
| 27. | Louisiana | 3.1% | 3.1% (-0.005) | 3.1%(-0.013) |
| 28. | Connecticut | 3.0% | 3.1% (-0.080) | 3.1%(-0.089) |
| 29. | Mississippi | 3.0% | 3.1% (-0.108) | 3.1%(-0.116) |
| 30. | Ohio | 3.0% | 3.1% (-0.133) | 3.1%(-0.141) |
| 31. | Alabama | 2.9% | 3.1% (-0.143) | 3.1%(-0.152) |
| 32. | South Carolina | 2.9% | 3.1% (-0.157) | 3.1%(-0.165) |
| 33. | New York | 2.9% | 3.1% (-0.176) | 3.1%(-0.184) |
| 34. | Wisconsin | 2.9% | 3.1% (-0.181) | 3.1%(-0.190) |
| 35. | Vermont | 2.9% | 3.1% (-0.204) | 3.1%(-0.213) |
| 36. | Arizona | 2.9% | 3.1% (-0.212) | 3.1%(-0.220) |
| 37. | Illinois | 2.9% | 3.1% (-0.226) | 3.1%(-0.234) |
| 38. | Minnesota | 2.9% | 3.1% (-0.238) | 3.1%(-0.247) |
| 39. | Utah | 2.8% | 3.1% (-0.314) | 3.1%(-0.322) |
| 40. | Maine | 2.8% | 3.1% (-0.314) | 3.1%(-0.322) |
| 41. | Florida | 2.7% | 3.1% (-0.354) | 3.1%(-0.363) |
| 42. | Hawaii | 2.7% | 3.1% (-0.362) | 3.1%(-0.370) |
| 43. | Nebraska | 2.7% | 3.1% (-0.415) | 3.1%(-0.423) |
| 44. | Rhode Island | 2.6% | 3.1% (-0.457) | 3.1%(-0.465) |
| 45. | Missouri | 2.6% | 3.1% (-0.491) | 3.1%(-0.499) |
| 46. | Georgia | 2.6% | 3.1% (-0.496) | 3.1%(-0.505) |
| 47. | Kansas | 2.5% | 3.1% (-0.542) | 3.1%(-0.551) |
| 48. | Iowa | 2.4% | 3.1% (-0.731) | 3.1%(-0.739) |
| 49. | North Dakota | 2.3% | 3.1% (-0.812) | 3.1%(-0.820) |
| 50. | South Dakota | 2.1% | 3.1% (-0.957) | 3.1%(-0.966) |
1
Common Questions
What are the Top 10 States with the Highest Percentage of Population with a Degree in Physical and Health Sciences in the United States?
Top 10 States with the Highest Percentage of Population with a Degree in Physical and Health Sciences in the United States are:
#1
4.8%
#2
4.7%
#3
4.3%
#4
4.1%
#5
3.9%
#6
3.7%
#7
3.7%
#8
3.6%
#9
3.6%
#10
3.4%
What state has the Highest Percentage of Population with a Degree in Physical and Health Sciences in the United States?
New Mexico has the Highest Percentage of Population with a Degree in Physical and Health Sciences in the United States with 4.8%.
What is the Percentage of Population with a Degree in Physical and Health Sciences in the United States?
Percentage of Population with a Degree in Physical and Health Sciences in the United States is 3.1%.