Tehachapi, CA Map & Demographics
Tehachapi Map
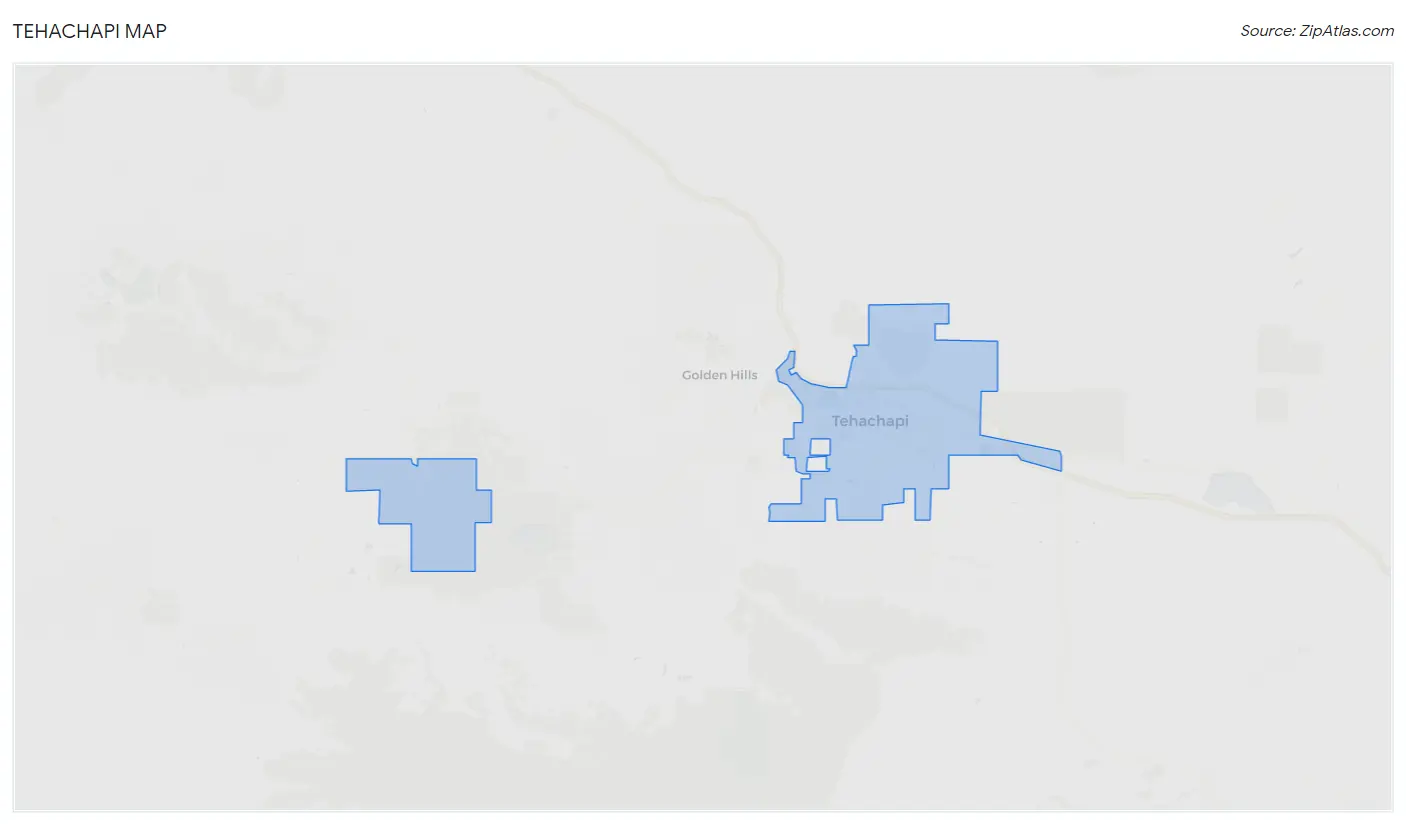
Tehachapi Overview
$23,163
PER CAPITA INCOME
$87,212
AVG FAMILY INCOME
$62,788
AVG HOUSEHOLD INCOME
39.3%
WAGE / INCOME GAP [ % ]
60.7¢/ $1
WAGE / INCOME GAP [ $ ]
0.47
INEQUALITY / GINI INDEX
12,855
TOTAL POPULATION
8,191
MALE POPULATION
4,664
FEMALE POPULATION
175.62
MALES / 100 FEMALES
56.94
FEMALES / 100 MALES
38.3
MEDIAN AGE
3.4
AVG FAMILY SIZE
2.5
AVG HOUSEHOLD SIZE
3,625
LABOR FORCE [ PEOPLE ]
34.4%
PERCENT IN LABOR FORCE
8.6%
UNEMPLOYMENT RATE
Tehachapi Area Codes
Income in Tehachapi
Income Overview in Tehachapi
Per Capita Income in Tehachapi is $23,163, while median incomes of families and households are $87,212 and $62,788 respectively.
| Characteristic | Number | Measure |
| Per Capita Income | 12,855 | $23,163 |
| Median Family Income | 2,081 | $87,212 |
| Mean Family Income | 2,081 | $104,356 |
| Median Household Income | 3,664 | $62,788 |
| Mean Household Income | 3,664 | $77,246 |
| Income Deficit | 2,081 | $0 |
| Wage / Income Gap (%) | 12,855 | 39.32% |
| Wage / Income Gap ($) | 12,855 | 60.68¢ per $1 |
| Gini / Inequality Index | 12,855 | 0.47 |
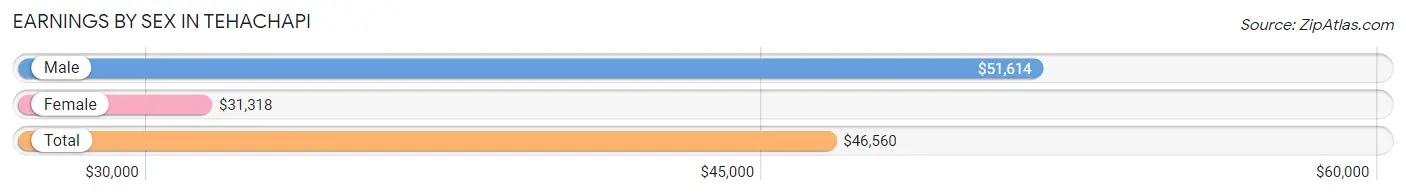
Earnings by Sex in Tehachapi
Average Earnings in Tehachapi are $46,560, $51,614 for men and $31,318 for women, a difference of 39.3%.
| Sex | Number | Average Earnings |
| Male | 2,422 (62.9%) | $51,614 |
| Female | 1,429 (37.1%) | $31,318 |
| Total | 3,851 (100.0%) | $46,560 |
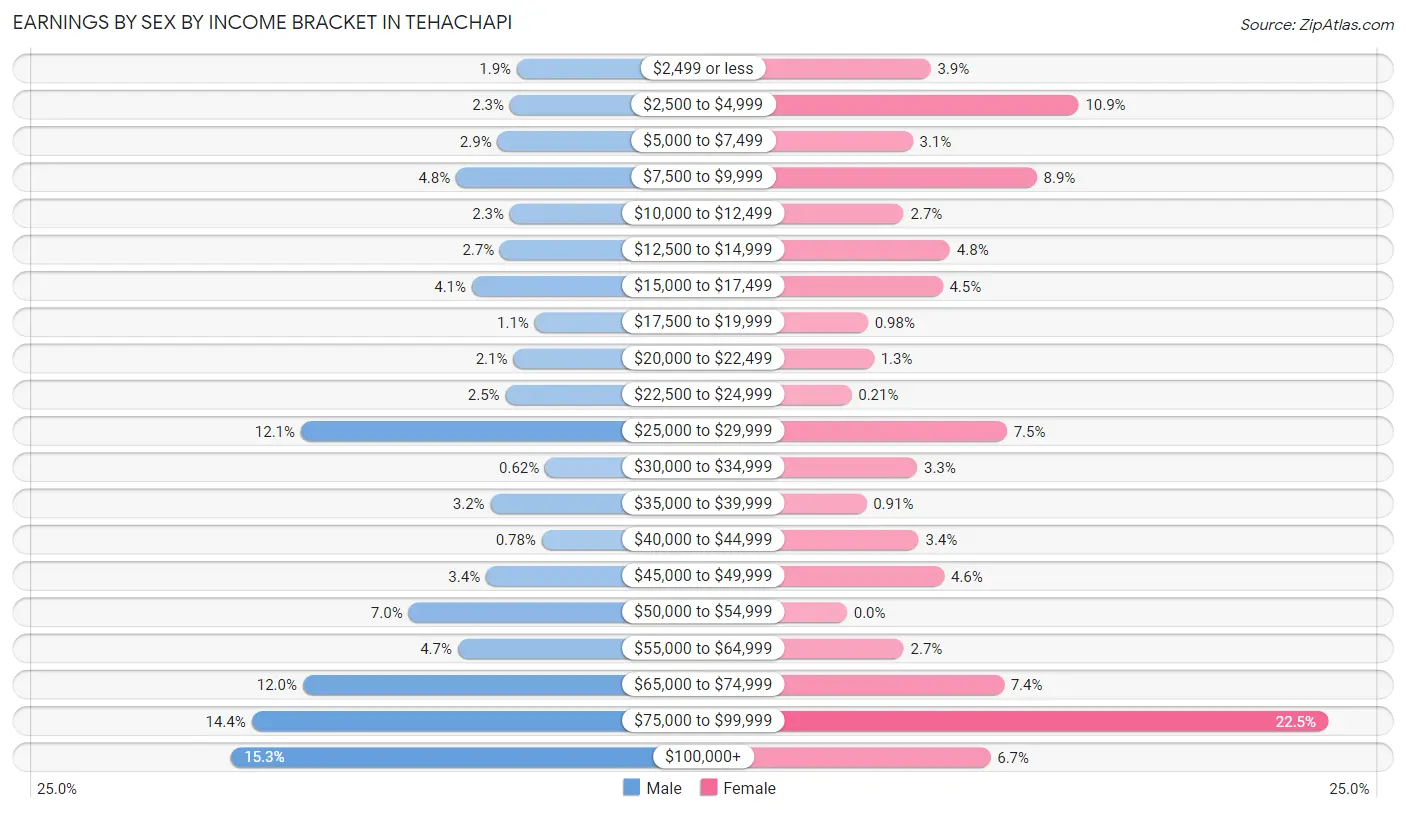
Earnings by Sex by Income Bracket in Tehachapi
The most common earnings brackets in Tehachapi are $100,000+ for men (371 | 15.3%) and $75,000 to $99,999 for women (322 | 22.5%).
| Income | Male | Female |
| $2,499 or less | 47 (1.9%) | 56 (3.9%) |
| $2,500 to $4,999 | 55 (2.3%) | 155 (10.8%) |
| $5,000 to $7,499 | 69 (2.9%) | 44 (3.1%) |
| $7,500 to $9,999 | 116 (4.8%) | 127 (8.9%) |
| $10,000 to $12,499 | 55 (2.3%) | 38 (2.7%) |
| $12,500 to $14,999 | 66 (2.7%) | 69 (4.8%) |
| $15,000 to $17,499 | 98 (4.1%) | 64 (4.5%) |
| $17,500 to $19,999 | 27 (1.1%) | 14 (1.0%) |
| $20,000 to $22,499 | 51 (2.1%) | 18 (1.3%) |
| $22,500 to $24,999 | 60 (2.5%) | 3 (0.2%) |
| $25,000 to $29,999 | 292 (12.1%) | 107 (7.5%) |
| $30,000 to $34,999 | 15 (0.6%) | 47 (3.3%) |
| $35,000 to $39,999 | 77 (3.2%) | 13 (0.9%) |
| $40,000 to $44,999 | 19 (0.8%) | 48 (3.4%) |
| $45,000 to $49,999 | 82 (3.4%) | 65 (4.5%) |
| $50,000 to $54,999 | 170 (7.0%) | 0 (0.0%) |
| $55,000 to $64,999 | 114 (4.7%) | 38 (2.7%) |
| $65,000 to $74,999 | 290 (12.0%) | 105 (7.3%) |
| $75,000 to $99,999 | 348 (14.4%) | 322 (22.5%) |
| $100,000+ | 371 (15.3%) | 96 (6.7%) |
| Total | 2,422 (100.0%) | 1,429 (100.0%) |
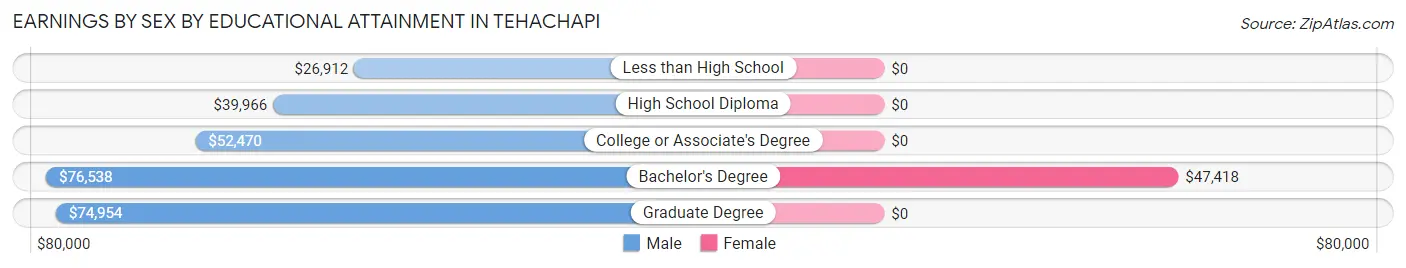
Earnings by Sex by Educational Attainment in Tehachapi
Average earnings in Tehachapi are $54,186 for men and $45,676 for women, a difference of 15.7%. Men with an educational attainment of bachelor's degree enjoy the highest average annual earnings of $76,538, while those with less than high school education earn the least with $26,912. Women with an educational attainment of bachelor's degree earn the most with the average annual earnings of $47,418, while those with bachelor's degree education have the smallest earnings of $47,418.
| Educational Attainment | Male Income | Female Income |
| Less than High School | $26,912 | $0 |
| High School Diploma | $39,966 | $0 |
| College or Associate's Degree | $52,470 | $0 |
| Bachelor's Degree | $76,538 | $47,418 |
| Graduate Degree | $74,954 | $0 |
| Total | $54,186 | $45,676 |
Family Income in Tehachapi
Family Income Brackets in Tehachapi
According to the Tehachapi family income data, there are 572 families falling into the $75,000 to $99,999 income range, which is the most common income bracket and makes up 27.5% of all families. Conversely, the $10,000 to $14,999 income bracket is the least frequent group with only 15 families (0.7%) belonging to this category.
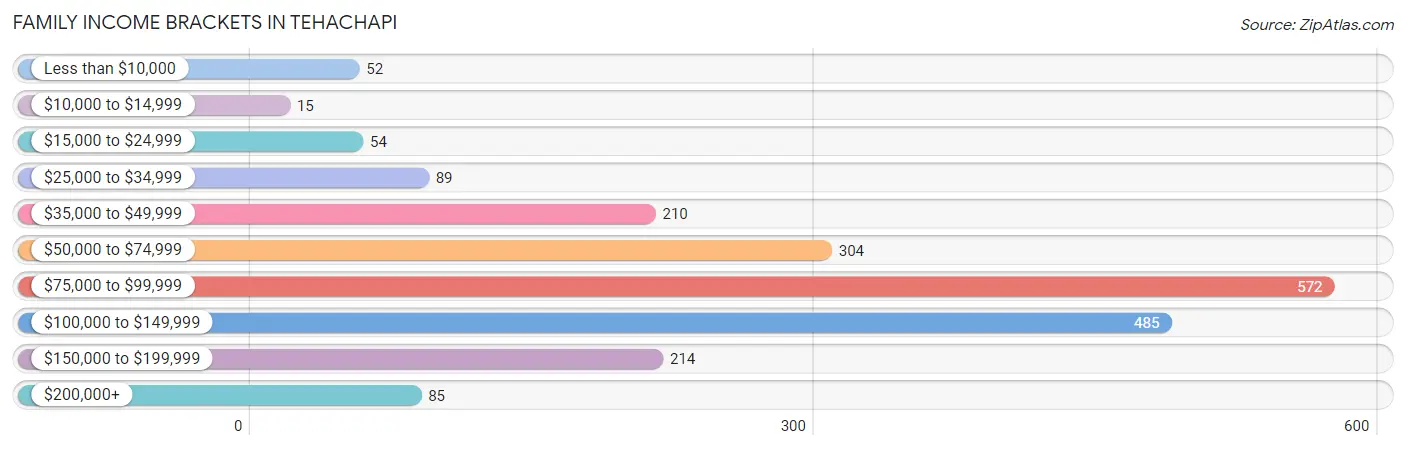
| Income Bracket | # Families | % Families |
| Less than $10,000 | 52 | 2.5% |
| $10,000 to $14,999 | 15 | 0.7% |
| $15,000 to $24,999 | 54 | 2.6% |
| $25,000 to $34,999 | 89 | 4.3% |
| $35,000 to $49,999 | 210 | 10.1% |
| $50,000 to $74,999 | 304 | 14.6% |
| $75,000 to $99,999 | 572 | 27.5% |
| $100,000 to $149,999 | 485 | 23.3% |
| $150,000 to $199,999 | 214 | 10.3% |
| $200,000+ | 85 | 4.1% |
Family Income by Famaliy Size in Tehachapi
6-person families (66 | 3.2%) account for the highest median family income in Tehachapi with $138,207 per family, while 2-person families (824 | 39.6%) have the highest median income of $48,135 per family member.
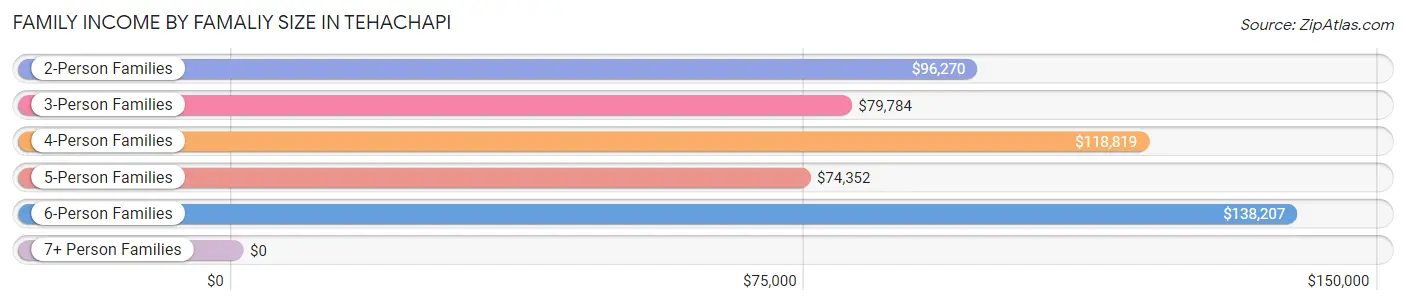
| Income Bracket | # Families | Median Income |
| 2-Person Families | 824 (39.6%) | $96,270 |
| 3-Person Families | 558 (26.8%) | $79,784 |
| 4-Person Families | 355 (17.1%) | $118,819 |
| 5-Person Families | 212 (10.2%) | $74,352 |
| 6-Person Families | 66 (3.2%) | $138,207 |
| 7+ Person Families | 66 (3.2%) | $0 |
| Total | 2,081 (100.0%) | $87,212 |
Family Income by Number of Earners in Tehachapi
The median family income in Tehachapi is $87,212, with families comprising 3+ earners (156) having the highest median family income of $155,583, while families with 1 earner (887) have the lowest median family income of $79,153, accounting for 7.5% and 42.6% of families, respectively.
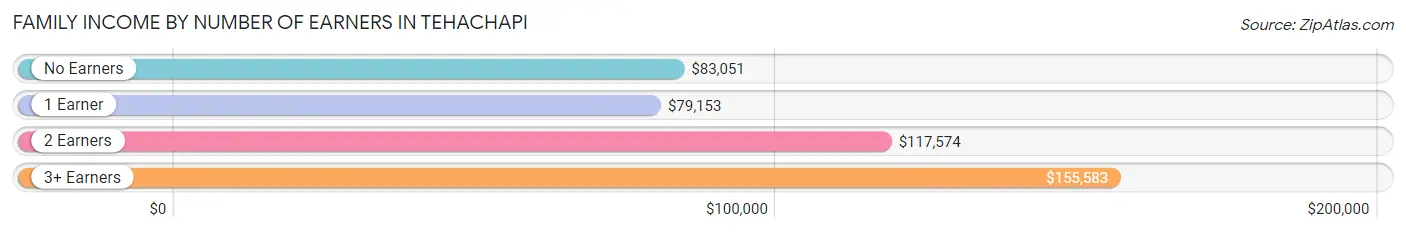
| Number of Earners | # Families | Median Income |
| No Earners | 385 (18.5%) | $83,051 |
| 1 Earner | 887 (42.6%) | $79,153 |
| 2 Earners | 653 (31.4%) | $117,574 |
| 3+ Earners | 156 (7.5%) | $155,583 |
| Total | 2,081 (100.0%) | $87,212 |
Household Income in Tehachapi
Household Income Brackets in Tehachapi
With 638 households falling in the category, the $100,000 to $149,999 income range is the most frequent in Tehachapi, accounting for 17.4% of all households. In contrast, only 103 households (2.8%) fall into the $200,000+ income bracket, making it the least populous group.
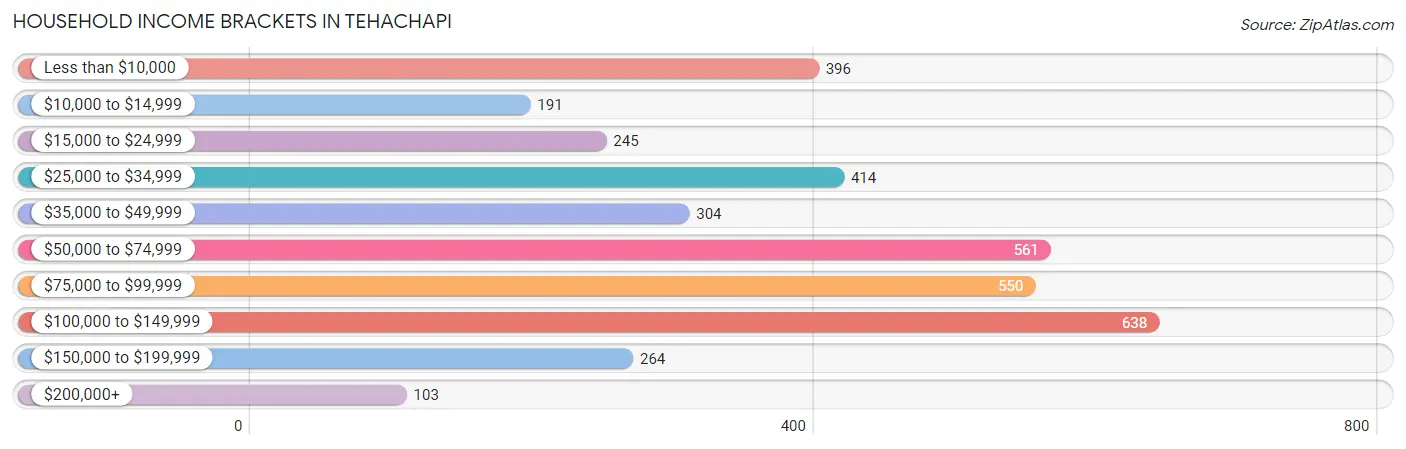
| Income Bracket | # Households | % Households |
| Less than $10,000 | 396 | 10.8% |
| $10,000 to $14,999 | 191 | 5.2% |
| $15,000 to $24,999 | 245 | 6.7% |
| $25,000 to $34,999 | 414 | 11.3% |
| $35,000 to $49,999 | 304 | 8.3% |
| $50,000 to $74,999 | 561 | 15.3% |
| $75,000 to $99,999 | 550 | 15.0% |
| $100,000 to $149,999 | 638 | 17.4% |
| $150,000 to $199,999 | 264 | 7.2% |
| $200,000+ | 103 | 2.8% |
Household Income by Householder Age in Tehachapi
The median household income in Tehachapi is $62,788, with the highest median household income of $76,037 found in the 25 to 44 years age bracket for the primary householder. A total of 1,274 households (34.8%) fall into this category. Meanwhile, the 15 to 24 years age bracket for the primary householder has the lowest median household income of $0, with 58 households (1.6%) in this group.
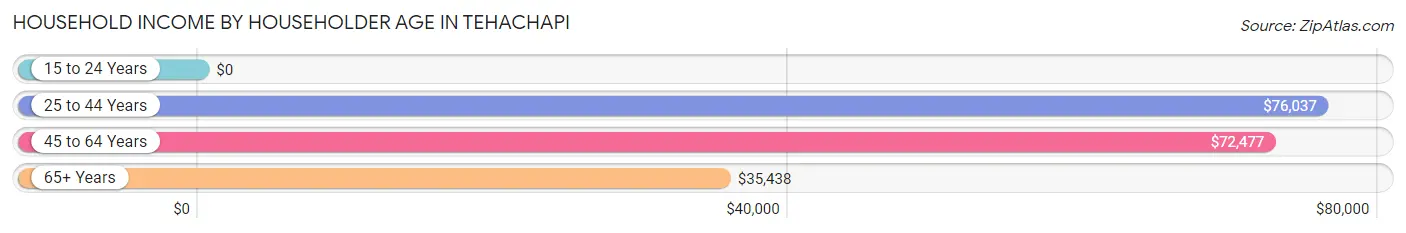
| Income Bracket | # Households | Median Income |
| 15 to 24 Years | 58 (1.6%) | $0 |
| 25 to 44 Years | 1,274 (34.8%) | $76,037 |
| 45 to 64 Years | 1,333 (36.4%) | $72,477 |
| 65+ Years | 999 (27.3%) | $35,438 |
| Total | 3,664 (100.0%) | $62,788 |
Poverty in Tehachapi
Income Below Poverty by Sex and Age in Tehachapi
With 11.6% poverty level for males and 13.7% for females among the residents of Tehachapi, 15 year old males and 75 year old and over females are the most vulnerable to poverty, with 15 males (38.5%) and 140 females (33.1%) in their respective age groups living below the poverty level.
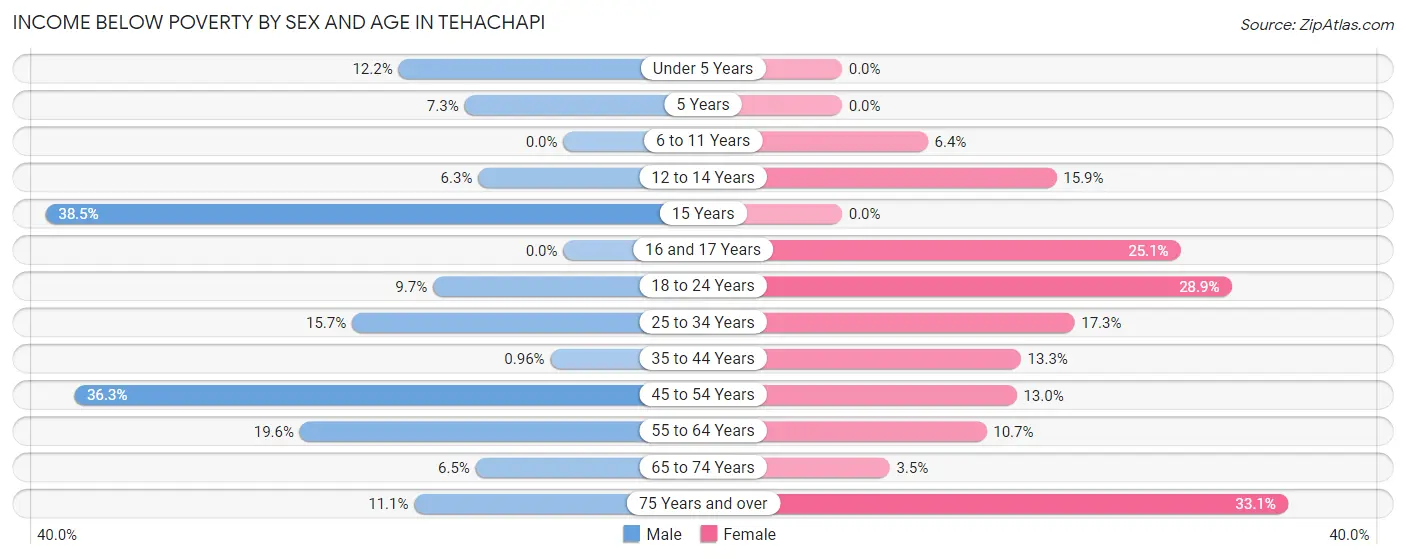
| Age Bracket | Male | Female |
| Under 5 Years | 29 (12.2%) | 0 (0.0%) |
| 5 Years | 8 (7.3%) | 0 (0.0%) |
| 6 to 11 Years | 0 (0.0%) | 41 (6.4%) |
| 12 to 14 Years | 23 (6.3%) | 18 (15.9%) |
| 15 Years | 15 (38.5%) | 0 (0.0%) |
| 16 and 17 Years | 0 (0.0%) | 44 (25.1%) |
| 18 to 24 Years | 21 (9.7%) | 85 (28.9%) |
| 25 to 34 Years | 80 (15.7%) | 130 (17.3%) |
| 35 to 44 Years | 9 (1.0%) | 53 (13.3%) |
| 45 to 54 Years | 202 (36.3%) | 52 (13.0%) |
| 55 to 64 Years | 81 (19.6%) | 57 (10.7%) |
| 65 to 74 Years | 28 (6.5%) | 13 (3.5%) |
| 75 Years and over | 31 (11.1%) | 140 (33.1%) |
| Total | 527 (11.6%) | 633 (13.7%) |
Income Above Poverty by Sex and Age in Tehachapi
According to the poverty statistics in Tehachapi, males aged 6 to 11 years and females aged under 5 years are the age groups that are most secure financially, with 100.0% of males and 100.0% of females in these age groups living above the poverty line.
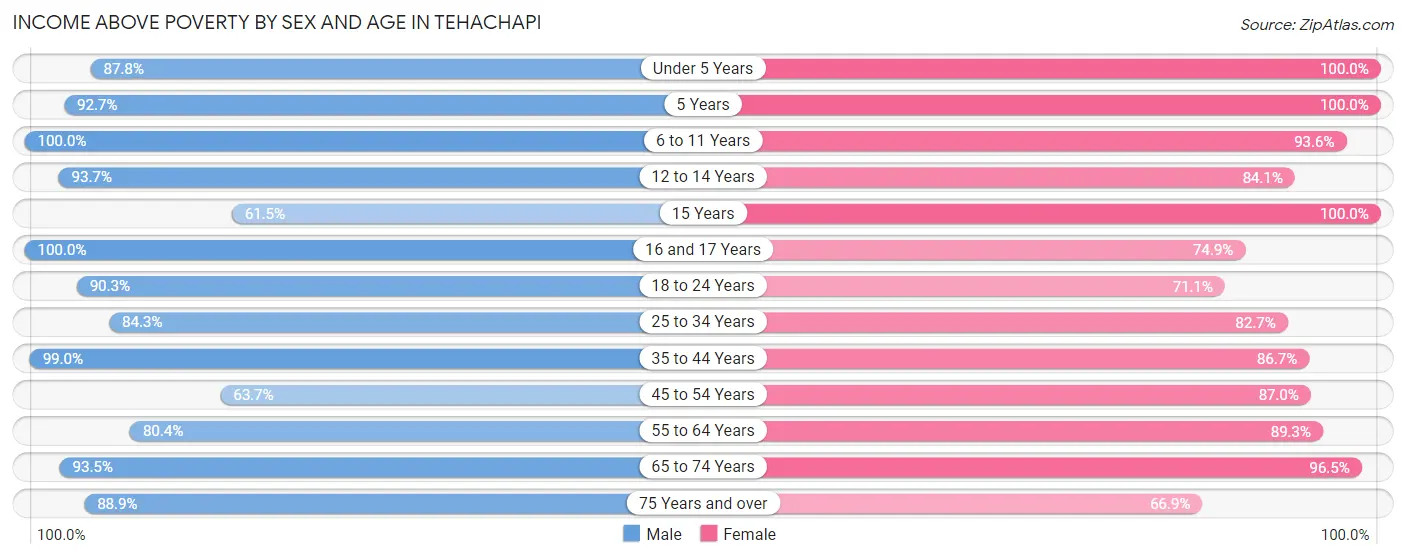
| Age Bracket | Male | Female |
| Under 5 Years | 208 (87.8%) | 400 (100.0%) |
| 5 Years | 101 (92.7%) | 47 (100.0%) |
| 6 to 11 Years | 273 (100.0%) | 603 (93.6%) |
| 12 to 14 Years | 341 (93.7%) | 95 (84.1%) |
| 15 Years | 24 (61.5%) | 92 (100.0%) |
| 16 and 17 Years | 182 (100.0%) | 131 (74.9%) |
| 18 to 24 Years | 196 (90.3%) | 209 (71.1%) |
| 25 to 34 Years | 430 (84.3%) | 623 (82.7%) |
| 35 to 44 Years | 925 (99.0%) | 346 (86.7%) |
| 45 to 54 Years | 354 (63.7%) | 349 (87.0%) |
| 55 to 64 Years | 333 (80.4%) | 474 (89.3%) |
| 65 to 74 Years | 402 (93.5%) | 354 (96.5%) |
| 75 Years and over | 249 (88.9%) | 283 (66.9%) |
| Total | 4,018 (88.4%) | 4,006 (86.4%) |
Income Below Poverty Among Married-Couple Families in Tehachapi
The poverty statistics for married-couple families in Tehachapi show that 1.4% or 22 of the total 1,599 families live below the poverty line. Families with 1 or 2 children have the highest poverty rate of 3.5%, comprising of 22 families. On the other hand, families with no children have the lowest poverty rate of 0.0%, which includes 0 families.
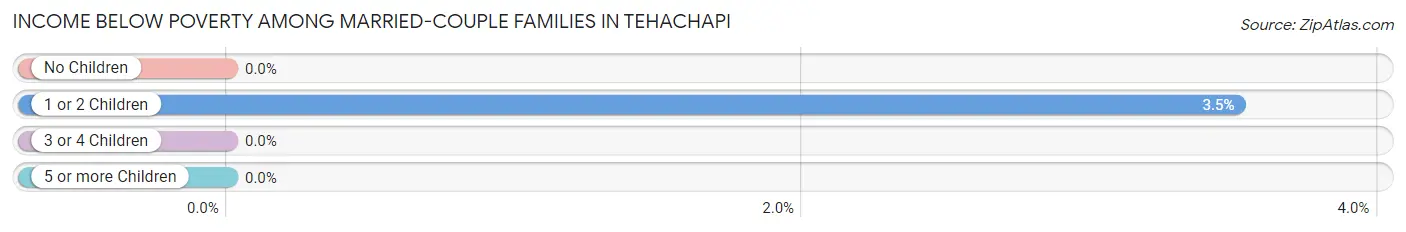
| Children | Above Poverty | Below Poverty |
| No Children | 742 (100.0%) | 0 (0.0%) |
| 1 or 2 Children | 605 (96.5%) | 22 (3.5%) |
| 3 or 4 Children | 164 (100.0%) | 0 (0.0%) |
| 5 or more Children | 66 (100.0%) | 0 (0.0%) |
| Total | 1,577 (98.6%) | 22 (1.4%) |
Income Below Poverty Among Single-Parent Households in Tehachapi
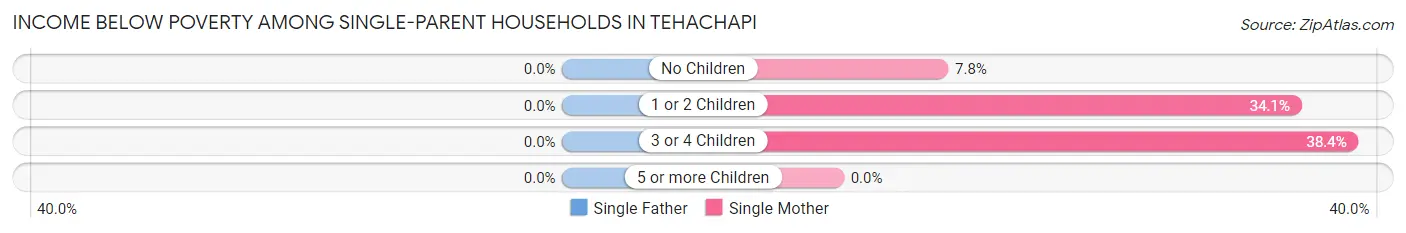
| Children | Single Father | Single Mother |
| No Children | 0 (0.0%) | 7 (7.8%) |
| 1 or 2 Children | 0 (0.0%) | 43 (34.1%) |
| 3 or 4 Children | 0 (0.0%) | 28 (38.4%) |
| 5 or more Children | 0 (0.0%) | 0 (0.0%) |
| Total | 0 (0.0%) | 78 (25.8%) |
Income Below Poverty Among Married-Couple vs Single-Parent Households in Tehachapi
The poverty data for Tehachapi shows that 22 of the married-couple family households (1.4%) and 78 of the single-parent households (16.2%) are living below the poverty level. Within the married-couple family households, those with 1 or 2 children have the highest poverty rate, with 22 households (3.5%) falling below the poverty line. Among the single-parent households, those with 3 or 4 children have the highest poverty rate, with 28 household (38.4%) living below poverty.
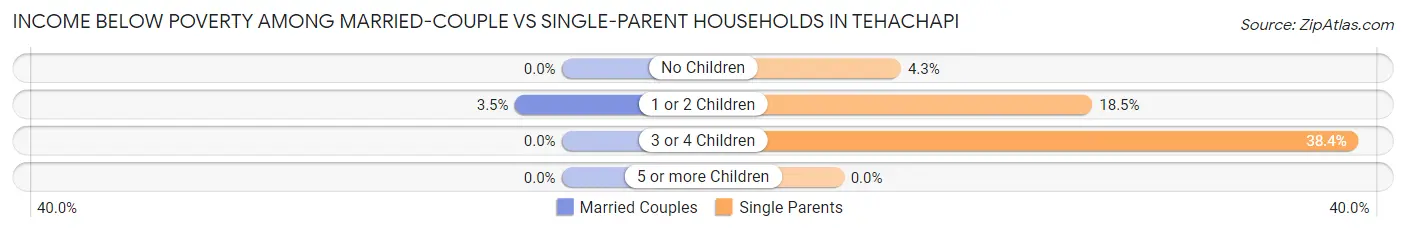
| Children | Married-Couple Families | Single-Parent Households |
| No Children | 0 (0.0%) | 7 (4.3%) |
| 1 or 2 Children | 22 (3.5%) | 43 (18.5%) |
| 3 or 4 Children | 0 (0.0%) | 28 (38.4%) |
| 5 or more Children | 0 (0.0%) | 0 (0.0%) |
| Total | 22 (1.4%) | 78 (16.2%) |
Race in Tehachapi
The most populous races in Tehachapi are White / Caucasian (8,421 | 65.5%), Hispanic or Latino (4,596 | 35.7%), and Two or more Races (1,501 | 11.7%).
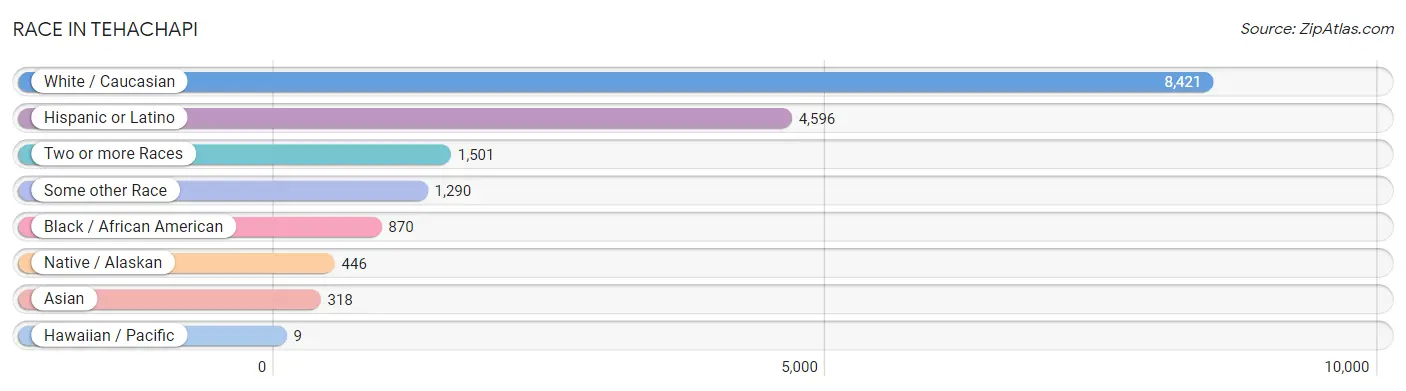
| Race | # Population | % Population |
| Asian | 318 | 2.5% |
| Black / African American | 870 | 6.8% |
| Hawaiian / Pacific | 9 | 0.1% |
| Hispanic or Latino | 4,596 | 35.7% |
| Native / Alaskan | 446 | 3.5% |
| White / Caucasian | 8,421 | 65.5% |
| Two or more Races | 1,501 | 11.7% |
| Some other Race | 1,290 | 10.0% |
| Total | 12,855 | 100.0% |
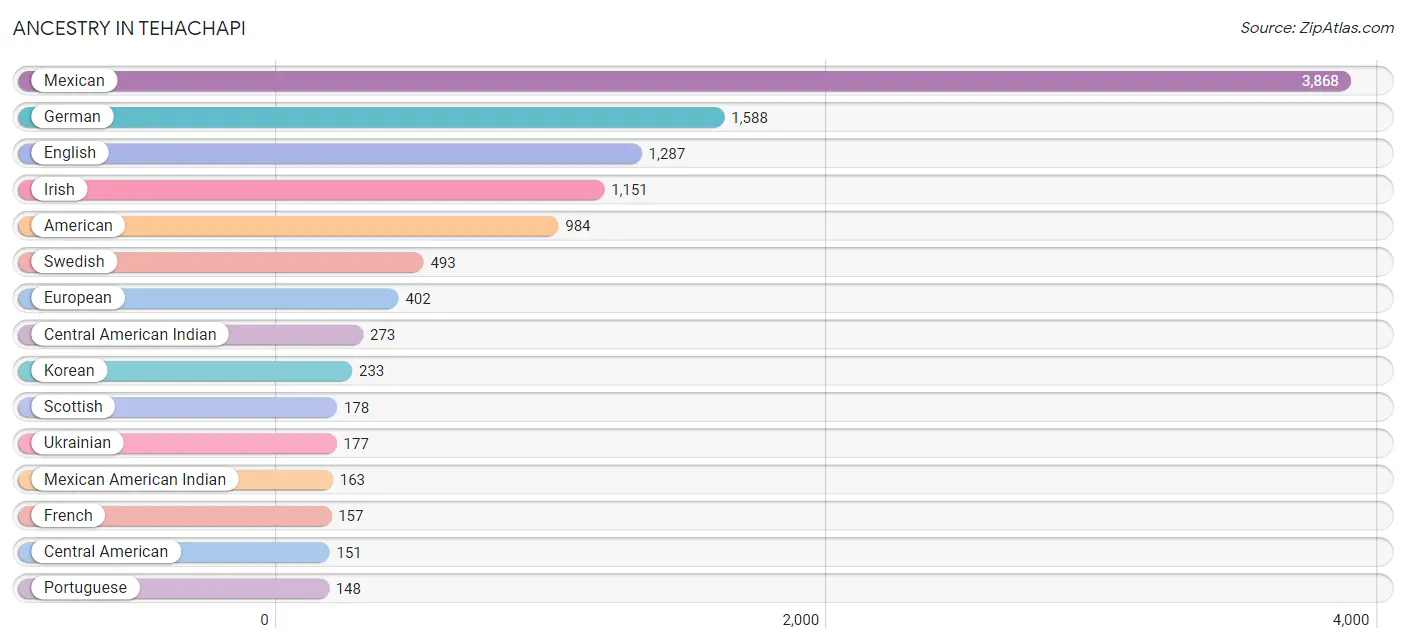
Ancestry in Tehachapi
The most populous ancestries reported in Tehachapi are Mexican (3,868 | 30.1%), German (1,588 | 12.3%), English (1,287 | 10.0%), Irish (1,151 | 8.9%), and American (984 | 7.6%), together accounting for 69.1% of all Tehachapi residents.
| Ancestry | # Population | % Population |
| African | 7 | 0.1% |
| American | 984 | 7.6% |
| Arab | 5 | 0.0% |
| Armenian | 19 | 0.2% |
| Austrian | 21 | 0.2% |
| Basque | 73 | 0.6% |
| Bhutanese | 25 | 0.2% |
| Blackfeet | 16 | 0.1% |
| British | 68 | 0.5% |
| Burmese | 20 | 0.2% |
| Canadian | 31 | 0.2% |
| Central American | 151 | 1.2% |
| Central American Indian | 273 | 2.1% |
| Cherokee | 121 | 0.9% |
| Cheyenne | 9 | 0.1% |
| Chippewa | 11 | 0.1% |
| Choctaw | 23 | 0.2% |
| Colombian | 7 | 0.1% |
| Croatian | 9 | 0.1% |
| Cuban | 19 | 0.2% |
| Czech | 44 | 0.3% |
| Czechoslovakian | 5 | 0.0% |
| Dominican | 10 | 0.1% |
| Dutch | 80 | 0.6% |
| Eastern European | 29 | 0.2% |
| Ecuadorian | 42 | 0.3% |
| English | 1,287 | 10.0% |
| European | 402 | 3.1% |
| French | 157 | 1.2% |
| French Canadian | 29 | 0.2% |
| German | 1,588 | 12.3% |
| Ghanaian | 109 | 0.9% |
| Greek | 29 | 0.2% |
| Guatemalan | 67 | 0.5% |
| Haitian | 10 | 0.1% |
| Honduran | 24 | 0.2% |
| Hopi | 11 | 0.1% |
| Hungarian | 46 | 0.4% |
| Indian (Asian) | 9 | 0.1% |
| Irish | 1,151 | 8.9% |
| Iroquois | 5 | 0.0% |
| Italian | 135 | 1.1% |
| Jamaican | 16 | 0.1% |
| Korean | 233 | 1.8% |
| Mexican | 3,868 | 30.1% |
| Mexican American Indian | 163 | 1.3% |
| Native Hawaiian | 19 | 0.2% |
| Northern European | 81 | 0.6% |
| Norwegian | 95 | 0.7% |
| Pakistani | 14 | 0.1% |
| Panamanian | 4 | 0.0% |
| Peruvian | 26 | 0.2% |
| Polish | 115 | 0.9% |
| Portuguese | 148 | 1.1% |
| Puerto Rican | 74 | 0.6% |
| Russian | 46 | 0.4% |
| Salvadoran | 47 | 0.4% |
| Samoan | 5 | 0.0% |
| Scandinavian | 27 | 0.2% |
| Scotch-Irish | 23 | 0.2% |
| Scottish | 178 | 1.4% |
| Sioux | 23 | 0.2% |
| Slavic | 54 | 0.4% |
| Slovene | 35 | 0.3% |
| South African | 7 | 0.1% |
| South American | 75 | 0.6% |
| Spaniard | 29 | 0.2% |
| Spanish | 34 | 0.3% |
| Sri Lankan | 8 | 0.1% |
| Subsaharan African | 123 | 1.0% |
| Swedish | 493 | 3.8% |
| Swiss | 34 | 0.3% |
| Ukrainian | 177 | 1.4% |
| Welsh | 43 | 0.3% |
| Yaqui | 21 | 0.2% | View All 75 Rows |
Immigrants in Tehachapi
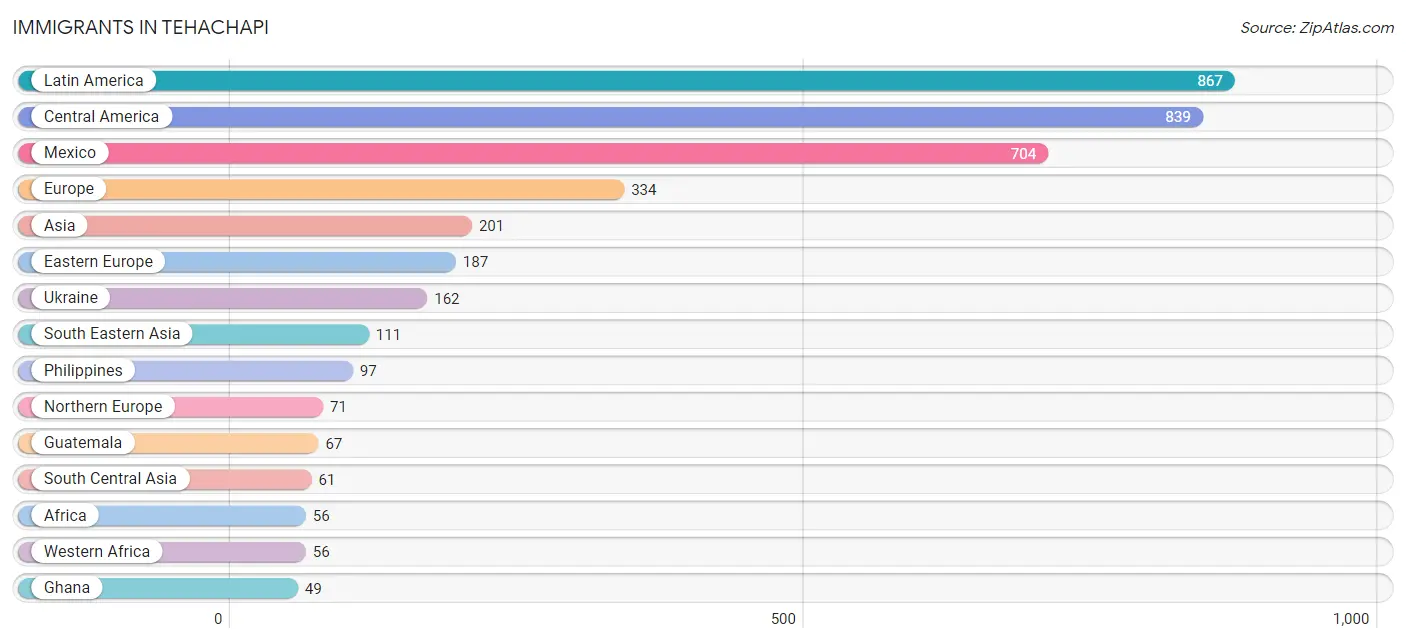
The most numerous immigrant groups reported in Tehachapi came from Latin America (867 | 6.7%), Central America (839 | 6.5%), Mexico (704 | 5.5%), Europe (334 | 2.6%), and Asia (201 | 1.6%), together accounting for 22.9% of all Tehachapi residents.
| Immigration Origin | # Population | % Population |
| Africa | 56 | 0.4% |
| Armenia | 8 | 0.1% |
| Asia | 201 | 1.6% |
| Canada | 14 | 0.1% |
| Central America | 839 | 6.5% |
| Colombia | 7 | 0.1% |
| Eastern Asia | 10 | 0.1% |
| Eastern Europe | 187 | 1.5% |
| El Salvador | 36 | 0.3% |
| England | 45 | 0.4% |
| Europe | 334 | 2.6% |
| Germany | 40 | 0.3% |
| Ghana | 49 | 0.4% |
| Guatemala | 67 | 0.5% |
| Honduras | 22 | 0.2% |
| Hungary | 25 | 0.2% |
| India | 6 | 0.1% |
| Italy | 36 | 0.3% |
| Korea | 10 | 0.1% |
| Latin America | 867 | 6.7% |
| Lebanon | 11 | 0.1% |
| Liberia | 7 | 0.1% |
| Mexico | 704 | 5.5% |
| Nepal | 2 | 0.0% |
| Northern Europe | 71 | 0.5% |
| Pakistan | 4 | 0.0% |
| Peru | 15 | 0.1% |
| Philippines | 97 | 0.7% |
| South America | 28 | 0.2% |
| South Central Asia | 61 | 0.5% |
| South Eastern Asia | 111 | 0.9% |
| Southern Europe | 36 | 0.3% |
| Sri Lanka | 49 | 0.4% |
| Thailand | 14 | 0.1% |
| Ukraine | 162 | 1.3% |
| Western Africa | 56 | 0.4% |
| Western Asia | 19 | 0.2% |
| Western Europe | 40 | 0.3% | View All 38 Rows |
Sex and Age in Tehachapi
Sex and Age in Tehachapi
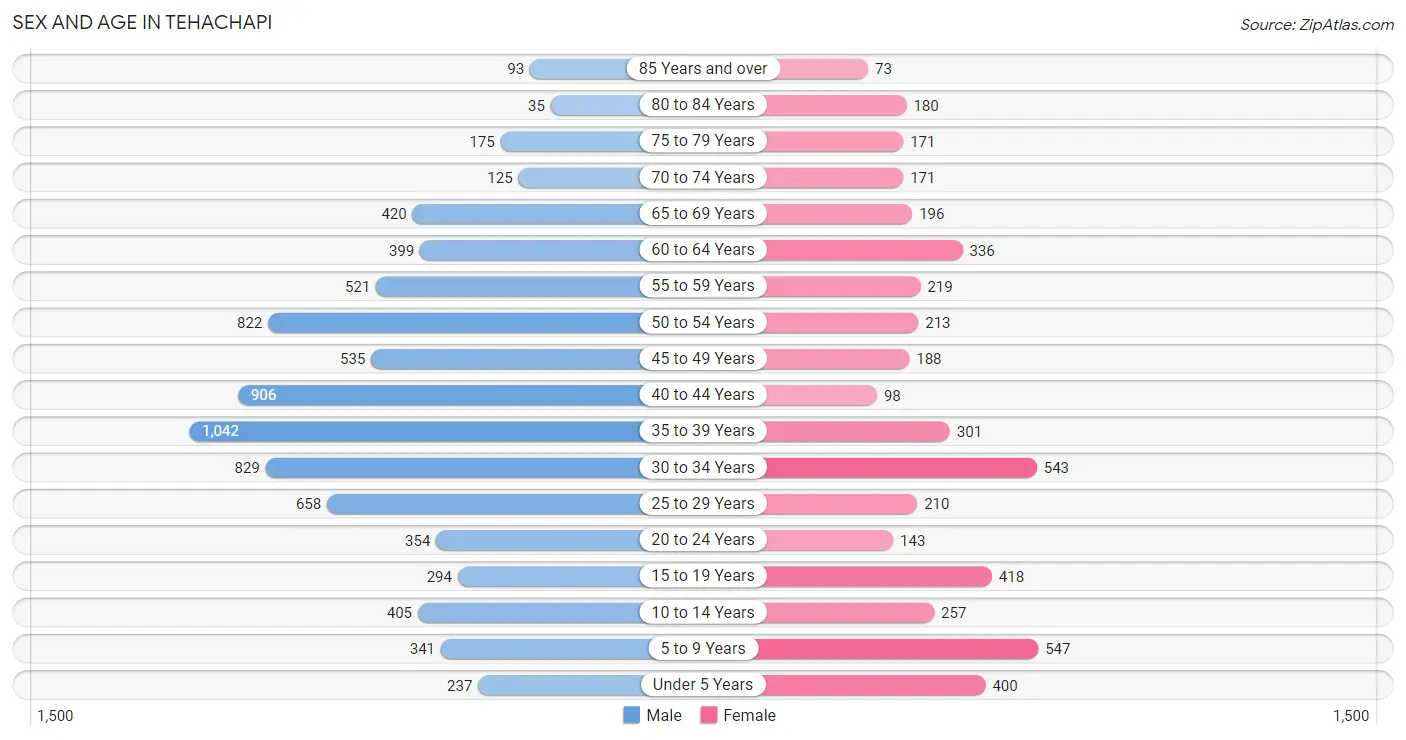
The most populous age groups in Tehachapi are 35 to 39 Years (1,042 | 12.7%) for men and 5 to 9 Years (547 | 11.7%) for women.
| Age Bracket | Male | Female |
| Under 5 Years | 237 (2.9%) | 400 (8.6%) |
| 5 to 9 Years | 341 (4.2%) | 547 (11.7%) |
| 10 to 14 Years | 405 (4.9%) | 257 (5.5%) |
| 15 to 19 Years | 294 (3.6%) | 418 (9.0%) |
| 20 to 24 Years | 354 (4.3%) | 143 (3.1%) |
| 25 to 29 Years | 658 (8.0%) | 210 (4.5%) |
| 30 to 34 Years | 829 (10.1%) | 543 (11.6%) |
| 35 to 39 Years | 1,042 (12.7%) | 301 (6.5%) |
| 40 to 44 Years | 906 (11.1%) | 98 (2.1%) |
| 45 to 49 Years | 535 (6.5%) | 188 (4.0%) |
| 50 to 54 Years | 822 (10.0%) | 213 (4.6%) |
| 55 to 59 Years | 521 (6.4%) | 219 (4.7%) |
| 60 to 64 Years | 399 (4.9%) | 336 (7.2%) |
| 65 to 69 Years | 420 (5.1%) | 196 (4.2%) |
| 70 to 74 Years | 125 (1.5%) | 171 (3.7%) |
| 75 to 79 Years | 175 (2.1%) | 171 (3.7%) |
| 80 to 84 Years | 35 (0.4%) | 180 (3.9%) |
| 85 Years and over | 93 (1.1%) | 73 (1.6%) |
| Total | 8,191 (100.0%) | 4,664 (100.0%) |
Families and Households in Tehachapi
Median Family Size in Tehachapi
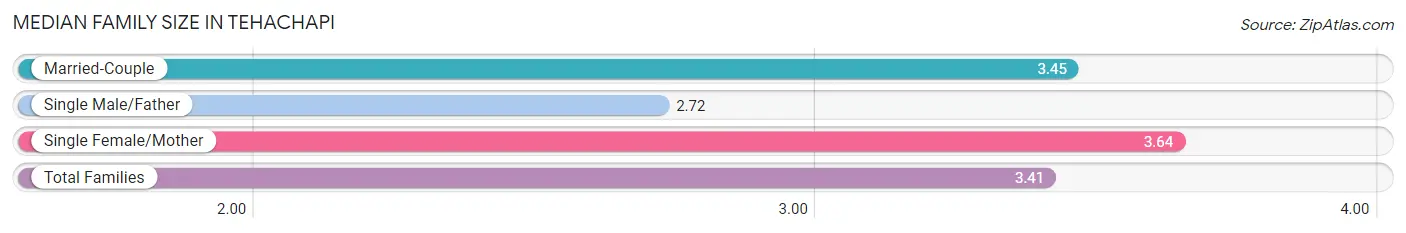
The median family size in Tehachapi is 3.41 persons per family, with single female/mother families (302 | 14.5%) accounting for the largest median family size of 3.64 persons per family. On the other hand, single male/father families (180 | 8.6%) represent the smallest median family size with 2.72 persons per family.
| Family Type | # Families | Family Size |
| Married-Couple | 1,599 (76.8%) | 3.45 |
| Single Male/Father | 180 (8.6%) | 2.72 |
| Single Female/Mother | 302 (14.5%) | 3.64 |
| Total Families | 2,081 (100.0%) | 3.41 |
Median Household Size in Tehachapi
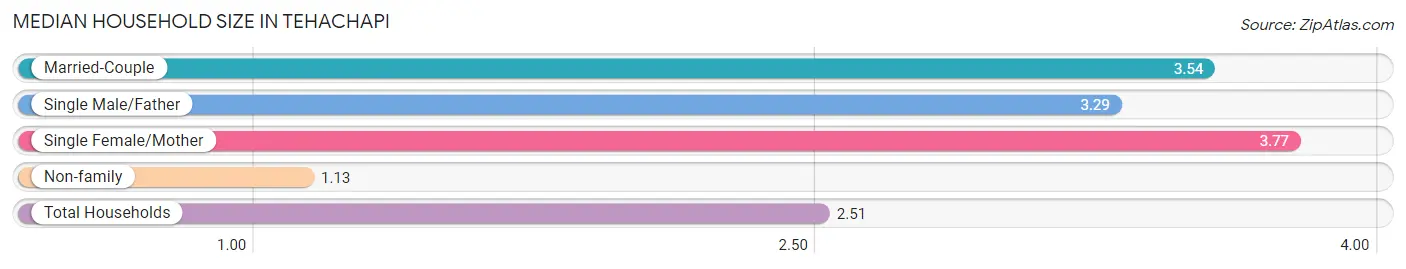
The median household size in Tehachapi is 2.51 persons per household, with single female/mother households (302 | 8.2%) accounting for the largest median household size of 3.77 persons per household. non-family households (1,583 | 43.2%) represent the smallest median household size with 1.13 persons per household.
| Household Type | # Households | Household Size |
| Married-Couple | 1,599 (43.6%) | 3.54 |
| Single Male/Father | 180 (4.9%) | 3.29 |
| Single Female/Mother | 302 (8.2%) | 3.77 |
| Non-family | 1,583 (43.2%) | 1.13 |
| Total Households | 3,664 (100.0%) | 2.51 |
Household Size by Marriage Status in Tehachapi
Out of a total of 3,664 households in Tehachapi, 2,081 (56.8%) are family households, while 1,583 (43.2%) are nonfamily households. The most numerous type of family households are 2-person households, comprising 715, and the most common type of nonfamily households are 1-person households, comprising 1,394.
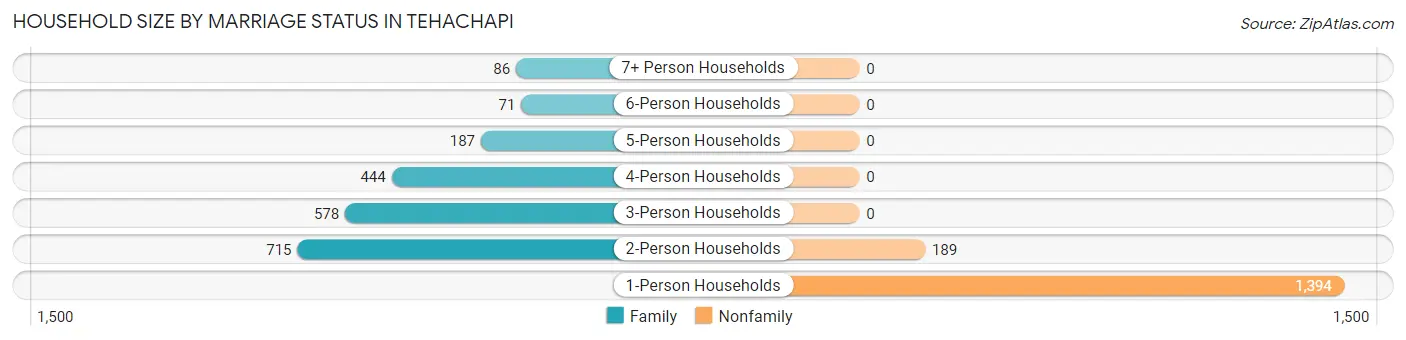
| Household Size | Family Households | Nonfamily Households |
| 1-Person Households | - | 1,394 (38.1%) |
| 2-Person Households | 715 (19.5%) | 189 (5.2%) |
| 3-Person Households | 578 (15.8%) | 0 (0.0%) |
| 4-Person Households | 444 (12.1%) | 0 (0.0%) |
| 5-Person Households | 187 (5.1%) | 0 (0.0%) |
| 6-Person Households | 71 (1.9%) | 0 (0.0%) |
| 7+ Person Households | 86 (2.4%) | 0 (0.0%) |
| Total | 2,081 (56.8%) | 1,583 (43.2%) |
Female Fertility in Tehachapi
Fertility by Age in Tehachapi
Average fertility rate in Tehachapi is 58.0 births per 1,000 women. Women in the age bracket of 20 to 34 years have the highest fertility rate with 124.0 births per 1,000 women. Women in the age bracket of 20 to 34 years acount for 100.0% of all women with births.
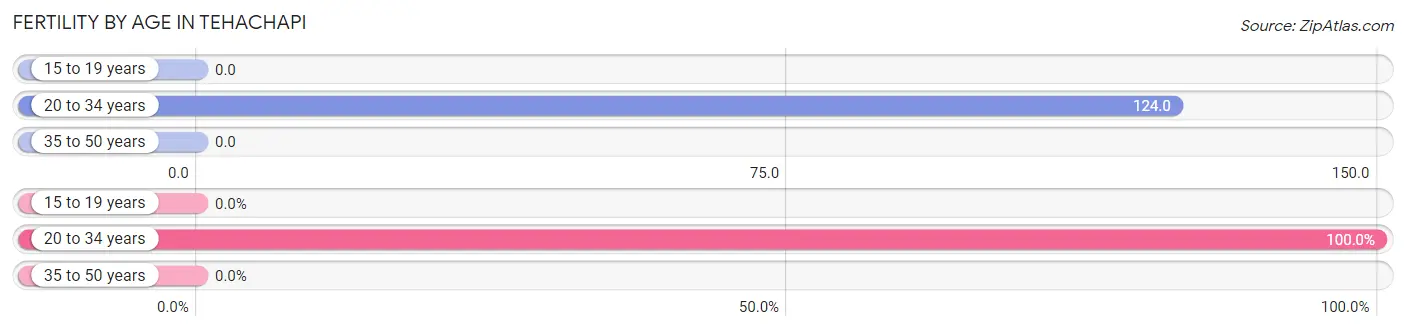
| Age Bracket | Women with Births | Births / 1,000 Women |
| 15 to 19 years | 0 (0.0%) | 0.0 |
| 20 to 34 years | 111 (100.0%) | 124.0 |
| 35 to 50 years | 0 (0.0%) | 0.0 |
| Total | 111 (100.0%) | 58.0 |
Fertility by Age by Marriage Status in Tehachapi
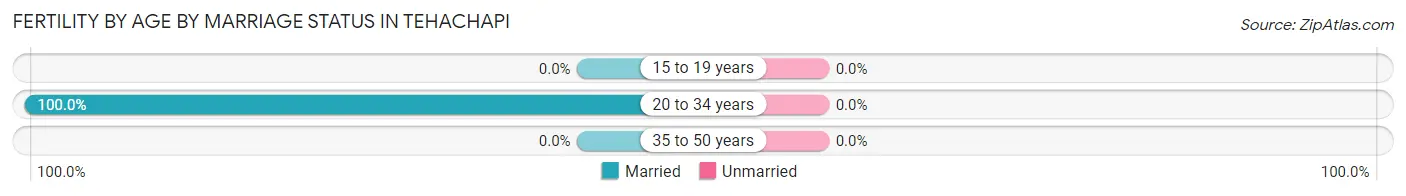
| Age Bracket | Married | Unmarried |
| 15 to 19 years | 0 (0.0%) | 0 (0.0%) |
| 20 to 34 years | 111 (100.0%) | 0 (0.0%) |
| 35 to 50 years | 0 (0.0%) | 0 (0.0%) |
| Total | 111 (100.0%) | 0 (0.0%) |
Fertility by Education in Tehachapi
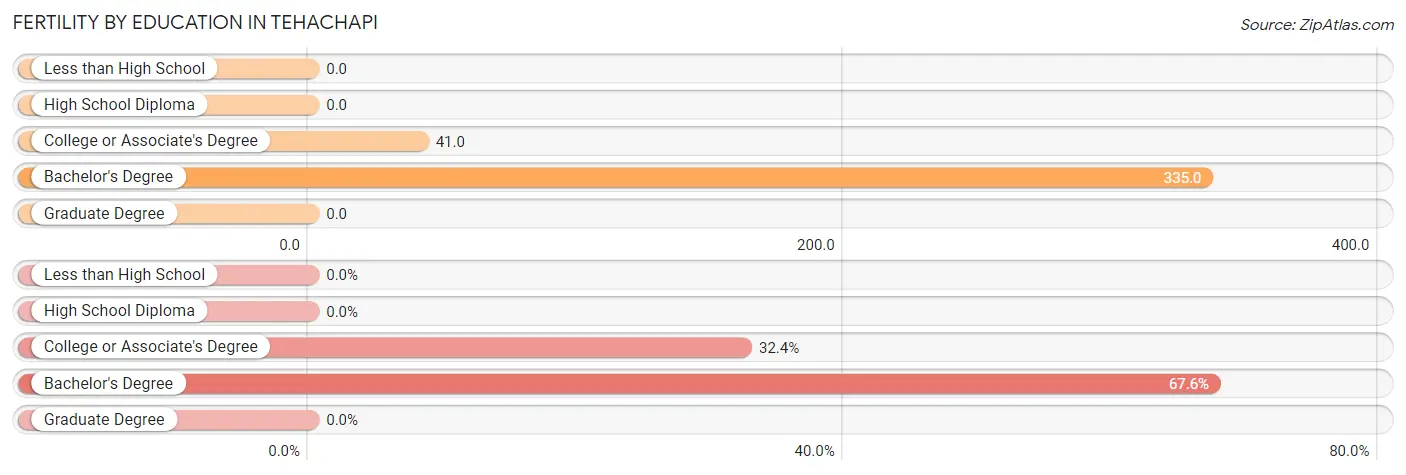
| Educational Attainment | Women with Births | Births / 1,000 Women |
| Less than High School | 0 (0.0%) | 0.0 |
| High School Diploma | 0 (0.0%) | 0.0 |
| College or Associate's Degree | 36 (32.4%) | 41.0 |
| Bachelor's Degree | 75 (67.6%) | 335.0 |
| Graduate Degree | 0 (0.0%) | 0.0 |
| Total | 111 (100.0%) | 58.0 |
Fertility by Education by Marriage Status in Tehachapi
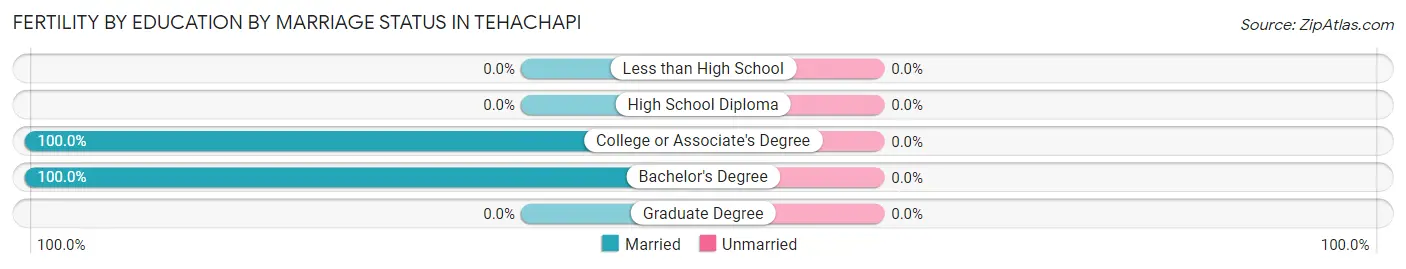
| Educational Attainment | Married | Unmarried |
| Less than High School | 0 (0.0%) | 0 (0.0%) |
| High School Diploma | 0 (0.0%) | 0 (0.0%) |
| College or Associate's Degree | 36 (100.0%) | 0 (0.0%) |
| Bachelor's Degree | 75 (100.0%) | 0 (0.0%) |
| Graduate Degree | 0 (0.0%) | 0 (0.0%) |
| Total | 111 (100.0%) | 0 (0.0%) |
Employment Characteristics in Tehachapi
Employment by Class of Employer in Tehachapi
Among the 3,318 employed individuals in Tehachapi, private company employees (2,110 | 63.6%), local government employees (363 | 10.9%), and federal government employees (282 | 8.5%) make up the most common classes of employment.
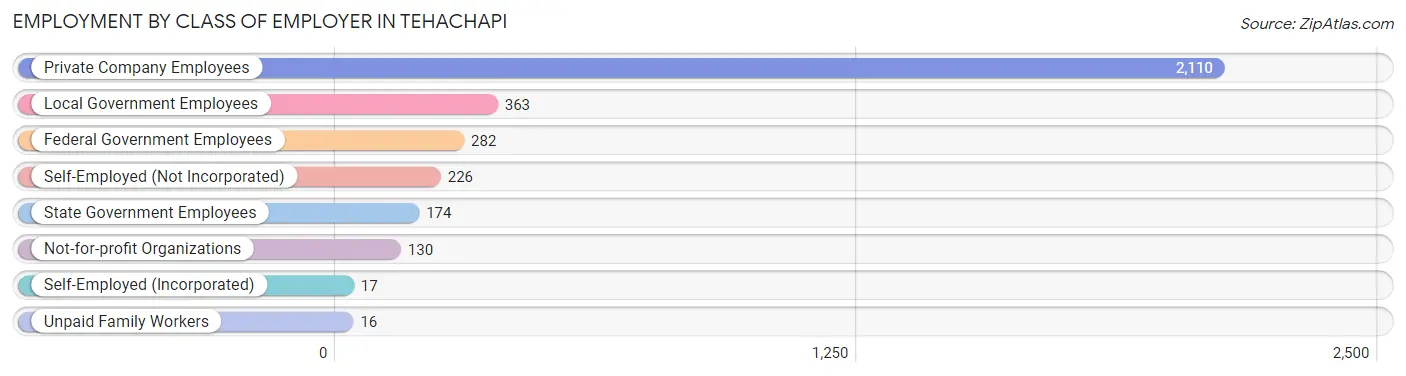
| Employer Class | # Employees | % Employees |
| Private Company Employees | 2,110 | 63.6% |
| Self-Employed (Incorporated) | 17 | 0.5% |
| Self-Employed (Not Incorporated) | 226 | 6.8% |
| Not-for-profit Organizations | 130 | 3.9% |
| Local Government Employees | 363 | 10.9% |
| State Government Employees | 174 | 5.2% |
| Federal Government Employees | 282 | 8.5% |
| Unpaid Family Workers | 16 | 0.5% |
| Total | 3,318 | 100.0% |
Employment Status by Age in Tehachapi
According to the labor force statistics for Tehachapi, out of the total population over 16 years of age (10,537), 34.4% or 3,625 individuals are in the labor force, with 8.6% or 312 of them unemployed. The age group with the highest labor force participation rate is 35 to 44 years, with 49.5% or 1,162 individuals in the labor force. Within the labor force, the 30 to 34 years age range has the highest percentage of unemployed individuals, with 15.4% or 98 of them being unemployed.
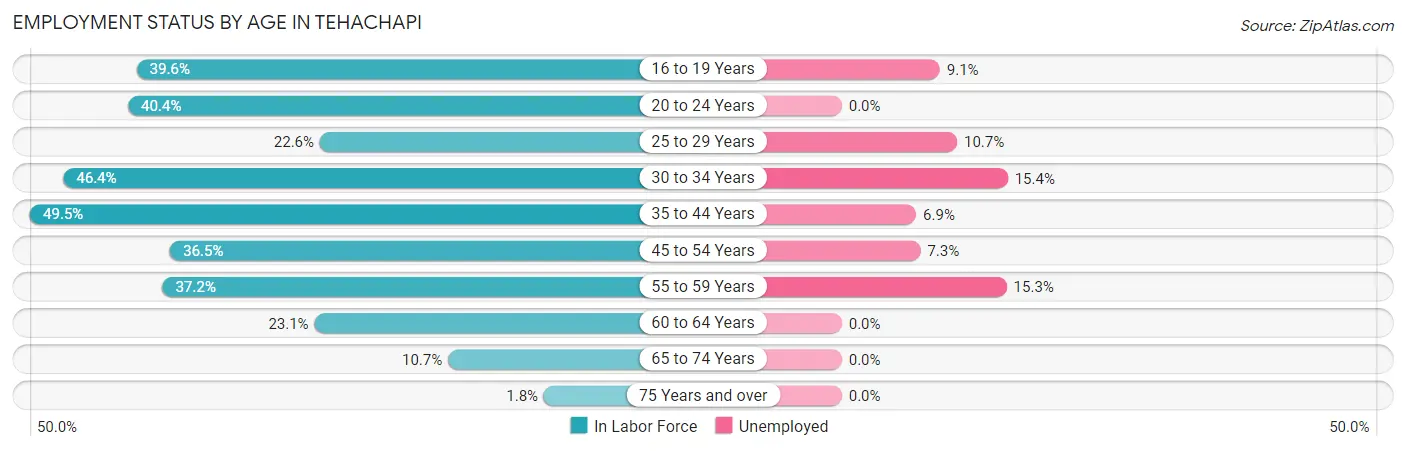
| Age Bracket | In Labor Force | Unemployed |
| 16 to 19 Years | 230 (39.6%) | 21 (9.1%) |
| 20 to 24 Years | 201 (40.4%) | 0 (0.0%) |
| 25 to 29 Years | 196 (22.6%) | 21 (10.7%) |
| 30 to 34 Years | 637 (46.4%) | 98 (15.4%) |
| 35 to 44 Years | 1,162 (49.5%) | 80 (6.9%) |
| 45 to 54 Years | 642 (36.5%) | 47 (7.3%) |
| 55 to 59 Years | 275 (37.2%) | 42 (15.3%) |
| 60 to 64 Years | 170 (23.1%) | 0 (0.0%) |
| 65 to 74 Years | 98 (10.7%) | 0 (0.0%) |
| 75 Years and over | 13 (1.8%) | 0 (0.0%) |
| Total | 3,625 (34.4%) | 312 (8.6%) |
Employment Status by Educational Attainment in Tehachapi
According to labor force statistics for Tehachapi, 39.4% of individuals (3,081) out of the total population between 25 and 64 years of age (7,820) are in the labor force, with 9.4% or 290 of them being unemployed. The group with the highest labor force participation rate are those with the educational attainment of bachelor's degree or higher, with 70.6% or 632 individuals in the labor force. Within the labor force, individuals with high school diploma education have the highest percentage of unemployment, with 21.9% or 150 of them being unemployed.
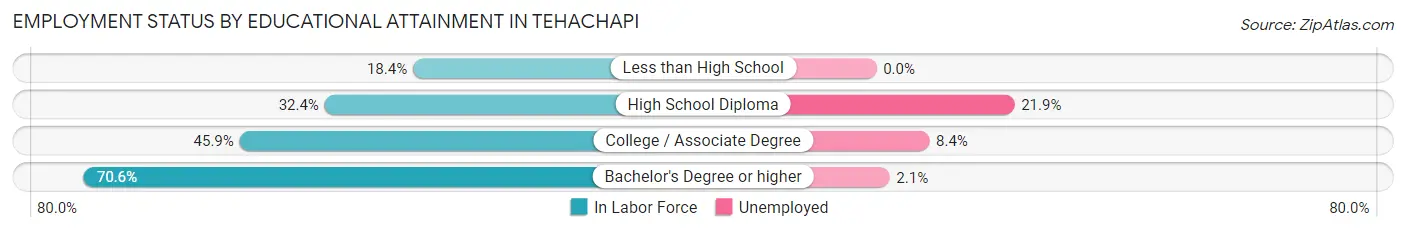
| Educational Attainment | In Labor Force | Unemployed |
| Less than High School | 297 (18.4%) | 0 (0.0%) |
| High School Diploma | 685 (32.4%) | 463 (21.9%) |
| College / Associate Degree | 1,468 (45.9%) | 269 (8.4%) |
| Bachelor's Degree or higher | 632 (70.6%) | 19 (2.1%) |
| Total | 3,081 (39.4%) | 735 (9.4%) |
Employment Occupations by Sex in Tehachapi
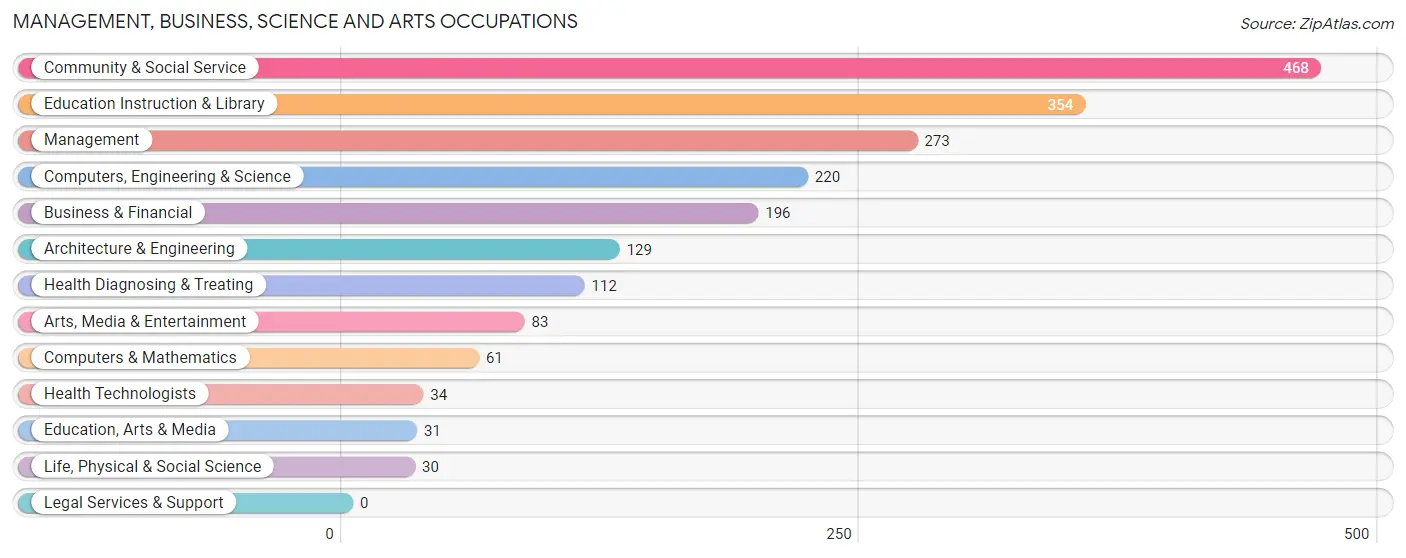
Management, Business, Science and Arts Occupations
The most common Management, Business, Science and Arts occupations in Tehachapi are Community & Social Service (468 | 14.3%), Education Instruction & Library (354 | 10.8%), Management (273 | 8.4%), Computers, Engineering & Science (220 | 6.7%), and Business & Financial (196 | 6.0%).
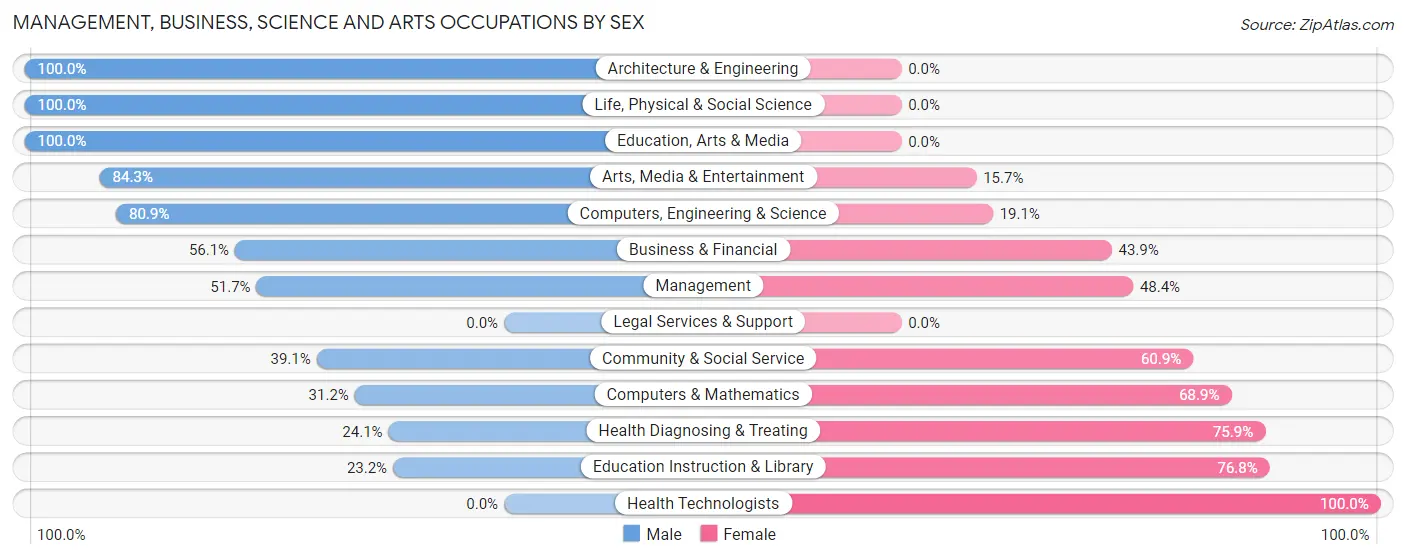
Management, Business, Science and Arts Occupations by Sex
Within the Management, Business, Science and Arts occupations in Tehachapi, the most male-oriented occupations are Architecture & Engineering (100.0%), Life, Physical & Social Science (100.0%), and Education, Arts & Media (100.0%), while the most female-oriented occupations are Health Technologists (100.0%), Education Instruction & Library (76.8%), and Health Diagnosing & Treating (75.9%).
| Occupation | Male | Female |
| Management | 141 (51.6%) | 132 (48.3%) |
| Business & Financial | 110 (56.1%) | 86 (43.9%) |
| Computers, Engineering & Science | 178 (80.9%) | 42 (19.1%) |
| Computers & Mathematics | 19 (31.1%) | 42 (68.9%) |
| Architecture & Engineering | 129 (100.0%) | 0 (0.0%) |
| Life, Physical & Social Science | 30 (100.0%) | 0 (0.0%) |
| Community & Social Service | 183 (39.1%) | 285 (60.9%) |
| Education, Arts & Media | 31 (100.0%) | 0 (0.0%) |
| Legal Services & Support | 0 (0.0%) | 0 (0.0%) |
| Education Instruction & Library | 82 (23.2%) | 272 (76.8%) |
| Arts, Media & Entertainment | 70 (84.3%) | 13 (15.7%) |
| Health Diagnosing & Treating | 27 (24.1%) | 85 (75.9%) |
| Health Technologists | 0 (0.0%) | 34 (100.0%) |
| Total (Category) | 639 (50.3%) | 630 (49.6%) |
| Total (Overall) | 1,933 (59.3%) | 1,329 (40.7%) |
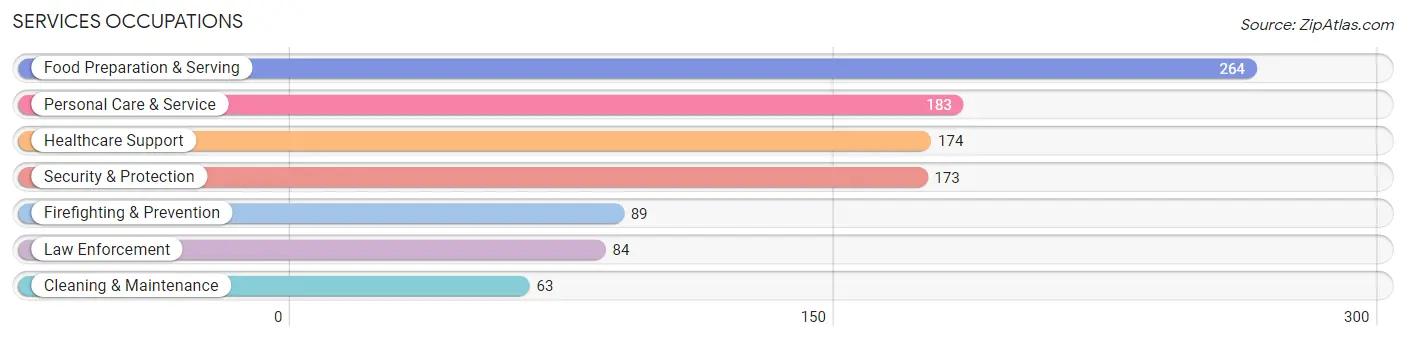
Services Occupations
The most common Services occupations in Tehachapi are Food Preparation & Serving (264 | 8.1%), Personal Care & Service (183 | 5.6%), Healthcare Support (174 | 5.3%), Security & Protection (173 | 5.3%), and Firefighting & Prevention (89 | 2.7%).
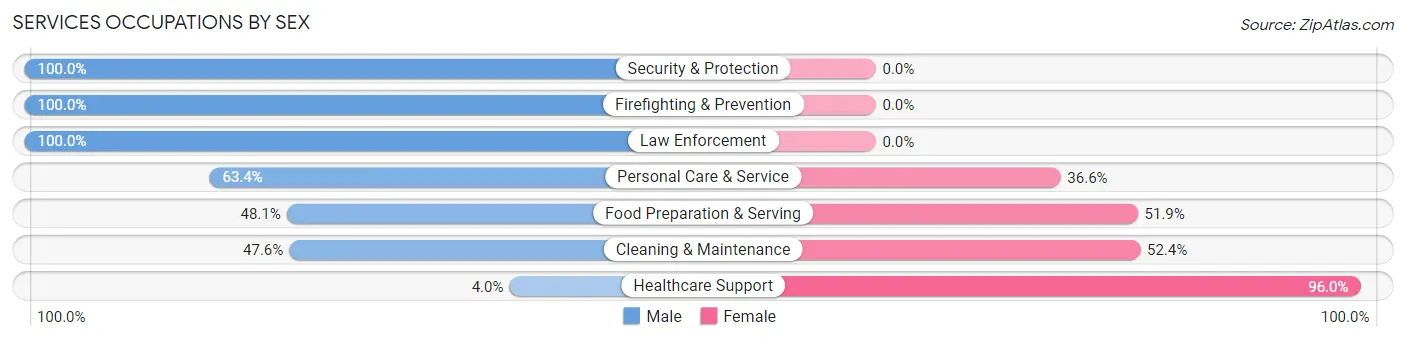
Services Occupations by Sex
Within the Services occupations in Tehachapi, the most male-oriented occupations are Security & Protection (100.0%), Firefighting & Prevention (100.0%), and Law Enforcement (100.0%), while the most female-oriented occupations are Healthcare Support (96.0%), Cleaning & Maintenance (52.4%), and Food Preparation & Serving (51.9%).
| Occupation | Male | Female |
| Healthcare Support | 7 (4.0%) | 167 (96.0%) |
| Security & Protection | 173 (100.0%) | 0 (0.0%) |
| Firefighting & Prevention | 89 (100.0%) | 0 (0.0%) |
| Law Enforcement | 84 (100.0%) | 0 (0.0%) |
| Food Preparation & Serving | 127 (48.1%) | 137 (51.9%) |
| Cleaning & Maintenance | 30 (47.6%) | 33 (52.4%) |
| Personal Care & Service | 116 (63.4%) | 67 (36.6%) |
| Total (Category) | 453 (52.9%) | 404 (47.1%) |
| Total (Overall) | 1,933 (59.3%) | 1,329 (40.7%) |
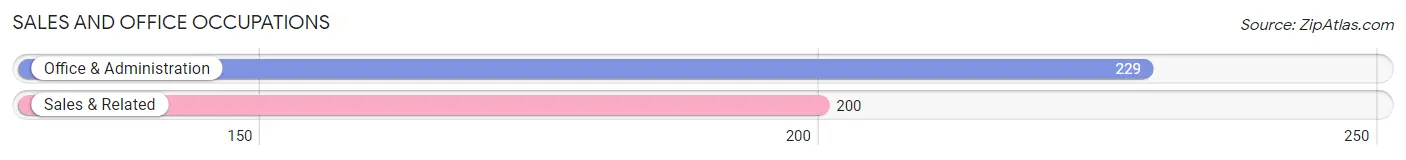
Sales and Office Occupations
The most common Sales and Office occupations in Tehachapi are Office & Administration (229 | 7.0%), and Sales & Related (200 | 6.1%).
Sales and Office Occupations by Sex
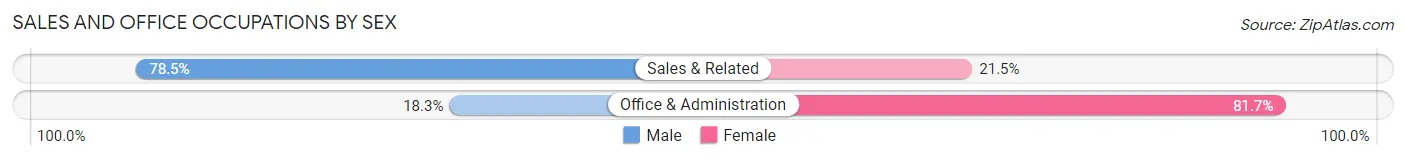
| Occupation | Male | Female |
| Sales & Related | 157 (78.5%) | 43 (21.5%) |
| Office & Administration | 42 (18.3%) | 187 (81.7%) |
| Total (Category) | 199 (46.4%) | 230 (53.6%) |
| Total (Overall) | 1,933 (59.3%) | 1,329 (40.7%) |
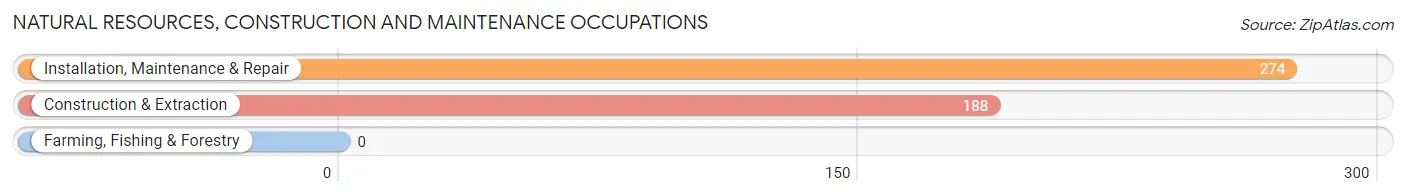
Natural Resources, Construction and Maintenance Occupations
The most common Natural Resources, Construction and Maintenance occupations in Tehachapi are Installation, Maintenance & Repair (274 | 8.4%), and Construction & Extraction (188 | 5.8%).
Natural Resources, Construction and Maintenance Occupations by Sex
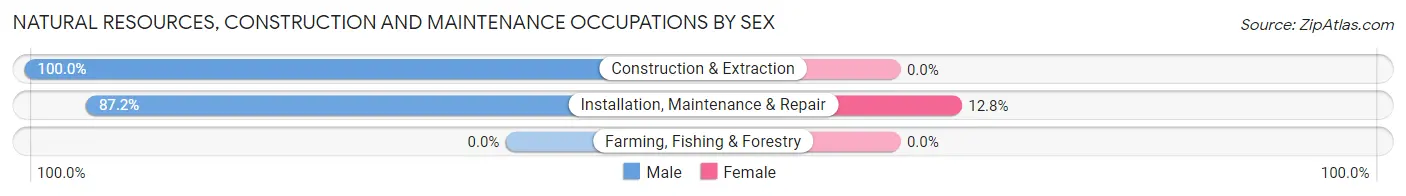
| Occupation | Male | Female |
| Farming, Fishing & Forestry | 0 (0.0%) | 0 (0.0%) |
| Construction & Extraction | 188 (100.0%) | 0 (0.0%) |
| Installation, Maintenance & Repair | 239 (87.2%) | 35 (12.8%) |
| Total (Category) | 427 (92.4%) | 35 (7.6%) |
| Total (Overall) | 1,933 (59.3%) | 1,329 (40.7%) |
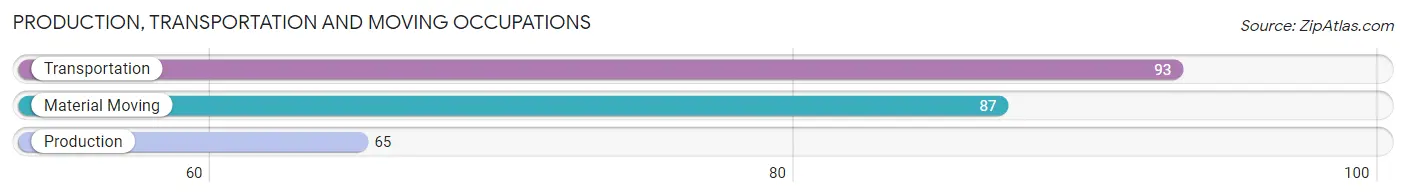
Production, Transportation and Moving Occupations
The most common Production, Transportation and Moving occupations in Tehachapi are Transportation (93 | 2.9%), Material Moving (87 | 2.7%), and Production (65 | 2.0%).
Production, Transportation and Moving Occupations by Sex
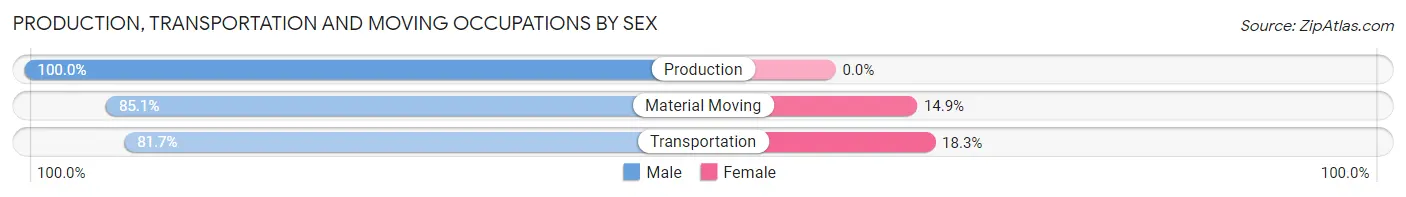
| Occupation | Male | Female |
| Production | 65 (100.0%) | 0 (0.0%) |
| Transportation | 76 (81.7%) | 17 (18.3%) |
| Material Moving | 74 (85.1%) | 13 (14.9%) |
| Total (Category) | 215 (87.8%) | 30 (12.2%) |
| Total (Overall) | 1,933 (59.3%) | 1,329 (40.7%) |
Employment Industries by Sex in Tehachapi
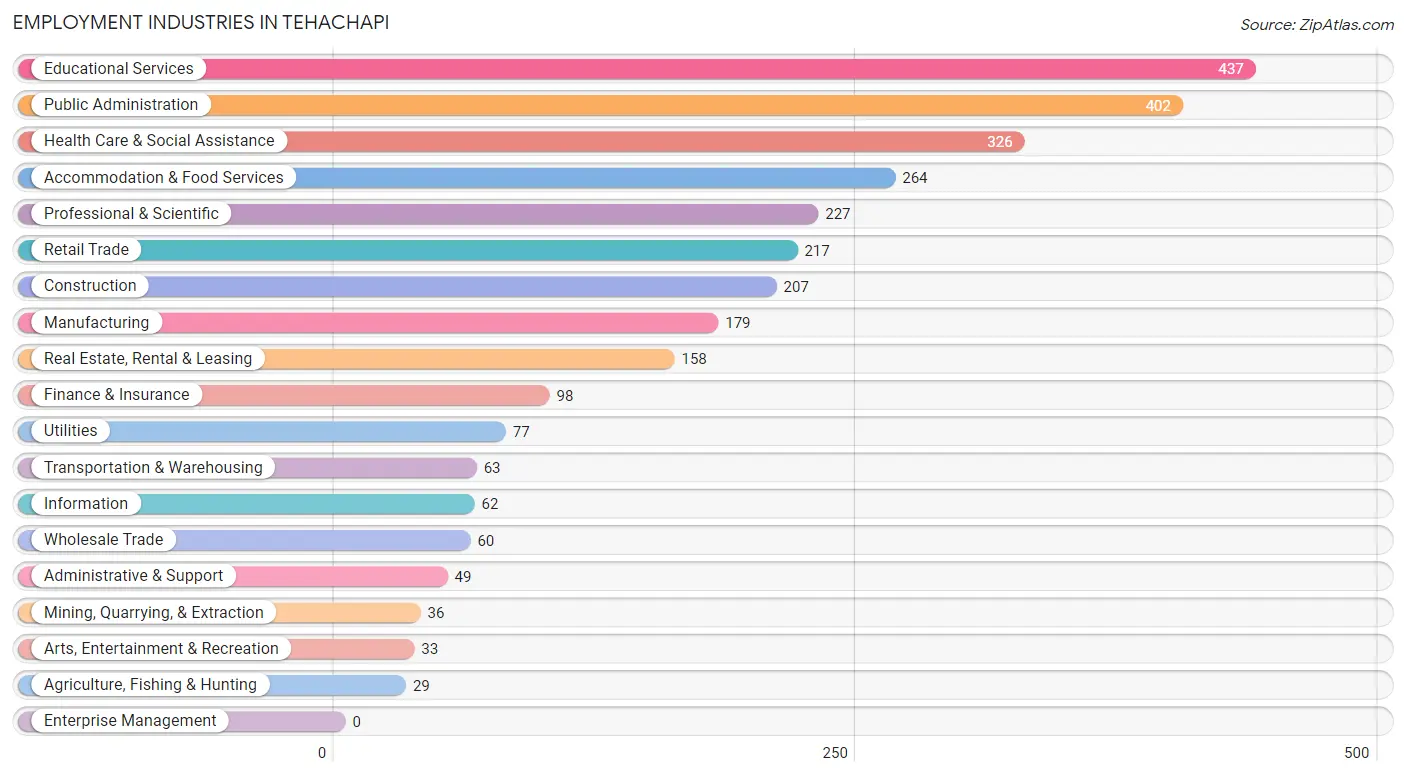
Employment Industries in Tehachapi
The major employment industries in Tehachapi include Educational Services (437 | 13.4%), Public Administration (402 | 12.3%), Health Care & Social Assistance (326 | 10.0%), Accommodation & Food Services (264 | 8.1%), and Professional & Scientific (227 | 7.0%).
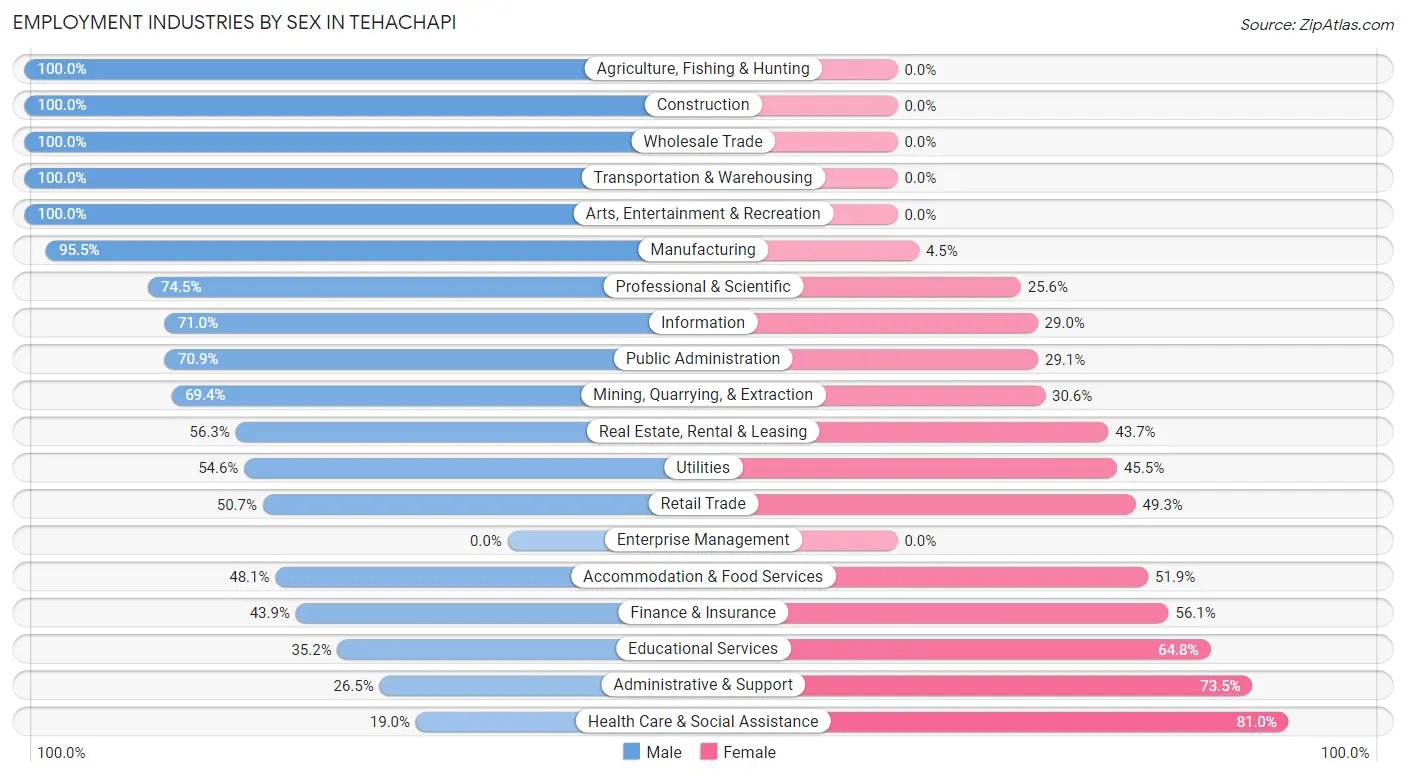
Employment Industries by Sex in Tehachapi
The Tehachapi industries that see more men than women are Agriculture, Fishing & Hunting (100.0%), Construction (100.0%), and Wholesale Trade (100.0%), whereas the industries that tend to have a higher number of women are Health Care & Social Assistance (81.0%), Administrative & Support (73.5%), and Educational Services (64.8%).
| Industry | Male | Female |
| Agriculture, Fishing & Hunting | 29 (100.0%) | 0 (0.0%) |
| Mining, Quarrying, & Extraction | 25 (69.4%) | 11 (30.6%) |
| Construction | 207 (100.0%) | 0 (0.0%) |
| Manufacturing | 171 (95.5%) | 8 (4.5%) |
| Wholesale Trade | 60 (100.0%) | 0 (0.0%) |
| Retail Trade | 110 (50.7%) | 107 (49.3%) |
| Transportation & Warehousing | 63 (100.0%) | 0 (0.0%) |
| Utilities | 42 (54.5%) | 35 (45.5%) |
| Information | 44 (71.0%) | 18 (29.0%) |
| Finance & Insurance | 43 (43.9%) | 55 (56.1%) |
| Real Estate, Rental & Leasing | 89 (56.3%) | 69 (43.7%) |
| Professional & Scientific | 169 (74.5%) | 58 (25.6%) |
| Enterprise Management | 0 (0.0%) | 0 (0.0%) |
| Administrative & Support | 13 (26.5%) | 36 (73.5%) |
| Educational Services | 154 (35.2%) | 283 (64.8%) |
| Health Care & Social Assistance | 62 (19.0%) | 264 (81.0%) |
| Arts, Entertainment & Recreation | 33 (100.0%) | 0 (0.0%) |
| Accommodation & Food Services | 127 (48.1%) | 137 (51.9%) |
| Public Administration | 285 (70.9%) | 117 (29.1%) |
| Total | 1,933 (59.3%) | 1,329 (40.7%) |
Education in Tehachapi
School Enrollment in Tehachapi
The most common levels of schooling among the 3,264 students in Tehachapi are high school (862 | 26.4%), college / undergraduate (823 | 25.2%), and elementary school (623 | 19.1%).
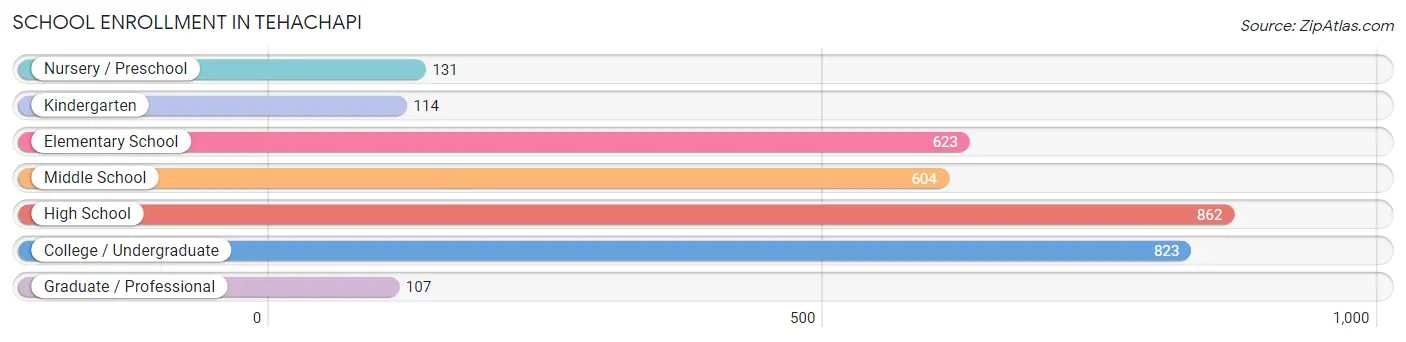
| School Level | # Students | % Students |
| Nursery / Preschool | 131 | 4.0% |
| Kindergarten | 114 | 3.5% |
| Elementary School | 623 | 19.1% |
| Middle School | 604 | 18.5% |
| High School | 862 | 26.4% |
| College / Undergraduate | 823 | 25.2% |
| Graduate / Professional | 107 | 3.3% |
| Total | 3,264 | 100.0% |
School Enrollment by Age by Funding Source in Tehachapi
Out of a total of 3,264 students who are enrolled in schools in Tehachapi, 1,129 (34.6%) attend a private institution, while the remaining 2,135 (65.4%) are enrolled in public schools. The age group of 3 to 4 year olds has the highest likelihood of being enrolled in private schools, with 53 (100.0% in the age bracket) enrolled. Conversely, the age group of 18 to 19 year olds has the lowest likelihood of being enrolled in a private school, with 94 (100.0% in the age bracket) attending a public institution.
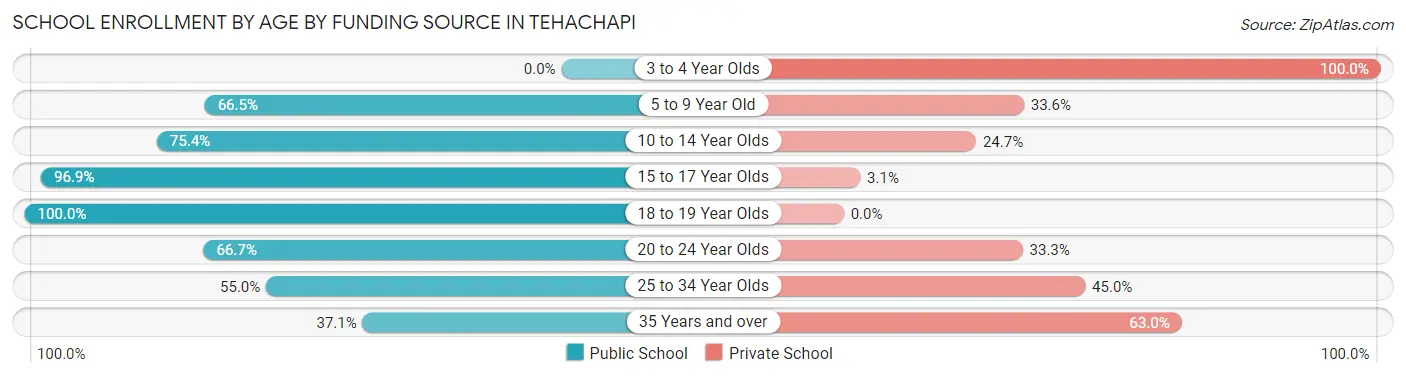
| Age Bracket | Public School | Private School |
| 3 to 4 Year Olds | 0 (0.0%) | 53 (100.0%) |
| 5 to 9 Year Old | 523 (66.4%) | 264 (33.6%) |
| 10 to 14 Year Olds | 483 (75.3%) | 158 (24.6%) |
| 15 to 17 Year Olds | 473 (96.9%) | 15 (3.1%) |
| 18 to 19 Year Olds | 94 (100.0%) | 0 (0.0%) |
| 20 to 24 Year Olds | 62 (66.7%) | 31 (33.3%) |
| 25 to 34 Year Olds | 274 (55.0%) | 224 (45.0%) |
| 35 Years and over | 226 (37.0%) | 384 (62.9%) |
| Total | 2,135 (65.4%) | 1,129 (34.6%) |
Educational Attainment by Field of Study in Tehachapi
Business (313 | 20.0%), physical & health sciences (293 | 18.7%), liberal arts & history (176 | 11.2%), communications (171 | 10.9%), and engineering (126 | 8.0%) are the most common fields of study among 1,568 individuals in Tehachapi who have obtained a bachelor's degree or higher.
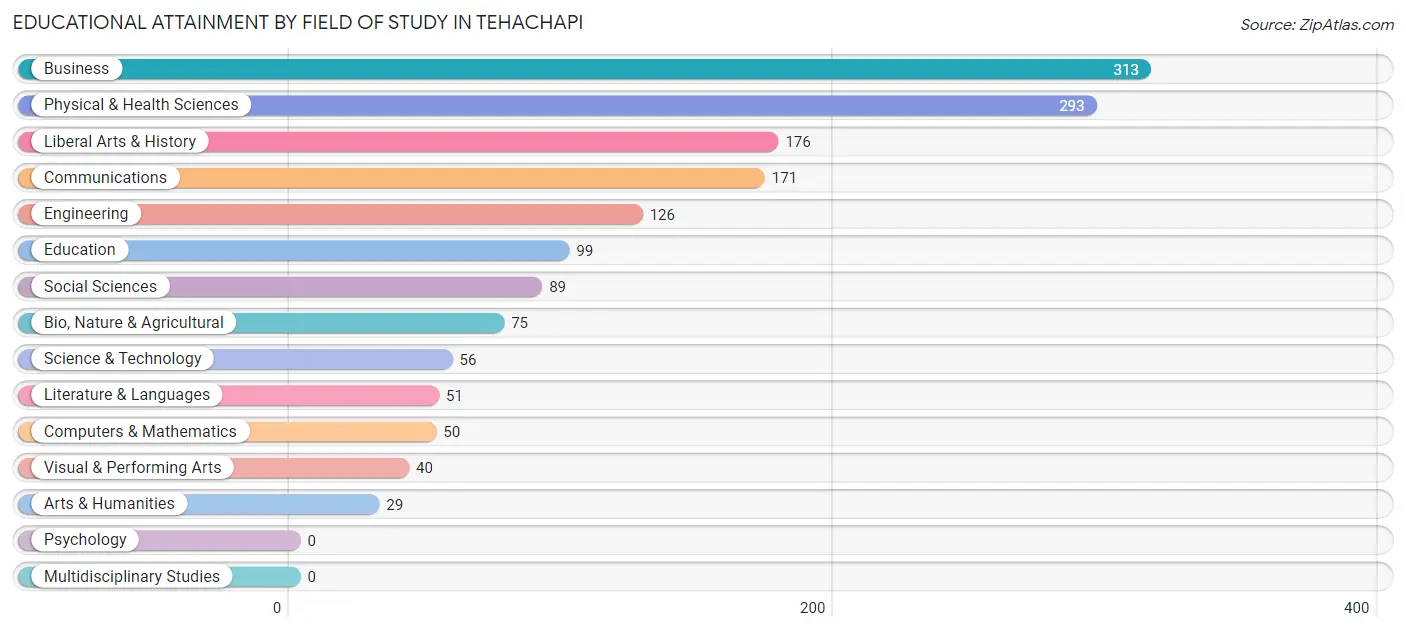
| Field of Study | # Graduates | % Graduates |
| Computers & Mathematics | 50 | 3.2% |
| Bio, Nature & Agricultural | 75 | 4.8% |
| Physical & Health Sciences | 293 | 18.7% |
| Psychology | 0 | 0.0% |
| Social Sciences | 89 | 5.7% |
| Engineering | 126 | 8.0% |
| Multidisciplinary Studies | 0 | 0.0% |
| Science & Technology | 56 | 3.6% |
| Business | 313 | 20.0% |
| Education | 99 | 6.3% |
| Literature & Languages | 51 | 3.3% |
| Liberal Arts & History | 176 | 11.2% |
| Visual & Performing Arts | 40 | 2.5% |
| Communications | 171 | 10.9% |
| Arts & Humanities | 29 | 1.8% |
| Total | 1,568 | 100.0% |
Transportation & Commute in Tehachapi
Vehicle Availability by Sex in Tehachapi
The most prevalent vehicle ownership categories in Tehachapi are males with 2 vehicles (905, accounting for 45.5%) and females with 2 vehicles (611, making up 68.1%).
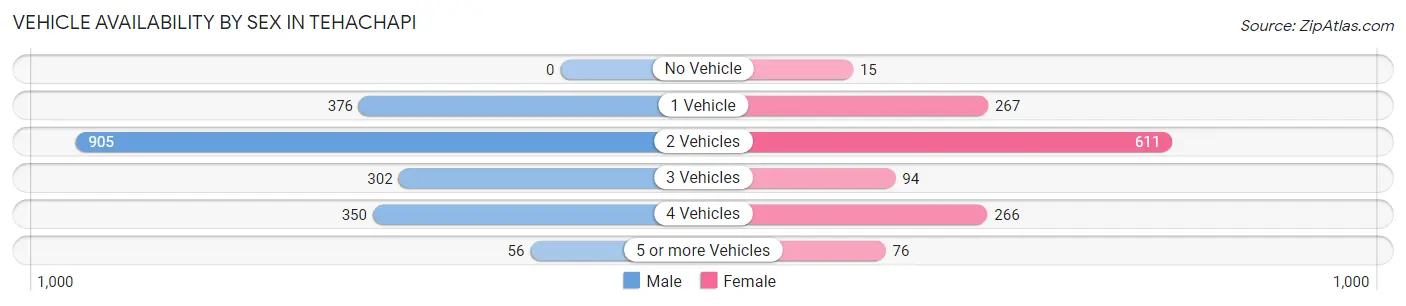
| Vehicles Available | Male | Female |
| No Vehicle | 0 (0.0%) | 15 (1.1%) |
| 1 Vehicle | 376 (18.9%) | 267 (20.1%) |
| 2 Vehicles | 905 (45.5%) | 611 (46.0%) |
| 3 Vehicles | 302 (15.2%) | 94 (7.1%) |
| 4 Vehicles | 350 (17.6%) | 266 (20.0%) |
| 5 or more Vehicles | 56 (2.8%) | 76 (5.7%) |
| Total | 1,989 (100.0%) | 1,329 (100.0%) |
Commute Time in Tehachapi
The most frequently occuring commute durations in Tehachapi are 5 to 9 minutes (769 commuters, 24.4%), 45 to 59 minutes (548 commuters, 17.4%), and 15 to 19 minutes (405 commuters, 12.9%).
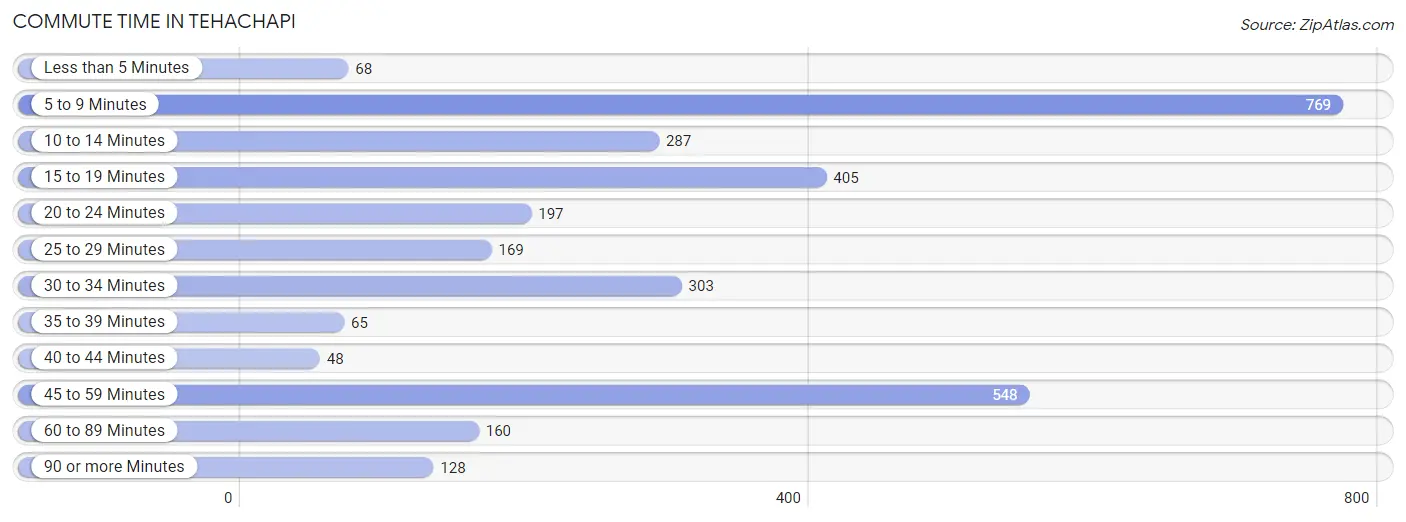
| Commute Time | # Commuters | % Commuters |
| Less than 5 Minutes | 68 | 2.2% |
| 5 to 9 Minutes | 769 | 24.4% |
| 10 to 14 Minutes | 287 | 9.1% |
| 15 to 19 Minutes | 405 | 12.9% |
| 20 to 24 Minutes | 197 | 6.3% |
| 25 to 29 Minutes | 169 | 5.4% |
| 30 to 34 Minutes | 303 | 9.6% |
| 35 to 39 Minutes | 65 | 2.1% |
| 40 to 44 Minutes | 48 | 1.5% |
| 45 to 59 Minutes | 548 | 17.4% |
| 60 to 89 Minutes | 160 | 5.1% |
| 90 or more Minutes | 128 | 4.1% |
Commute Time by Sex in Tehachapi
The most common commute times in Tehachapi are 45 to 59 minutes (359 commuters, 18.3%) for males and 5 to 9 minutes (528 commuters, 44.4%) for females.
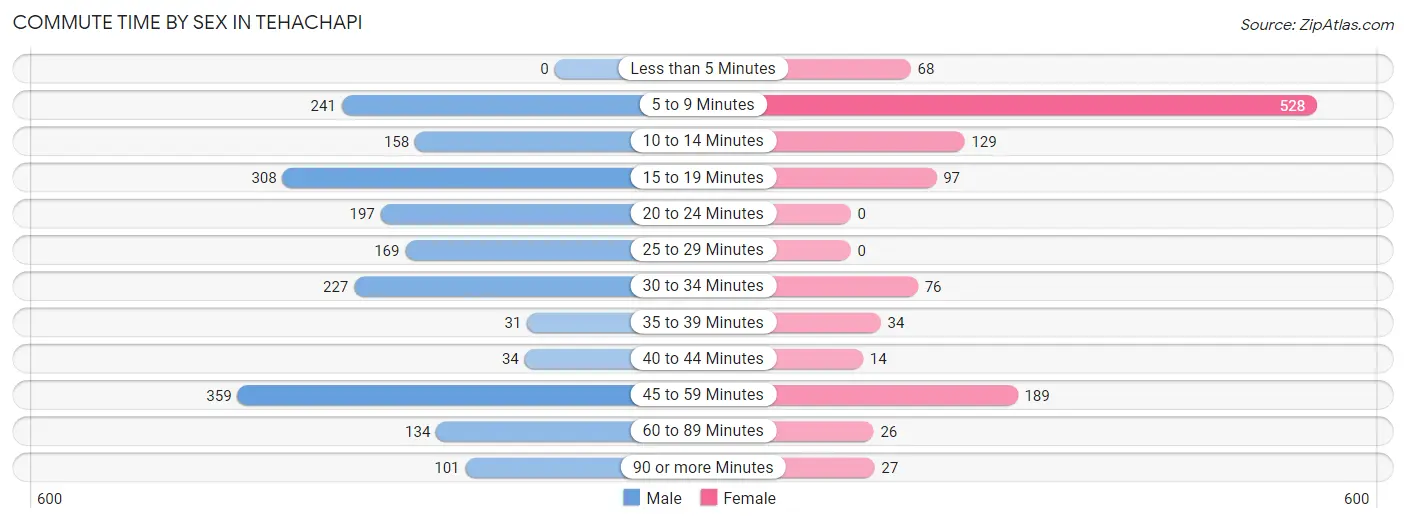
| Commute Time | Male | Female |
| Less than 5 Minutes | 0 (0.0%) | 68 (5.7%) |
| 5 to 9 Minutes | 241 (12.3%) | 528 (44.4%) |
| 10 to 14 Minutes | 158 (8.1%) | 129 (10.9%) |
| 15 to 19 Minutes | 308 (15.7%) | 97 (8.2%) |
| 20 to 24 Minutes | 197 (10.1%) | 0 (0.0%) |
| 25 to 29 Minutes | 169 (8.6%) | 0 (0.0%) |
| 30 to 34 Minutes | 227 (11.6%) | 76 (6.4%) |
| 35 to 39 Minutes | 31 (1.6%) | 34 (2.9%) |
| 40 to 44 Minutes | 34 (1.7%) | 14 (1.2%) |
| 45 to 59 Minutes | 359 (18.3%) | 189 (15.9%) |
| 60 to 89 Minutes | 134 (6.8%) | 26 (2.2%) |
| 90 or more Minutes | 101 (5.2%) | 27 (2.3%) |
Time of Departure to Work by Sex in Tehachapi
The most frequent times of departure to work in Tehachapi are 12:00 AM to 4:59 AM (313, 16.0%) for males and 7:00 AM to 7:29 AM (242, 20.4%) for females.
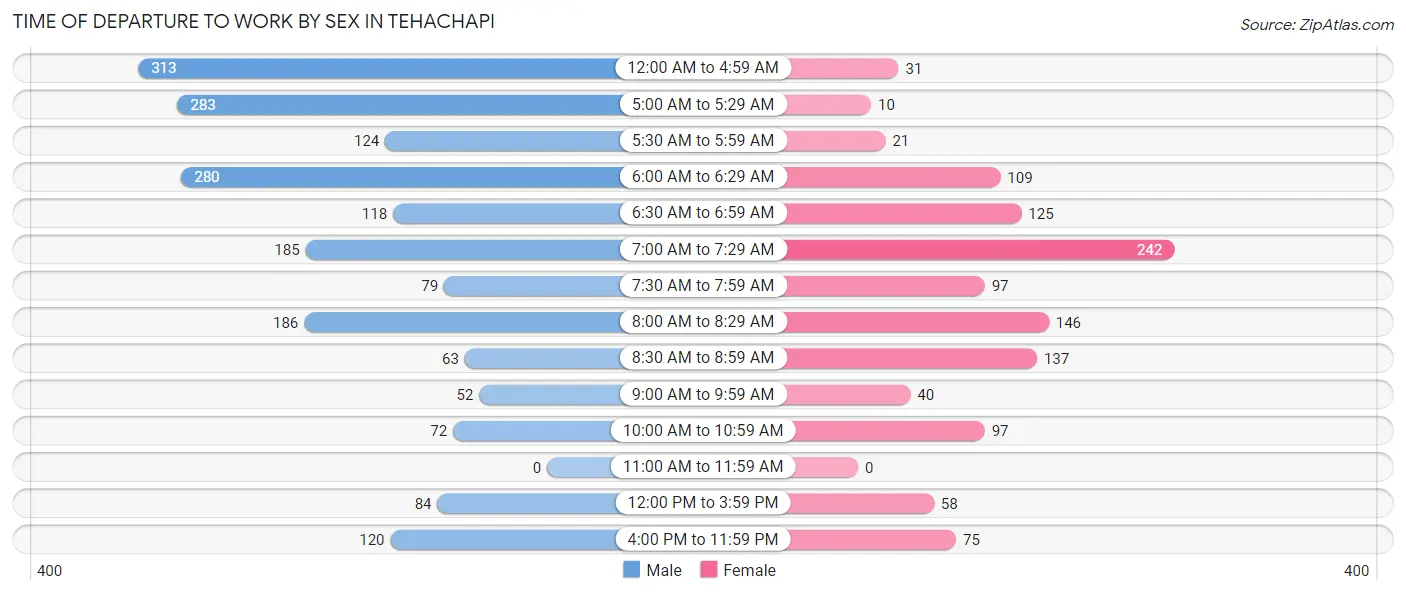
| Time of Departure | Male | Female |
| 12:00 AM to 4:59 AM | 313 (16.0%) | 31 (2.6%) |
| 5:00 AM to 5:29 AM | 283 (14.4%) | 10 (0.8%) |
| 5:30 AM to 5:59 AM | 124 (6.3%) | 21 (1.8%) |
| 6:00 AM to 6:29 AM | 280 (14.3%) | 109 (9.2%) |
| 6:30 AM to 6:59 AM | 118 (6.0%) | 125 (10.5%) |
| 7:00 AM to 7:29 AM | 185 (9.4%) | 242 (20.4%) |
| 7:30 AM to 7:59 AM | 79 (4.0%) | 97 (8.2%) |
| 8:00 AM to 8:29 AM | 186 (9.5%) | 146 (12.3%) |
| 8:30 AM to 8:59 AM | 63 (3.2%) | 137 (11.5%) |
| 9:00 AM to 9:59 AM | 52 (2.6%) | 40 (3.4%) |
| 10:00 AM to 10:59 AM | 72 (3.7%) | 97 (8.2%) |
| 11:00 AM to 11:59 AM | 0 (0.0%) | 0 (0.0%) |
| 12:00 PM to 3:59 PM | 84 (4.3%) | 58 (4.9%) |
| 4:00 PM to 11:59 PM | 120 (6.1%) | 75 (6.3%) |
| Total | 1,959 (100.0%) | 1,188 (100.0%) |
Housing Occupancy in Tehachapi
Occupancy by Ownership in Tehachapi
Of the total 3,664 dwellings in Tehachapi, owner-occupied units account for 2,265 (61.8%), while renter-occupied units make up 1,399 (38.2%).
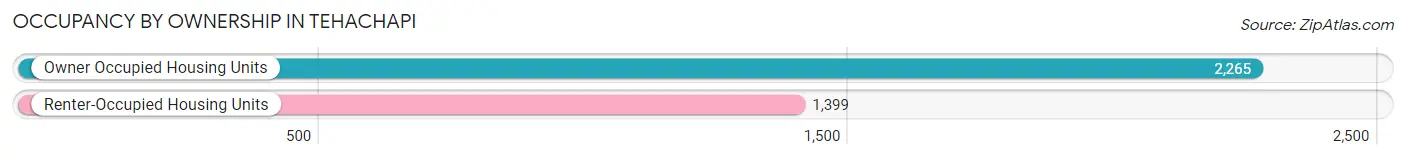
| Occupancy | # Housing Units | % Housing Units |
| Owner Occupied Housing Units | 2,265 | 61.8% |
| Renter-Occupied Housing Units | 1,399 | 38.2% |
| Total Occupied Housing Units | 3,664 | 100.0% |
Occupancy by Household Size in Tehachapi
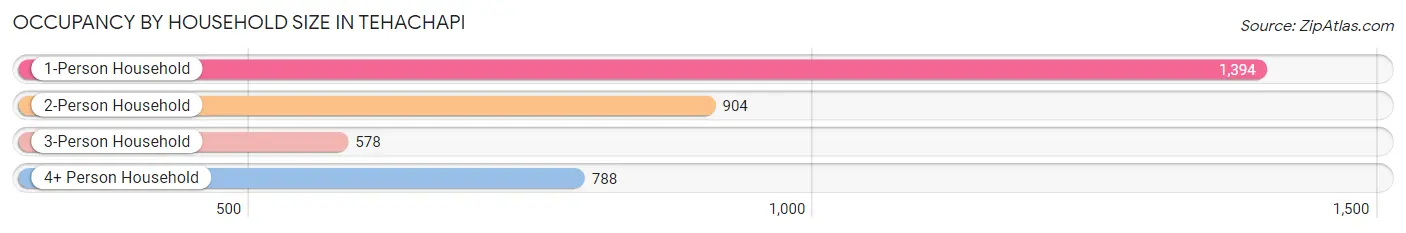
| Household Size | # Housing Units | % Housing Units |
| 1-Person Household | 1,394 | 38.1% |
| 2-Person Household | 904 | 24.7% |
| 3-Person Household | 578 | 15.8% |
| 4+ Person Household | 788 | 21.5% |
| Total Housing Units | 3,664 | 100.0% |
Occupancy by Ownership by Household Size in Tehachapi
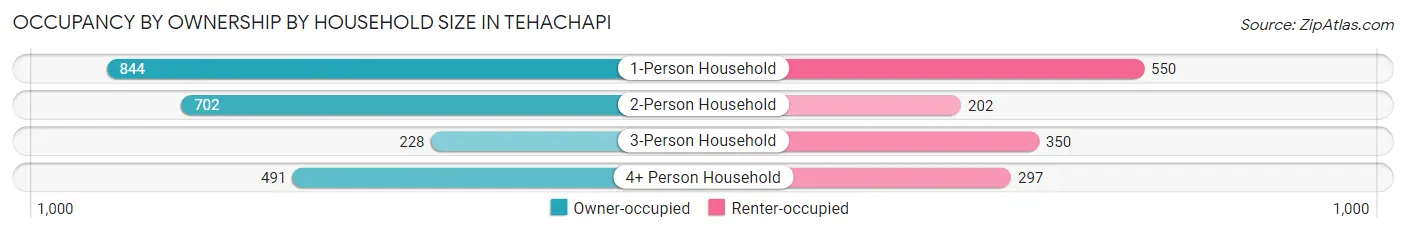
| Household Size | Owner-occupied | Renter-occupied |
| 1-Person Household | 844 (60.6%) | 550 (39.5%) |
| 2-Person Household | 702 (77.6%) | 202 (22.4%) |
| 3-Person Household | 228 (39.5%) | 350 (60.6%) |
| 4+ Person Household | 491 (62.3%) | 297 (37.7%) |
| Total Housing Units | 2,265 (61.8%) | 1,399 (38.2%) |
Occupancy by Educational Attainment in Tehachapi
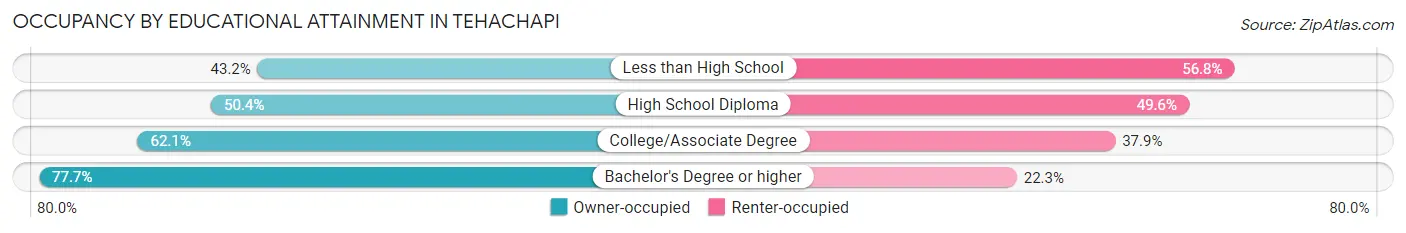
| Household Size | Owner-occupied | Renter-occupied |
| Less than High School | 108 (43.2%) | 142 (56.8%) |
| High School Diploma | 421 (50.4%) | 414 (49.6%) |
| College/Associate Degree | 1,064 (62.1%) | 650 (37.9%) |
| Bachelor's Degree or higher | 672 (77.7%) | 193 (22.3%) |
Occupancy by Age of Householder in Tehachapi
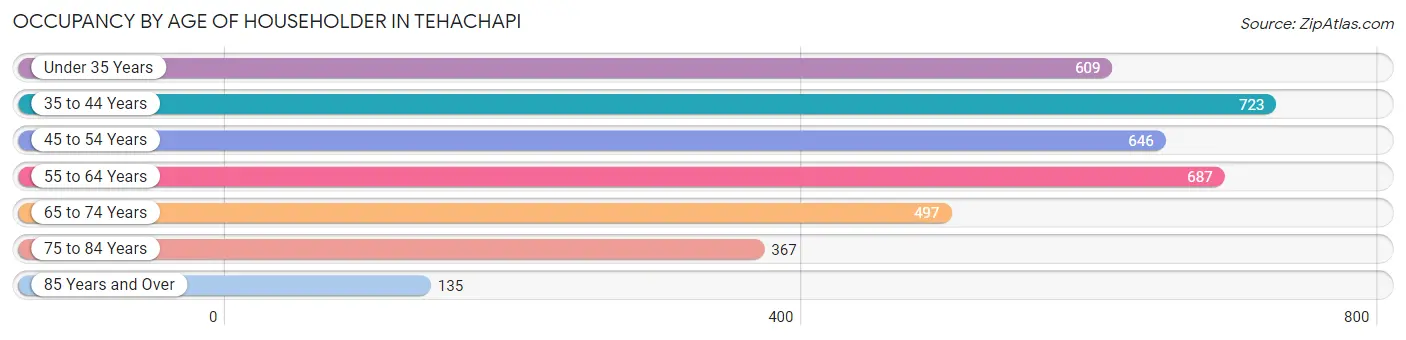
| Age Bracket | # Households | % Households |
| Under 35 Years | 609 | 16.6% |
| 35 to 44 Years | 723 | 19.7% |
| 45 to 54 Years | 646 | 17.6% |
| 55 to 64 Years | 687 | 18.8% |
| 65 to 74 Years | 497 | 13.6% |
| 75 to 84 Years | 367 | 10.0% |
| 85 Years and Over | 135 | 3.7% |
| Total | 3,664 | 100.0% |
Housing Finances in Tehachapi
Median Income by Occupancy in Tehachapi
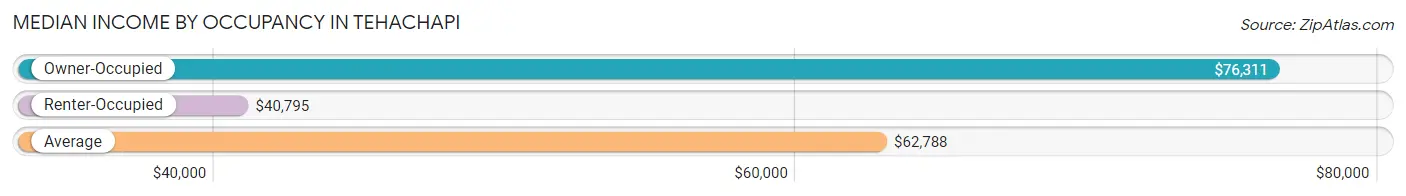
| Occupancy Type | # Households | Median Income |
| Owner-Occupied | 2,265 (61.8%) | $76,311 |
| Renter-Occupied | 1,399 (38.2%) | $40,795 |
| Average | 3,664 (100.0%) | $62,788 |
Occupancy by Householder Income Bracket in Tehachapi
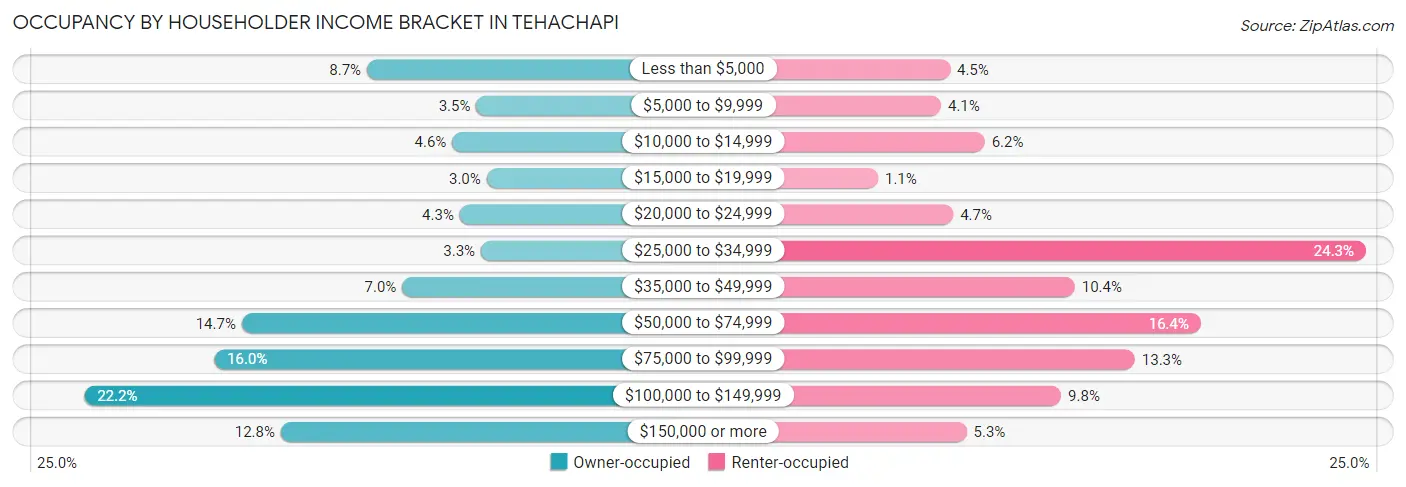
| Income Bracket | Owner-occupied | Renter-occupied |
| Less than $5,000 | 197 (8.7%) | 63 (4.5%) |
| $5,000 to $9,999 | 79 (3.5%) | 57 (4.1%) |
| $10,000 to $14,999 | 105 (4.6%) | 86 (6.1%) |
| $15,000 to $19,999 | 68 (3.0%) | 15 (1.1%) |
| $20,000 to $24,999 | 97 (4.3%) | 65 (4.6%) |
| $25,000 to $34,999 | 74 (3.3%) | 340 (24.3%) |
| $35,000 to $49,999 | 159 (7.0%) | 146 (10.4%) |
| $50,000 to $74,999 | 332 (14.7%) | 230 (16.4%) |
| $75,000 to $99,999 | 362 (16.0%) | 186 (13.3%) |
| $100,000 to $149,999 | 502 (22.2%) | 137 (9.8%) |
| $150,000 or more | 290 (12.8%) | 74 (5.3%) |
| Total | 2,265 (100.0%) | 1,399 (100.0%) |
Monthly Housing Cost Tiers in Tehachapi
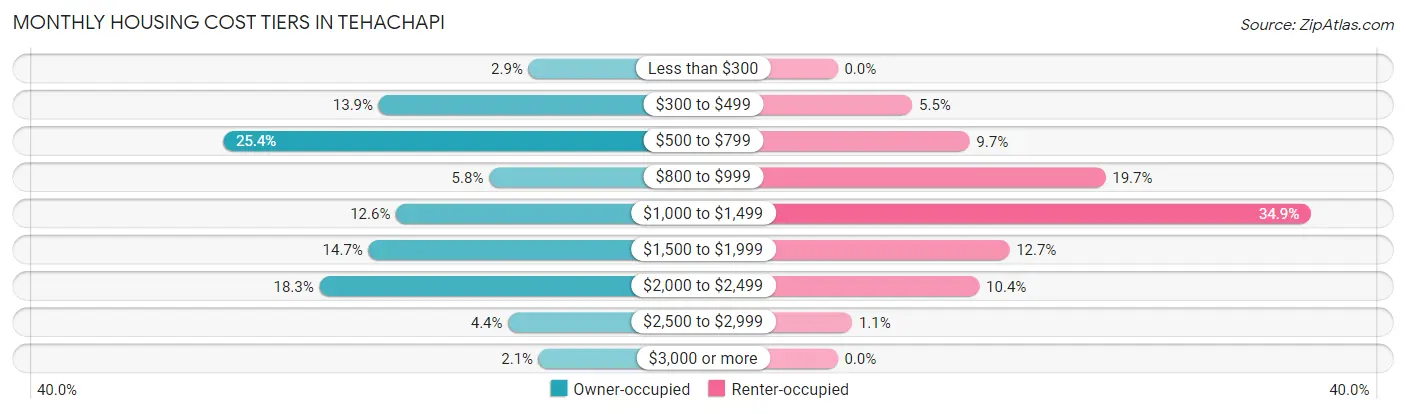
| Monthly Cost | Owner-occupied | Renter-occupied |
| Less than $300 | 65 (2.9%) | 0 (0.0%) |
| $300 to $499 | 315 (13.9%) | 77 (5.5%) |
| $500 to $799 | 575 (25.4%) | 136 (9.7%) |
| $800 to $999 | 131 (5.8%) | 276 (19.7%) |
| $1,000 to $1,499 | 286 (12.6%) | 488 (34.9%) |
| $1,500 to $1,999 | 332 (14.7%) | 177 (12.7%) |
| $2,000 to $2,499 | 414 (18.3%) | 146 (10.4%) |
| $2,500 to $2,999 | 99 (4.4%) | 15 (1.1%) |
| $3,000 or more | 48 (2.1%) | 0 (0.0%) |
| Total | 2,265 (100.0%) | 1,399 (100.0%) |
Physical Housing Characteristics in Tehachapi
Housing Structures in Tehachapi
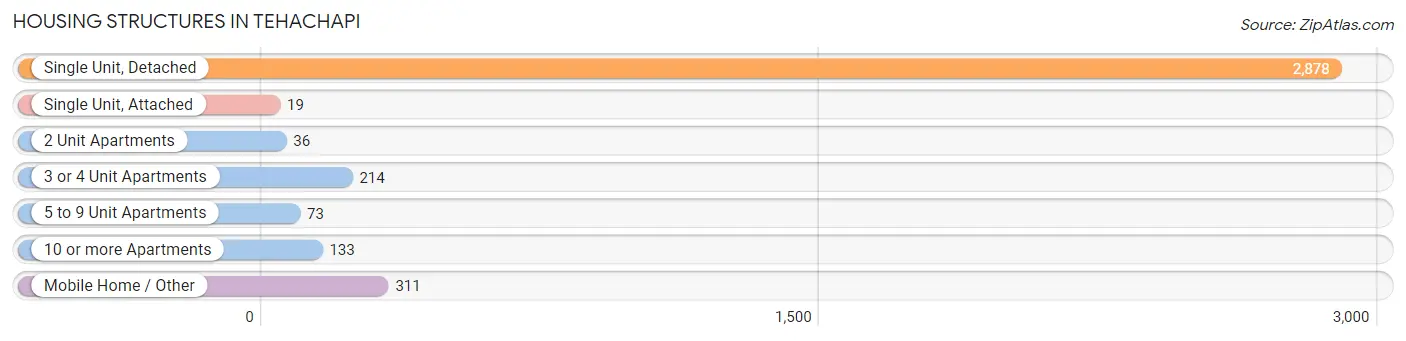
| Structure Type | # Housing Units | % Housing Units |
| Single Unit, Detached | 2,878 | 78.5% |
| Single Unit, Attached | 19 | 0.5% |
| 2 Unit Apartments | 36 | 1.0% |
| 3 or 4 Unit Apartments | 214 | 5.8% |
| 5 to 9 Unit Apartments | 73 | 2.0% |
| 10 or more Apartments | 133 | 3.6% |
| Mobile Home / Other | 311 | 8.5% |
| Total | 3,664 | 100.0% |
Housing Structures by Occupancy in Tehachapi
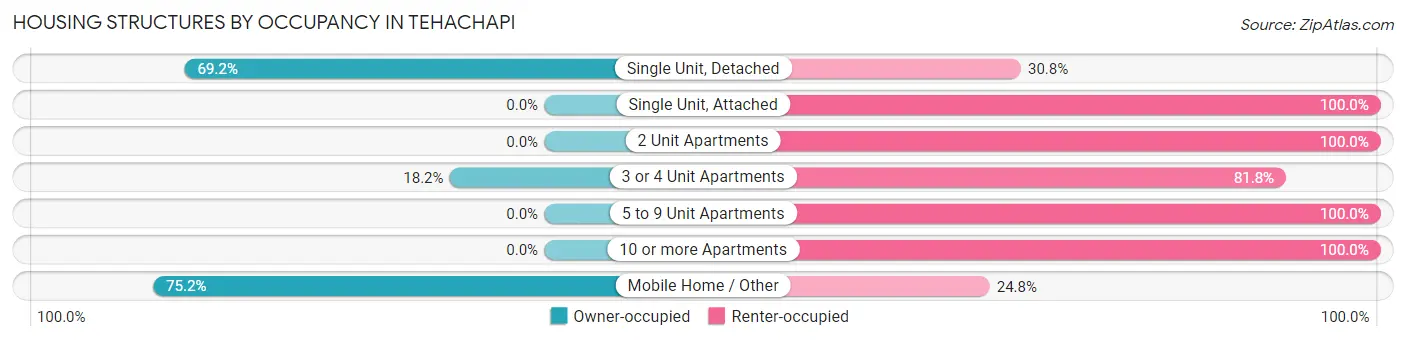
| Structure Type | Owner-occupied | Renter-occupied |
| Single Unit, Detached | 1,992 (69.2%) | 886 (30.8%) |
| Single Unit, Attached | 0 (0.0%) | 19 (100.0%) |
| 2 Unit Apartments | 0 (0.0%) | 36 (100.0%) |
| 3 or 4 Unit Apartments | 39 (18.2%) | 175 (81.8%) |
| 5 to 9 Unit Apartments | 0 (0.0%) | 73 (100.0%) |
| 10 or more Apartments | 0 (0.0%) | 133 (100.0%) |
| Mobile Home / Other | 234 (75.2%) | 77 (24.8%) |
| Total | 2,265 (61.8%) | 1,399 (38.2%) |
Housing Structures by Number of Rooms in Tehachapi
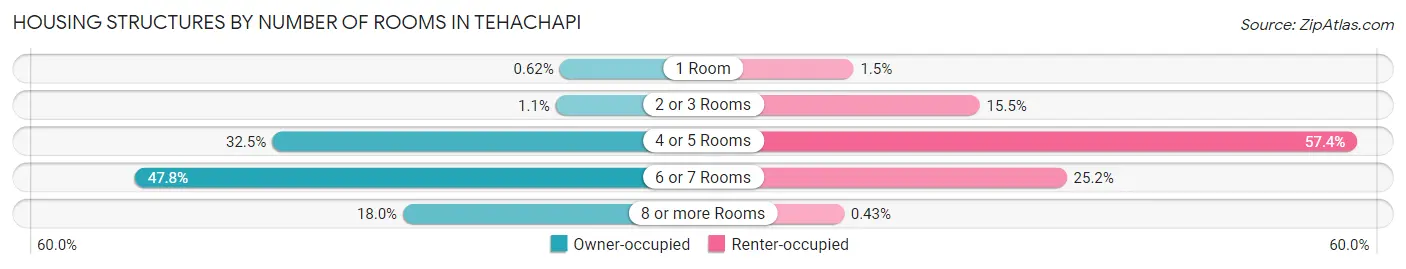
| Number of Rooms | Owner-occupied | Renter-occupied |
| 1 Room | 14 (0.6%) | 21 (1.5%) |
| 2 or 3 Rooms | 24 (1.1%) | 217 (15.5%) |
| 4 or 5 Rooms | 737 (32.5%) | 803 (57.4%) |
| 6 or 7 Rooms | 1,082 (47.8%) | 352 (25.2%) |
| 8 or more Rooms | 408 (18.0%) | 6 (0.4%) |
| Total | 2,265 (100.0%) | 1,399 (100.0%) |
Housing Structure by Heating Type in Tehachapi
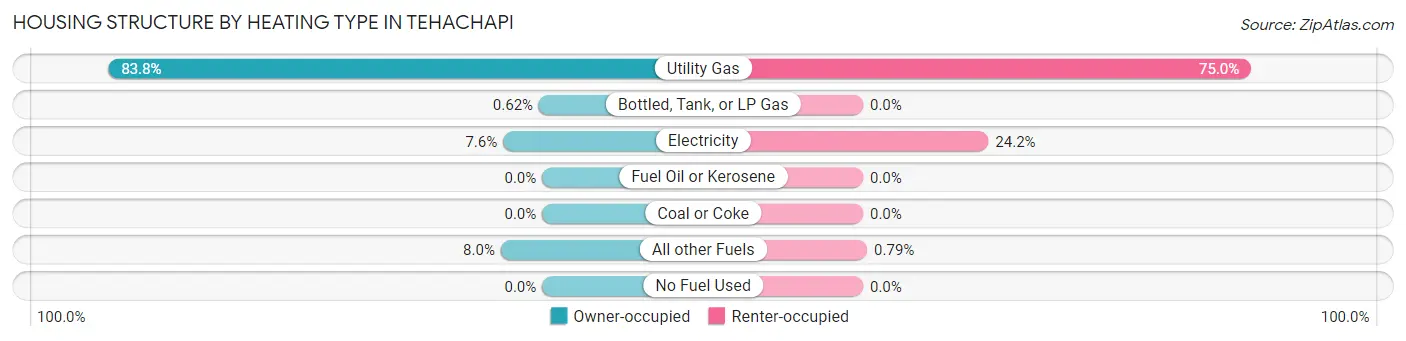
| Heating Type | Owner-occupied | Renter-occupied |
| Utility Gas | 1,899 (83.8%) | 1,049 (75.0%) |
| Bottled, Tank, or LP Gas | 14 (0.6%) | 0 (0.0%) |
| Electricity | 171 (7.5%) | 339 (24.2%) |
| Fuel Oil or Kerosene | 0 (0.0%) | 0 (0.0%) |
| Coal or Coke | 0 (0.0%) | 0 (0.0%) |
| All other Fuels | 181 (8.0%) | 11 (0.8%) |
| No Fuel Used | 0 (0.0%) | 0 (0.0%) |
| Total | 2,265 (100.0%) | 1,399 (100.0%) |
Household Vehicle Usage in Tehachapi
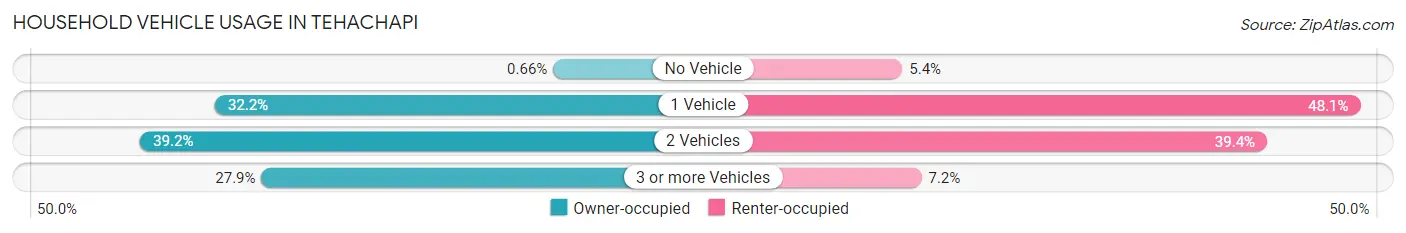
| Vehicles per Household | Owner-occupied | Renter-occupied |
| No Vehicle | 15 (0.7%) | 75 (5.4%) |
| 1 Vehicle | 730 (32.2%) | 673 (48.1%) |
| 2 Vehicles | 888 (39.2%) | 551 (39.4%) |
| 3 or more Vehicles | 632 (27.9%) | 100 (7.1%) |
| Total | 2,265 (100.0%) | 1,399 (100.0%) |
Real Estate & Mortgages in Tehachapi
Real Estate and Mortgage Overview in Tehachapi
| Characteristic | Without Mortgage | With Mortgage |
| Housing Units | 948 | 1,317 |
| Median Property Value | $306,100 | $335,100 |
| Median Household Income | $36,750 | $202 |
| Monthly Housing Costs | $572 | $48 |
| Real Estate Taxes | $1,878 | $14 |
Property Value by Mortgage Status in Tehachapi
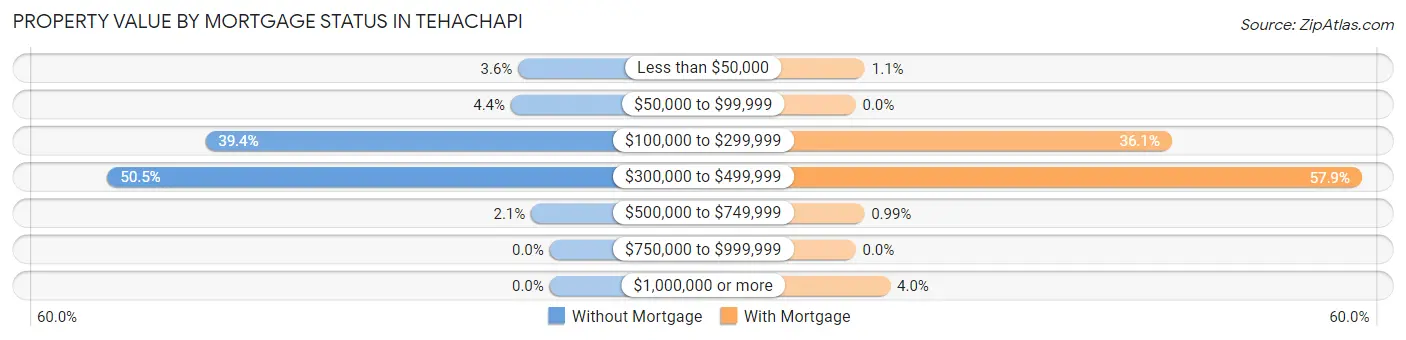
| Property Value | Without Mortgage | With Mortgage |
| Less than $50,000 | 34 (3.6%) | 14 (1.1%) |
| $50,000 to $99,999 | 42 (4.4%) | 0 (0.0%) |
| $100,000 to $299,999 | 373 (39.4%) | 476 (36.1%) |
| $300,000 to $499,999 | 479 (50.5%) | 762 (57.9%) |
| $500,000 to $749,999 | 20 (2.1%) | 13 (1.0%) |
| $750,000 to $999,999 | 0 (0.0%) | 0 (0.0%) |
| $1,000,000 or more | 0 (0.0%) | 52 (4.0%) |
| Total | 948 (100.0%) | 1,317 (100.0%) |
Household Income by Mortgage Status in Tehachapi
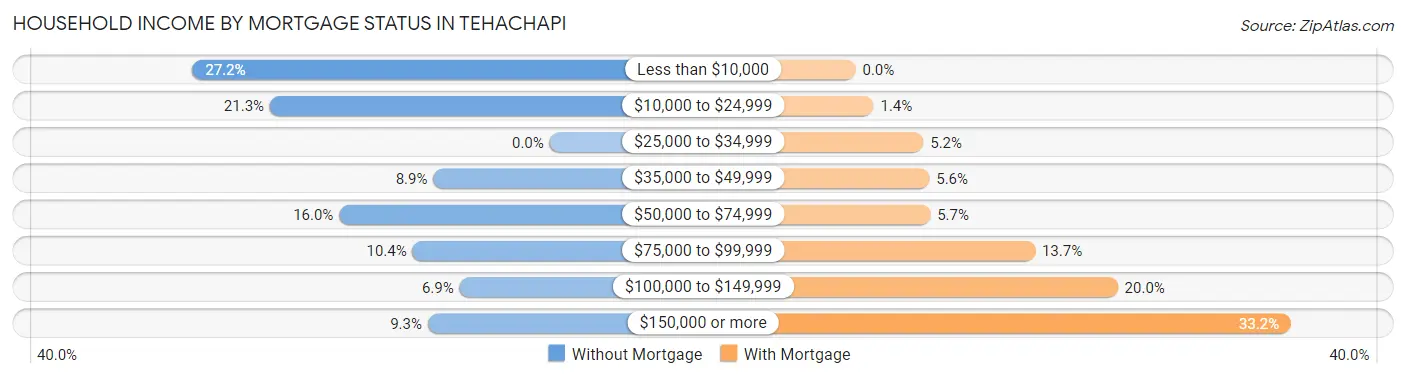
| Household Income | Without Mortgage | With Mortgage |
| Less than $10,000 | 258 (27.2%) | 0 (0.0%) |
| $10,000 to $24,999 | 202 (21.3%) | 18 (1.4%) |
| $25,000 to $34,999 | 0 (0.0%) | 68 (5.2%) |
| $35,000 to $49,999 | 84 (8.9%) | 74 (5.6%) |
| $50,000 to $74,999 | 152 (16.0%) | 75 (5.7%) |
| $75,000 to $99,999 | 99 (10.4%) | 180 (13.7%) |
| $100,000 to $149,999 | 65 (6.9%) | 263 (20.0%) |
| $150,000 or more | 88 (9.3%) | 437 (33.2%) |
| Total | 948 (100.0%) | 1,317 (100.0%) |
Property Value to Household Income Ratio in Tehachapi
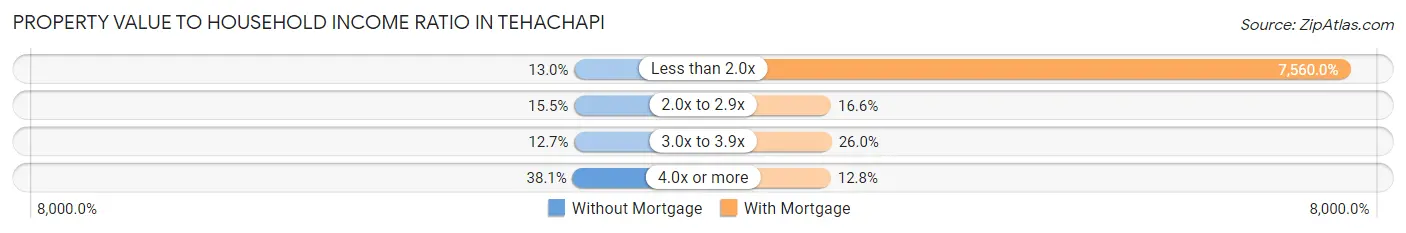
| Value-to-Income Ratio | Without Mortgage | With Mortgage |
| Less than 2.0x | 123 (13.0%) | 99,565 (7,560.0%) |
| 2.0x to 2.9x | 147 (15.5%) | 218 (16.6%) |
| 3.0x to 3.9x | 120 (12.7%) | 343 (26.0%) |
| 4.0x or more | 361 (38.1%) | 168 (12.8%) |
| Total | 948 (100.0%) | 1,317 (100.0%) |
Real Estate Taxes by Mortgage Status in Tehachapi
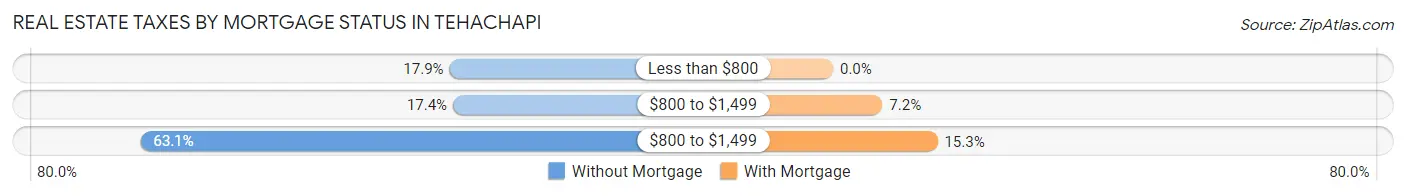
| Property Taxes | Without Mortgage | With Mortgage |
| Less than $800 | 170 (17.9%) | 0 (0.0%) |
| $800 to $1,499 | 165 (17.4%) | 95 (7.2%) |
| $800 to $1,499 | 598 (63.1%) | 201 (15.3%) |
| Total | 948 (100.0%) | 1,317 (100.0%) |
Health & Disability in Tehachapi
Health Insurance Coverage by Age in Tehachapi
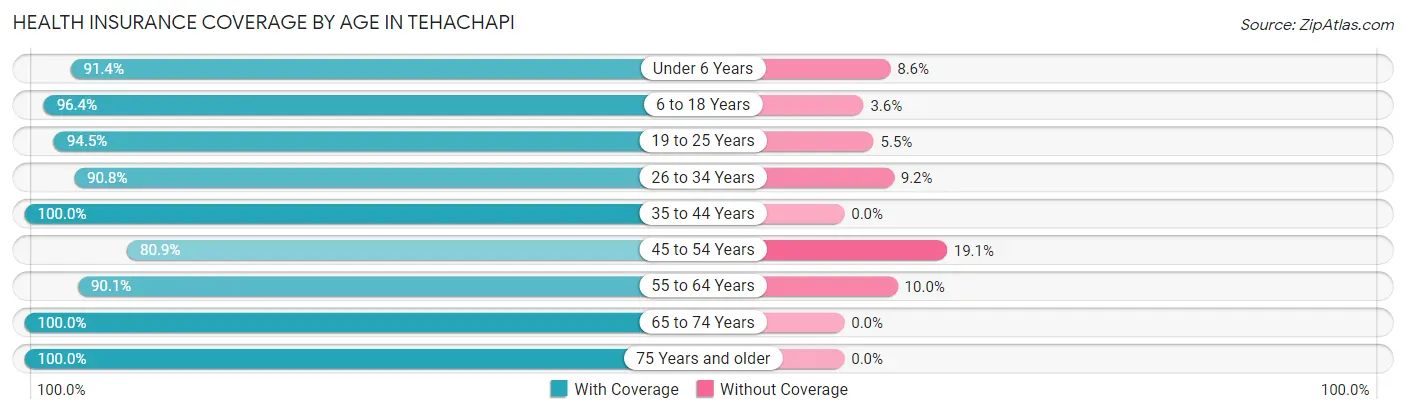
| Age Bracket | With Coverage | Without Coverage |
| Under 6 Years | 725 (91.4%) | 68 (8.6%) |
| 6 to 18 Years | 1,995 (96.4%) | 74 (3.6%) |
| 19 to 25 Years | 363 (94.5%) | 21 (5.5%) |
| 26 to 34 Years | 1,092 (90.8%) | 111 (9.2%) |
| 35 to 44 Years | 1,277 (100.0%) | 0 (0.0%) |
| 45 to 54 Years | 774 (80.9%) | 183 (19.1%) |
| 55 to 64 Years | 851 (90.0%) | 94 (10.0%) |
| 65 to 74 Years | 797 (100.0%) | 0 (0.0%) |
| 75 Years and older | 703 (100.0%) | 0 (0.0%) |
| Total | 8,577 (94.0%) | 551 (6.0%) |
Health Insurance Coverage by Citizenship Status in Tehachapi
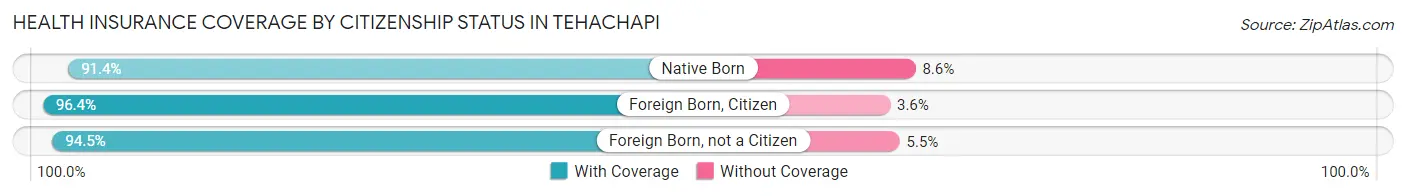
| Citizenship Status | With Coverage | Without Coverage |
| Native Born | 725 (91.4%) | 68 (8.6%) |
| Foreign Born, Citizen | 1,995 (96.4%) | 74 (3.6%) |
| Foreign Born, not a Citizen | 363 (94.5%) | 21 (5.5%) |
Health Insurance Coverage by Household Income in Tehachapi
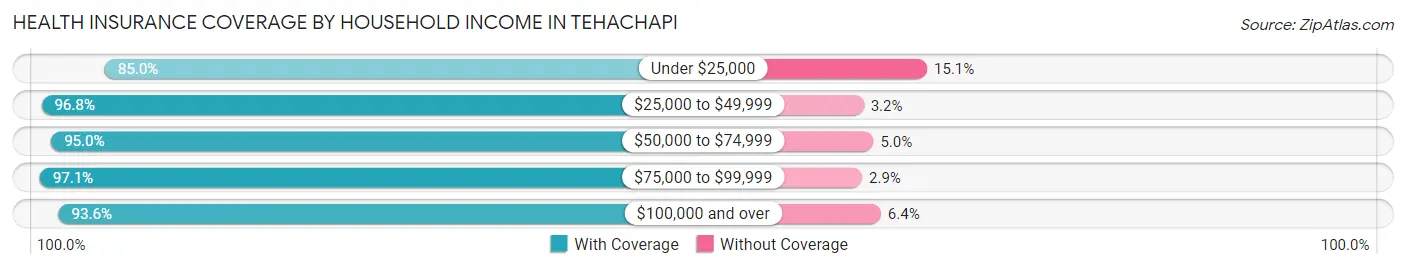
| Household Income | With Coverage | Without Coverage |
| Under $25,000 | 1,005 (85.0%) | 178 (15.0%) |
| $25,000 to $49,999 | 1,590 (96.8%) | 52 (3.2%) |
| $50,000 to $74,999 | 1,235 (95.0%) | 65 (5.0%) |
| $75,000 to $99,999 | 1,757 (97.1%) | 52 (2.9%) |
| $100,000 and over | 2,990 (93.6%) | 204 (6.4%) |
Public vs Private Health Insurance Coverage by Age in Tehachapi
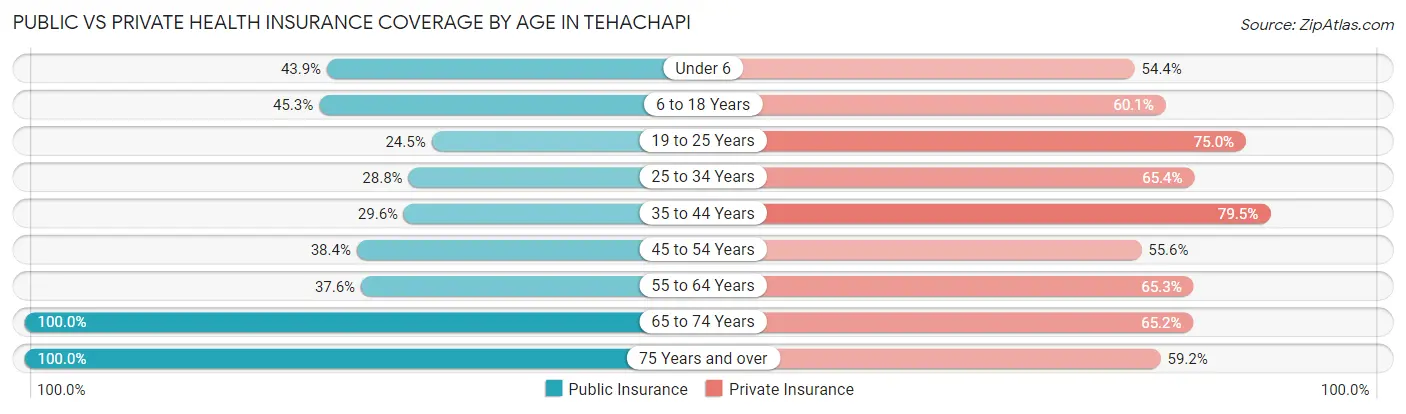
| Age Bracket | Public Insurance | Private Insurance |
| Under 6 | 348 (43.9%) | 431 (54.3%) |
| 6 to 18 Years | 938 (45.3%) | 1,243 (60.1%) |
| 19 to 25 Years | 94 (24.5%) | 288 (75.0%) |
| 25 to 34 Years | 346 (28.8%) | 787 (65.4%) |
| 35 to 44 Years | 378 (29.6%) | 1,015 (79.5%) |
| 45 to 54 Years | 367 (38.4%) | 532 (55.6%) |
| 55 to 64 Years | 355 (37.6%) | 617 (65.3%) |
| 65 to 74 Years | 797 (100.0%) | 520 (65.2%) |
| 75 Years and over | 703 (100.0%) | 416 (59.2%) |
| Total | 4,326 (47.4%) | 5,849 (64.1%) |
Disability Status by Sex by Age in Tehachapi
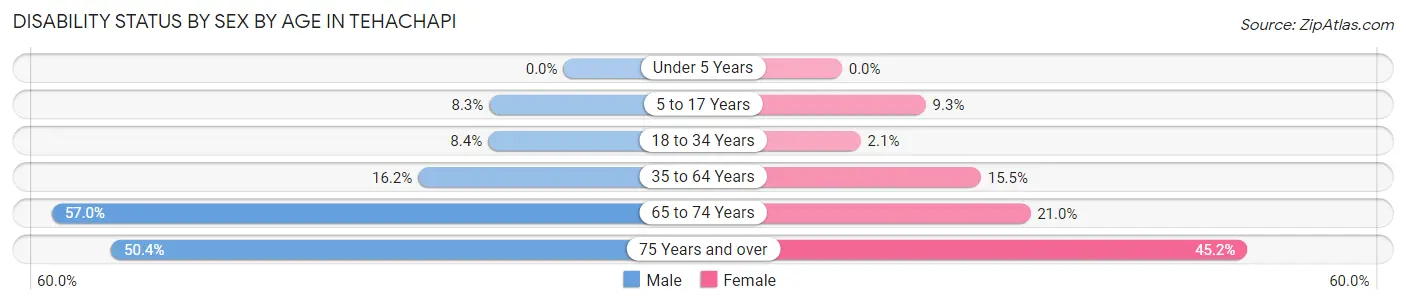
| Age Bracket | Male | Female |
| Under 5 Years | 0 (0.0%) | 0 (0.0%) |
| 5 to 17 Years | 80 (8.3%) | 100 (9.3%) |
| 18 to 34 Years | 61 (8.4%) | 22 (2.1%) |
| 35 to 64 Years | 299 (16.2%) | 206 (15.5%) |
| 65 to 74 Years | 245 (57.0%) | 77 (21.0%) |
| 75 Years and over | 141 (50.4%) | 191 (45.2%) |
Disability Class by Sex by Age in Tehachapi
Disability Class: Hearing Difficulty
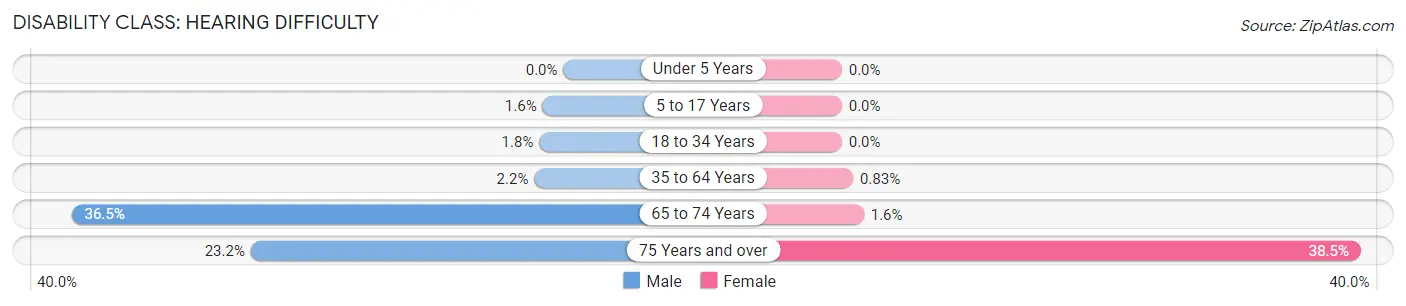
| Age Bracket | Male | Female |
| Under 5 Years | 0 (0.0%) | 0 (0.0%) |
| 5 to 17 Years | 15 (1.5%) | 0 (0.0%) |
| 18 to 34 Years | 13 (1.8%) | 0 (0.0%) |
| 35 to 64 Years | 40 (2.2%) | 11 (0.8%) |
| 65 to 74 Years | 157 (36.5%) | 6 (1.6%) |
| 75 Years and over | 65 (23.2%) | 163 (38.5%) |
Disability Class: Vision Difficulty
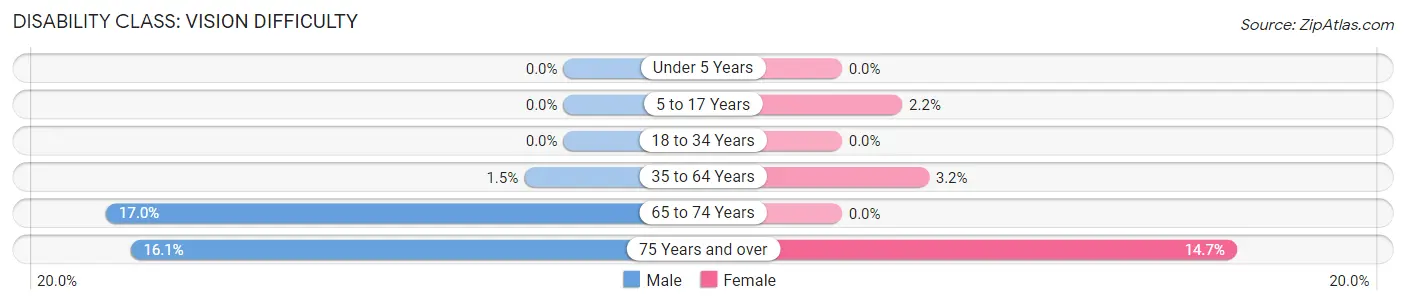
| Age Bracket | Male | Female |
| Under 5 Years | 0 (0.0%) | 0 (0.0%) |
| 5 to 17 Years | 0 (0.0%) | 24 (2.2%) |
| 18 to 34 Years | 0 (0.0%) | 0 (0.0%) |
| 35 to 64 Years | 27 (1.5%) | 43 (3.2%) |
| 65 to 74 Years | 73 (17.0%) | 0 (0.0%) |
| 75 Years and over | 45 (16.1%) | 62 (14.7%) |
Disability Class: Cognitive Difficulty
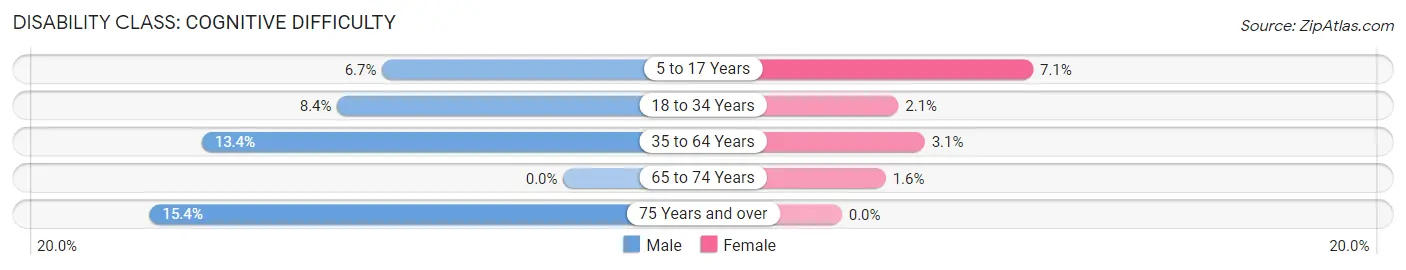
| Age Bracket | Male | Female |
| 5 to 17 Years | 65 (6.7%) | 76 (7.1%) |
| 18 to 34 Years | 61 (8.4%) | 22 (2.1%) |
| 35 to 64 Years | 248 (13.4%) | 41 (3.1%) |
| 65 to 74 Years | 0 (0.0%) | 6 (1.6%) |
| 75 Years and over | 43 (15.4%) | 0 (0.0%) |
Disability Class: Ambulatory Difficulty
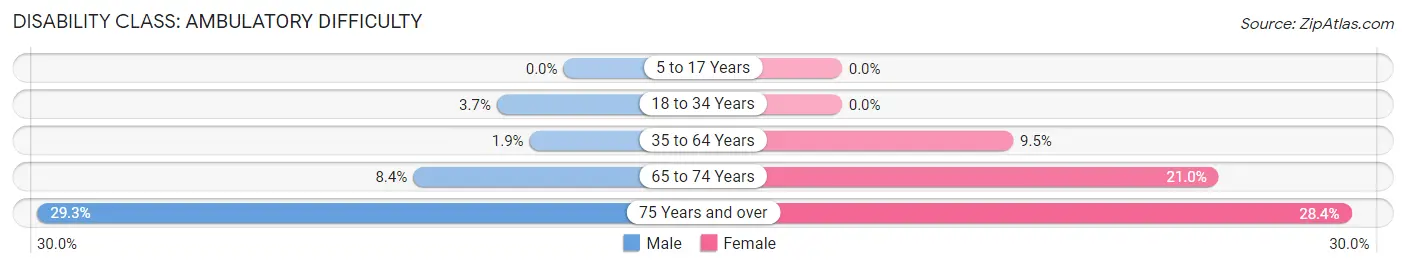
| Age Bracket | Male | Female |
| 5 to 17 Years | 0 (0.0%) | 0 (0.0%) |
| 18 to 34 Years | 27 (3.7%) | 0 (0.0%) |
| 35 to 64 Years | 35 (1.9%) | 127 (9.5%) |
| 65 to 74 Years | 36 (8.4%) | 77 (21.0%) |
| 75 Years and over | 82 (29.3%) | 120 (28.4%) |
Disability Class: Self-Care Difficulty
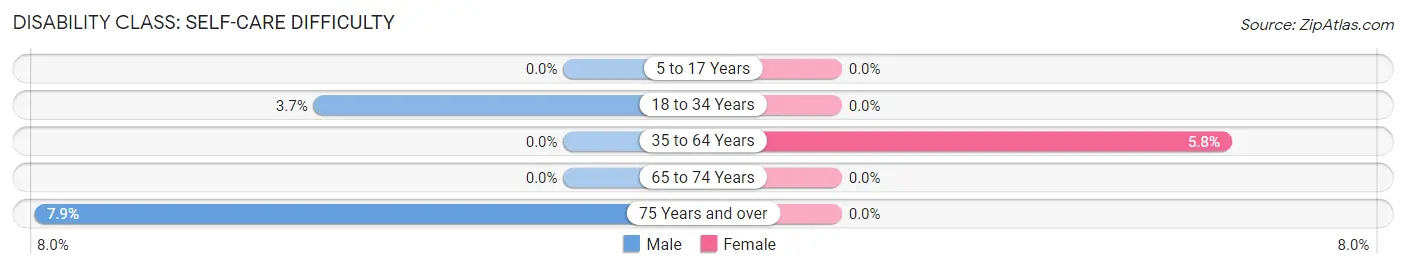
| Age Bracket | Male | Female |
| 5 to 17 Years | 0 (0.0%) | 0 (0.0%) |
| 18 to 34 Years | 27 (3.7%) | 0 (0.0%) |
| 35 to 64 Years | 0 (0.0%) | 77 (5.8%) |
| 65 to 74 Years | 0 (0.0%) | 0 (0.0%) |
| 75 Years and over | 22 (7.9%) | 0 (0.0%) |
Technology Access in Tehachapi
Computing Device Access in Tehachapi
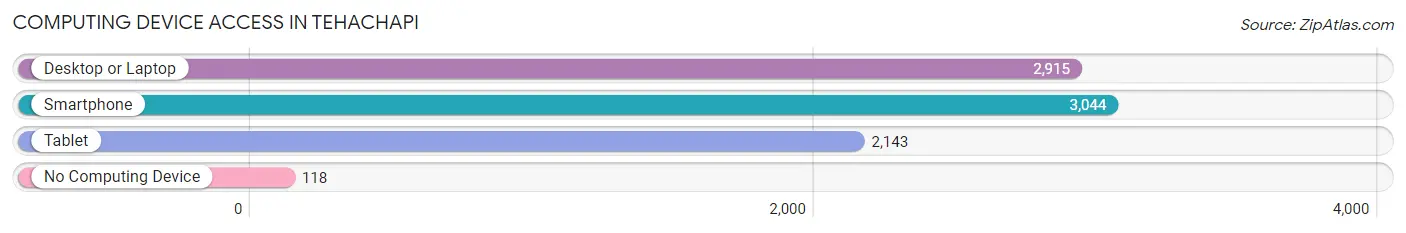
| Device Type | # Households | % Households |
| Desktop or Laptop | 2,915 | 79.6% |
| Smartphone | 3,044 | 83.1% |
| Tablet | 2,143 | 58.5% |
| No Computing Device | 118 | 3.2% |
| Total | 3,664 | 100.0% |
Internet Access in Tehachapi
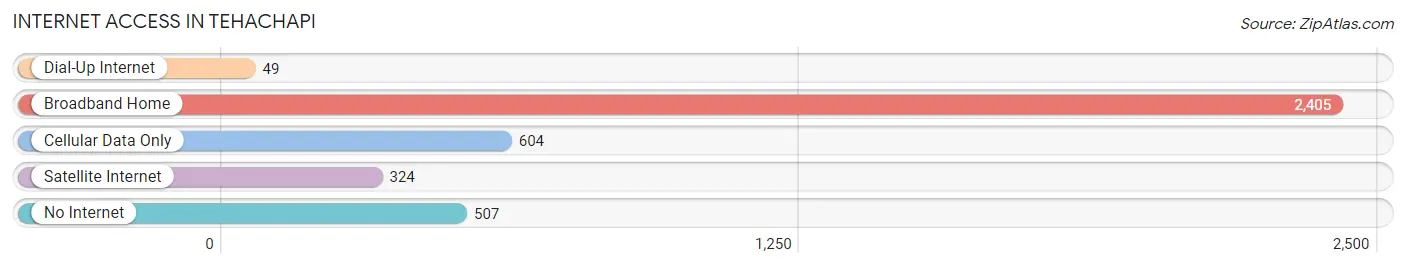
| Internet Type | # Households | % Households |
| Dial-Up Internet | 49 | 1.3% |
| Broadband Home | 2,405 | 65.6% |
| Cellular Data Only | 604 | 16.5% |
| Satellite Internet | 324 | 8.8% |
| No Internet | 507 | 13.8% |
| Total | 3,664 | 100.0% |
Tehachapi Summary
Tehachapi, California is a small city located in Kern County, California, approximately 70 miles northeast of Los Angeles. It is situated in the Tehachapi Mountains, a mountain range that stretches from the San Joaquin Valley to the Mojave Desert. The city is known for its mild climate, scenic beauty, and outdoor recreation opportunities.
History
The area that is now Tehachapi was originally inhabited by the Kawaiisu Native American tribe. The first Europeans to explore the area were Spanish missionaries in the late 1700s. The area was later settled by ranchers and farmers in the mid-1800s. The city of Tehachapi was officially incorporated in 1909.
Geography
Tehachapi is located in the Tehachapi Mountains, a mountain range that stretches from the San Joaquin Valley to the Mojave Desert. The city is situated at an elevation of 4,000 feet, making it one of the highest cities in California. The city is surrounded by rolling hills and mountains, and is known for its mild climate and scenic beauty.
Economy
The economy of Tehachapi is largely based on agriculture and tourism. The city is home to several farms and ranches, and is known for its production of apples, pears, and other fruits and vegetables. The city is also home to several wineries and breweries, as well as a number of tourist attractions, such as the Tehachapi Loop, a popular railroad loop that winds through the mountains.
Demographics
As of the 2010 census, the population of Tehachapi was 14,414. The racial makeup of the city was 75.3% White, 1.2% African American, 0.7% Native American, 1.2% Asian, 0.2% Pacific Islander, 17.7% from other races, and 3.7% from two or more races. Hispanic or Latino of any race were 33.2% of the population.
The median household income in Tehachapi was $50,945, and the median family income was $58,958. The per capita income for the city was $22,845. About 14.2% of families and 17.7% of the population were below the poverty line, including 25.2% of those under age 18 and 8.2% of those age 65 or over.
Tehachapi is a small city with a rich history, beautiful geography, and a diverse economy. The city is home to a variety of industries, from agriculture to tourism, and is known for its mild climate and scenic beauty. The city is also home to a diverse population, with a variety of racial and ethnic backgrounds. Tehachapi is a great place to live, work, and play.
Common Questions
What is Per Capita Income in Tehachapi?
Per Capita income in Tehachapi is $23,163.
What is the Median Family Income in Tehachapi?
Median Family Income in Tehachapi is $87,212.
What is the Median Household income in Tehachapi?
Median Household Income in Tehachapi is $62,788.
What is Income or Wage Gap in Tehachapi?
Income or Wage Gap in Tehachapi is 39.3%.
Women in Tehachapi earn 60.7 cents for every dollar earned by a man.
What is Inequality or Gini Index in Tehachapi?
Inequality or Gini Index in Tehachapi is 0.47.
What is the Total Population of Tehachapi?
Total Population of Tehachapi is 12,855.
What is the Total Male Population of Tehachapi?
Total Male Population of Tehachapi is 8,191.
What is the Total Female Population of Tehachapi?
Total Female Population of Tehachapi is 4,664.
What is the Ratio of Males per 100 Females in Tehachapi?
There are 175.62 Males per 100 Females in Tehachapi.
What is the Ratio of Females per 100 Males in Tehachapi?
There are 56.94 Females per 100 Males in Tehachapi.
What is the Median Population Age in Tehachapi?
Median Population Age in Tehachapi is 38.3 Years.
What is the Average Family Size in Tehachapi
Average Family Size in Tehachapi is 3.4 People.
What is the Average Household Size in Tehachapi
Average Household Size in Tehachapi is 2.5 People.
How Large is the Labor Force in Tehachapi?
There are 3,625 People in the Labor Forcein in Tehachapi.
What is the Percentage of People in the Labor Force in Tehachapi?
34.4% of People are in the Labor Force in Tehachapi.
What is the Unemployment Rate in Tehachapi?
Unemployment Rate in Tehachapi is 8.6%.