Mcarthur, CA Map & Demographics
Mcarthur Map
Mcarthur Overview
$17,043
PER CAPITA INCOME
$57,750
AVG FAMILY INCOME
0.46
INEQUALITY / GINI INDEX
425
TOTAL POPULATION
171
MALE POPULATION
254
FEMALE POPULATION
67.32
MALES / 100 FEMALES
148.54
FEMALES / 100 MALES
41.2
MEDIAN AGE
3.3
AVG FAMILY SIZE
2.9
AVG HOUSEHOLD SIZE
169
LABOR FORCE [ PEOPLE ]
60.8%
PERCENT IN LABOR FORCE
11.2%
UNEMPLOYMENT RATE
Mcarthur Zip Codes
Mcarthur Area Codes
Income in Mcarthur
Income Overview in Mcarthur
| Characteristic | Number | Measure |
| Per Capita Income | 425 | $17,043 |
| Median Family Income | 122 | $57,750 |
| Mean Family Income | 122 | $57,470 |
| Median Household Income | 147 | $0 |
| Mean Household Income | 147 | $50,072 |
| Income Deficit | 122 | $0 |
| Wage / Income Gap (%) | 425 | 0.00% |
| Wage / Income Gap ($) | 425 | 100.00¢ per $1 |
| Gini / Inequality Index | 425 | 0.46 |
Earnings by Sex in Mcarthur
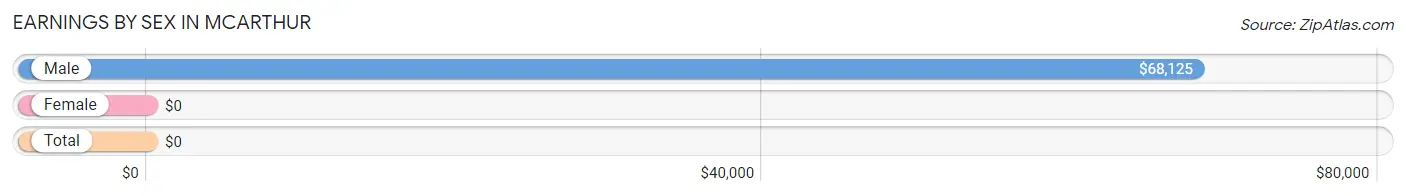
| Sex | Number | Average Earnings |
| Male | 54 (36.0%) | $68,125 |
| Female | 96 (64.0%) | $0 |
| Total | 150 (100.0%) | $0 |
Earnings by Sex by Income Bracket in Mcarthur
The most common earnings brackets in Mcarthur are $65,000 to $74,999 for men (24 | 44.4%) and $2,499 or less for women (35 | 36.5%).
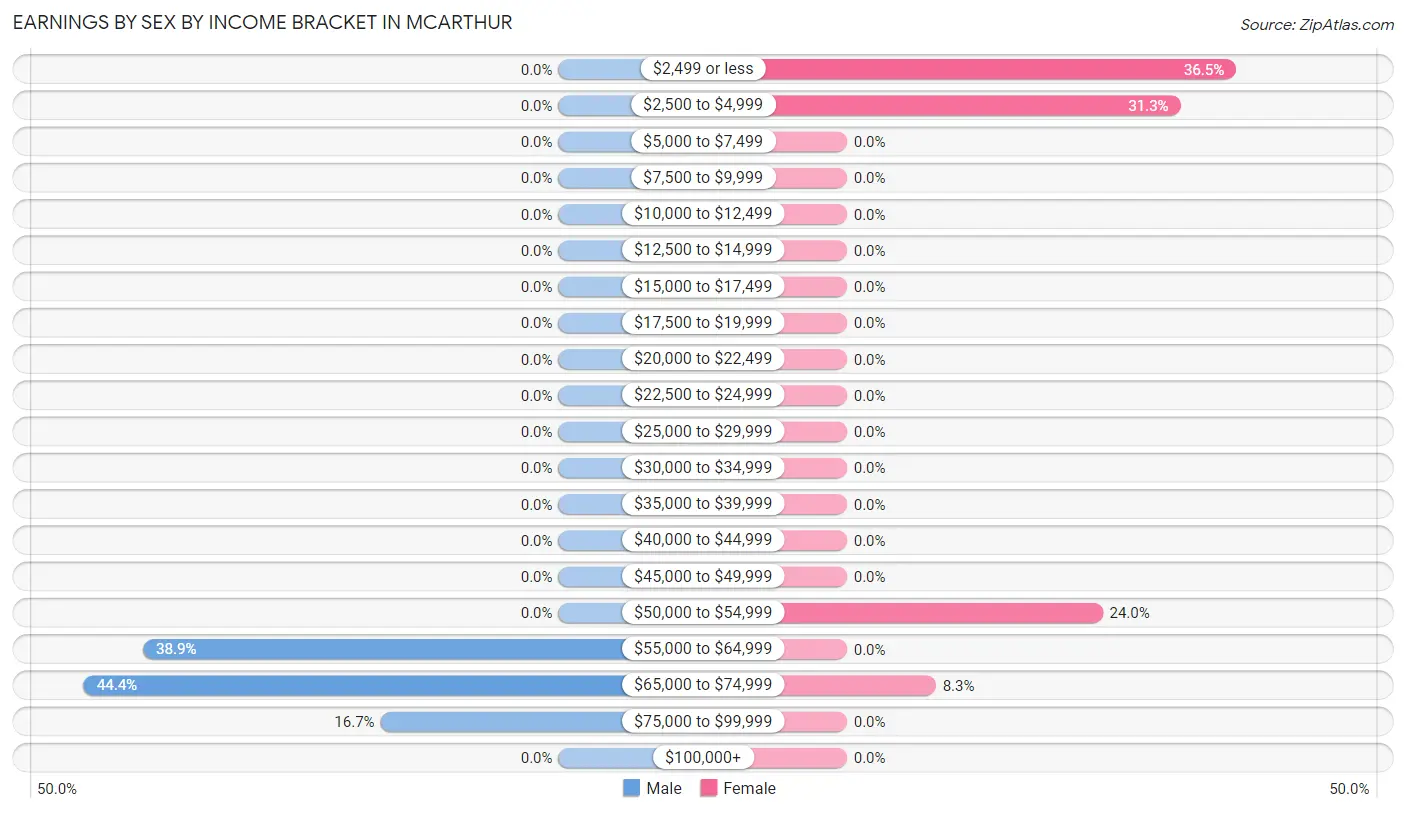
| Income | Male | Female |
| $2,499 or less | 0 (0.0%) | 35 (36.5%) |
| $2,500 to $4,999 | 0 (0.0%) | 30 (31.2%) |
| $5,000 to $7,499 | 0 (0.0%) | 0 (0.0%) |
| $7,500 to $9,999 | 0 (0.0%) | 0 (0.0%) |
| $10,000 to $12,499 | 0 (0.0%) | 0 (0.0%) |
| $12,500 to $14,999 | 0 (0.0%) | 0 (0.0%) |
| $15,000 to $17,499 | 0 (0.0%) | 0 (0.0%) |
| $17,500 to $19,999 | 0 (0.0%) | 0 (0.0%) |
| $20,000 to $22,499 | 0 (0.0%) | 0 (0.0%) |
| $22,500 to $24,999 | 0 (0.0%) | 0 (0.0%) |
| $25,000 to $29,999 | 0 (0.0%) | 0 (0.0%) |
| $30,000 to $34,999 | 0 (0.0%) | 0 (0.0%) |
| $35,000 to $39,999 | 0 (0.0%) | 0 (0.0%) |
| $40,000 to $44,999 | 0 (0.0%) | 0 (0.0%) |
| $45,000 to $49,999 | 0 (0.0%) | 0 (0.0%) |
| $50,000 to $54,999 | 0 (0.0%) | 23 (24.0%) |
| $55,000 to $64,999 | 21 (38.9%) | 0 (0.0%) |
| $65,000 to $74,999 | 24 (44.4%) | 8 (8.3%) |
| $75,000 to $99,999 | 9 (16.7%) | 0 (0.0%) |
| $100,000+ | 0 (0.0%) | 0 (0.0%) |
| Total | 54 (100.0%) | 96 (100.0%) |
Earnings by Sex by Educational Attainment in Mcarthur
| Educational Attainment | Male Income | Female Income |
| Less than High School | - | - |
| High School Diploma | - | - |
| College or Associate's Degree | - | - |
| Bachelor's Degree | - | - |
| Graduate Degree | - | - |
| Total | $68,125 | $2,499 |
Family Income in Mcarthur
Family Income Brackets in Mcarthur
According to the Mcarthur family income data, there are 59 families falling into the $50,000 to $74,999 income range, which is the most common income bracket and makes up 48.4% of all families.
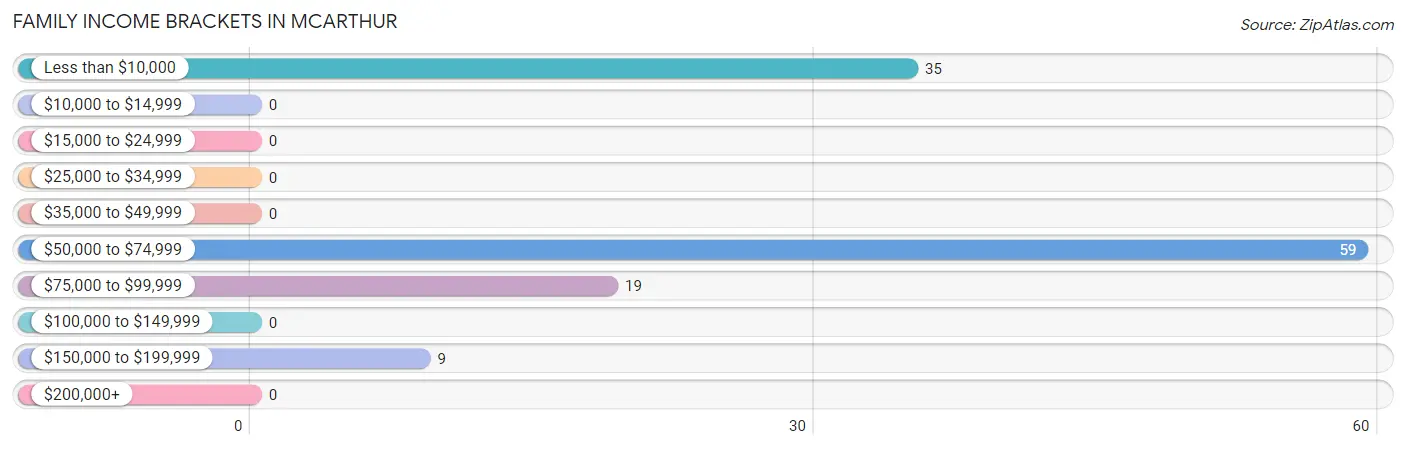
| Income Bracket | # Families | % Families |
| Less than $10,000 | 35 | 28.7% |
| $10,000 to $14,999 | 0 | 0.0% |
| $15,000 to $24,999 | 0 | 0.0% |
| $25,000 to $34,999 | 0 | 0.0% |
| $35,000 to $49,999 | 0 | 0.0% |
| $50,000 to $74,999 | 59 | 48.4% |
| $75,000 to $99,999 | 19 | 15.6% |
| $100,000 to $149,999 | 0 | 0.0% |
| $150,000 to $199,999 | 9 | 7.4% |
| $200,000+ | 0 | 0.0% |
Family Income by Famaliy Size in Mcarthur
| Income Bracket | # Families | Median Income |
| 2-Person Families | 45 (36.9%) | $0 |
| 3-Person Families | 43 (35.2%) | $0 |
| 4-Person Families | 9 (7.4%) | $0 |
| 5-Person Families | 0 (0.0%) | $0 |
| 6-Person Families | 25 (20.5%) | $0 |
| 7+ Person Families | 0 (0.0%) | $0 |
| Total | 122 (100.0%) | $57,750 |
Family Income by Number of Earners in Mcarthur
| Number of Earners | # Families | Median Income |
| No Earners | 10 (8.2%) | $0 |
| 1 Earner | 79 (64.7%) | $0 |
| 2 Earners | 33 (27.1%) | $0 |
| 3+ Earners | 0 (0.0%) | $0 |
| Total | 122 (100.0%) | $57,750 |
Household Income in Mcarthur
Household Income Brackets in Mcarthur
With 59 households falling in the category, the $50,000 to $74,999 income range is the most frequent in Mcarthur, accounting for 40.1% of all households.
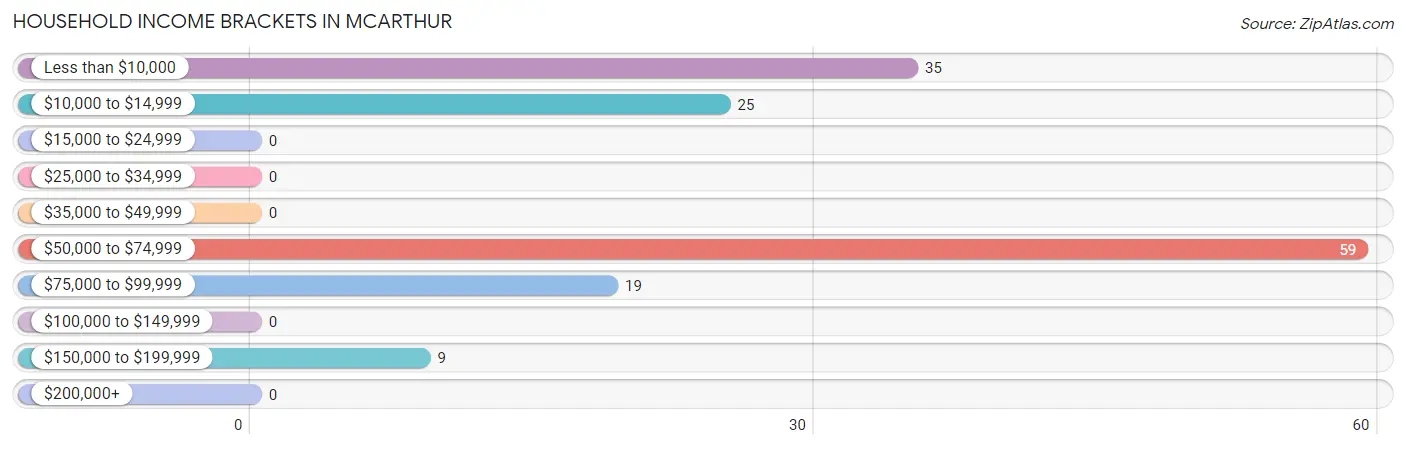
| Income Bracket | # Households | % Households |
| Less than $10,000 | 35 | 23.8% |
| $10,000 to $14,999 | 25 | 17.0% |
| $15,000 to $24,999 | 0 | 0.0% |
| $25,000 to $34,999 | 0 | 0.0% |
| $35,000 to $49,999 | 0 | 0.0% |
| $50,000 to $74,999 | 59 | 40.1% |
| $75,000 to $99,999 | 19 | 12.9% |
| $100,000 to $149,999 | 0 | 0.0% |
| $150,000 to $199,999 | 9 | 6.1% |
| $200,000+ | 0 | 0.0% |
Household Income by Householder Age in Mcarthur
The median household income in Mcarthur is $0, with the highest median household income of $72,917 found in the 45 to 64 years age bracket for the primary householder. A total of 58 households (39.5%) fall into this category.
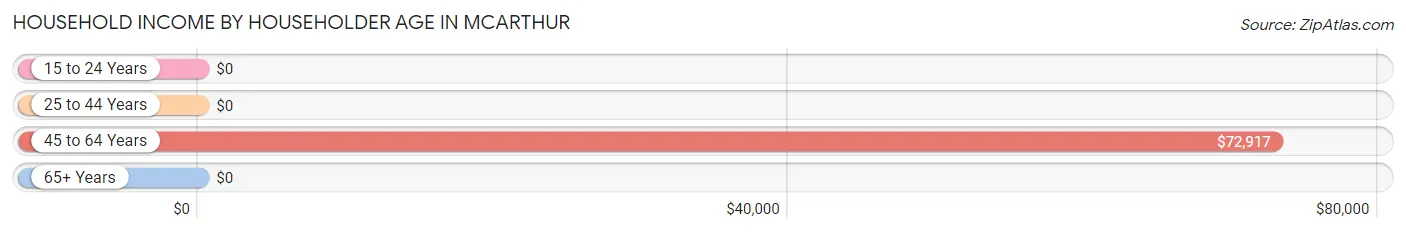
| Income Bracket | # Households | Median Income |
| 15 to 24 Years | 0 (0.0%) | $0 |
| 25 to 44 Years | 35 (23.8%) | $0 |
| 45 to 64 Years | 58 (39.5%) | $72,917 |
| 65+ Years | 54 (36.7%) | $0 |
| Total | 147 (100.0%) | $0 |
Poverty in Mcarthur
Income Below Poverty by Sex and Age in Mcarthur
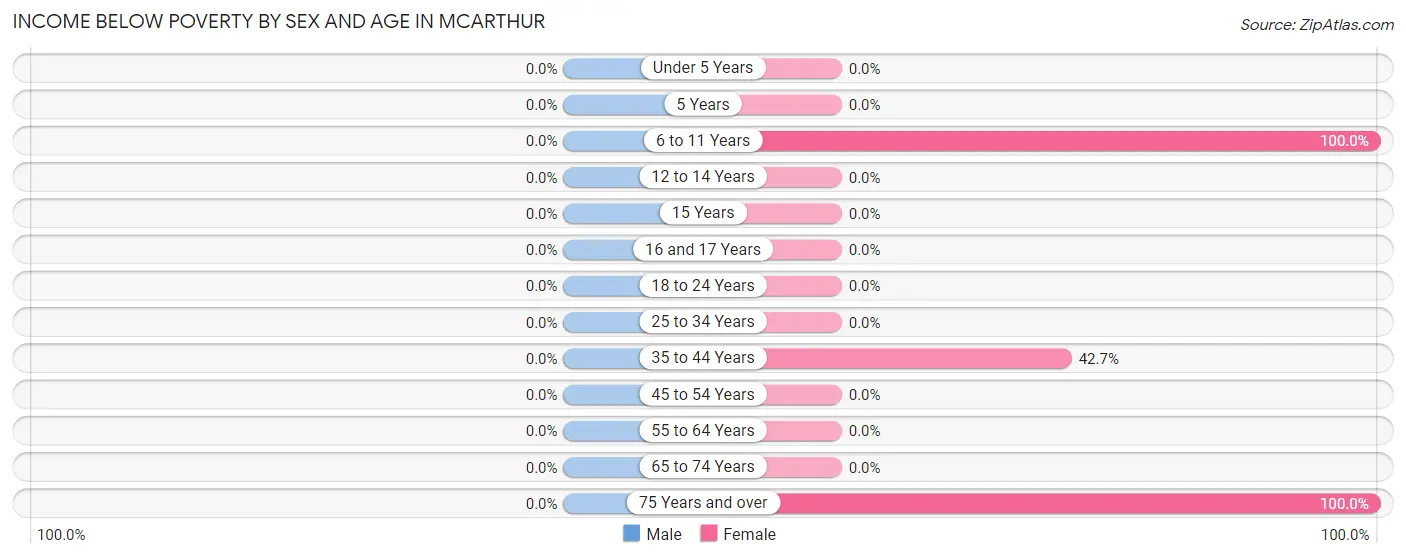
| Age Bracket | Male | Female |
| Under 5 Years | 0 (0.0%) | 0 (0.0%) |
| 5 Years | 0 (0.0%) | 0 (0.0%) |
| 6 to 11 Years | 0 (0.0%) | 64 (100.0%) |
| 12 to 14 Years | 0 (0.0%) | 0 (0.0%) |
| 15 Years | 0 (0.0%) | 0 (0.0%) |
| 16 and 17 Years | 0 (0.0%) | 0 (0.0%) |
| 18 to 24 Years | 0 (0.0%) | 0 (0.0%) |
| 25 to 34 Years | 0 (0.0%) | 0 (0.0%) |
| 35 to 44 Years | 0 (0.0%) | 35 (42.7%) |
| 45 to 54 Years | 0 (0.0%) | 0 (0.0%) |
| 55 to 64 Years | 0 (0.0%) | 0 (0.0%) |
| 65 to 74 Years | 0 (0.0%) | 0 (0.0%) |
| 75 Years and over | 0 (0.0%) | 25 (100.0%) |
| Total | 0 (0.0%) | 124 (48.8%) |
Income Above Poverty by Sex and Age in Mcarthur
According to the poverty statistics in Mcarthur, males aged under 5 years and females aged 18 to 24 years are the age groups that are most secure financially, with 100.0% of males and 100.0% of females in these age groups living above the poverty line.
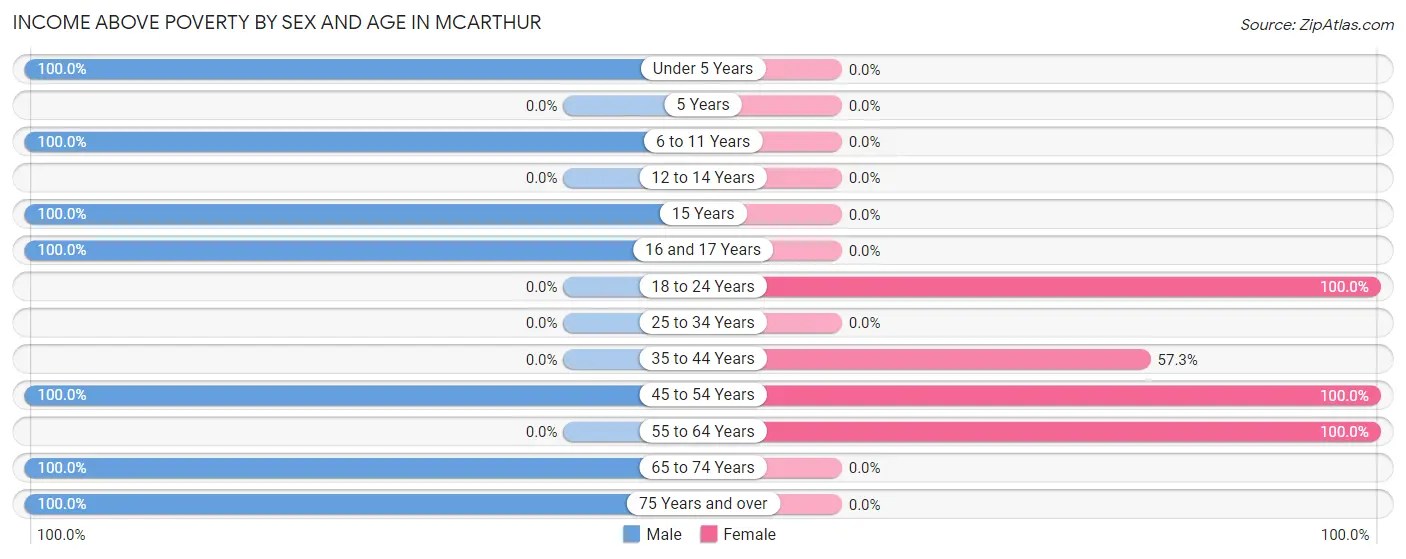
| Age Bracket | Male | Female |
| Under 5 Years | 24 (100.0%) | 0 (0.0%) |
| 5 Years | 0 (0.0%) | 0 (0.0%) |
| 6 to 11 Years | 39 (100.0%) | 0 (0.0%) |
| 12 to 14 Years | 0 (0.0%) | 0 (0.0%) |
| 15 Years | 20 (100.0%) | 0 (0.0%) |
| 16 and 17 Years | 5 (100.0%) | 0 (0.0%) |
| 18 to 24 Years | 0 (0.0%) | 30 (100.0%) |
| 25 to 34 Years | 0 (0.0%) | 0 (0.0%) |
| 35 to 44 Years | 0 (0.0%) | 47 (57.3%) |
| 45 to 54 Years | 54 (100.0%) | 33 (100.0%) |
| 55 to 64 Years | 0 (0.0%) | 20 (100.0%) |
| 65 to 74 Years | 19 (100.0%) | 0 (0.0%) |
| 75 Years and over | 10 (100.0%) | 0 (0.0%) |
| Total | 171 (100.0%) | 130 (51.2%) |
Income Below Poverty Among Married-Couple Families in Mcarthur
| Children | Above Poverty | Below Poverty |
| No Children | 43 (100.0%) | 0 (0.0%) |
| 1 or 2 Children | 9 (100.0%) | 0 (0.0%) |
| 3 or 4 Children | 25 (100.0%) | 0 (0.0%) |
| 5 or more Children | 0 (0.0%) | 0 (0.0%) |
| Total | 77 (100.0%) | 0 (0.0%) |
Income Below Poverty Among Single-Parent Households in Mcarthur
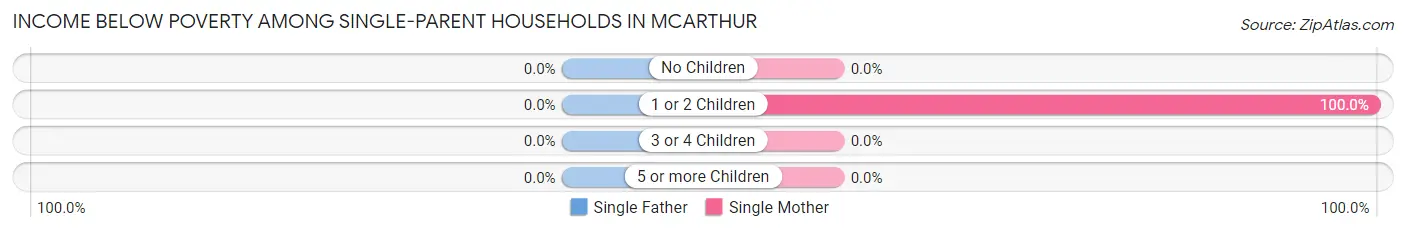
| Children | Single Father | Single Mother |
| No Children | 0 (0.0%) | 0 (0.0%) |
| 1 or 2 Children | 0 (0.0%) | 35 (100.0%) |
| 3 or 4 Children | 0 (0.0%) | 0 (0.0%) |
| 5 or more Children | 0 (0.0%) | 0 (0.0%) |
| Total | 0 (0.0%) | 35 (100.0%) |
Income Below Poverty Among Married-Couple vs Single-Parent Households in Mcarthur
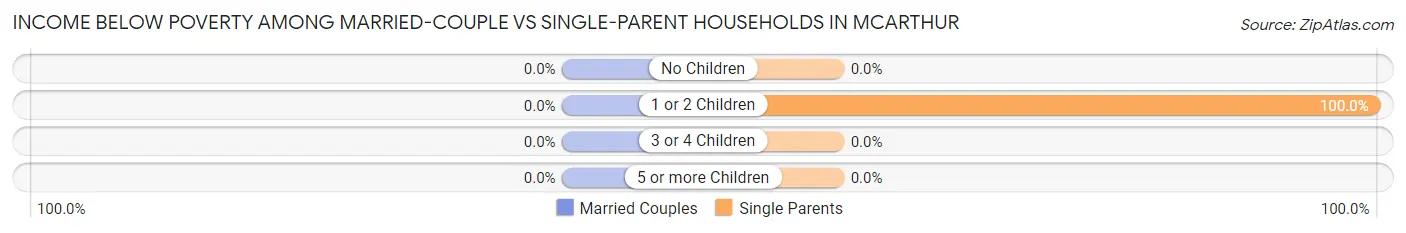
| Children | Married-Couple Families | Single-Parent Households |
| No Children | 0 (0.0%) | 0 (0.0%) |
| 1 or 2 Children | 0 (0.0%) | 35 (100.0%) |
| 3 or 4 Children | 0 (0.0%) | 0 (0.0%) |
| 5 or more Children | 0 (0.0%) | 0 (0.0%) |
| Total | 0 (0.0%) | 35 (77.8%) |
Race in Mcarthur
The most populous races in Mcarthur are Two or more Races (239 | 56.2%), White / Caucasian (165 | 38.8%), and Hispanic or Latino (142 | 33.4%).
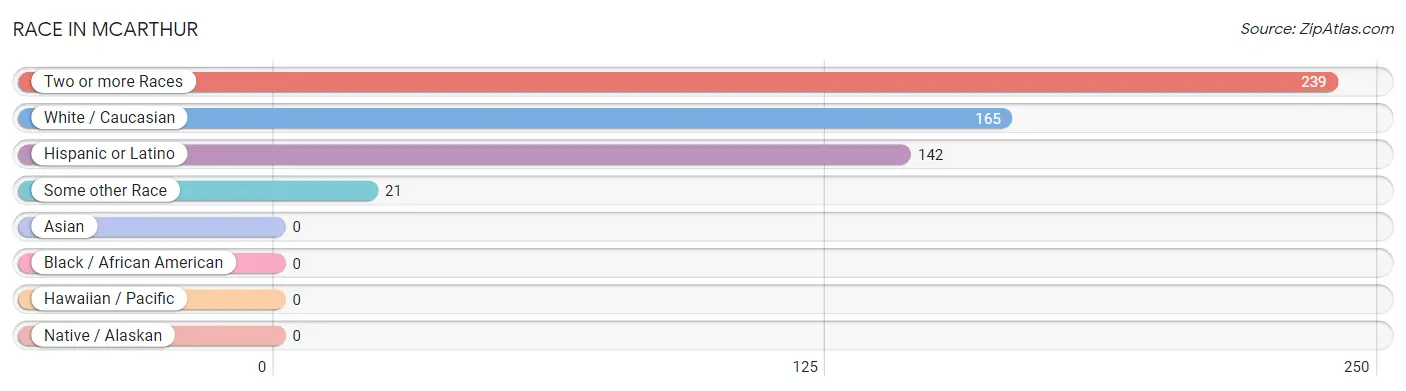
| Race | # Population | % Population |
| Asian | 0 | 0.0% |
| Black / African American | 0 | 0.0% |
| Hawaiian / Pacific | 0 | 0.0% |
| Hispanic or Latino | 142 | 33.4% |
| Native / Alaskan | 0 | 0.0% |
| White / Caucasian | 165 | 38.8% |
| Two or more Races | 239 | 56.2% |
| Some other Race | 21 | 4.9% |
| Total | 425 | 100.0% |
Ancestry in Mcarthur
The most populous ancestries reported in Mcarthur are Mexican (142 | 33.4%), Scottish (99 | 23.3%), Polish (45 | 10.6%), Korean (43 | 10.1%), and Navajo (37 | 8.7%), together accounting for 86.1% of all Mcarthur residents.
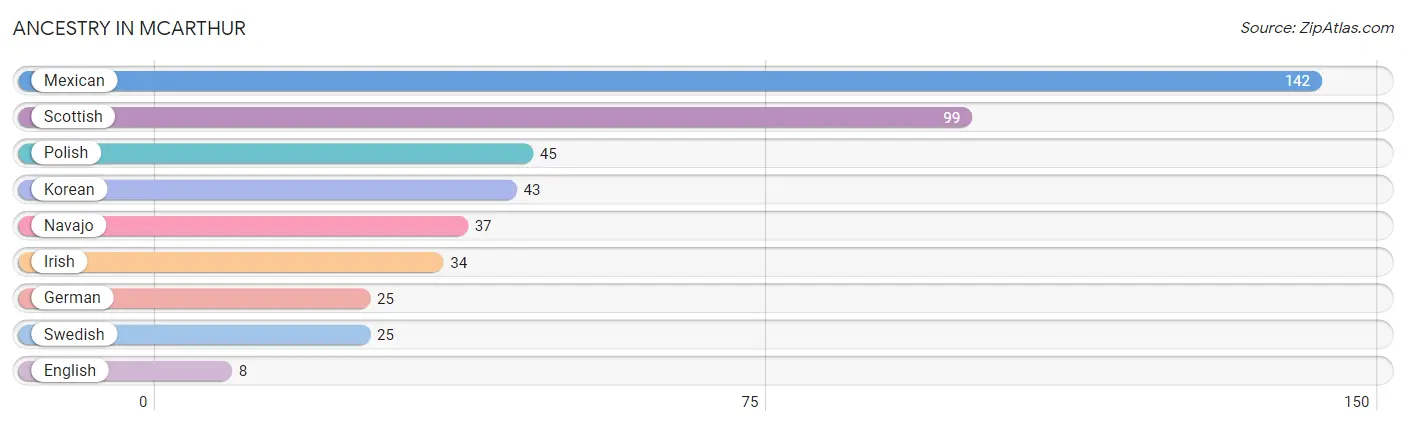
| Ancestry | # Population | % Population |
| English | 8 | 1.9% |
| German | 25 | 5.9% |
| Irish | 34 | 8.0% |
| Korean | 43 | 10.1% |
| Mexican | 142 | 33.4% |
| Navajo | 37 | 8.7% |
| Polish | 45 | 10.6% |
| Scottish | 99 | 23.3% |
| Swedish | 25 | 5.9% | View All 9 Rows |
Immigrants in Mcarthur
The most numerous immigrant groups reported in Mcarthur came from Central America (48 | 11.3%), Latin America (48 | 11.3%), and Mexico (48 | 11.3%), together accounting for 33.9% of all Mcarthur residents.
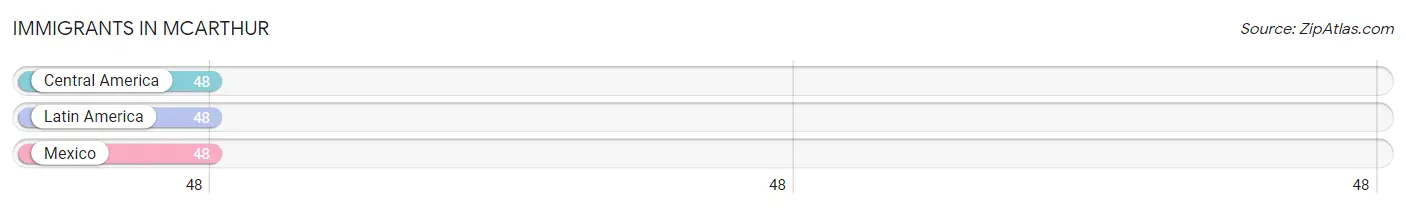
| Immigration Origin | # Population | % Population |
| Central America | 48 | 11.3% |
| Latin America | 48 | 11.3% |
| Mexico | 48 | 11.3% | View All 3 Rows |
Sex and Age in Mcarthur
Sex and Age in Mcarthur
The most populous age groups in Mcarthur are 50 to 54 Years (45 | 26.3%) for men and 10 to 14 Years (64 | 25.2%) for women.
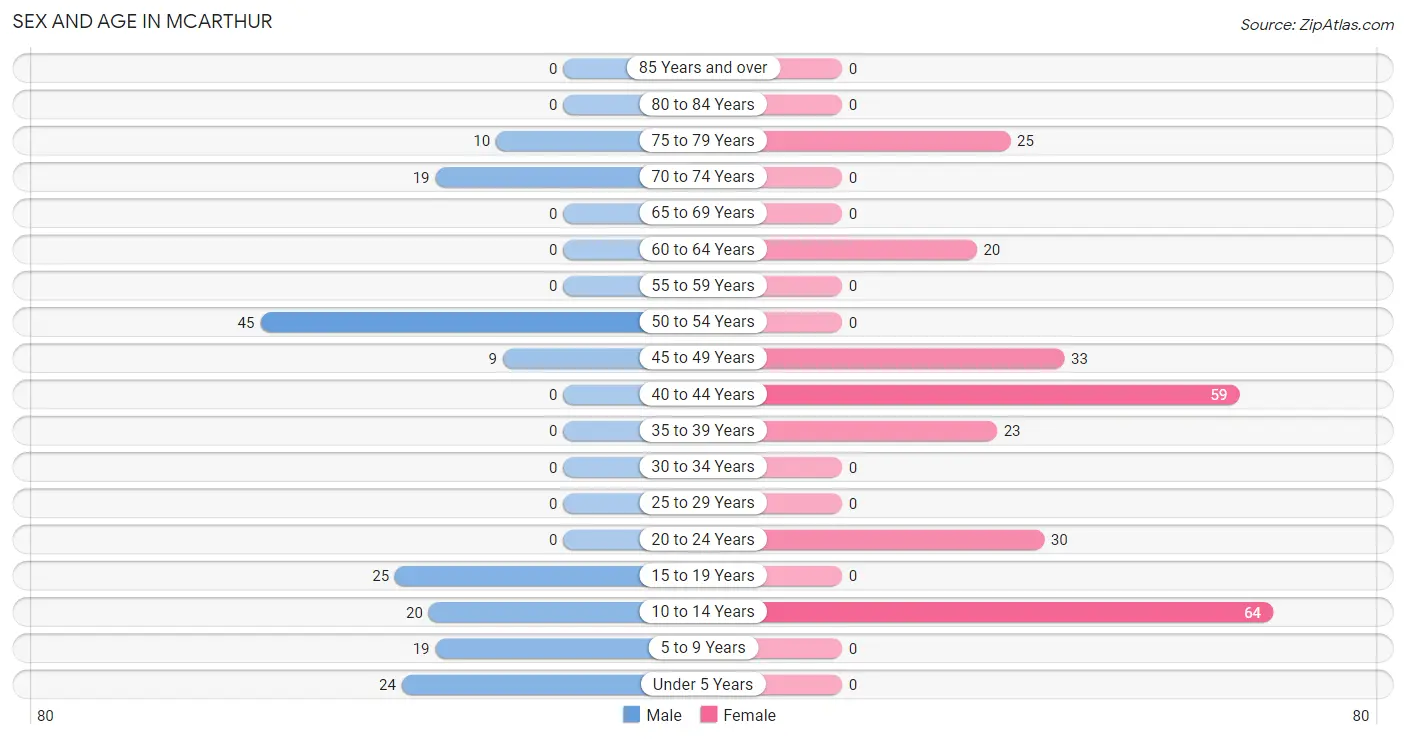
| Age Bracket | Male | Female |
| Under 5 Years | 24 (14.0%) | 0 (0.0%) |
| 5 to 9 Years | 19 (11.1%) | 0 (0.0%) |
| 10 to 14 Years | 20 (11.7%) | 64 (25.2%) |
| 15 to 19 Years | 25 (14.6%) | 0 (0.0%) |
| 20 to 24 Years | 0 (0.0%) | 30 (11.8%) |
| 25 to 29 Years | 0 (0.0%) | 0 (0.0%) |
| 30 to 34 Years | 0 (0.0%) | 0 (0.0%) |
| 35 to 39 Years | 0 (0.0%) | 23 (9.1%) |
| 40 to 44 Years | 0 (0.0%) | 59 (23.2%) |
| 45 to 49 Years | 9 (5.3%) | 33 (13.0%) |
| 50 to 54 Years | 45 (26.3%) | 0 (0.0%) |
| 55 to 59 Years | 0 (0.0%) | 0 (0.0%) |
| 60 to 64 Years | 0 (0.0%) | 20 (7.9%) |
| 65 to 69 Years | 0 (0.0%) | 0 (0.0%) |
| 70 to 74 Years | 19 (11.1%) | 0 (0.0%) |
| 75 to 79 Years | 10 (5.9%) | 25 (9.8%) |
| 80 to 84 Years | 0 (0.0%) | 0 (0.0%) |
| 85 Years and over | 0 (0.0%) | 0 (0.0%) |
| Total | 171 (100.0%) | 254 (100.0%) |
Families and Households in Mcarthur
Median Family Size in Mcarthur
The median family size in Mcarthur is 3.28 persons per family, with married-couple families (77 | 63.1%) accounting for the largest median family size of 3.7 persons per family. On the other hand, single male/father families (10 | 8.2%) represent the smallest median family size with 1.60 persons per family.
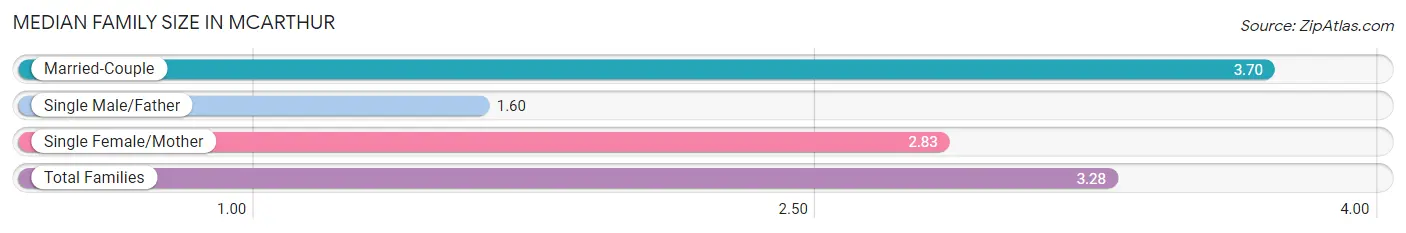
| Family Type | # Families | Family Size |
| Married-Couple | 77 (63.1%) | 3.70 |
| Single Male/Father | 10 (8.2%) | 1.60 |
| Single Female/Mother | 35 (28.7%) | 2.83 |
| Total Families | 122 (100.0%) | 3.28 |
Median Household Size in Mcarthur
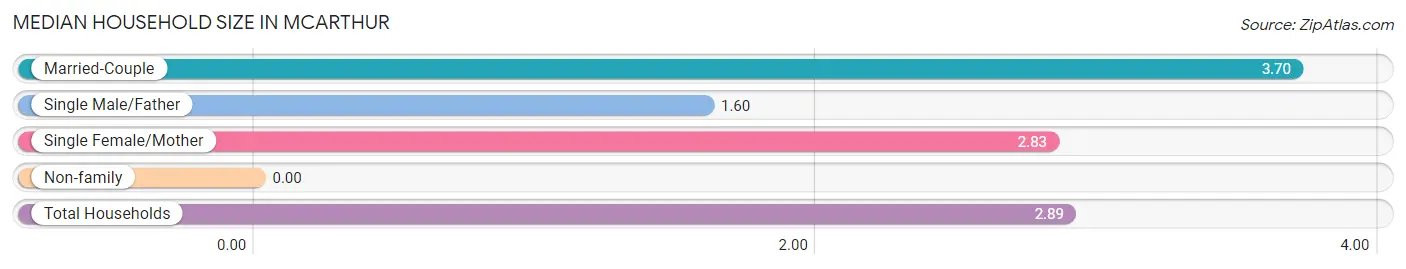
| Household Type | # Households | Household Size |
| Married-Couple | 77 (52.4%) | 3.70 |
| Single Male/Father | 10 (6.8%) | 1.60 |
| Single Female/Mother | 35 (23.8%) | 2.83 |
| Non-family | 25 (17.0%) | - |
| Total Households | 147 (100.0%) | 2.89 |
Household Size by Marriage Status in Mcarthur
Out of a total of 147 households in Mcarthur, 122 (83.0%) are family households, while 25 (17.0%) are nonfamily households. The most numerous type of family households are 2-person households, comprising 45, and the most common type of nonfamily households are 1-person households, comprising 25.
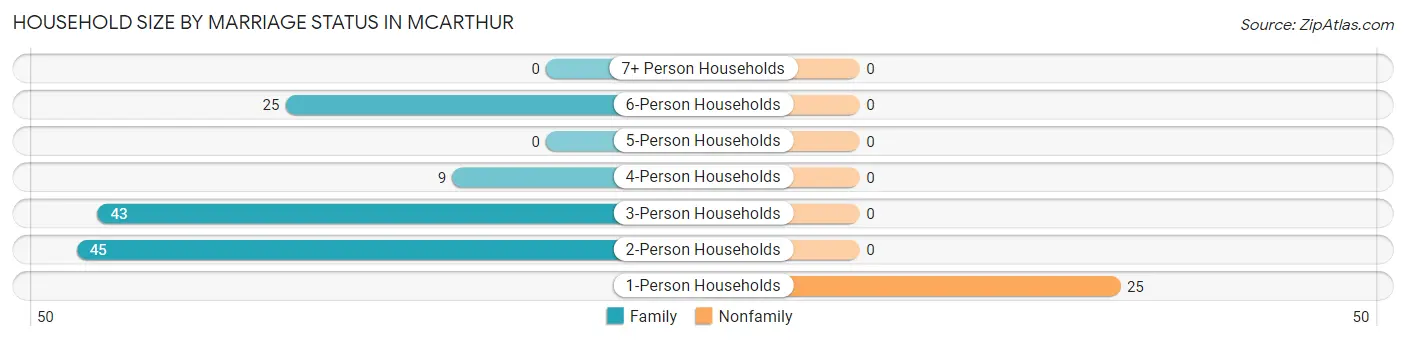
| Household Size | Family Households | Nonfamily Households |
| 1-Person Households | - | 25 (17.0%) |
| 2-Person Households | 45 (30.6%) | 0 (0.0%) |
| 3-Person Households | 43 (29.2%) | 0 (0.0%) |
| 4-Person Households | 9 (6.1%) | 0 (0.0%) |
| 5-Person Households | 0 (0.0%) | 0 (0.0%) |
| 6-Person Households | 25 (17.0%) | 0 (0.0%) |
| 7+ Person Households | 0 (0.0%) | 0 (0.0%) |
| Total | 122 (83.0%) | 25 (17.0%) |
Female Fertility in Mcarthur
Fertility by Age in Mcarthur
| Age Bracket | Women with Births | Births / 1,000 Women |
| 15 to 19 years | 0 (0.0%) | 0.0 |
| 20 to 34 years | 0 (0.0%) | 0.0 |
| 35 to 50 years | 0 (0.0%) | 0.0 |
| Total | 0 (0.0%) | 0.0 |
Fertility by Age by Marriage Status in Mcarthur
| Age Bracket | Married | Unmarried |
| 15 to 19 years | 0 (0.0%) | 0 (0.0%) |
| 20 to 34 years | 0 (0.0%) | 0 (0.0%) |
| 35 to 50 years | 0 (0.0%) | 0 (0.0%) |
| Total | 0 (0.0%) | 0 (0.0%) |
Fertility by Education in Mcarthur
| Educational Attainment | Women with Births | Births / 1,000 Women |
| Less than High School | 0 (0.0%) | 0.0 |
| High School Diploma | 0 (0.0%) | 0.0 |
| College or Associate's Degree | 0 (0.0%) | 0.0 |
| Bachelor's Degree | 0 (0.0%) | 0.0 |
| Graduate Degree | 0 (0.0%) | 0.0 |
| Total | 0 (0.0%) | 0.0 |
Fertility by Education by Marriage Status in Mcarthur
| Educational Attainment | Married | Unmarried |
| Less than High School | 0 (0.0%) | 0 (0.0%) |
| High School Diploma | 0 (0.0%) | 0 (0.0%) |
| College or Associate's Degree | 0 (0.0%) | 0 (0.0%) |
| Bachelor's Degree | 0 (0.0%) | 0 (0.0%) |
| Graduate Degree | 0 (0.0%) | 0 (0.0%) |
| Total | 0 (0.0%) | 0 (0.0%) |
Employment Characteristics in Mcarthur
Employment by Class of Employer in Mcarthur
Among the 150 employed individuals in Mcarthur, private company employees (112 | 74.7%), self-employed (incorporated) (21 | 14.0%), and local government employees (17 | 11.3%) make up the most common classes of employment.
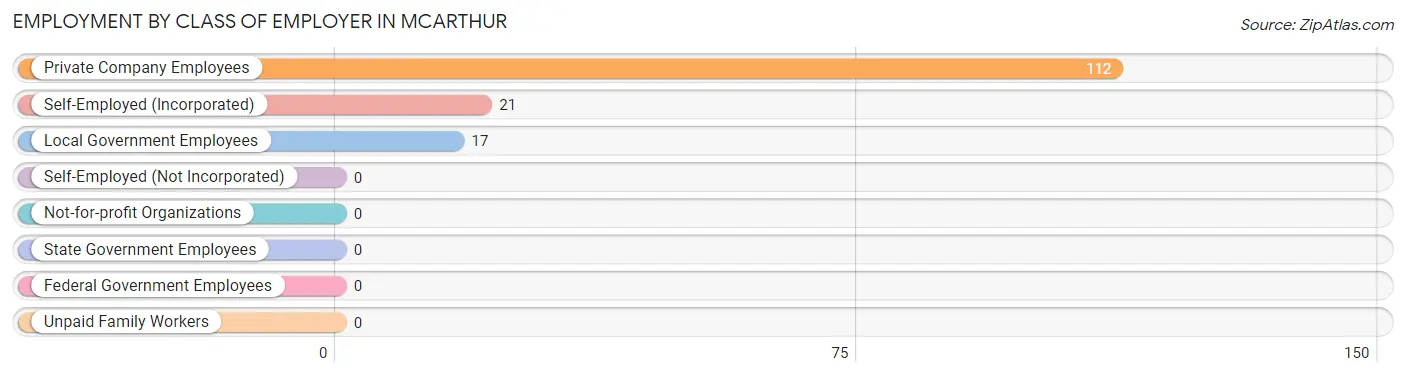
| Employer Class | # Employees | % Employees |
| Private Company Employees | 112 | 74.7% |
| Self-Employed (Incorporated) | 21 | 14.0% |
| Self-Employed (Not Incorporated) | 0 | 0.0% |
| Not-for-profit Organizations | 0 | 0.0% |
| Local Government Employees | 17 | 11.3% |
| State Government Employees | 0 | 0.0% |
| Federal Government Employees | 0 | 0.0% |
| Unpaid Family Workers | 0 | 0.0% |
| Total | 150 | 100.0% |
Employment Status by Age in Mcarthur
According to the labor force statistics for Mcarthur, out of the total population over 16 years of age (278), 60.8% or 169 individuals are in the labor force, with 11.2% or 19 of them unemployed. The age group with the highest labor force participation rate is 20 to 24 years, with 100.0% or 30 individuals in the labor force. Within the labor force, the 65 to 74 years age range has the highest percentage of unemployed individuals, with 100.0% or 19 of them being unemployed.
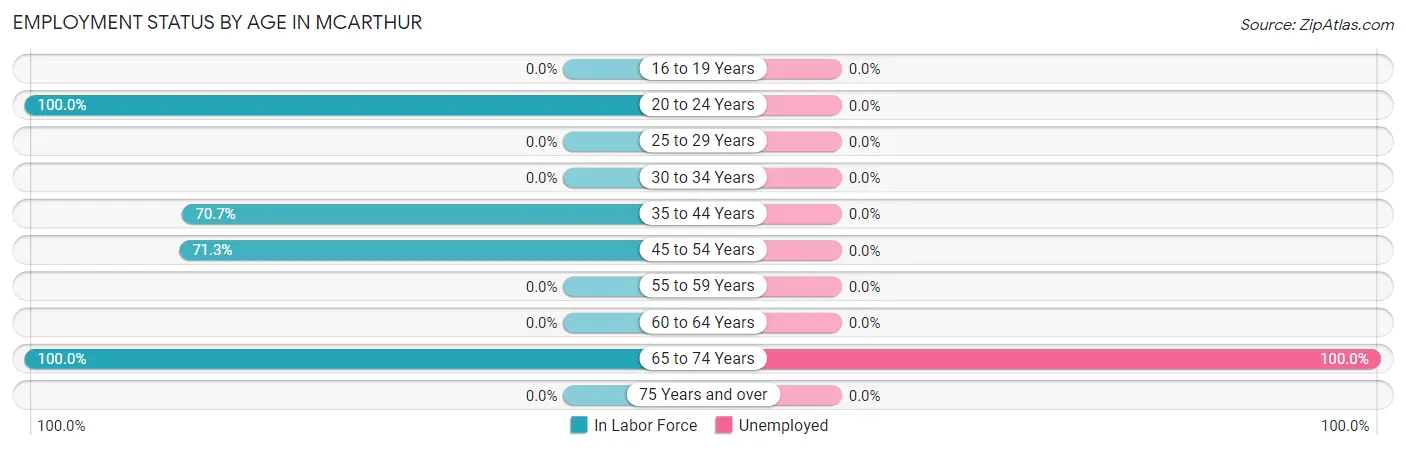
| Age Bracket | In Labor Force | Unemployed |
| 16 to 19 Years | 0 (0.0%) | 0 (0.0%) |
| 20 to 24 Years | 30 (100.0%) | 0 (0.0%) |
| 25 to 29 Years | 0 (0.0%) | 0 (0.0%) |
| 30 to 34 Years | 0 (0.0%) | 0 (0.0%) |
| 35 to 44 Years | 58 (70.7%) | 0 (0.0%) |
| 45 to 54 Years | 62 (71.3%) | 0 (0.0%) |
| 55 to 59 Years | 0 (0.0%) | 0 (0.0%) |
| 60 to 64 Years | 0 (0.0%) | 0 (0.0%) |
| 65 to 74 Years | 19 (100.0%) | 19 (100.0%) |
| 75 Years and over | 0 (0.0%) | 0 (0.0%) |
| Total | 169 (60.8%) | 19 (11.2%) |
Employment Status by Educational Attainment in Mcarthur
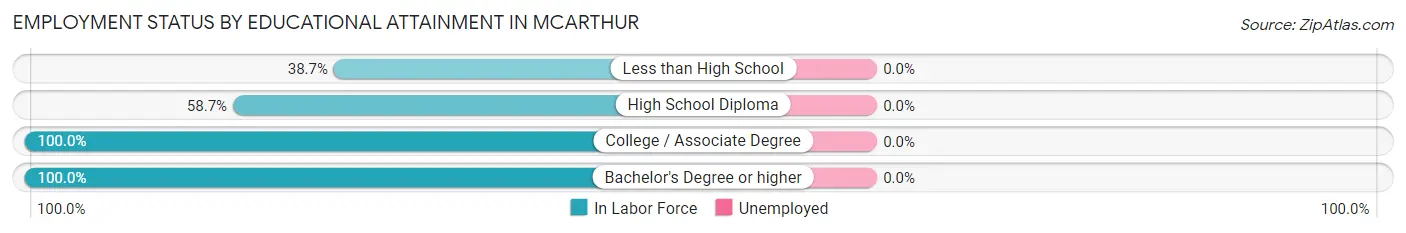
| Educational Attainment | In Labor Force | Unemployed |
| Less than High School | 24 (38.7%) | 0 (0.0%) |
| High School Diploma | 44 (58.7%) | 0 (0.0%) |
| College / Associate Degree | 35 (100.0%) | 0 (0.0%) |
| Bachelor's Degree or higher | 17 (100.0%) | 0 (0.0%) |
| Total | 120 (63.5%) | 0 (0.0%) |
Employment Occupations by Sex in Mcarthur
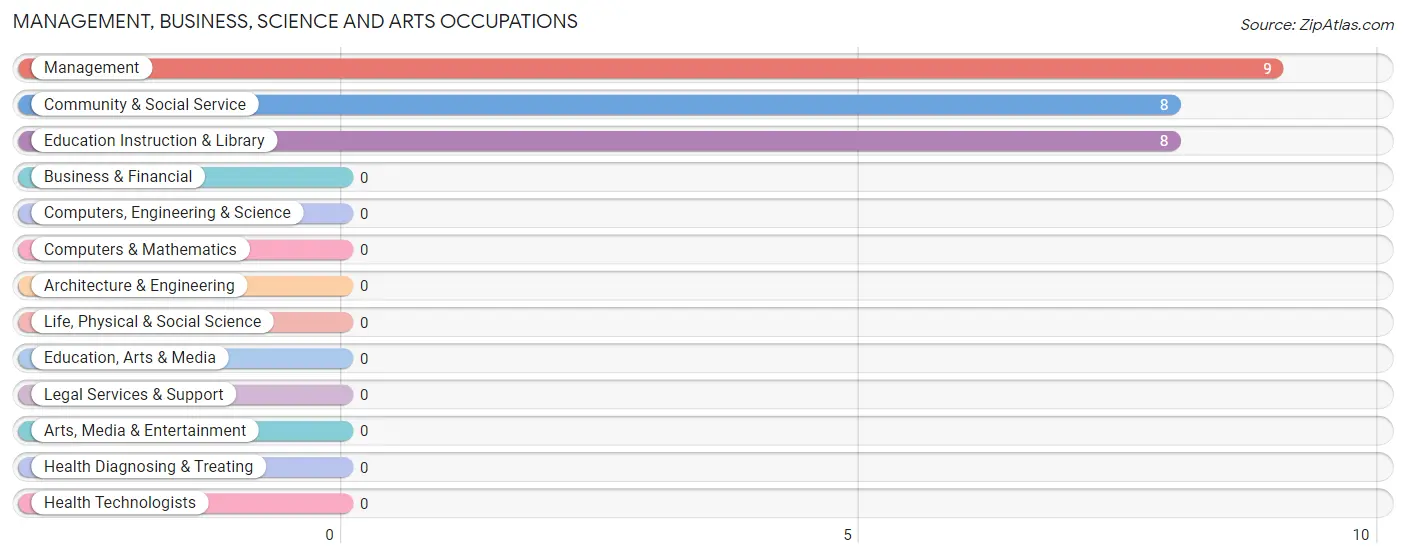
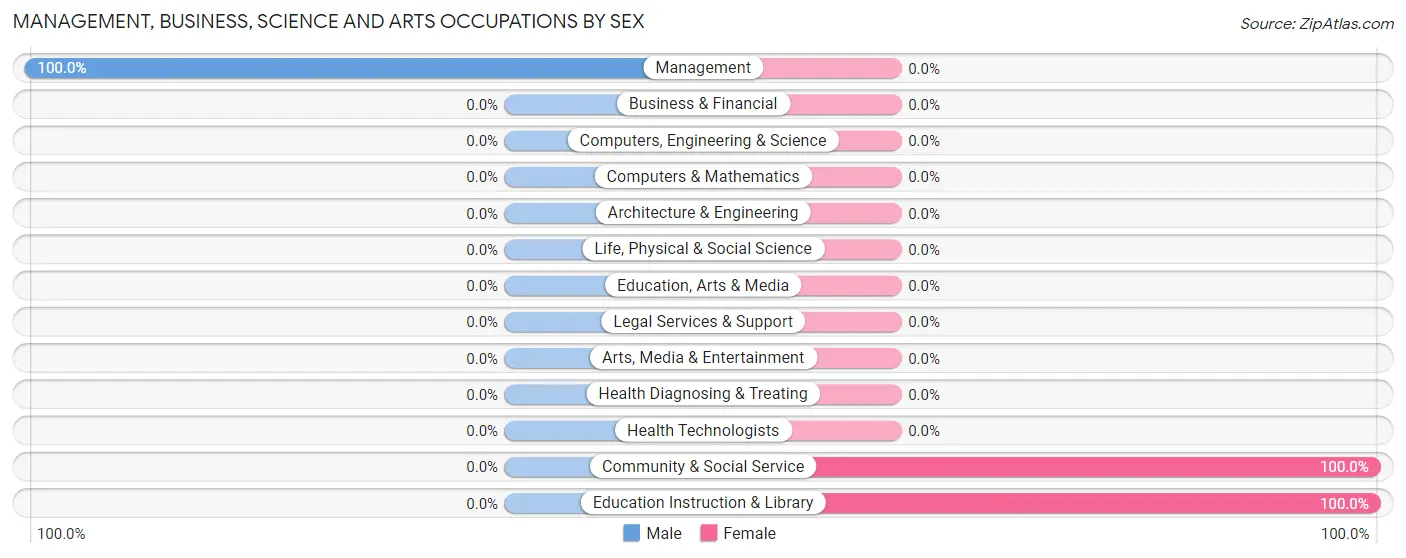
Management, Business, Science and Arts Occupations
The most common Management, Business, Science and Arts occupations in Mcarthur are Management (9 | 6.0%), Community & Social Service (8 | 5.3%), and Education Instruction & Library (8 | 5.3%).
Management, Business, Science and Arts Occupations by Sex
| Occupation | Male | Female |
| Management | 9 (100.0%) | 0 (0.0%) |
| Business & Financial | 0 (0.0%) | 0 (0.0%) |
| Computers, Engineering & Science | 0 (0.0%) | 0 (0.0%) |
| Computers & Mathematics | 0 (0.0%) | 0 (0.0%) |
| Architecture & Engineering | 0 (0.0%) | 0 (0.0%) |
| Life, Physical & Social Science | 0 (0.0%) | 0 (0.0%) |
| Community & Social Service | 0 (0.0%) | 8 (100.0%) |
| Education, Arts & Media | 0 (0.0%) | 0 (0.0%) |
| Legal Services & Support | 0 (0.0%) | 0 (0.0%) |
| Education Instruction & Library | 0 (0.0%) | 8 (100.0%) |
| Arts, Media & Entertainment | 0 (0.0%) | 0 (0.0%) |
| Health Diagnosing & Treating | 0 (0.0%) | 0 (0.0%) |
| Health Technologists | 0 (0.0%) | 0 (0.0%) |
| Total (Category) | 9 (52.9%) | 8 (47.1%) |
| Total (Overall) | 54 (36.0%) | 96 (64.0%) |
Services Occupations
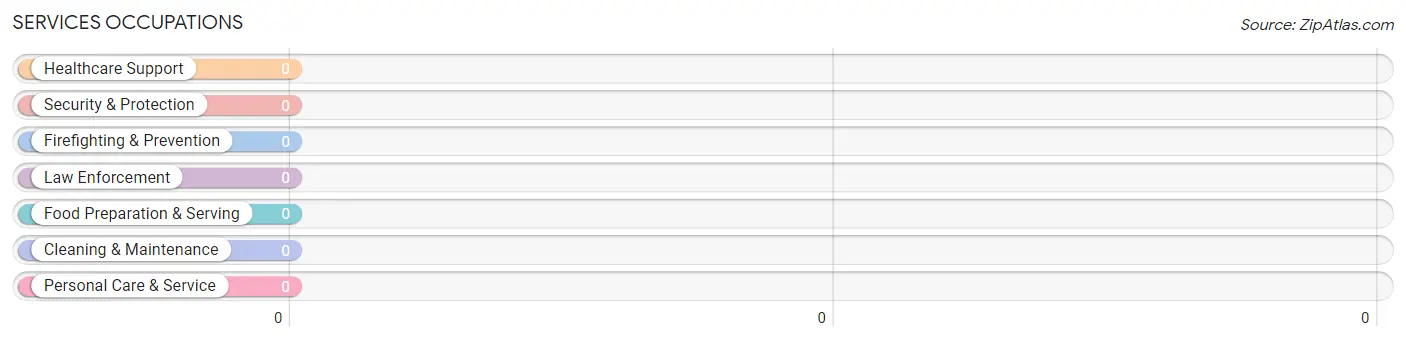
Services Occupations by Sex
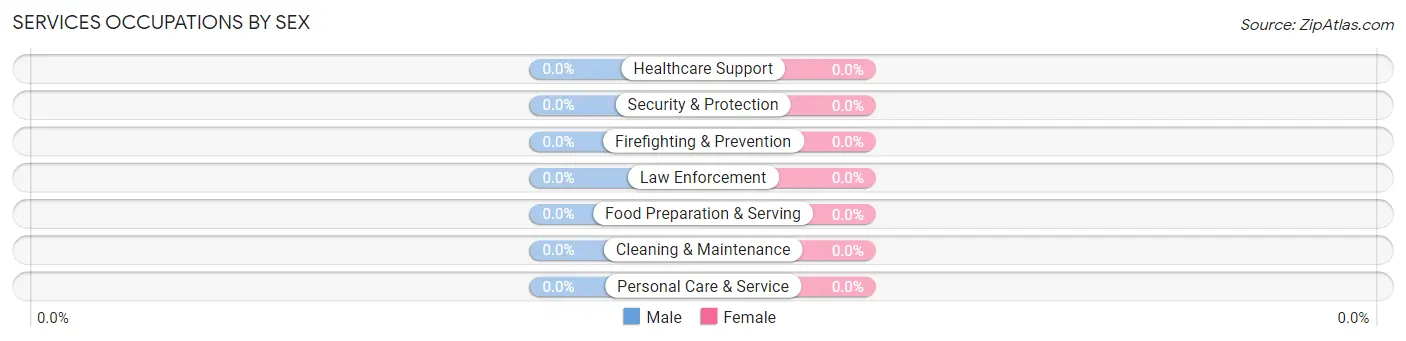
| Occupation | Male | Female |
| Healthcare Support | 0 (0.0%) | 0 (0.0%) |
| Security & Protection | 0 (0.0%) | 0 (0.0%) |
| Firefighting & Prevention | 0 (0.0%) | 0 (0.0%) |
| Law Enforcement | 0 (0.0%) | 0 (0.0%) |
| Food Preparation & Serving | 0 (0.0%) | 0 (0.0%) |
| Cleaning & Maintenance | 0 (0.0%) | 0 (0.0%) |
| Personal Care & Service | 0 (0.0%) | 0 (0.0%) |
| Total (Category) | 0 (0.0%) | 0 (0.0%) |
| Total (Overall) | 54 (36.0%) | 96 (64.0%) |
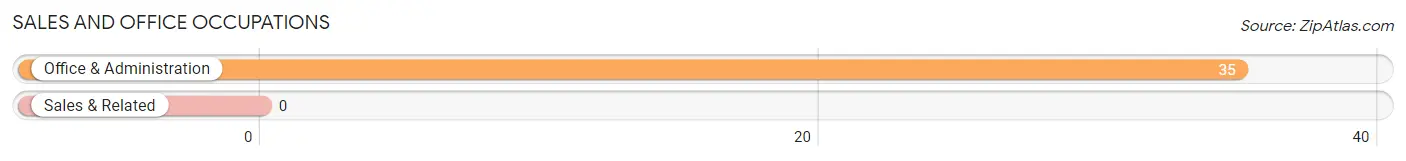
Sales and Office Occupations
The most common Sales and Office occupations in Mcarthur are , and Office & Administration (35 | 23.3%).
Sales and Office Occupations by Sex
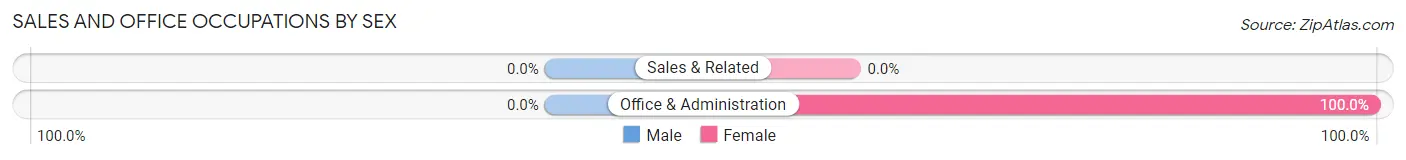
| Occupation | Male | Female |
| Sales & Related | 0 (0.0%) | 0 (0.0%) |
| Office & Administration | 0 (0.0%) | 35 (100.0%) |
| Total (Category) | 0 (0.0%) | 35 (100.0%) |
| Total (Overall) | 54 (36.0%) | 96 (64.0%) |
Natural Resources, Construction and Maintenance Occupations
Natural Resources, Construction and Maintenance Occupations by Sex
| Occupation | Male | Female |
| Farming, Fishing & Forestry | 0 (0.0%) | 0 (0.0%) |
| Construction & Extraction | 0 (0.0%) | 0 (0.0%) |
| Installation, Maintenance & Repair | 0 (0.0%) | 0 (0.0%) |
| Total (Category) | 0 (0.0%) | 0 (0.0%) |
| Total (Overall) | 54 (36.0%) | 96 (64.0%) |
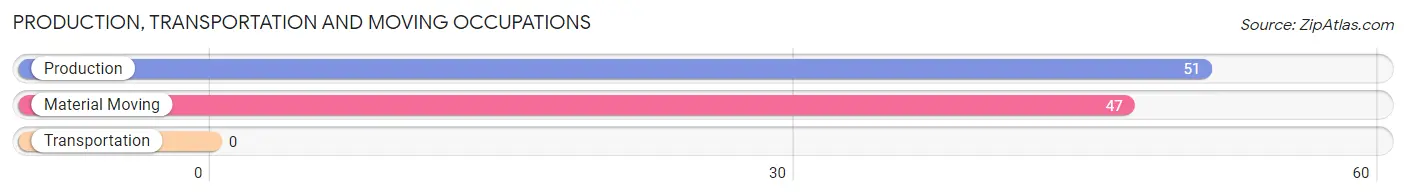
Production, Transportation and Moving Occupations
The most common Production, Transportation and Moving occupations in Mcarthur are Production (51 | 34.0%), and Material Moving (47 | 31.3%).
Production, Transportation and Moving Occupations by Sex
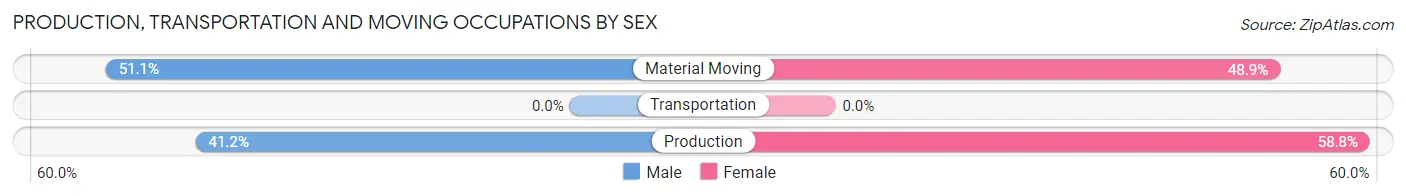
| Occupation | Male | Female |
| Production | 21 (41.2%) | 30 (58.8%) |
| Transportation | 0 (0.0%) | 0 (0.0%) |
| Material Moving | 24 (51.1%) | 23 (48.9%) |
| Total (Category) | 45 (45.9%) | 53 (54.1%) |
| Total (Overall) | 54 (36.0%) | 96 (64.0%) |
Employment Industries by Sex in Mcarthur
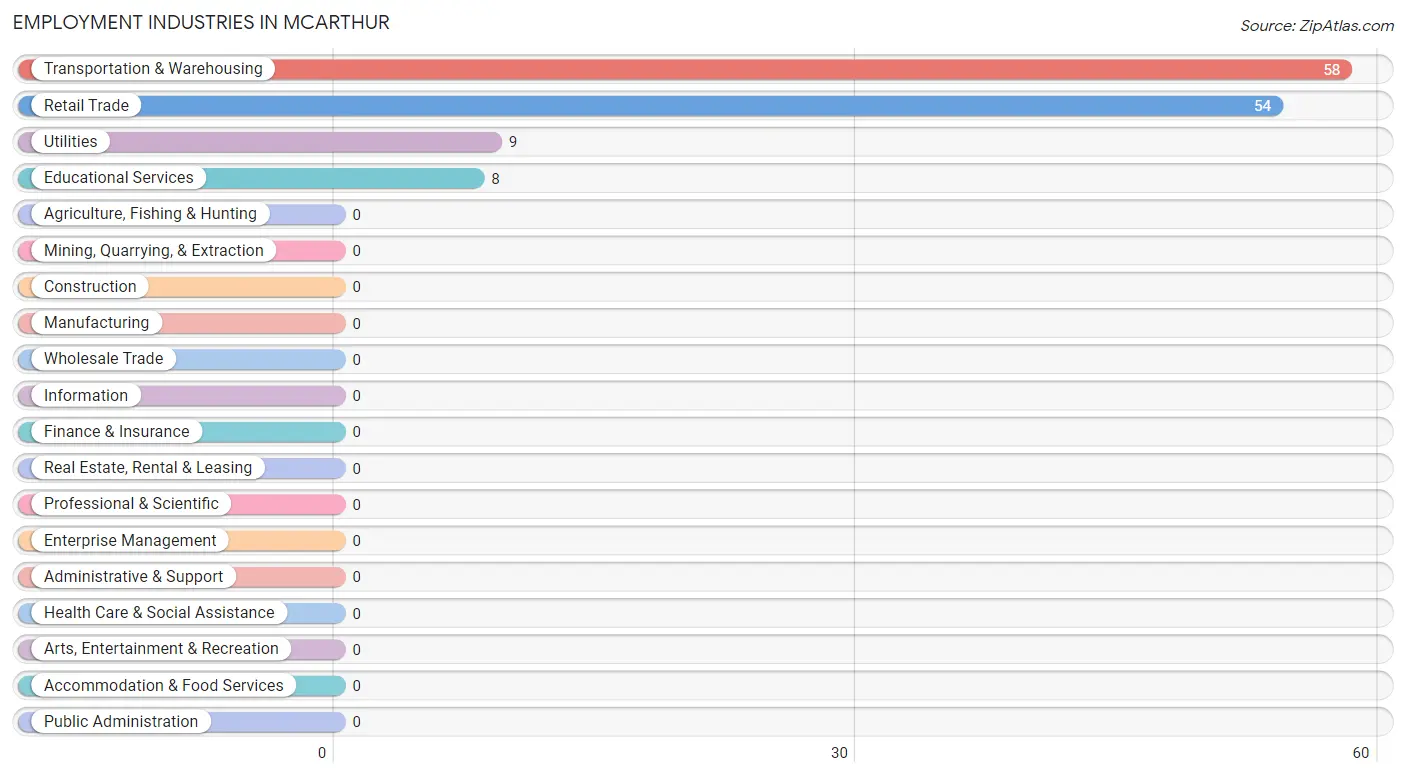
Employment Industries in Mcarthur
The major employment industries in Mcarthur include Transportation & Warehousing (58 | 38.7%), Retail Trade (54 | 36.0%), Utilities (9 | 6.0%), and Educational Services (8 | 5.3%).
Employment Industries by Sex in Mcarthur
The Mcarthur industries that see more men than women are Utilities (100.0%), and Retail Trade (44.4%), whereas the industries that tend to have a higher number of women are Transportation & Warehousing (100.0%), Educational Services (100.0%), and Retail Trade (55.6%).
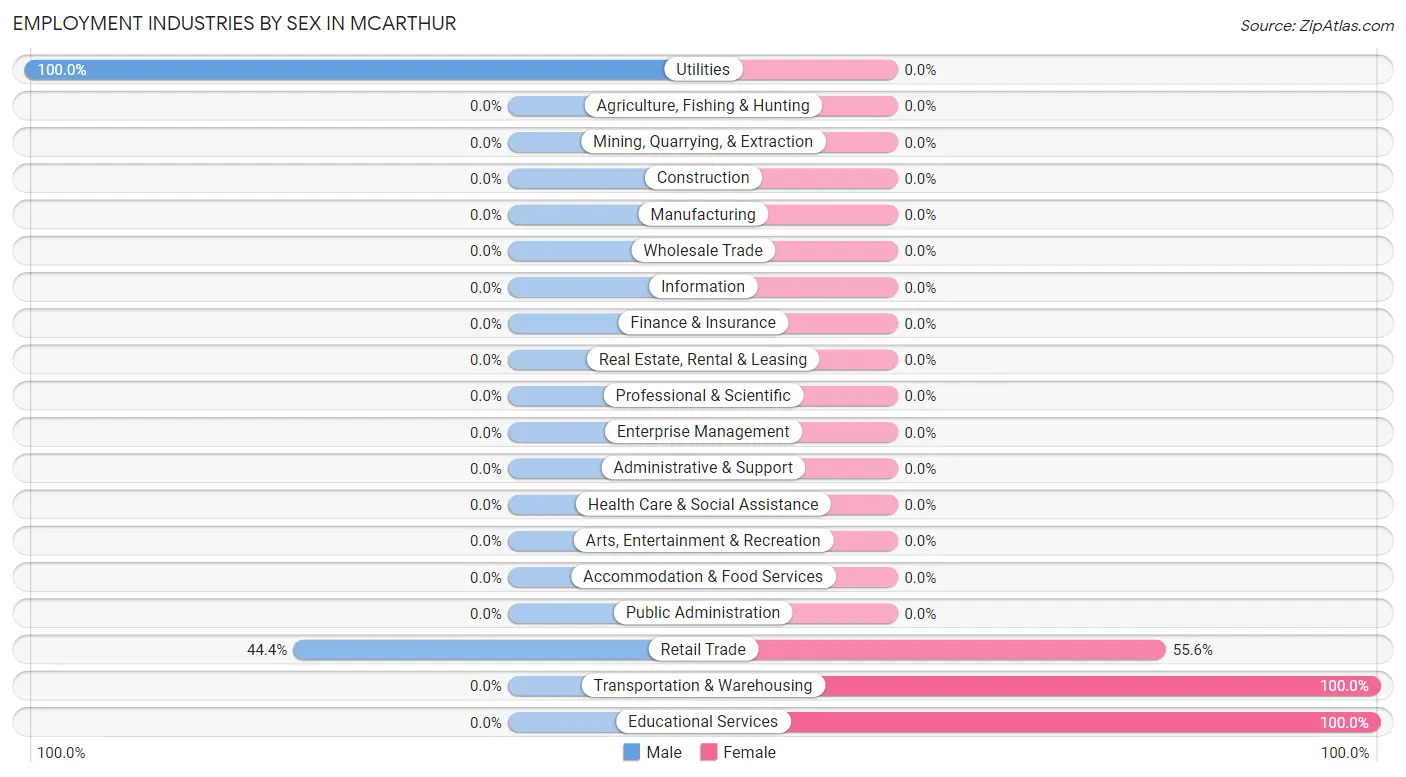
| Industry | Male | Female |
| Agriculture, Fishing & Hunting | 0 (0.0%) | 0 (0.0%) |
| Mining, Quarrying, & Extraction | 0 (0.0%) | 0 (0.0%) |
| Construction | 0 (0.0%) | 0 (0.0%) |
| Manufacturing | 0 (0.0%) | 0 (0.0%) |
| Wholesale Trade | 0 (0.0%) | 0 (0.0%) |
| Retail Trade | 24 (44.4%) | 30 (55.6%) |
| Transportation & Warehousing | 0 (0.0%) | 58 (100.0%) |
| Utilities | 9 (100.0%) | 0 (0.0%) |
| Information | 0 (0.0%) | 0 (0.0%) |
| Finance & Insurance | 0 (0.0%) | 0 (0.0%) |
| Real Estate, Rental & Leasing | 0 (0.0%) | 0 (0.0%) |
| Professional & Scientific | 0 (0.0%) | 0 (0.0%) |
| Enterprise Management | 0 (0.0%) | 0 (0.0%) |
| Administrative & Support | 0 (0.0%) | 0 (0.0%) |
| Educational Services | 0 (0.0%) | 8 (100.0%) |
| Health Care & Social Assistance | 0 (0.0%) | 0 (0.0%) |
| Arts, Entertainment & Recreation | 0 (0.0%) | 0 (0.0%) |
| Accommodation & Food Services | 0 (0.0%) | 0 (0.0%) |
| Public Administration | 0 (0.0%) | 0 (0.0%) |
| Total | 54 (36.0%) | 96 (64.0%) |
Education in Mcarthur
School Enrollment in Mcarthur
The most common levels of schooling among the 193 students in Mcarthur are middle school (79 | 40.9%), college / undergraduate (65 | 33.7%), and elementary school (39 | 20.2%).
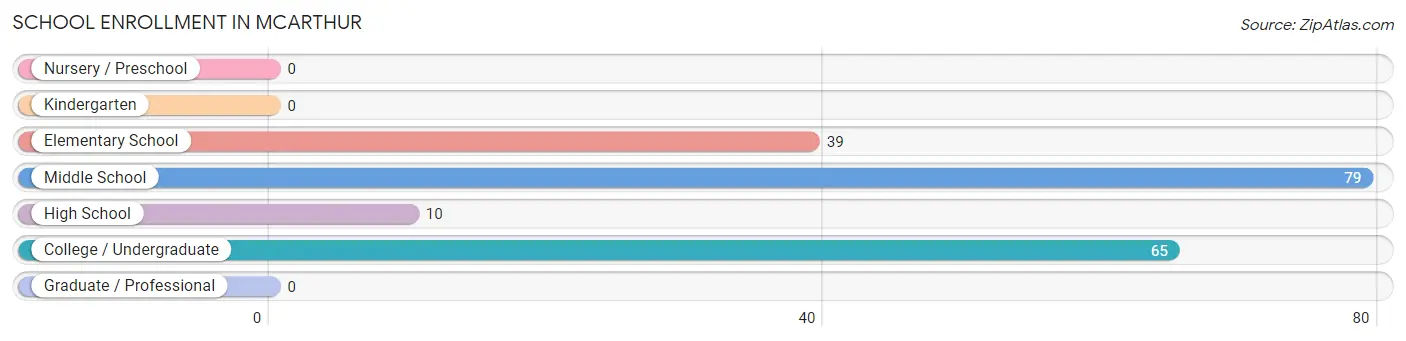
| School Level | # Students | % Students |
| Nursery / Preschool | 0 | 0.0% |
| Kindergarten | 0 | 0.0% |
| Elementary School | 39 | 20.2% |
| Middle School | 79 | 40.9% |
| High School | 10 | 5.2% |
| College / Undergraduate | 65 | 33.7% |
| Graduate / Professional | 0 | 0.0% |
| Total | 193 | 100.0% |
School Enrollment by Age by Funding Source in Mcarthur
Out of a total of 193 students who are enrolled in schools in Mcarthur, 54 (28.0%) attend a private institution, while the remaining 139 (72.0%) are enrolled in public schools. The age group of 5 to 9 year old has the highest likelihood of being enrolled in private schools, with 19 (100.0% in the age bracket) enrolled. Conversely, the age group of 20 to 24 year olds has the lowest likelihood of being enrolled in a private school, with 30 (100.0% in the age bracket) attending a public institution.
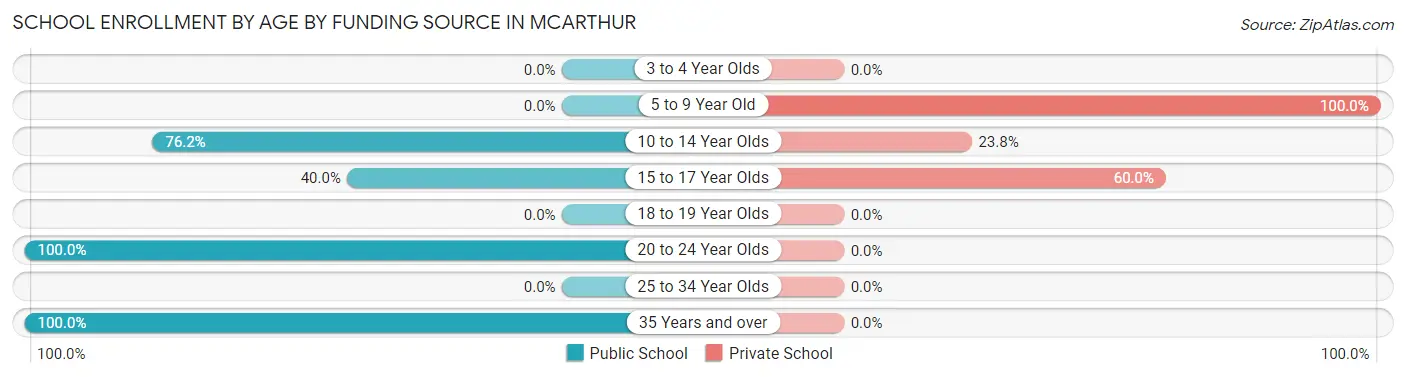
| Age Bracket | Public School | Private School |
| 3 to 4 Year Olds | 0 (0.0%) | 0 (0.0%) |
| 5 to 9 Year Old | 0 (0.0%) | 19 (100.0%) |
| 10 to 14 Year Olds | 64 (76.2%) | 20 (23.8%) |
| 15 to 17 Year Olds | 10 (40.0%) | 15 (60.0%) |
| 18 to 19 Year Olds | 0 (0.0%) | 0 (0.0%) |
| 20 to 24 Year Olds | 30 (100.0%) | 0 (0.0%) |
| 25 to 34 Year Olds | 0 (0.0%) | 0 (0.0%) |
| 35 Years and over | 35 (100.0%) | 0 (0.0%) |
| Total | 139 (72.0%) | 54 (28.0%) |
Educational Attainment by Field of Study in Mcarthur
Physical & health sciences (9 | 52.9%), and computers & mathematics (8 | 47.1%) are the most common fields of study among 17 individuals in Mcarthur who have obtained a bachelor's degree or higher.
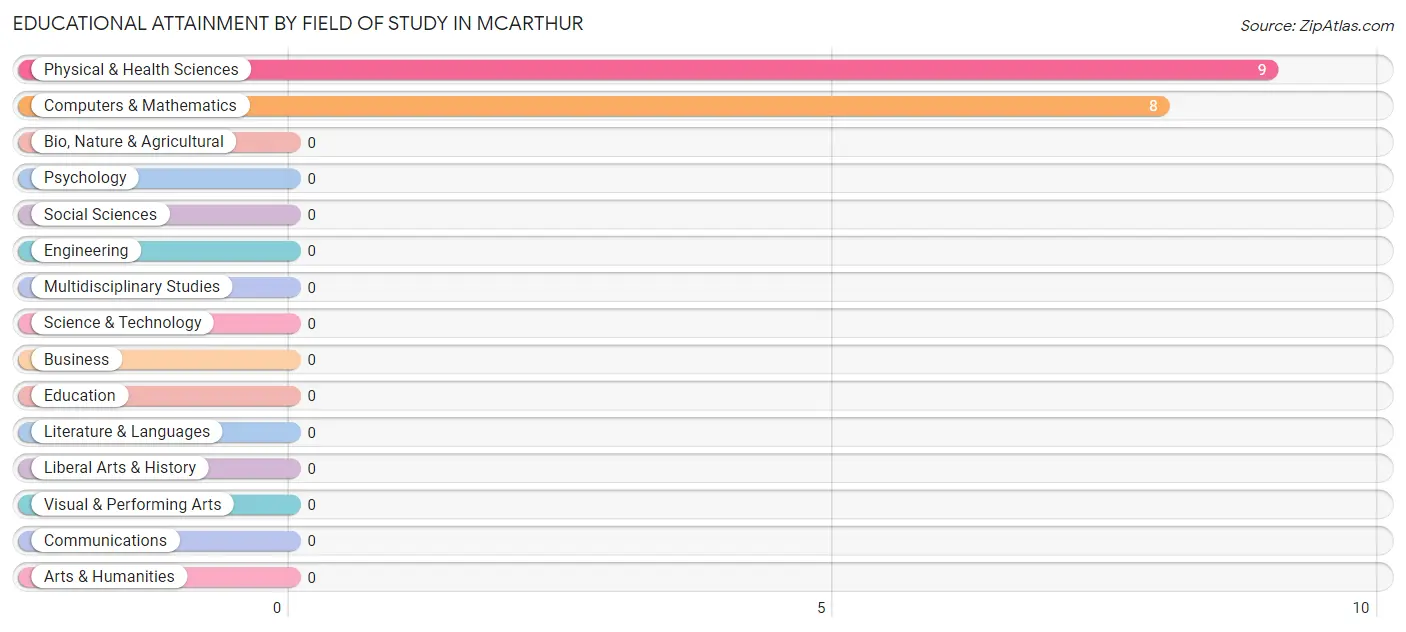
| Field of Study | # Graduates | % Graduates |
| Computers & Mathematics | 8 | 47.1% |
| Bio, Nature & Agricultural | 0 | 0.0% |
| Physical & Health Sciences | 9 | 52.9% |
| Psychology | 0 | 0.0% |
| Social Sciences | 0 | 0.0% |
| Engineering | 0 | 0.0% |
| Multidisciplinary Studies | 0 | 0.0% |
| Science & Technology | 0 | 0.0% |
| Business | 0 | 0.0% |
| Education | 0 | 0.0% |
| Literature & Languages | 0 | 0.0% |
| Liberal Arts & History | 0 | 0.0% |
| Visual & Performing Arts | 0 | 0.0% |
| Communications | 0 | 0.0% |
| Arts & Humanities | 0 | 0.0% |
| Total | 17 | 100.0% |
Transportation & Commute in Mcarthur
Vehicle Availability by Sex in Mcarthur
The most prevalent vehicle ownership categories in Mcarthur are males with 3 vehicles (30, accounting for 55.6%) and females with 3 vehicles (8, making up 31.2%).
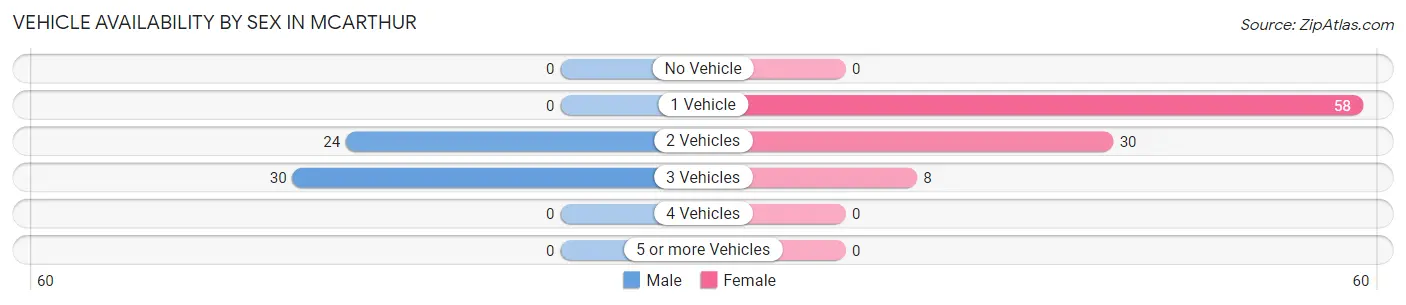
| Vehicles Available | Male | Female |
| No Vehicle | 0 (0.0%) | 0 (0.0%) |
| 1 Vehicle | 0 (0.0%) | 58 (60.4%) |
| 2 Vehicles | 24 (44.4%) | 30 (31.2%) |
| 3 Vehicles | 30 (55.6%) | 8 (8.3%) |
| 4 Vehicles | 0 (0.0%) | 0 (0.0%) |
| 5 or more Vehicles | 0 (0.0%) | 0 (0.0%) |
| Total | 54 (100.0%) | 96 (100.0%) |
Commute Time in Mcarthur
The most frequently occuring commute durations in Mcarthur are 10 to 14 minutes (54 commuters, 36.0%), 5 to 9 minutes (52 commuters, 34.7%), and less than 5 minutes (35 commuters, 23.3%).
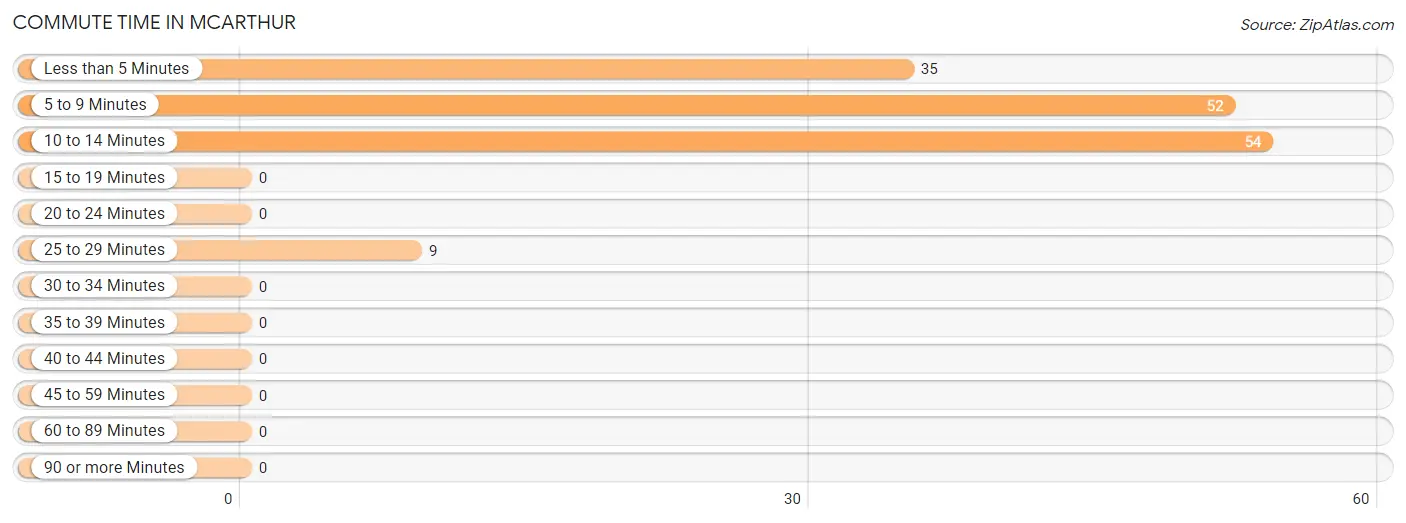
| Commute Time | # Commuters | % Commuters |
| Less than 5 Minutes | 35 | 23.3% |
| 5 to 9 Minutes | 52 | 34.7% |
| 10 to 14 Minutes | 54 | 36.0% |
| 15 to 19 Minutes | 0 | 0.0% |
| 20 to 24 Minutes | 0 | 0.0% |
| 25 to 29 Minutes | 9 | 6.0% |
| 30 to 34 Minutes | 0 | 0.0% |
| 35 to 39 Minutes | 0 | 0.0% |
| 40 to 44 Minutes | 0 | 0.0% |
| 45 to 59 Minutes | 0 | 0.0% |
| 60 to 89 Minutes | 0 | 0.0% |
| 90 or more Minutes | 0 | 0.0% |
Commute Time by Sex in Mcarthur
The most common commute times in Mcarthur are 10 to 14 minutes (24 commuters, 44.4%) for males and less than 5 minutes (35 commuters, 36.5%) for females.
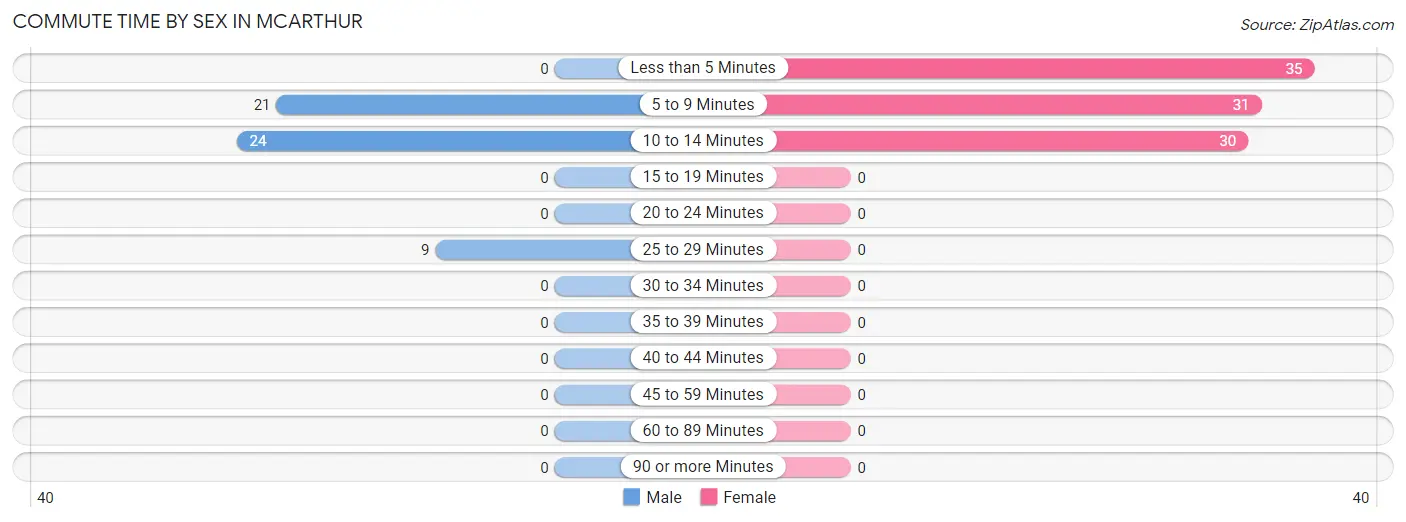
| Commute Time | Male | Female |
| Less than 5 Minutes | 0 (0.0%) | 35 (36.5%) |
| 5 to 9 Minutes | 21 (38.9%) | 31 (32.3%) |
| 10 to 14 Minutes | 24 (44.4%) | 30 (31.2%) |
| 15 to 19 Minutes | 0 (0.0%) | 0 (0.0%) |
| 20 to 24 Minutes | 0 (0.0%) | 0 (0.0%) |
| 25 to 29 Minutes | 9 (16.7%) | 0 (0.0%) |
| 30 to 34 Minutes | 0 (0.0%) | 0 (0.0%) |
| 35 to 39 Minutes | 0 (0.0%) | 0 (0.0%) |
| 40 to 44 Minutes | 0 (0.0%) | 0 (0.0%) |
| 45 to 59 Minutes | 0 (0.0%) | 0 (0.0%) |
| 60 to 89 Minutes | 0 (0.0%) | 0 (0.0%) |
| 90 or more Minutes | 0 (0.0%) | 0 (0.0%) |
Time of Departure to Work by Sex in Mcarthur
The most frequent times of departure to work in Mcarthur are 6:00 AM to 6:29 AM (45, 83.3%) for males and 9:00 AM to 9:59 AM (65, 67.7%) for females.
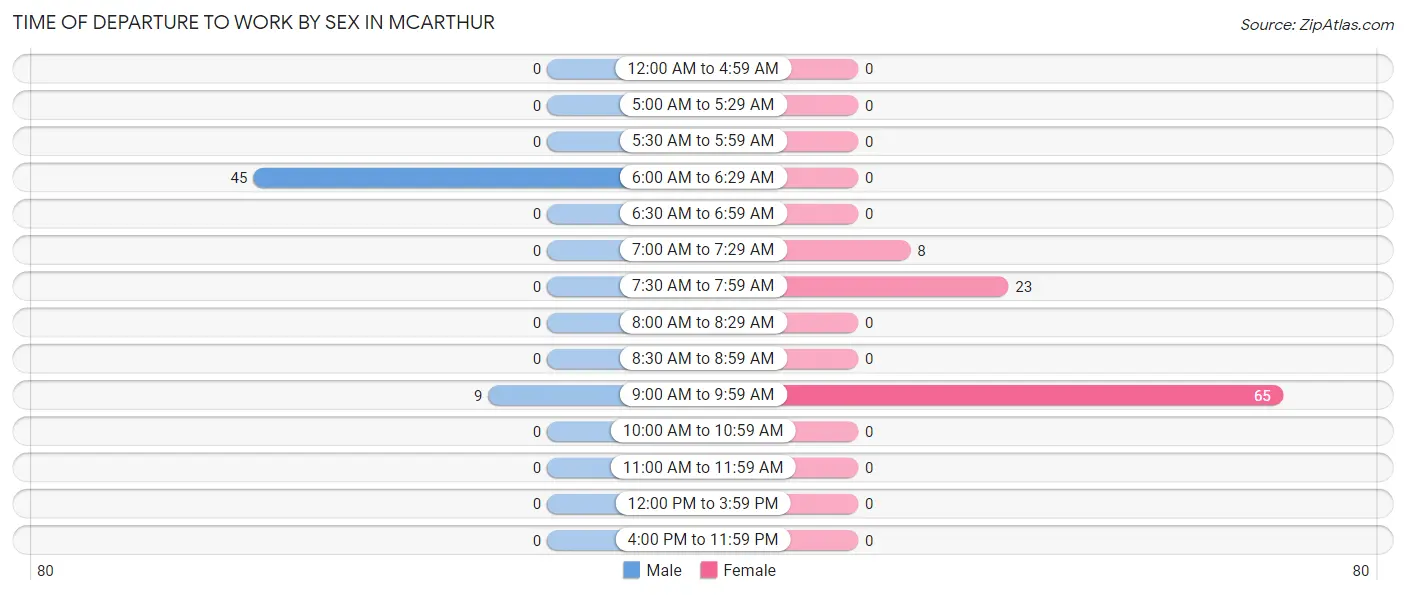
| Time of Departure | Male | Female |
| 12:00 AM to 4:59 AM | 0 (0.0%) | 0 (0.0%) |
| 5:00 AM to 5:29 AM | 0 (0.0%) | 0 (0.0%) |
| 5:30 AM to 5:59 AM | 0 (0.0%) | 0 (0.0%) |
| 6:00 AM to 6:29 AM | 45 (83.3%) | 0 (0.0%) |
| 6:30 AM to 6:59 AM | 0 (0.0%) | 0 (0.0%) |
| 7:00 AM to 7:29 AM | 0 (0.0%) | 8 (8.3%) |
| 7:30 AM to 7:59 AM | 0 (0.0%) | 23 (24.0%) |
| 8:00 AM to 8:29 AM | 0 (0.0%) | 0 (0.0%) |
| 8:30 AM to 8:59 AM | 0 (0.0%) | 0 (0.0%) |
| 9:00 AM to 9:59 AM | 9 (16.7%) | 65 (67.7%) |
| 10:00 AM to 10:59 AM | 0 (0.0%) | 0 (0.0%) |
| 11:00 AM to 11:59 AM | 0 (0.0%) | 0 (0.0%) |
| 12:00 PM to 3:59 PM | 0 (0.0%) | 0 (0.0%) |
| 4:00 PM to 11:59 PM | 0 (0.0%) | 0 (0.0%) |
| Total | 54 (100.0%) | 96 (100.0%) |
Housing Occupancy in Mcarthur
Occupancy by Ownership in Mcarthur
Of the total 147 dwellings in Mcarthur, owner-occupied units account for 112 (76.2%), while renter-occupied units make up 35 (23.8%).
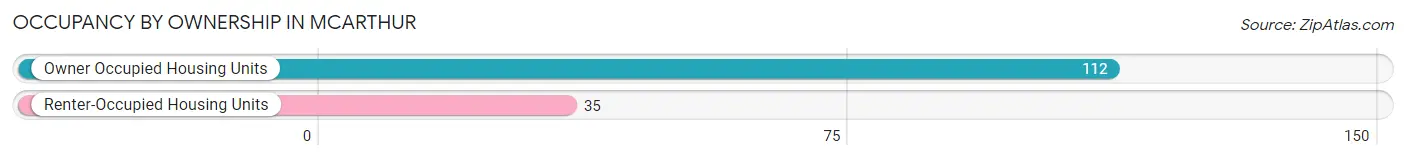
| Occupancy | # Housing Units | % Housing Units |
| Owner Occupied Housing Units | 112 | 76.2% |
| Renter-Occupied Housing Units | 35 | 23.8% |
| Total Occupied Housing Units | 147 | 100.0% |
Occupancy by Household Size in Mcarthur
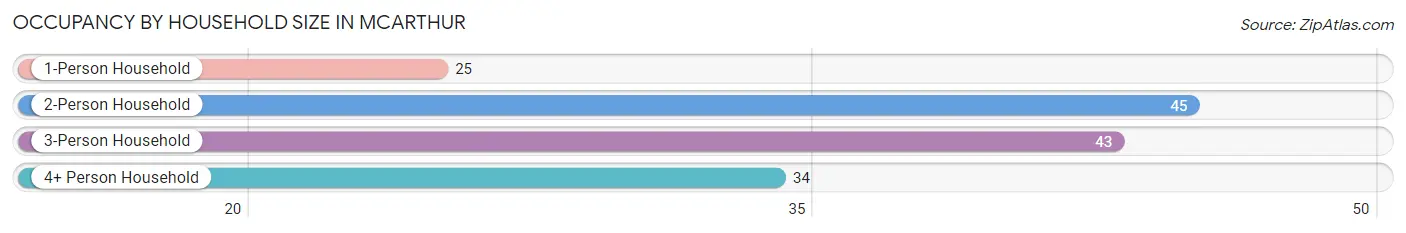
| Household Size | # Housing Units | % Housing Units |
| 1-Person Household | 25 | 17.0% |
| 2-Person Household | 45 | 30.6% |
| 3-Person Household | 43 | 29.2% |
| 4+ Person Household | 34 | 23.1% |
| Total Housing Units | 147 | 100.0% |
Occupancy by Ownership by Household Size in Mcarthur
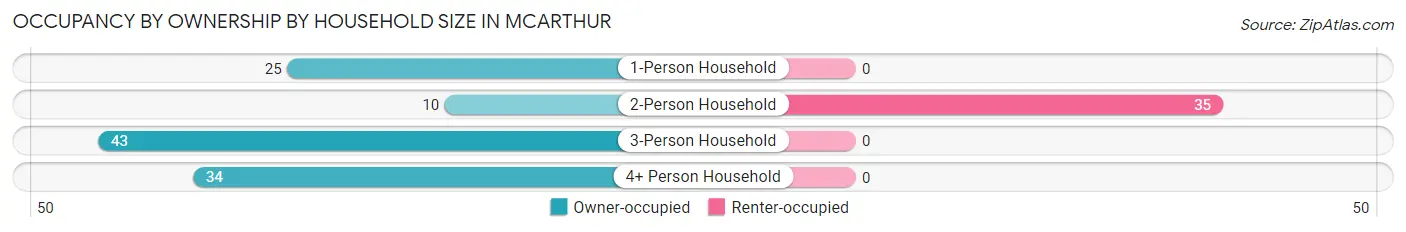
| Household Size | Owner-occupied | Renter-occupied |
| 1-Person Household | 25 (100.0%) | 0 (0.0%) |
| 2-Person Household | 10 (22.2%) | 35 (77.8%) |
| 3-Person Household | 43 (100.0%) | 0 (0.0%) |
| 4+ Person Household | 34 (100.0%) | 0 (0.0%) |
| Total Housing Units | 112 (76.2%) | 35 (23.8%) |
Occupancy by Educational Attainment in Mcarthur
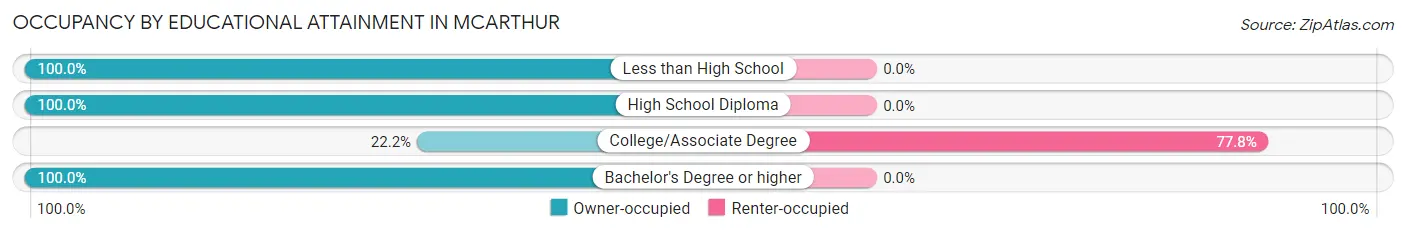
| Household Size | Owner-occupied | Renter-occupied |
| Less than High School | 24 (100.0%) | 0 (0.0%) |
| High School Diploma | 69 (100.0%) | 0 (0.0%) |
| College/Associate Degree | 10 (22.2%) | 35 (77.8%) |
| Bachelor's Degree or higher | 9 (100.0%) | 0 (0.0%) |
Occupancy by Age of Householder in Mcarthur
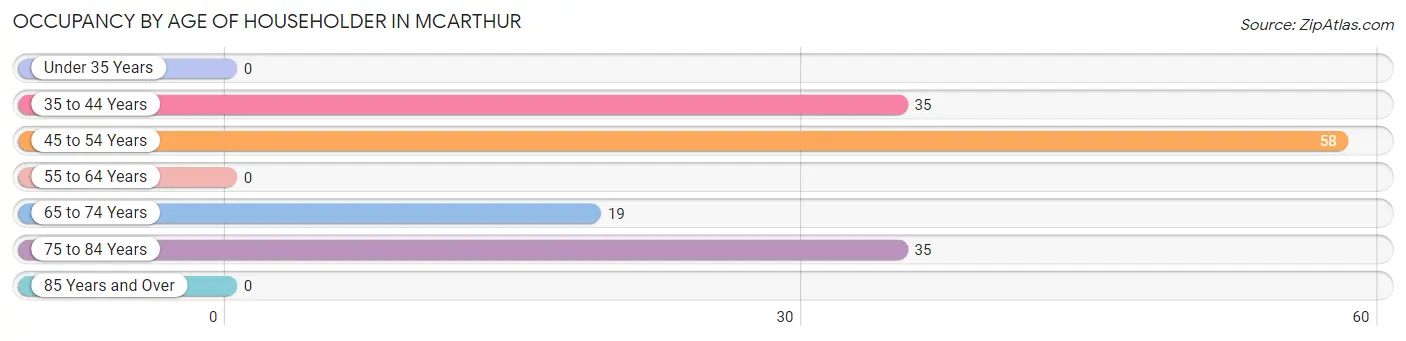
| Age Bracket | # Households | % Households |
| Under 35 Years | 0 | 0.0% |
| 35 to 44 Years | 35 | 23.8% |
| 45 to 54 Years | 58 | 39.5% |
| 55 to 64 Years | 0 | 0.0% |
| 65 to 74 Years | 19 | 12.9% |
| 75 to 84 Years | 35 | 23.8% |
| 85 Years and Over | 0 | 0.0% |
| Total | 147 | 100.0% |
Housing Finances in Mcarthur
Median Income by Occupancy in Mcarthur
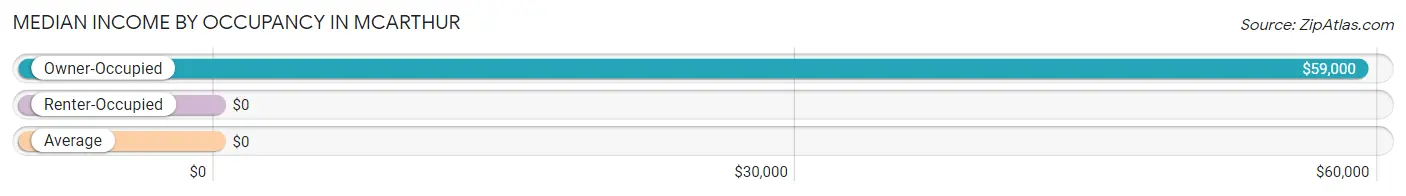
| Occupancy Type | # Households | Median Income |
| Owner-Occupied | 112 (76.2%) | $59,000 |
| Renter-Occupied | 35 (23.8%) | $0 |
| Average | 147 (100.0%) | $0 |
Occupancy by Householder Income Bracket in Mcarthur
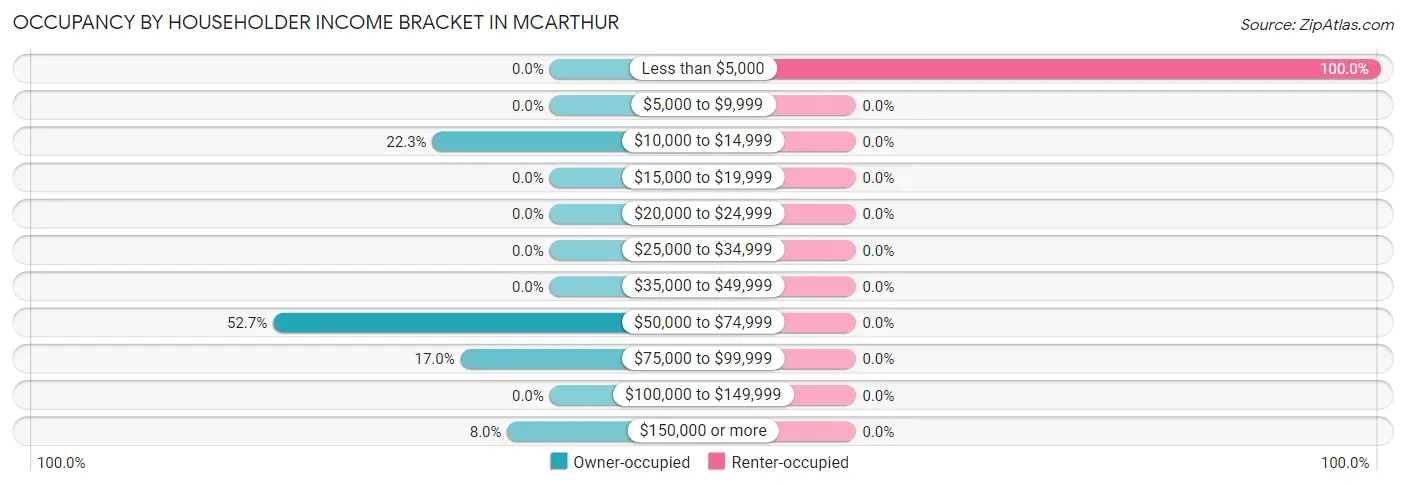
| Income Bracket | Owner-occupied | Renter-occupied |
| Less than $5,000 | 0 (0.0%) | 35 (100.0%) |
| $5,000 to $9,999 | 0 (0.0%) | 0 (0.0%) |
| $10,000 to $14,999 | 25 (22.3%) | 0 (0.0%) |
| $15,000 to $19,999 | 0 (0.0%) | 0 (0.0%) |
| $20,000 to $24,999 | 0 (0.0%) | 0 (0.0%) |
| $25,000 to $34,999 | 0 (0.0%) | 0 (0.0%) |
| $35,000 to $49,999 | 0 (0.0%) | 0 (0.0%) |
| $50,000 to $74,999 | 59 (52.7%) | 0 (0.0%) |
| $75,000 to $99,999 | 19 (17.0%) | 0 (0.0%) |
| $100,000 to $149,999 | 0 (0.0%) | 0 (0.0%) |
| $150,000 or more | 9 (8.0%) | 0 (0.0%) |
| Total | 112 (100.0%) | 35 (100.0%) |
Monthly Housing Cost Tiers in Mcarthur
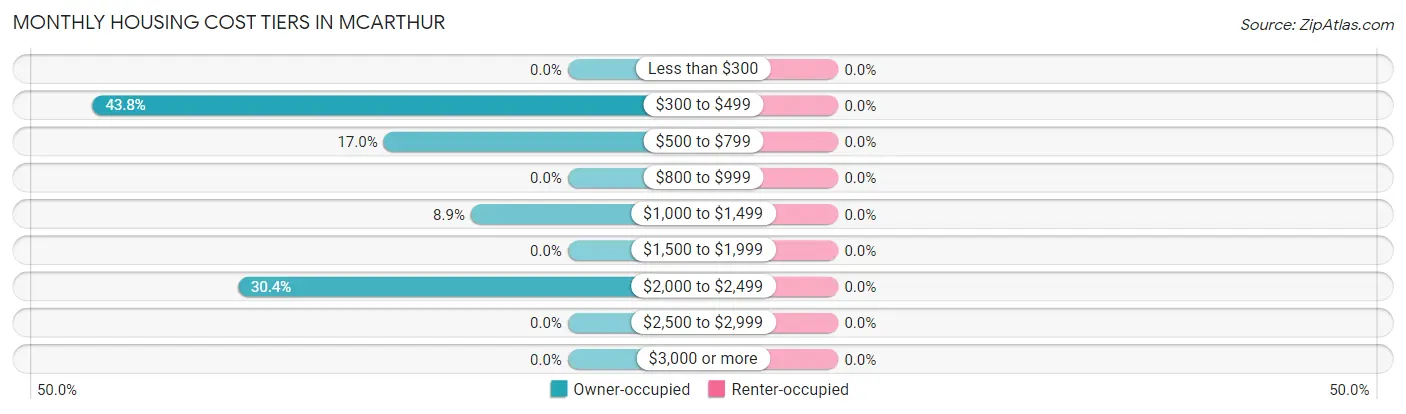
| Monthly Cost | Owner-occupied | Renter-occupied |
| Less than $300 | 0 (0.0%) | 0 (0.0%) |
| $300 to $499 | 49 (43.8%) | 0 (0.0%) |
| $500 to $799 | 19 (17.0%) | 0 (0.0%) |
| $800 to $999 | 0 (0.0%) | 0 (0.0%) |
| $1,000 to $1,499 | 10 (8.9%) | 0 (0.0%) |
| $1,500 to $1,999 | 0 (0.0%) | 0 (0.0%) |
| $2,000 to $2,499 | 34 (30.4%) | 0 (0.0%) |
| $2,500 to $2,999 | 0 (0.0%) | 0 (0.0%) |
| $3,000 or more | 0 (0.0%) | 0 (0.0%) |
| Total | 112 (100.0%) | 35 (100.0%) |
Physical Housing Characteristics in Mcarthur
Housing Structures in Mcarthur
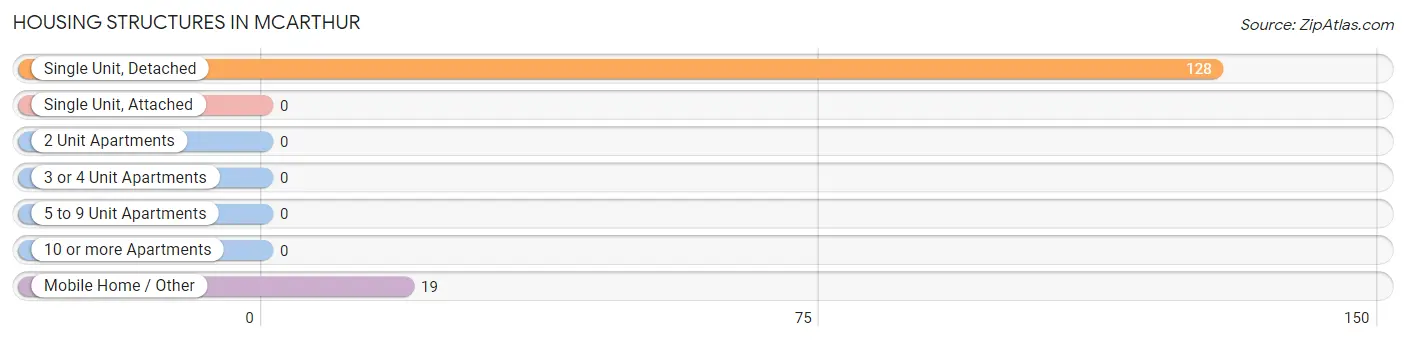
| Structure Type | # Housing Units | % Housing Units |
| Single Unit, Detached | 128 | 87.1% |
| Single Unit, Attached | 0 | 0.0% |
| 2 Unit Apartments | 0 | 0.0% |
| 3 or 4 Unit Apartments | 0 | 0.0% |
| 5 to 9 Unit Apartments | 0 | 0.0% |
| 10 or more Apartments | 0 | 0.0% |
| Mobile Home / Other | 19 | 12.9% |
| Total | 147 | 100.0% |
Housing Structures by Occupancy in Mcarthur
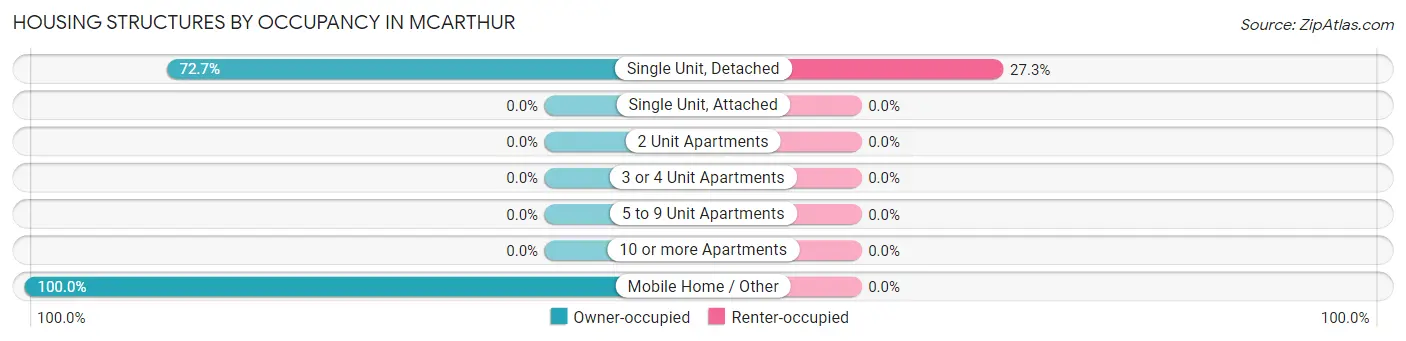
| Structure Type | Owner-occupied | Renter-occupied |
| Single Unit, Detached | 93 (72.7%) | 35 (27.3%) |
| Single Unit, Attached | 0 (0.0%) | 0 (0.0%) |
| 2 Unit Apartments | 0 (0.0%) | 0 (0.0%) |
| 3 or 4 Unit Apartments | 0 (0.0%) | 0 (0.0%) |
| 5 to 9 Unit Apartments | 0 (0.0%) | 0 (0.0%) |
| 10 or more Apartments | 0 (0.0%) | 0 (0.0%) |
| Mobile Home / Other | 19 (100.0%) | 0 (0.0%) |
| Total | 112 (76.2%) | 35 (23.8%) |
Housing Structures by Number of Rooms in Mcarthur
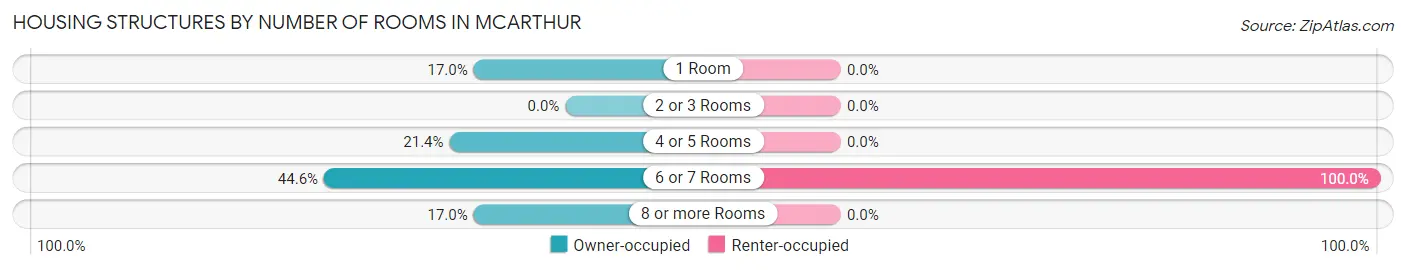
| Number of Rooms | Owner-occupied | Renter-occupied |
| 1 Room | 19 (17.0%) | 0 (0.0%) |
| 2 or 3 Rooms | 0 (0.0%) | 0 (0.0%) |
| 4 or 5 Rooms | 24 (21.4%) | 0 (0.0%) |
| 6 or 7 Rooms | 50 (44.6%) | 35 (100.0%) |
| 8 or more Rooms | 19 (17.0%) | 0 (0.0%) |
| Total | 112 (100.0%) | 35 (100.0%) |
Housing Structure by Heating Type in Mcarthur
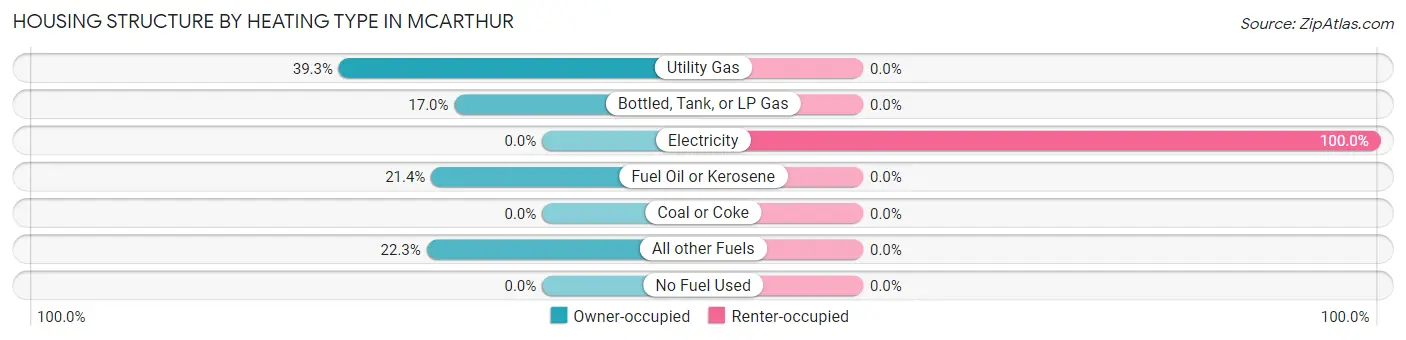
| Heating Type | Owner-occupied | Renter-occupied |
| Utility Gas | 44 (39.3%) | 0 (0.0%) |
| Bottled, Tank, or LP Gas | 19 (17.0%) | 0 (0.0%) |
| Electricity | 0 (0.0%) | 35 (100.0%) |
| Fuel Oil or Kerosene | 24 (21.4%) | 0 (0.0%) |
| Coal or Coke | 0 (0.0%) | 0 (0.0%) |
| All other Fuels | 25 (22.3%) | 0 (0.0%) |
| No Fuel Used | 0 (0.0%) | 0 (0.0%) |
| Total | 112 (100.0%) | 35 (100.0%) |
Household Vehicle Usage in Mcarthur
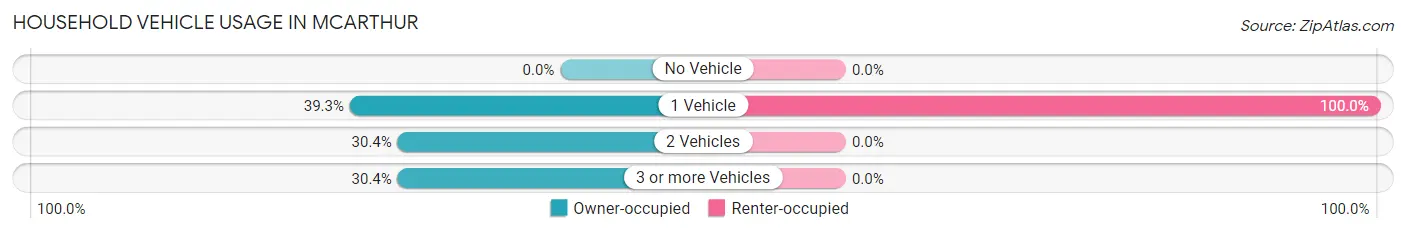
| Vehicles per Household | Owner-occupied | Renter-occupied |
| No Vehicle | 0 (0.0%) | 0 (0.0%) |
| 1 Vehicle | 44 (39.3%) | 35 (100.0%) |
| 2 Vehicles | 34 (30.4%) | 0 (0.0%) |
| 3 or more Vehicles | 34 (30.4%) | 0 (0.0%) |
| Total | 112 (100.0%) | 35 (100.0%) |
Real Estate & Mortgages in Mcarthur
Real Estate and Mortgage Overview in Mcarthur
| Characteristic | Without Mortgage | With Mortgage |
| Housing Units | 68 | 44 |
| Median Property Value | $157,700 | $0 |
| Median Household Income | - | - |
| Monthly Housing Costs | $438 | $0 |
| Real Estate Taxes | - | - |
Property Value by Mortgage Status in Mcarthur
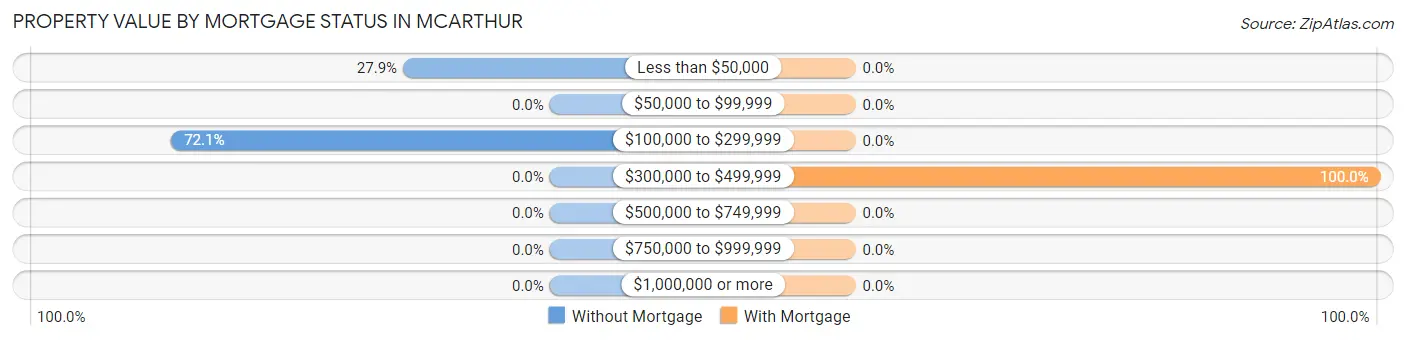
| Property Value | Without Mortgage | With Mortgage |
| Less than $50,000 | 19 (27.9%) | 0 (0.0%) |
| $50,000 to $99,999 | 0 (0.0%) | 0 (0.0%) |
| $100,000 to $299,999 | 49 (72.1%) | 0 (0.0%) |
| $300,000 to $499,999 | 0 (0.0%) | 44 (100.0%) |
| $500,000 to $749,999 | 0 (0.0%) | 0 (0.0%) |
| $750,000 to $999,999 | 0 (0.0%) | 0 (0.0%) |
| $1,000,000 or more | 0 (0.0%) | 0 (0.0%) |
| Total | 68 (100.0%) | 44 (100.0%) |
Household Income by Mortgage Status in Mcarthur
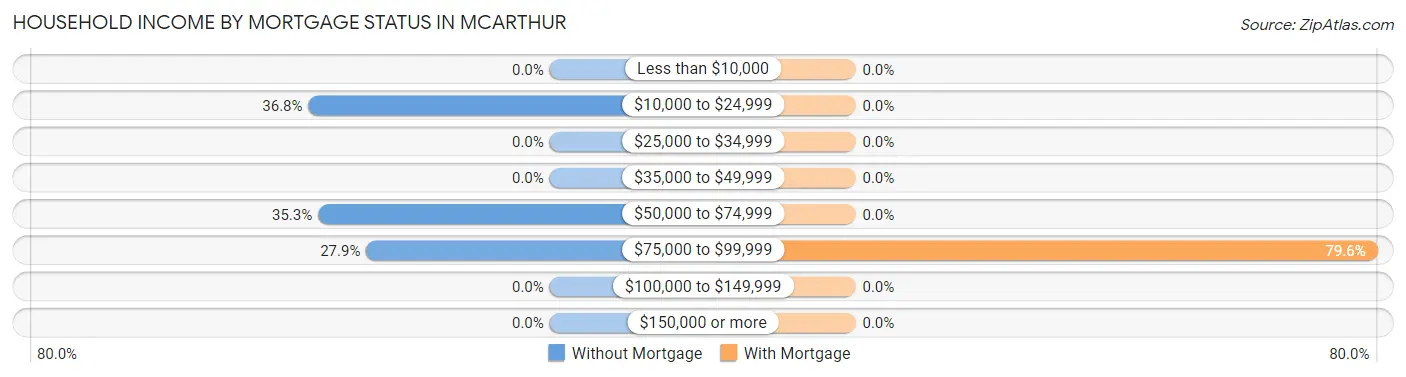
| Household Income | Without Mortgage | With Mortgage |
| Less than $10,000 | 0 (0.0%) | 0 (0.0%) |
| $10,000 to $24,999 | 25 (36.8%) | 0 (0.0%) |
| $25,000 to $34,999 | 0 (0.0%) | 0 (0.0%) |
| $35,000 to $49,999 | 0 (0.0%) | 0 (0.0%) |
| $50,000 to $74,999 | 24 (35.3%) | 0 (0.0%) |
| $75,000 to $99,999 | 19 (27.9%) | 35 (79.5%) |
| $100,000 to $149,999 | 0 (0.0%) | 0 (0.0%) |
| $150,000 or more | 0 (0.0%) | 0 (0.0%) |
| Total | 68 (100.0%) | 44 (100.0%) |
Property Value to Household Income Ratio in Mcarthur
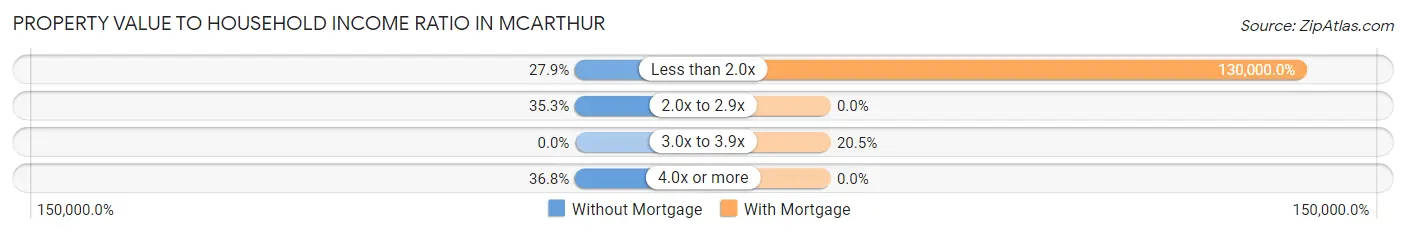
| Value-to-Income Ratio | Without Mortgage | With Mortgage |
| Less than 2.0x | 19 (27.9%) | 57,200 (130,000.0%) |
| 2.0x to 2.9x | 24 (35.3%) | 0 (0.0%) |
| 3.0x to 3.9x | 0 (0.0%) | 9 (20.4%) |
| 4.0x or more | 25 (36.8%) | 0 (0.0%) |
| Total | 68 (100.0%) | 44 (100.0%) |
Real Estate Taxes by Mortgage Status in Mcarthur
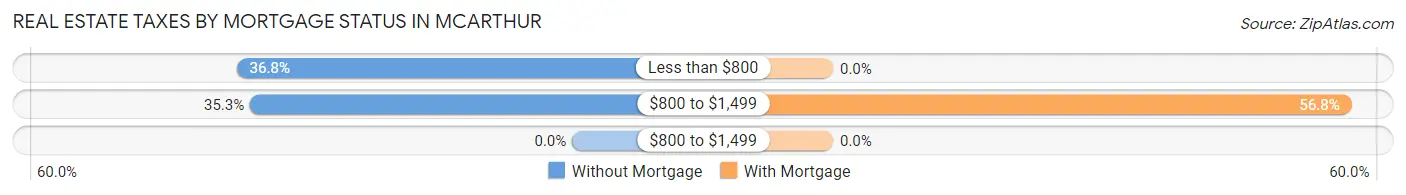
| Property Taxes | Without Mortgage | With Mortgage |
| Less than $800 | 25 (36.8%) | 0 (0.0%) |
| $800 to $1,499 | 24 (35.3%) | 25 (56.8%) |
| $800 to $1,499 | 0 (0.0%) | 0 (0.0%) |
| Total | 68 (100.0%) | 44 (100.0%) |
Health & Disability in Mcarthur
Health Insurance Coverage by Age in Mcarthur
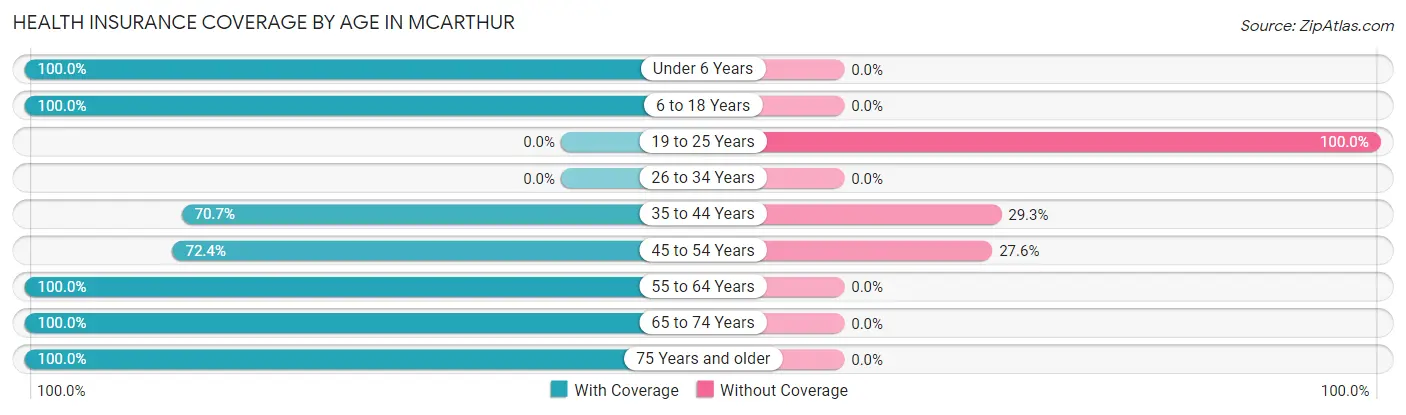
| Age Bracket | With Coverage | Without Coverage |
| Under 6 Years | 24 (100.0%) | 0 (0.0%) |
| 6 to 18 Years | 128 (100.0%) | 0 (0.0%) |
| 19 to 25 Years | 0 (0.0%) | 30 (100.0%) |
| 26 to 34 Years | 0 (0.0%) | 0 (0.0%) |
| 35 to 44 Years | 58 (70.7%) | 24 (29.3%) |
| 45 to 54 Years | 63 (72.4%) | 24 (27.6%) |
| 55 to 64 Years | 20 (100.0%) | 0 (0.0%) |
| 65 to 74 Years | 19 (100.0%) | 0 (0.0%) |
| 75 Years and older | 35 (100.0%) | 0 (0.0%) |
| Total | 347 (81.7%) | 78 (18.3%) |
Health Insurance Coverage by Citizenship Status in Mcarthur
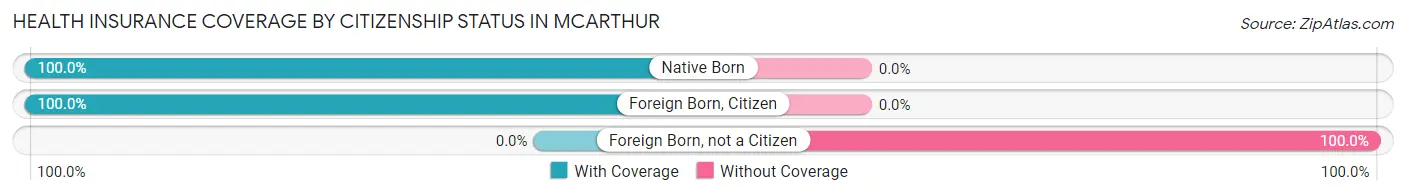
| Citizenship Status | With Coverage | Without Coverage |
| Native Born | 24 (100.0%) | 0 (0.0%) |
| Foreign Born, Citizen | 128 (100.0%) | 0 (0.0%) |
| Foreign Born, not a Citizen | 0 (0.0%) | 30 (100.0%) |
Health Insurance Coverage by Household Income in Mcarthur
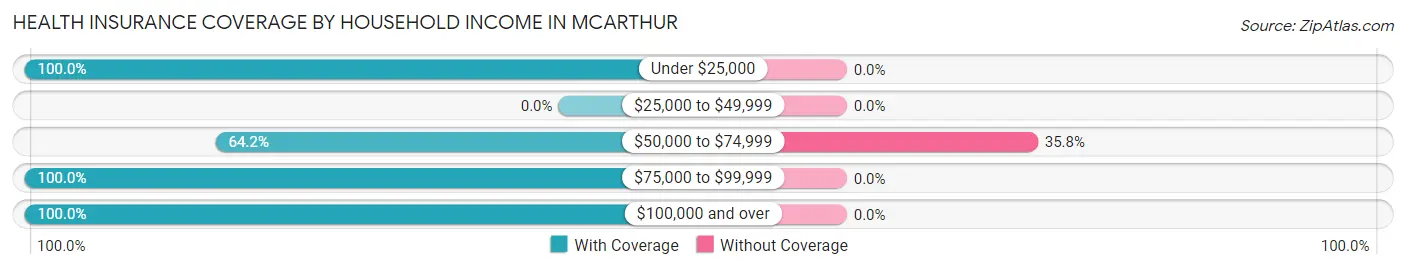
| Household Income | With Coverage | Without Coverage |
| Under $25,000 | 124 (100.0%) | 0 (0.0%) |
| $25,000 to $49,999 | 0 (0.0%) | 0 (0.0%) |
| $50,000 to $74,999 | 140 (64.2%) | 78 (35.8%) |
| $75,000 to $99,999 | 56 (100.0%) | 0 (0.0%) |
| $100,000 and over | 27 (100.0%) | 0 (0.0%) |
Public vs Private Health Insurance Coverage by Age in Mcarthur
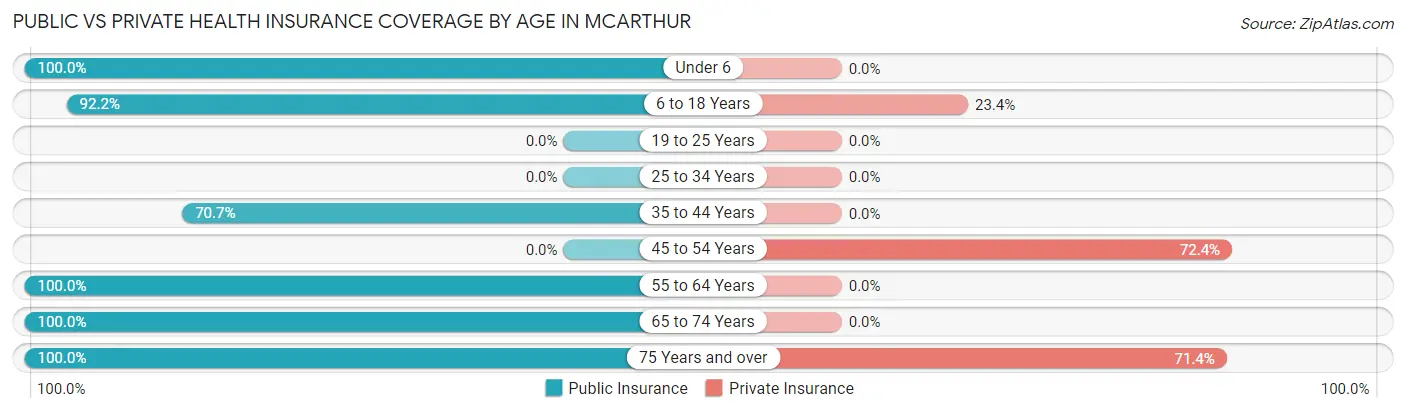
| Age Bracket | Public Insurance | Private Insurance |
| Under 6 | 24 (100.0%) | 0 (0.0%) |
| 6 to 18 Years | 118 (92.2%) | 30 (23.4%) |
| 19 to 25 Years | 0 (0.0%) | 0 (0.0%) |
| 25 to 34 Years | 0 (0.0%) | 0 (0.0%) |
| 35 to 44 Years | 58 (70.7%) | 0 (0.0%) |
| 45 to 54 Years | 0 (0.0%) | 63 (72.4%) |
| 55 to 64 Years | 20 (100.0%) | 0 (0.0%) |
| 65 to 74 Years | 19 (100.0%) | 0 (0.0%) |
| 75 Years and over | 35 (100.0%) | 25 (71.4%) |
| Total | 274 (64.5%) | 118 (27.8%) |
Disability Status by Sex by Age in Mcarthur
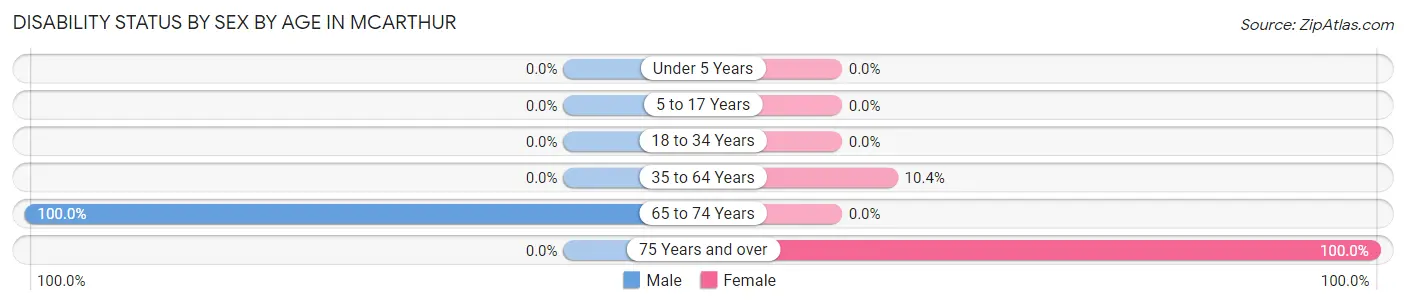
| Age Bracket | Male | Female |
| Under 5 Years | 0 (0.0%) | 0 (0.0%) |
| 5 to 17 Years | 0 (0.0%) | 0 (0.0%) |
| 18 to 34 Years | 0 (0.0%) | 0 (0.0%) |
| 35 to 64 Years | 0 (0.0%) | 14 (10.4%) |
| 65 to 74 Years | 19 (100.0%) | 0 (0.0%) |
| 75 Years and over | 0 (0.0%) | 25 (100.0%) |
Disability Class by Sex by Age in Mcarthur
Disability Class: Hearing Difficulty
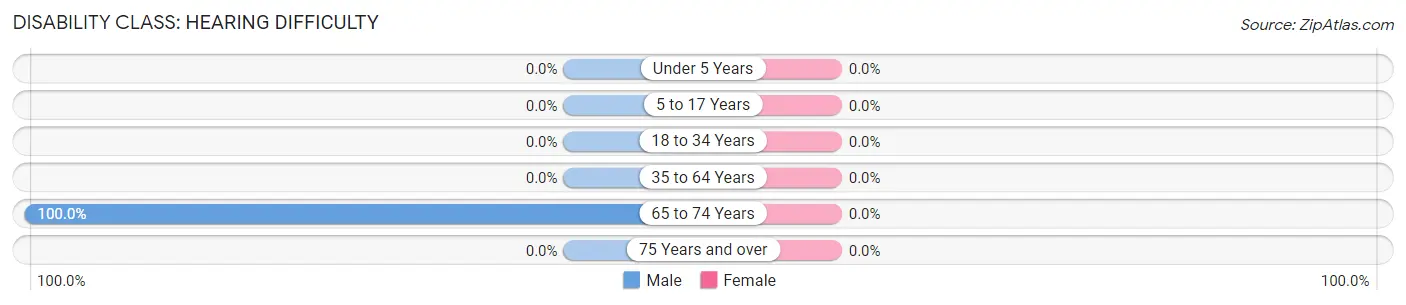
| Age Bracket | Male | Female |
| Under 5 Years | 0 (0.0%) | 0 (0.0%) |
| 5 to 17 Years | 0 (0.0%) | 0 (0.0%) |
| 18 to 34 Years | 0 (0.0%) | 0 (0.0%) |
| 35 to 64 Years | 0 (0.0%) | 0 (0.0%) |
| 65 to 74 Years | 19 (100.0%) | 0 (0.0%) |
| 75 Years and over | 0 (0.0%) | 0 (0.0%) |
Disability Class: Vision Difficulty
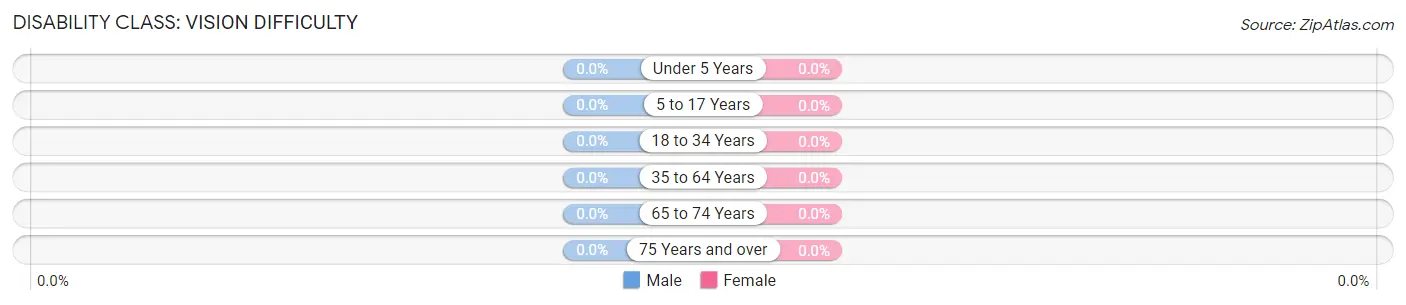
| Age Bracket | Male | Female |
| Under 5 Years | 0 (0.0%) | 0 (0.0%) |
| 5 to 17 Years | 0 (0.0%) | 0 (0.0%) |
| 18 to 34 Years | 0 (0.0%) | 0 (0.0%) |
| 35 to 64 Years | 0 (0.0%) | 0 (0.0%) |
| 65 to 74 Years | 0 (0.0%) | 0 (0.0%) |
| 75 Years and over | 0 (0.0%) | 0 (0.0%) |
Disability Class: Cognitive Difficulty
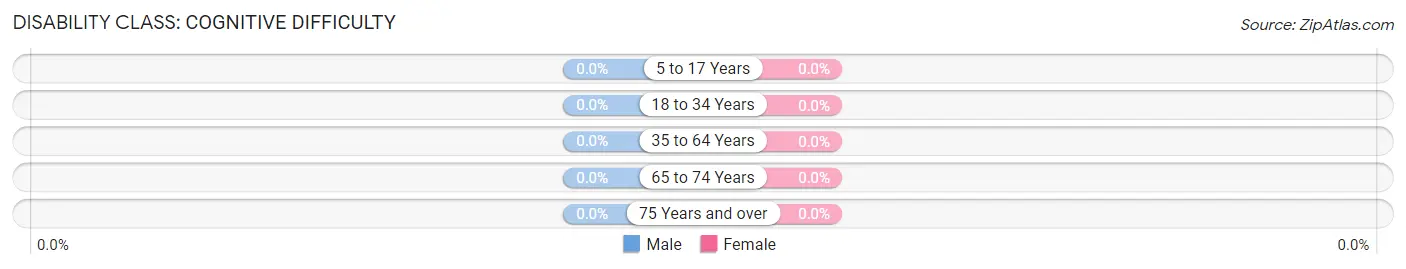
| Age Bracket | Male | Female |
| 5 to 17 Years | 0 (0.0%) | 0 (0.0%) |
| 18 to 34 Years | 0 (0.0%) | 0 (0.0%) |
| 35 to 64 Years | 0 (0.0%) | 0 (0.0%) |
| 65 to 74 Years | 0 (0.0%) | 0 (0.0%) |
| 75 Years and over | 0 (0.0%) | 0 (0.0%) |
Disability Class: Ambulatory Difficulty
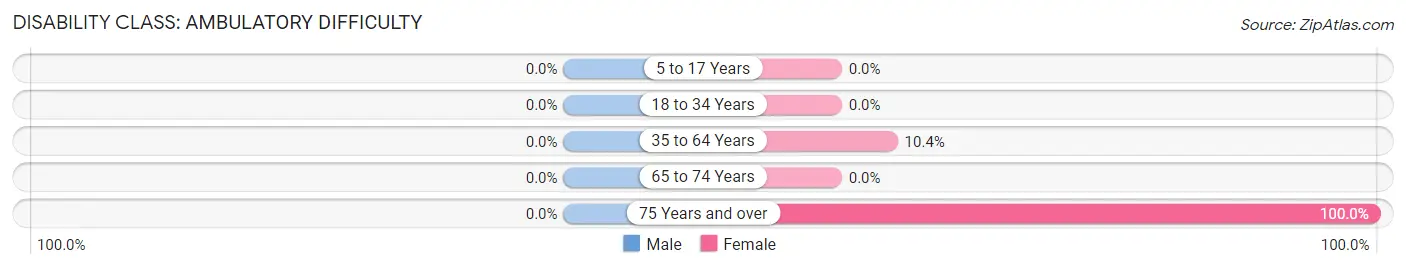
| Age Bracket | Male | Female |
| 5 to 17 Years | 0 (0.0%) | 0 (0.0%) |
| 18 to 34 Years | 0 (0.0%) | 0 (0.0%) |
| 35 to 64 Years | 0 (0.0%) | 14 (10.4%) |
| 65 to 74 Years | 0 (0.0%) | 0 (0.0%) |
| 75 Years and over | 0 (0.0%) | 25 (100.0%) |
Disability Class: Self-Care Difficulty
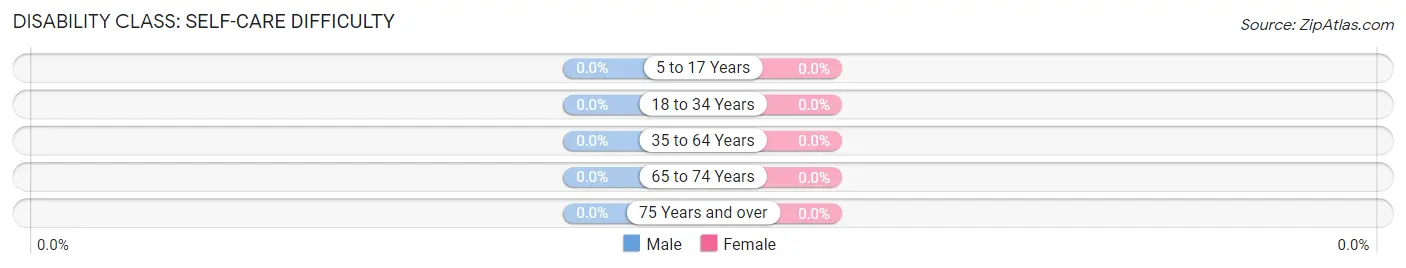
| Age Bracket | Male | Female |
| 5 to 17 Years | 0 (0.0%) | 0 (0.0%) |
| 18 to 34 Years | 0 (0.0%) | 0 (0.0%) |
| 35 to 64 Years | 0 (0.0%) | 0 (0.0%) |
| 65 to 74 Years | 0 (0.0%) | 0 (0.0%) |
| 75 Years and over | 0 (0.0%) | 0 (0.0%) |
Technology Access in Mcarthur
Computing Device Access in Mcarthur
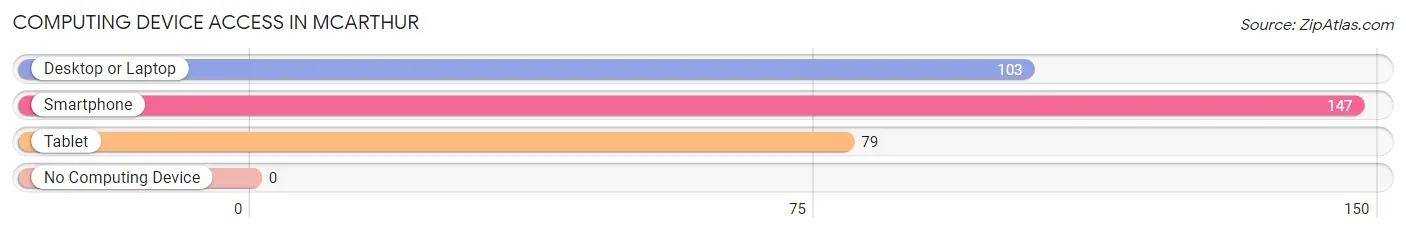
| Device Type | # Households | % Households |
| Desktop or Laptop | 103 | 70.1% |
| Smartphone | 147 | 100.0% |
| Tablet | 79 | 53.7% |
| No Computing Device | 0 | 0.0% |
| Total | 147 | 100.0% |
Internet Access in Mcarthur
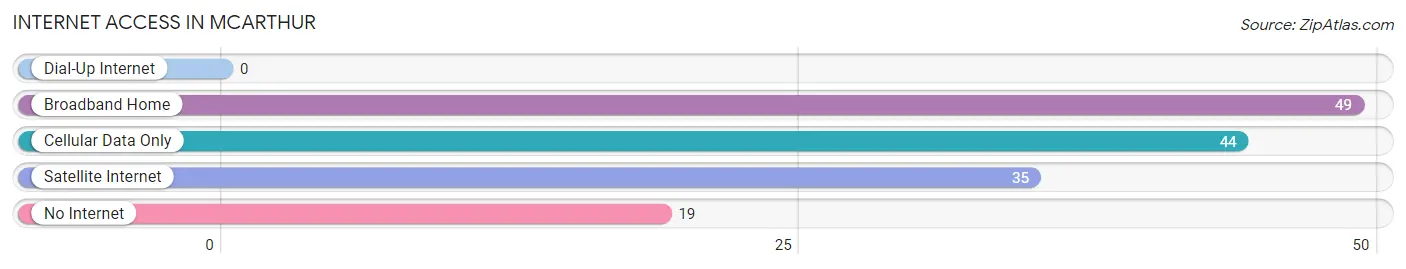
| Internet Type | # Households | % Households |
| Dial-Up Internet | 0 | 0.0% |
| Broadband Home | 49 | 33.3% |
| Cellular Data Only | 44 | 29.9% |
| Satellite Internet | 35 | 23.8% |
| No Internet | 19 | 12.9% |
| Total | 147 | 100.0% |
Mcarthur Summary
Mcarthur is a small town located in Shasta County, California, United States. The town is situated in the northern part of the state, near the Oregon border. The population of Mcarthur was 1,845 at the 2010 census.
History
Mcarthur was founded in 1856 by William McArthur, a Scottish immigrant who had come to California during the Gold Rush. He purchased a large tract of land in the area and began to develop it for farming and ranching. The town was named after him and was incorporated in 1872.
In the late 19th century, Mcarthur was a thriving agricultural community, with a large number of farms and ranches in the area. The town was also home to several sawmills and lumber mills, which provided employment for many of the town's residents.
Geography
Mcarthur is located at 40°41'25"N 122°17'45"W (40.690278, -122.295833). The town is situated in the northern part of the state, near the Oregon border. It is located in the Shasta Valley, which is surrounded by the Cascade Range to the east and the Coast Range to the west.
The town is situated at an elevation of 1,845 feet (562 m). The climate in Mcarthur is generally mild, with hot summers and cold winters. The average annual precipitation is 28.5 inches (724 mm).
Economy
Mcarthur's economy is largely based on agriculture and timber. The town is home to several farms and ranches, as well as several sawmills and lumber mills. The town is also home to a number of small businesses, including restaurants, stores, and service providers.
Demographics
As of the 2010 census, there were 1,845 people, 745 households, and 486 families residing in Mcarthur. The population density was 545.3 people per square mile (210.9/km2). The racial makeup of the town was 91.2% White, 0.2% African American, 0.7% Native American, 0.7% Asian, 0.1% Pacific Islander, 4.3% from other races, and 2.8% from two or more races. Hispanic or Latino of any race were 8.3% of the population.
The median income for a household in Mcarthur was $37,500, and the median income for a family was $45,000. Males had a median income of $35,000 versus $25,000 for females. The per capita income for the town was $17,845. About 11.2% of families and 14.2% of the population were below the poverty line, including 18.2% of those under age 18 and 8.3% of those age 65 or over.
Common Questions
What is Per Capita Income in Mcarthur?
Per Capita income in Mcarthur is $17,043.
What is the Median Family Income in Mcarthur?
Median Family Income in Mcarthur is $57,750.
What is Inequality or Gini Index in Mcarthur?
Inequality or Gini Index in Mcarthur is 0.46.
What is the Total Population of Mcarthur?
Total Population of Mcarthur is 425.
What is the Total Male Population of Mcarthur?
Total Male Population of Mcarthur is 171.
What is the Total Female Population of Mcarthur?
Total Female Population of Mcarthur is 254.
What is the Ratio of Males per 100 Females in Mcarthur?
There are 67.32 Males per 100 Females in Mcarthur.
What is the Ratio of Females per 100 Males in Mcarthur?
There are 148.54 Females per 100 Males in Mcarthur.
What is the Median Population Age in Mcarthur?
Median Population Age in Mcarthur is 41.2 Years.
What is the Average Family Size in Mcarthur
Average Family Size in Mcarthur is 3.3 People.
What is the Average Household Size in Mcarthur
Average Household Size in Mcarthur is 2.9 People.
How Large is the Labor Force in Mcarthur?
There are 169 People in the Labor Forcein in Mcarthur.
What is the Percentage of People in the Labor Force in Mcarthur?
60.8% of People are in the Labor Force in Mcarthur.
What is the Unemployment Rate in Mcarthur?
Unemployment Rate in Mcarthur is 11.2%.