East Palo Alto, CA Map & Demographics
East Palo Alto Map
East Palo Alto Overview
$37,736
PER CAPITA INCOME
$101,526
AVG FAMILY INCOME
$103,248
AVG HOUSEHOLD INCOME
20.2%
WAGE / INCOME GAP [ % ]
79.8¢/ $1
WAGE / INCOME GAP [ $ ]
0.44
INEQUALITY / GINI INDEX
29,520
TOTAL POPULATION
14,439
MALE POPULATION
15,081
FEMALE POPULATION
95.74
MALES / 100 FEMALES
104.45
FEMALES / 100 MALES
34.3
MEDIAN AGE
4.1
AVG FAMILY SIZE
3.7
AVG HOUSEHOLD SIZE
16,450
LABOR FORCE [ PEOPLE ]
68.6%
PERCENT IN LABOR FORCE
5.0%
UNEMPLOYMENT RATE
East Palo Alto Area Codes
Income in East Palo Alto
Income Overview in East Palo Alto
Per Capita Income in East Palo Alto is $37,736, while median incomes of families and households are $101,526 and $103,248 respectively.
| Characteristic | Number | Measure |
| Per Capita Income | 29,520 | $37,736 |
| Median Family Income | 6,075 | $101,526 |
| Mean Family Income | 6,075 | $133,361 |
| Median Household Income | 7,998 | $103,248 |
| Mean Household Income | 7,998 | $136,345 |
| Income Deficit | 6,075 | $0 |
| Wage / Income Gap (%) | 29,520 | 20.18% |
| Wage / Income Gap ($) | 29,520 | 79.82¢ per $1 |
| Gini / Inequality Index | 29,520 | 0.44 |
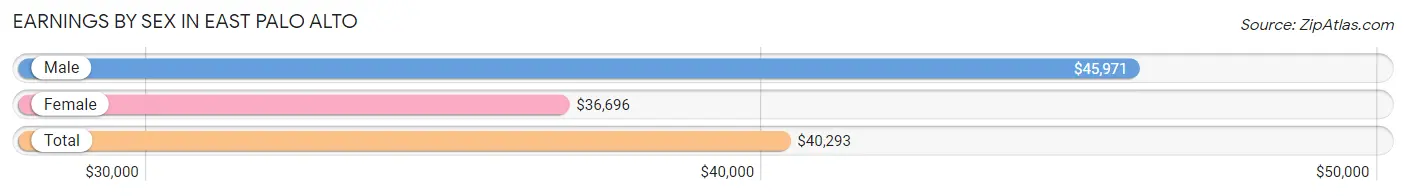
Earnings by Sex in East Palo Alto
Average Earnings in East Palo Alto are $40,293, $45,971 for men and $36,696 for women, a difference of 20.2%.
| Sex | Number | Average Earnings |
| Male | 8,905 (53.9%) | $45,971 |
| Female | 7,604 (46.1%) | $36,696 |
| Total | 16,509 (100.0%) | $40,293 |
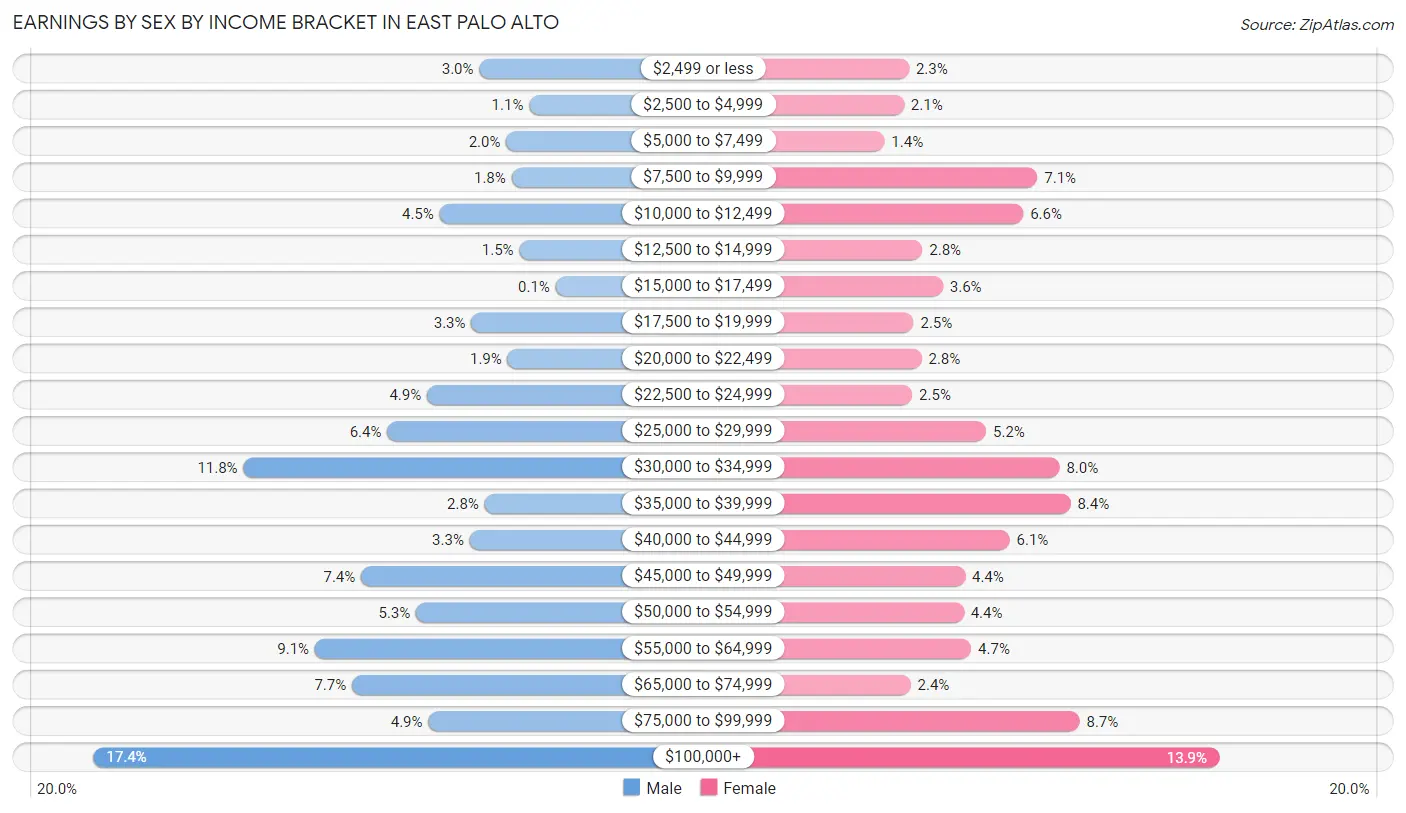
Earnings by Sex by Income Bracket in East Palo Alto
The most common earnings brackets in East Palo Alto are $100,000+ for men (1,551 | 17.4%) and $100,000+ for women (1,060 | 13.9%).
| Income | Male | Female |
| $2,499 or less | 264 (3.0%) | 177 (2.3%) |
| $2,500 to $4,999 | 97 (1.1%) | 163 (2.1%) |
| $5,000 to $7,499 | 174 (1.9%) | 107 (1.4%) |
| $7,500 to $9,999 | 156 (1.8%) | 543 (7.1%) |
| $10,000 to $12,499 | 396 (4.4%) | 503 (6.6%) |
| $12,500 to $14,999 | 130 (1.5%) | 215 (2.8%) |
| $15,000 to $17,499 | 9 (0.1%) | 274 (3.6%) |
| $17,500 to $19,999 | 290 (3.3%) | 190 (2.5%) |
| $20,000 to $22,499 | 169 (1.9%) | 213 (2.8%) |
| $22,500 to $24,999 | 438 (4.9%) | 186 (2.5%) |
| $25,000 to $29,999 | 571 (6.4%) | 397 (5.2%) |
| $30,000 to $34,999 | 1,051 (11.8%) | 606 (8.0%) |
| $35,000 to $39,999 | 246 (2.8%) | 637 (8.4%) |
| $40,000 to $44,999 | 296 (3.3%) | 464 (6.1%) |
| $45,000 to $49,999 | 658 (7.4%) | 337 (4.4%) |
| $50,000 to $54,999 | 475 (5.3%) | 333 (4.4%) |
| $55,000 to $64,999 | 812 (9.1%) | 354 (4.7%) |
| $65,000 to $74,999 | 688 (7.7%) | 182 (2.4%) |
| $75,000 to $99,999 | 434 (4.9%) | 663 (8.7%) |
| $100,000+ | 1,551 (17.4%) | 1,060 (13.9%) |
| Total | 8,905 (100.0%) | 7,604 (100.0%) |
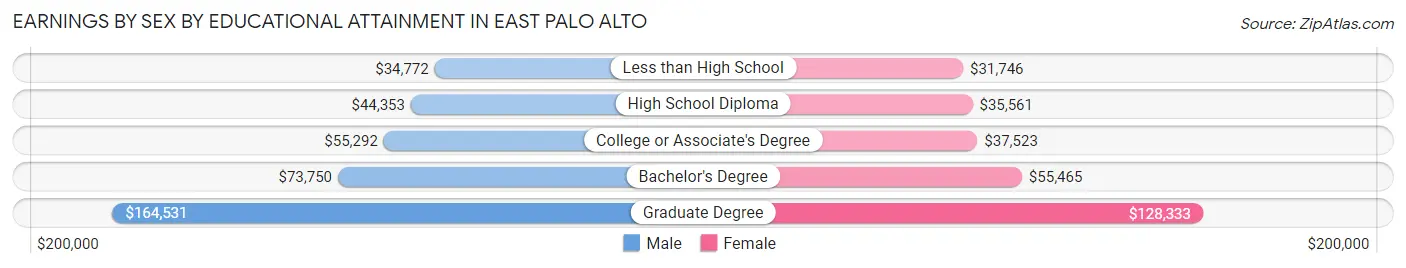
Earnings by Sex by Educational Attainment in East Palo Alto
Average earnings in East Palo Alto are $49,300 for men and $39,651 for women, a difference of 19.6%. Men with an educational attainment of graduate degree enjoy the highest average annual earnings of $164,531, while those with less than high school education earn the least with $34,772. Women with an educational attainment of graduate degree earn the most with the average annual earnings of $128,333, while those with less than high school education have the smallest earnings of $31,746.
| Educational Attainment | Male Income | Female Income |
| Less than High School | $34,772 | $31,746 |
| High School Diploma | $44,353 | $35,561 |
| College or Associate's Degree | $55,292 | $37,523 |
| Bachelor's Degree | $73,750 | $55,465 |
| Graduate Degree | $164,531 | $128,333 |
| Total | $49,300 | $39,651 |
Family Income in East Palo Alto
Family Income Brackets in East Palo Alto
According to the East Palo Alto family income data, there are 1,385 families falling into the $200,000+ income range, which is the most common income bracket and makes up 22.8% of all families. Conversely, the $10,000 to $14,999 income bracket is the least frequent group with only 24 families (0.4%) belonging to this category.
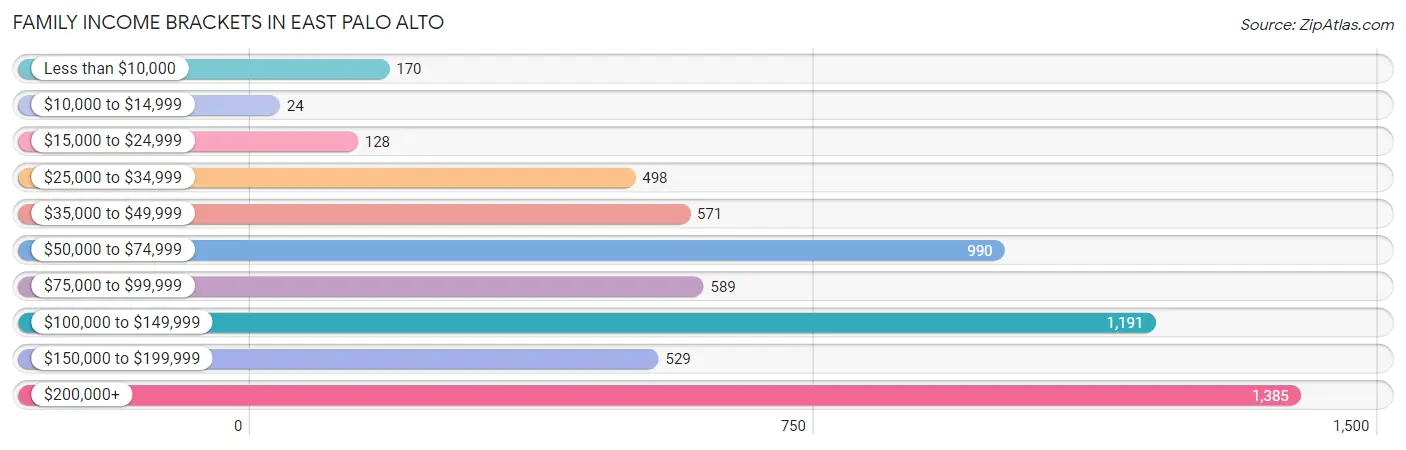
| Income Bracket | # Families | % Families |
| Less than $10,000 | 170 | 2.8% |
| $10,000 to $14,999 | 24 | 0.4% |
| $15,000 to $24,999 | 128 | 2.1% |
| $25,000 to $34,999 | 498 | 8.2% |
| $35,000 to $49,999 | 571 | 9.4% |
| $50,000 to $74,999 | 990 | 16.3% |
| $75,000 to $99,999 | 589 | 9.7% |
| $100,000 to $149,999 | 1,191 | 19.6% |
| $150,000 to $199,999 | 529 | 8.7% |
| $200,000+ | 1,385 | 22.8% |
Family Income by Famaliy Size in East Palo Alto
7+ person families (422 | 7.0%) account for the highest median family income in East Palo Alto with $176,528 per family, while 3-person families (1,426 | 23.5%) have the highest median income of $36,887 per family member.
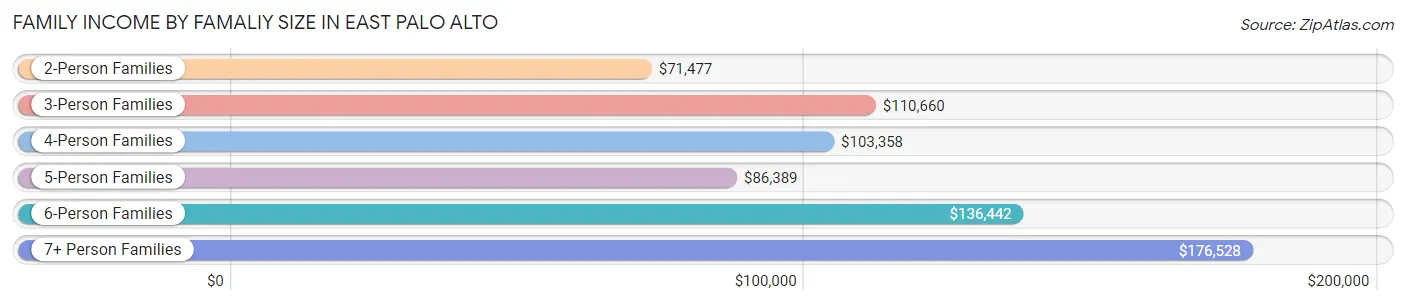
| Income Bracket | # Families | Median Income |
| 2-Person Families | 1,706 (28.1%) | $71,477 |
| 3-Person Families | 1,426 (23.5%) | $110,660 |
| 4-Person Families | 1,421 (23.4%) | $103,358 |
| 5-Person Families | 582 (9.6%) | $86,389 |
| 6-Person Families | 518 (8.5%) | $136,442 |
| 7+ Person Families | 422 (7.0%) | $176,528 |
| Total | 6,075 (100.0%) | $101,526 |
Family Income by Number of Earners in East Palo Alto
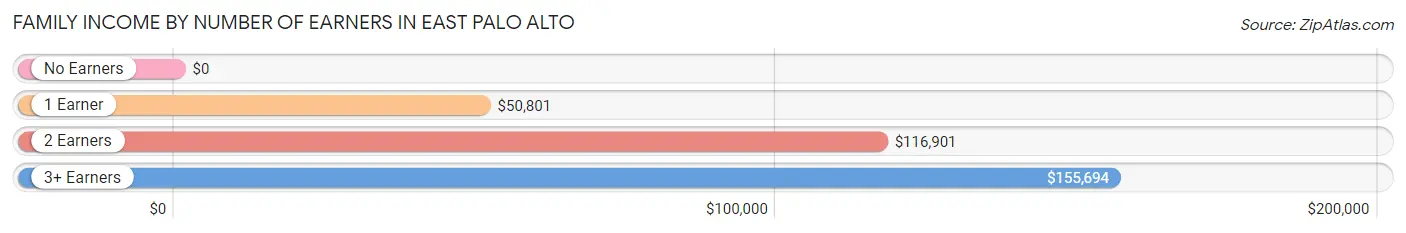
| Number of Earners | # Families | Median Income |
| No Earners | 254 (4.2%) | $0 |
| 1 Earner | 2,007 (33.0%) | $50,801 |
| 2 Earners | 1,993 (32.8%) | $116,901 |
| 3+ Earners | 1,821 (30.0%) | $155,694 |
| Total | 6,075 (100.0%) | $101,526 |
Household Income in East Palo Alto
Household Income Brackets in East Palo Alto
With 1,872 households falling in the category, the $200,000+ income range is the most frequent in East Palo Alto, accounting for 23.4% of all households. In contrast, only 144 households (1.8%) fall into the $10,000 to $14,999 income bracket, making it the least populous group.
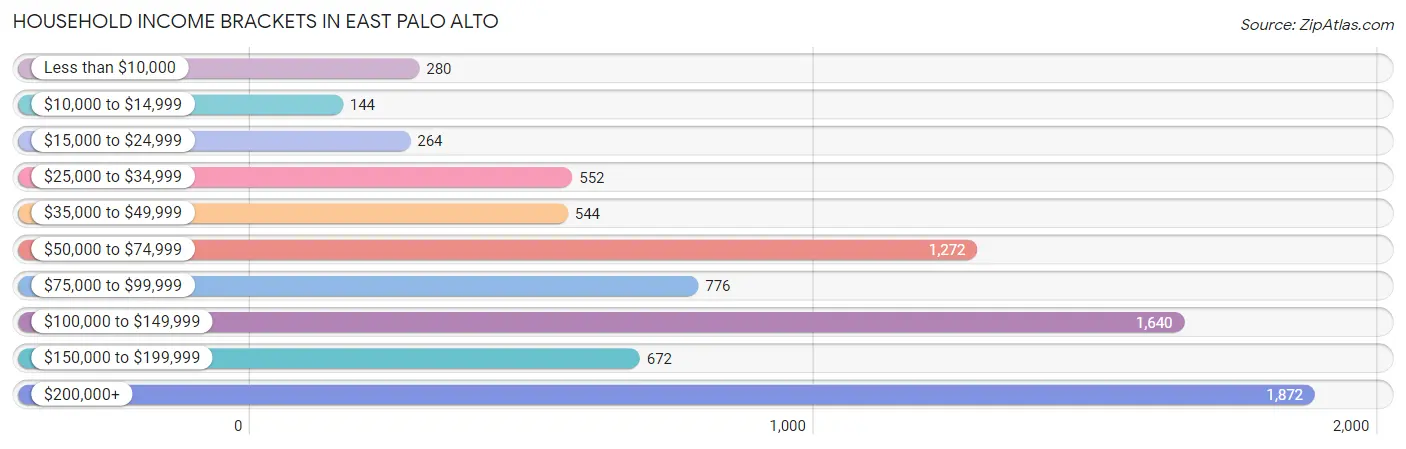
| Income Bracket | # Households | % Households |
| Less than $10,000 | 280 | 3.5% |
| $10,000 to $14,999 | 144 | 1.8% |
| $15,000 to $24,999 | 264 | 3.3% |
| $25,000 to $34,999 | 552 | 6.9% |
| $35,000 to $49,999 | 544 | 6.8% |
| $50,000 to $74,999 | 1,272 | 15.9% |
| $75,000 to $99,999 | 776 | 9.7% |
| $100,000 to $149,999 | 1,640 | 20.5% |
| $150,000 to $199,999 | 672 | 8.4% |
| $200,000+ | 1,872 | 23.4% |
Household Income by Householder Age in East Palo Alto
The median household income in East Palo Alto is $103,248, with the highest median household income of $115,254 found in the 45 to 64 years age bracket for the primary householder. A total of 3,516 households (44.0%) fall into this category. Meanwhile, the 15 to 24 years age bracket for the primary householder has the lowest median household income of $0, with 166 households (2.1%) in this group.
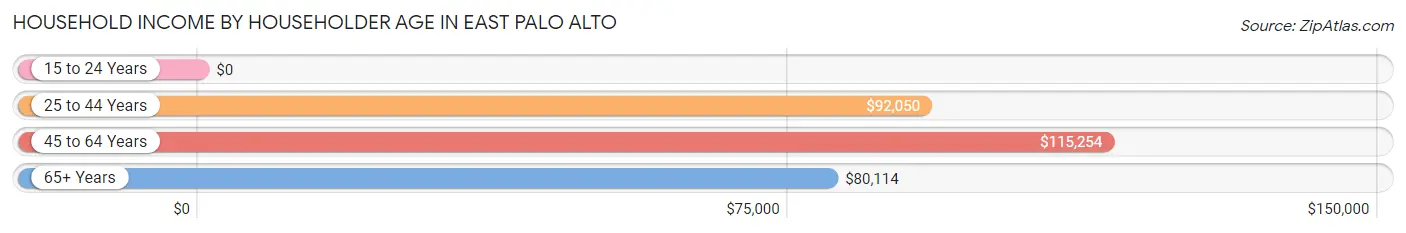
| Income Bracket | # Households | Median Income |
| 15 to 24 Years | 166 (2.1%) | $0 |
| 25 to 44 Years | 2,929 (36.6%) | $92,050 |
| 45 to 64 Years | 3,516 (44.0%) | $115,254 |
| 65+ Years | 1,387 (17.3%) | $80,114 |
| Total | 7,998 (100.0%) | $103,248 |
Poverty in East Palo Alto
Income Below Poverty by Sex and Age in East Palo Alto
With 10.9% poverty level for males and 13.4% for females among the residents of East Palo Alto, 75 year old and over males and 5 year old females are the most vulnerable to poverty, with 142 males (31.1%) and 157 females (58.8%) in their respective age groups living below the poverty level.
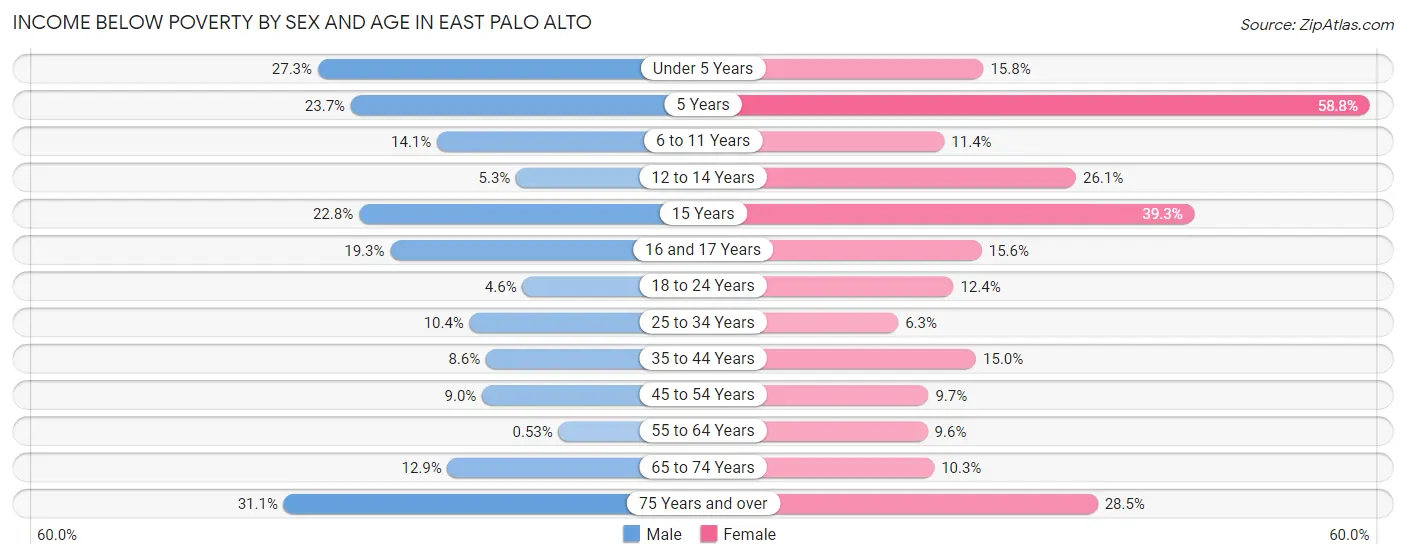
| Age Bracket | Male | Female |
| Under 5 Years | 225 (27.3%) | 140 (15.8%) |
| 5 Years | 106 (23.7%) | 157 (58.8%) |
| 6 to 11 Years | 114 (14.1%) | 113 (11.4%) |
| 12 to 14 Years | 29 (5.2%) | 143 (26.1%) |
| 15 Years | 33 (22.8%) | 22 (39.3%) |
| 16 and 17 Years | 121 (19.3%) | 94 (15.6%) |
| 18 to 24 Years | 64 (4.5%) | 201 (12.4%) |
| 25 to 34 Years | 279 (10.4%) | 160 (6.3%) |
| 35 to 44 Years | 194 (8.6%) | 315 (15.0%) |
| 45 to 54 Years | 168 (9.0%) | 177 (9.7%) |
| 55 to 64 Years | 9 (0.5%) | 183 (9.6%) |
| 65 to 74 Years | 85 (12.9%) | 93 (10.3%) |
| 75 Years and over | 142 (31.1%) | 228 (28.5%) |
| Total | 1,569 (10.9%) | 2,026 (13.4%) |
Income Above Poverty by Sex and Age in East Palo Alto
According to the poverty statistics in East Palo Alto, males aged 55 to 64 years and females aged 25 to 34 years are the age groups that are most secure financially, with 99.5% of males and 93.7% of females in these age groups living above the poverty line.
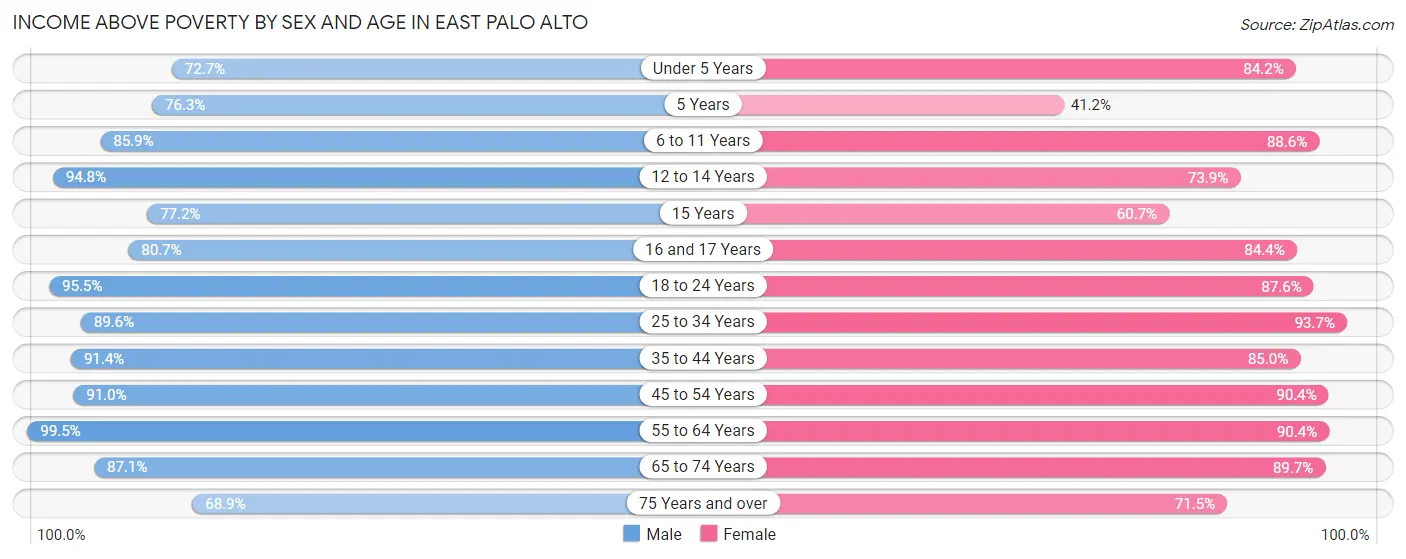
| Age Bracket | Male | Female |
| Under 5 Years | 598 (72.7%) | 747 (84.2%) |
| 5 Years | 342 (76.3%) | 110 (41.2%) |
| 6 to 11 Years | 697 (85.9%) | 876 (88.6%) |
| 12 to 14 Years | 523 (94.8%) | 405 (73.9%) |
| 15 Years | 112 (77.2%) | 34 (60.7%) |
| 16 and 17 Years | 507 (80.7%) | 509 (84.4%) |
| 18 to 24 Years | 1,343 (95.5%) | 1,415 (87.6%) |
| 25 to 34 Years | 2,397 (89.6%) | 2,389 (93.7%) |
| 35 to 44 Years | 2,060 (91.4%) | 1,791 (85.0%) |
| 45 to 54 Years | 1,690 (91.0%) | 1,658 (90.3%) |
| 55 to 64 Years | 1,703 (99.5%) | 1,731 (90.4%) |
| 65 to 74 Years | 574 (87.1%) | 811 (89.7%) |
| 75 Years and over | 314 (68.9%) | 572 (71.5%) |
| Total | 12,860 (89.1%) | 13,048 (86.6%) |
Income Below Poverty Among Married-Couple Families in East Palo Alto
The poverty statistics for married-couple families in East Palo Alto show that 6.4% or 262 of the total 4,072 families live below the poverty line. Families with 3 or 4 children have the highest poverty rate of 24.7%, comprising of 135 families. On the other hand, families with 5 or more children have the lowest poverty rate of 0.0%, which includes 0 families.
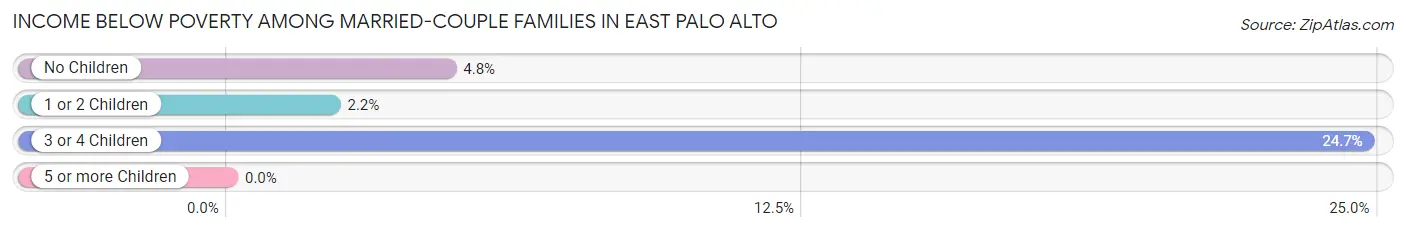
| Children | Above Poverty | Below Poverty |
| No Children | 1,885 (95.3%) | 94 (4.8%) |
| 1 or 2 Children | 1,445 (97.8%) | 33 (2.2%) |
| 3 or 4 Children | 411 (75.3%) | 135 (24.7%) |
| 5 or more Children | 69 (100.0%) | 0 (0.0%) |
| Total | 3,810 (93.6%) | 262 (6.4%) |
Income Below Poverty Among Single-Parent Households in East Palo Alto
According to the poverty data in East Palo Alto, 7.6% or 41 single-father households and 16.0% or 235 single-mother households are living below the poverty line. Among single-father households, those with no children have the highest poverty rate, with 41 households (15.4%) experiencing poverty. Likewise, among single-mother households, those with 5 or more children have the highest poverty rate, with 32 households (100.0%) falling below the poverty line.
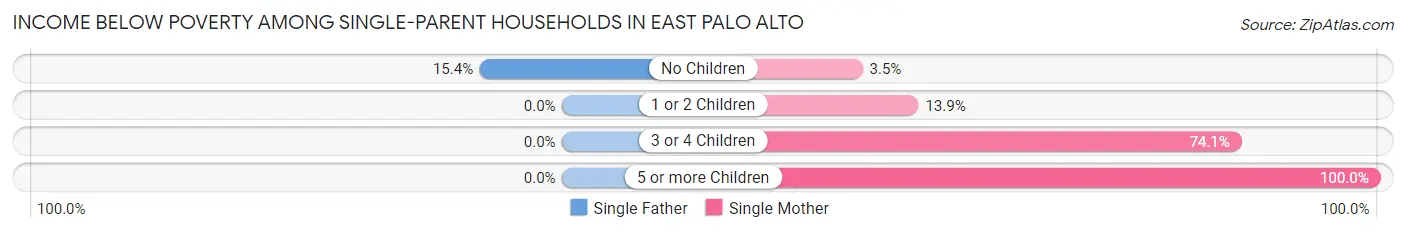
| Children | Single Father | Single Mother |
| No Children | 41 (15.4%) | 28 (3.5%) |
| 1 or 2 Children | 0 (0.0%) | 69 (13.9%) |
| 3 or 4 Children | 0 (0.0%) | 106 (74.1%) |
| 5 or more Children | 0 (0.0%) | 32 (100.0%) |
| Total | 41 (7.6%) | 235 (16.0%) |
Income Below Poverty Among Married-Couple vs Single-Parent Households in East Palo Alto
The poverty data for East Palo Alto shows that 262 of the married-couple family households (6.4%) and 276 of the single-parent households (13.8%) are living below the poverty level. Within the married-couple family households, those with 3 or 4 children have the highest poverty rate, with 135 households (24.7%) falling below the poverty line. Among the single-parent households, those with 5 or more children have the highest poverty rate, with 32 household (100.0%) living below poverty.
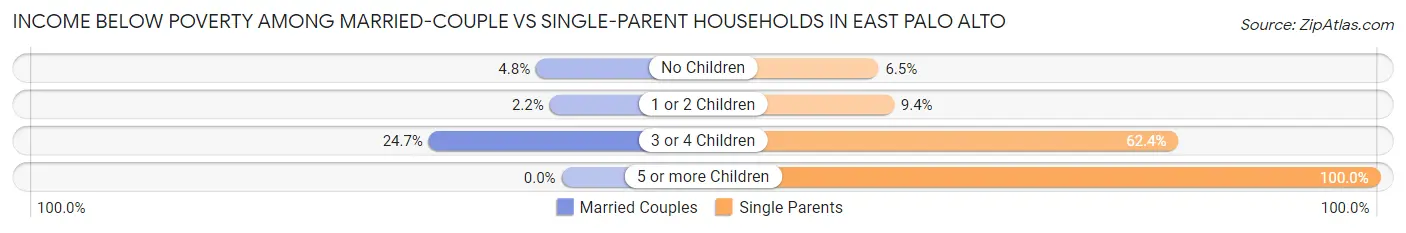
| Children | Married-Couple Families | Single-Parent Households |
| No Children | 94 (4.8%) | 69 (6.5%) |
| 1 or 2 Children | 33 (2.2%) | 69 (9.3%) |
| 3 or 4 Children | 135 (24.7%) | 106 (62.4%) |
| 5 or more Children | 0 (0.0%) | 32 (100.0%) |
| Total | 262 (6.4%) | 276 (13.8%) |
Race in East Palo Alto
The most populous races in East Palo Alto are Hispanic or Latino (18,005 | 61.0%), White / Caucasian (9,120 | 30.9%), and Some other Race (8,824 | 29.9%).
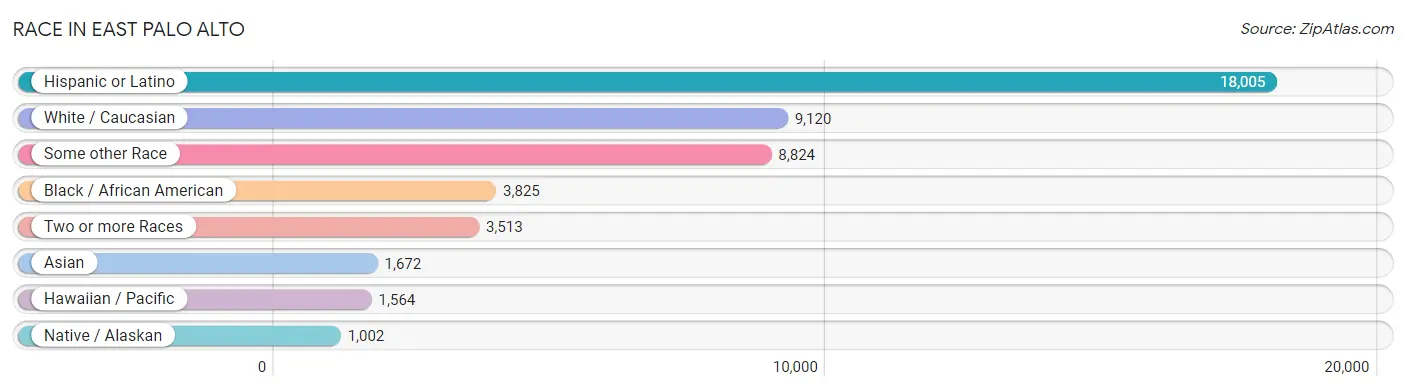
| Race | # Population | % Population |
| Asian | 1,672 | 5.7% |
| Black / African American | 3,825 | 13.0% |
| Hawaiian / Pacific | 1,564 | 5.3% |
| Hispanic or Latino | 18,005 | 61.0% |
| Native / Alaskan | 1,002 | 3.4% |
| White / Caucasian | 9,120 | 30.9% |
| Two or more Races | 3,513 | 11.9% |
| Some other Race | 8,824 | 29.9% |
| Total | 29,520 | 100.0% |
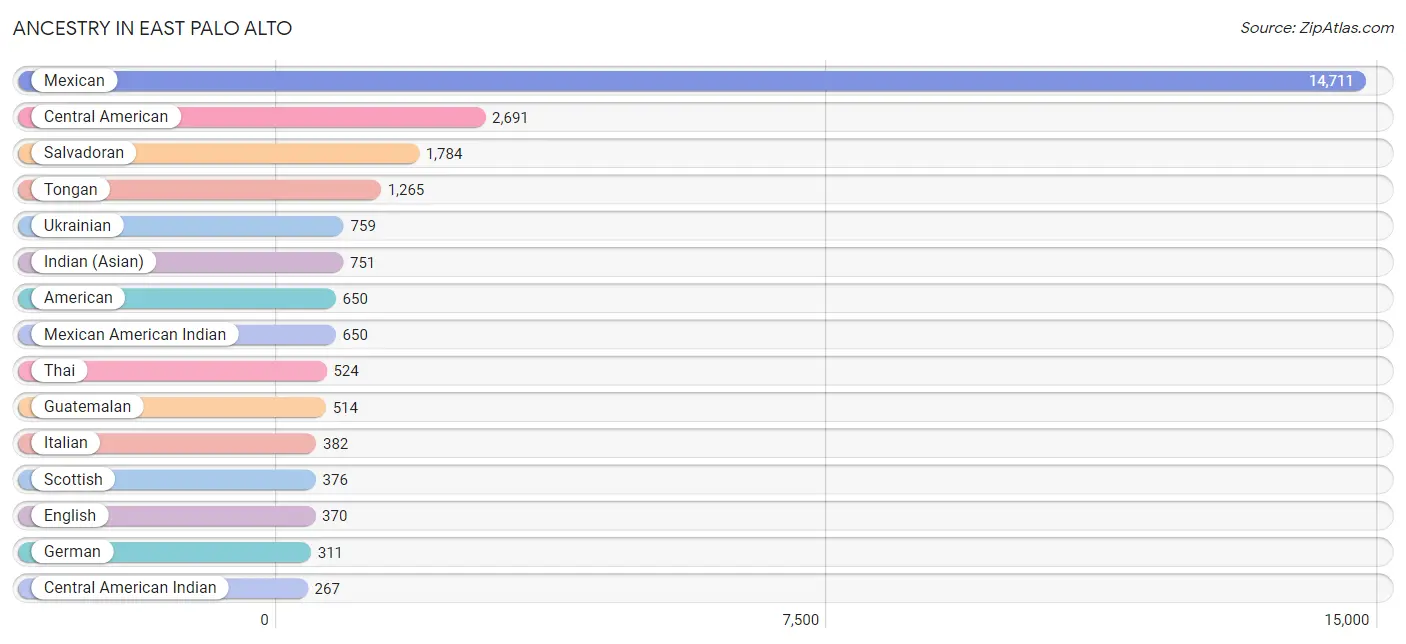
Ancestry in East Palo Alto
The most populous ancestries reported in East Palo Alto are Mexican (14,711 | 49.8%), Central American (2,691 | 9.1%), Salvadoran (1,784 | 6.0%), Tongan (1,265 | 4.3%), and Ukrainian (759 | 2.6%), together accounting for 71.9% of all East Palo Alto residents.
| Ancestry | # Population | % Population |
| African | 115 | 0.4% |
| American | 650 | 2.2% |
| Apache | 9 | 0.0% |
| Arab | 61 | 0.2% |
| Argentinean | 23 | 0.1% |
| Australian | 25 | 0.1% |
| Austrian | 20 | 0.1% |
| Basque | 11 | 0.0% |
| Belgian | 11 | 0.0% |
| Bhutanese | 41 | 0.1% |
| British | 42 | 0.1% |
| Bulgarian | 10 | 0.0% |
| Burmese | 111 | 0.4% |
| Canadian | 51 | 0.2% |
| Central American | 2,691 | 9.1% |
| Central American Indian | 267 | 0.9% |
| Cherokee | 20 | 0.1% |
| Chilean | 60 | 0.2% |
| Chippewa | 137 | 0.5% |
| Choctaw | 14 | 0.1% |
| Colombian | 134 | 0.4% |
| Croatian | 10 | 0.0% |
| Cuban | 105 | 0.4% |
| Czech | 21 | 0.1% |
| Danish | 3 | 0.0% |
| Delaware | 2 | 0.0% |
| Dominican | 31 | 0.1% |
| Dutch | 32 | 0.1% |
| Eastern European | 15 | 0.1% |
| Ecuadorian | 6 | 0.0% |
| English | 370 | 1.3% |
| European | 239 | 0.8% |
| Finnish | 211 | 0.7% |
| French | 115 | 0.4% |
| German | 311 | 1.1% |
| Greek | 46 | 0.2% |
| Guatemalan | 514 | 1.7% |
| Honduran | 48 | 0.2% |
| Hungarian | 6 | 0.0% |
| Indian (Asian) | 751 | 2.5% |
| Iranian | 86 | 0.3% |
| Irish | 245 | 0.8% |
| Iroquois | 12 | 0.0% |
| Israeli | 2 | 0.0% |
| Italian | 382 | 1.3% |
| Kenyan | 17 | 0.1% |
| Korean | 115 | 0.4% |
| Lithuanian | 88 | 0.3% |
| Mexican | 14,711 | 49.8% |
| Mexican American Indian | 650 | 2.2% |
| Native Hawaiian | 2 | 0.0% |
| Nicaraguan | 224 | 0.8% |
| Northern European | 13 | 0.0% |
| Norwegian | 44 | 0.2% |
| Pakistani | 44 | 0.2% |
| Polish | 64 | 0.2% |
| Portuguese | 204 | 0.7% |
| Puerto Rican | 46 | 0.2% |
| Romanian | 161 | 0.5% |
| Russian | 166 | 0.6% |
| Salvadoran | 1,784 | 6.0% |
| Samoan | 46 | 0.2% |
| Scandinavian | 6 | 0.0% |
| Scotch-Irish | 54 | 0.2% |
| Scottish | 376 | 1.3% |
| Serbian | 14 | 0.1% |
| South American | 256 | 0.9% |
| Spaniard | 22 | 0.1% |
| Sri Lankan | 201 | 0.7% |
| Subsaharan African | 189 | 0.6% |
| Swedish | 48 | 0.2% |
| Swiss | 28 | 0.1% |
| Thai | 524 | 1.8% |
| Tongan | 1,265 | 4.3% |
| Ukrainian | 759 | 2.6% |
| Venezuelan | 33 | 0.1% | View All 76 Rows |
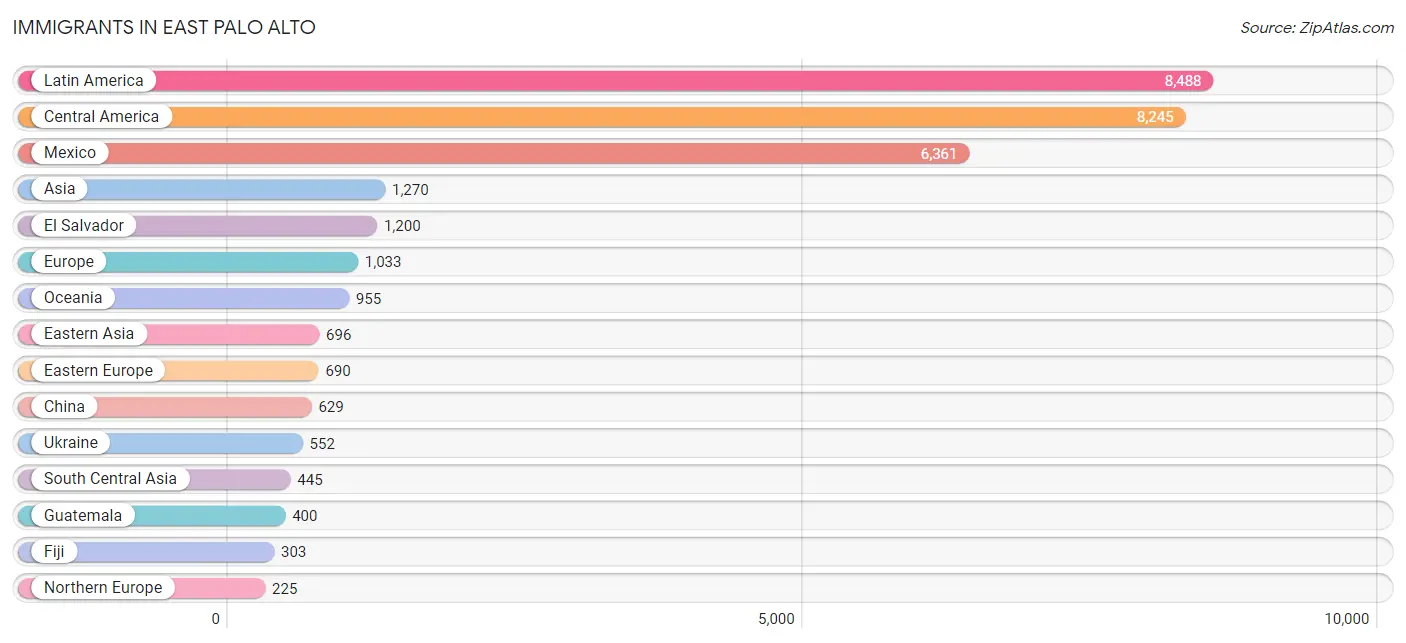
Immigrants in East Palo Alto
The most numerous immigrant groups reported in East Palo Alto came from Latin America (8,488 | 28.7%), Central America (8,245 | 27.9%), Mexico (6,361 | 21.5%), Asia (1,270 | 4.3%), and El Salvador (1,200 | 4.1%), together accounting for 86.6% of all East Palo Alto residents.
| Immigration Origin | # Population | % Population |
| Africa | 90 | 0.3% |
| Asia | 1,270 | 4.3% |
| Australia | 25 | 0.1% |
| Belgium | 11 | 0.0% |
| Brazil | 109 | 0.4% |
| Canada | 135 | 0.5% |
| Caribbean | 124 | 0.4% |
| Central America | 8,245 | 27.9% |
| Chile | 10 | 0.0% |
| China | 629 | 2.1% |
| Costa Rica | 120 | 0.4% |
| Cuba | 22 | 0.1% |
| Dominican Republic | 94 | 0.3% |
| Eastern Africa | 17 | 0.1% |
| Eastern Asia | 696 | 2.4% |
| Eastern Europe | 690 | 2.3% |
| El Salvador | 1,200 | 4.1% |
| England | 176 | 0.6% |
| Europe | 1,033 | 3.5% |
| Fiji | 303 | 1.0% |
| France | 5 | 0.0% |
| Germany | 16 | 0.1% |
| Guatemala | 400 | 1.4% |
| Honduras | 48 | 0.2% |
| Hong Kong | 86 | 0.3% |
| India | 222 | 0.7% |
| Iran | 19 | 0.1% |
| Ireland | 11 | 0.0% |
| Israel | 2 | 0.0% |
| Italy | 65 | 0.2% |
| Kazakhstan | 204 | 0.7% |
| Kenya | 17 | 0.1% |
| Korea | 67 | 0.2% |
| Latin America | 8,488 | 28.7% |
| Mexico | 6,361 | 21.5% |
| Morocco | 24 | 0.1% |
| Nicaragua | 116 | 0.4% |
| Northern Africa | 32 | 0.1% |
| Northern Europe | 225 | 0.8% |
| Oceania | 955 | 3.2% |
| Philippines | 48 | 0.2% |
| Russia | 6 | 0.0% |
| Serbia | 14 | 0.1% |
| South America | 119 | 0.4% |
| South Central Asia | 445 | 1.5% |
| South Eastern Asia | 127 | 0.4% |
| Southern Europe | 76 | 0.3% |
| Spain | 11 | 0.0% |
| Sudan | 8 | 0.0% |
| Switzerland | 10 | 0.0% |
| Thailand | 44 | 0.2% |
| Trinidad and Tobago | 8 | 0.0% |
| Ukraine | 552 | 1.9% |
| Vietnam | 35 | 0.1% |
| Western Africa | 41 | 0.1% |
| Western Asia | 2 | 0.0% |
| Western Europe | 42 | 0.1% | View All 57 Rows |
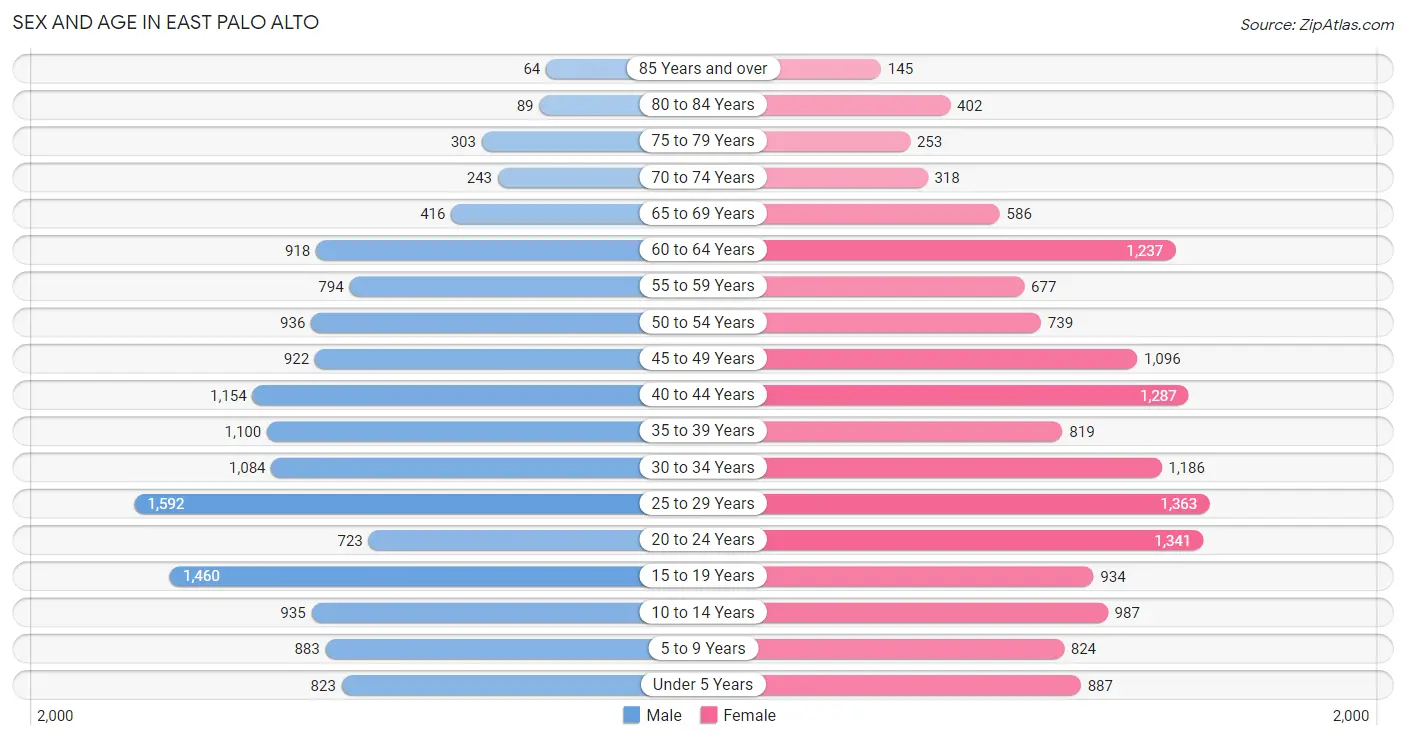
Sex and Age in East Palo Alto
Sex and Age in East Palo Alto
The most populous age groups in East Palo Alto are 25 to 29 Years (1,592 | 11.0%) for men and 25 to 29 Years (1,363 | 9.0%) for women.
| Age Bracket | Male | Female |
| Under 5 Years | 823 (5.7%) | 887 (5.9%) |
| 5 to 9 Years | 883 (6.1%) | 824 (5.5%) |
| 10 to 14 Years | 935 (6.5%) | 987 (6.5%) |
| 15 to 19 Years | 1,460 (10.1%) | 934 (6.2%) |
| 20 to 24 Years | 723 (5.0%) | 1,341 (8.9%) |
| 25 to 29 Years | 1,592 (11.0%) | 1,363 (9.0%) |
| 30 to 34 Years | 1,084 (7.5%) | 1,186 (7.9%) |
| 35 to 39 Years | 1,100 (7.6%) | 819 (5.4%) |
| 40 to 44 Years | 1,154 (8.0%) | 1,287 (8.5%) |
| 45 to 49 Years | 922 (6.4%) | 1,096 (7.3%) |
| 50 to 54 Years | 936 (6.5%) | 739 (4.9%) |
| 55 to 59 Years | 794 (5.5%) | 677 (4.5%) |
| 60 to 64 Years | 918 (6.4%) | 1,237 (8.2%) |
| 65 to 69 Years | 416 (2.9%) | 586 (3.9%) |
| 70 to 74 Years | 243 (1.7%) | 318 (2.1%) |
| 75 to 79 Years | 303 (2.1%) | 253 (1.7%) |
| 80 to 84 Years | 89 (0.6%) | 402 (2.7%) |
| 85 Years and over | 64 (0.4%) | 145 (1.0%) |
| Total | 14,439 (100.0%) | 15,081 (100.0%) |
Families and Households in East Palo Alto
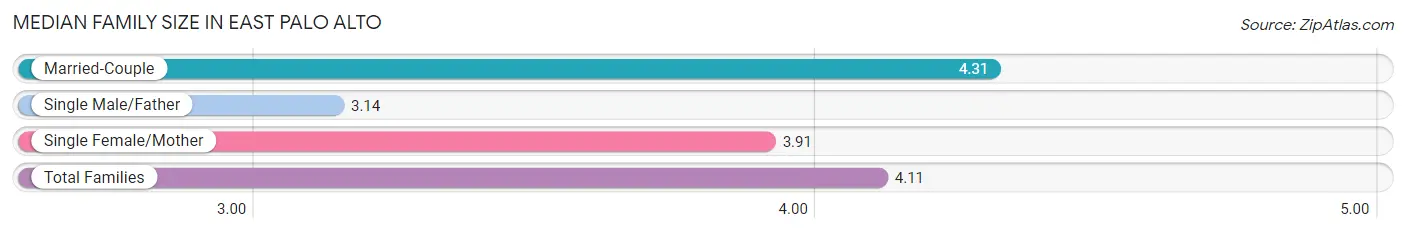
Median Family Size in East Palo Alto
The median family size in East Palo Alto is 4.11 persons per family, with married-couple families (4,072 | 67.0%) accounting for the largest median family size of 4.31 persons per family. On the other hand, single male/father families (537 | 8.8%) represent the smallest median family size with 3.14 persons per family.
| Family Type | # Families | Family Size |
| Married-Couple | 4,072 (67.0%) | 4.31 |
| Single Male/Father | 537 (8.8%) | 3.14 |
| Single Female/Mother | 1,466 (24.1%) | 3.91 |
| Total Families | 6,075 (100.0%) | 4.11 |
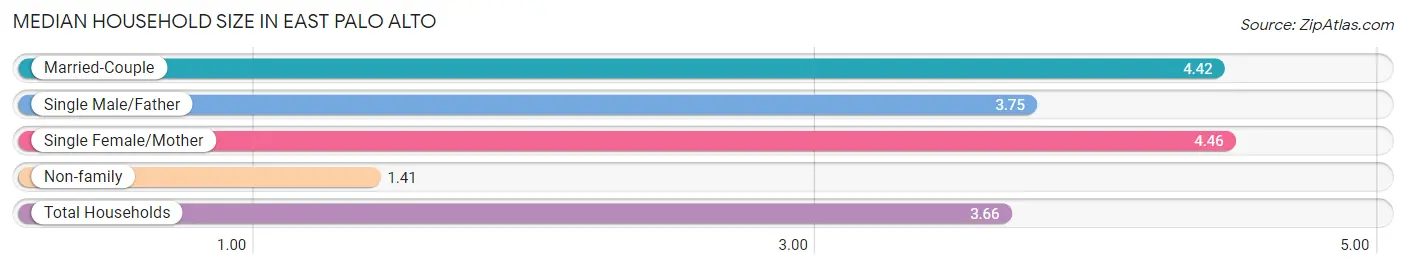
Median Household Size in East Palo Alto
The median household size in East Palo Alto is 3.66 persons per household, with single female/mother households (1,466 | 18.3%) accounting for the largest median household size of 4.46 persons per household. non-family households (1,923 | 24.0%) represent the smallest median household size with 1.41 persons per household.
| Household Type | # Households | Household Size |
| Married-Couple | 4,072 (50.9%) | 4.42 |
| Single Male/Father | 537 (6.7%) | 3.75 |
| Single Female/Mother | 1,466 (18.3%) | 4.46 |
| Non-family | 1,923 (24.0%) | 1.41 |
| Total Households | 7,998 (100.0%) | 3.66 |
Household Size by Marriage Status in East Palo Alto
Out of a total of 7,998 households in East Palo Alto, 6,075 (76.0%) are family households, while 1,923 (24.0%) are nonfamily households. The most numerous type of family households are 3-person households, comprising 1,442, and the most common type of nonfamily households are 1-person households, comprising 1,442.
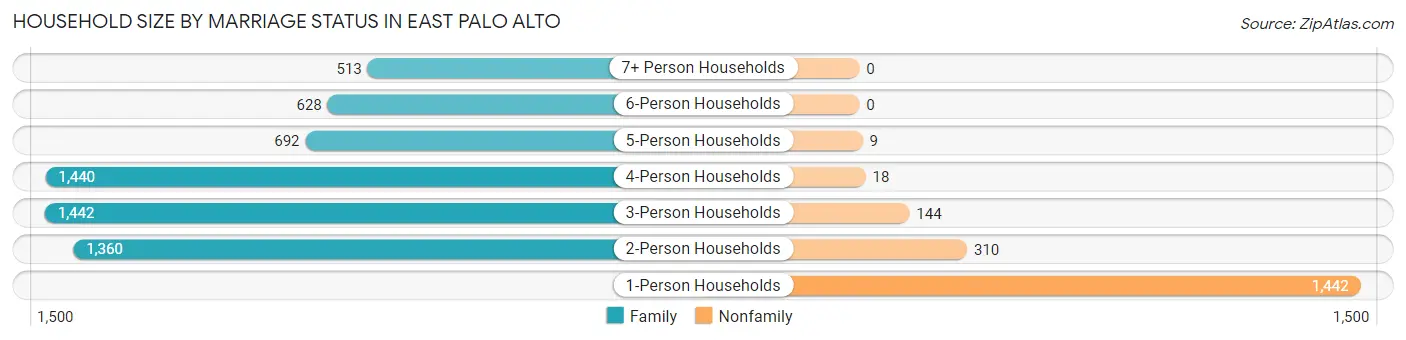
| Household Size | Family Households | Nonfamily Households |
| 1-Person Households | - | 1,442 (18.0%) |
| 2-Person Households | 1,360 (17.0%) | 310 (3.9%) |
| 3-Person Households | 1,442 (18.0%) | 144 (1.8%) |
| 4-Person Households | 1,440 (18.0%) | 18 (0.2%) |
| 5-Person Households | 692 (8.6%) | 9 (0.1%) |
| 6-Person Households | 628 (7.9%) | 0 (0.0%) |
| 7+ Person Households | 513 (6.4%) | 0 (0.0%) |
| Total | 6,075 (76.0%) | 1,923 (24.0%) |
Female Fertility in East Palo Alto
Fertility by Age in East Palo Alto
Average fertility rate in East Palo Alto is 22.0 births per 1,000 women. Women in the age bracket of 20 to 34 years have the highest fertility rate with 34.0 births per 1,000 women. Women in the age bracket of 20 to 34 years acount for 74.4% of all women with births.
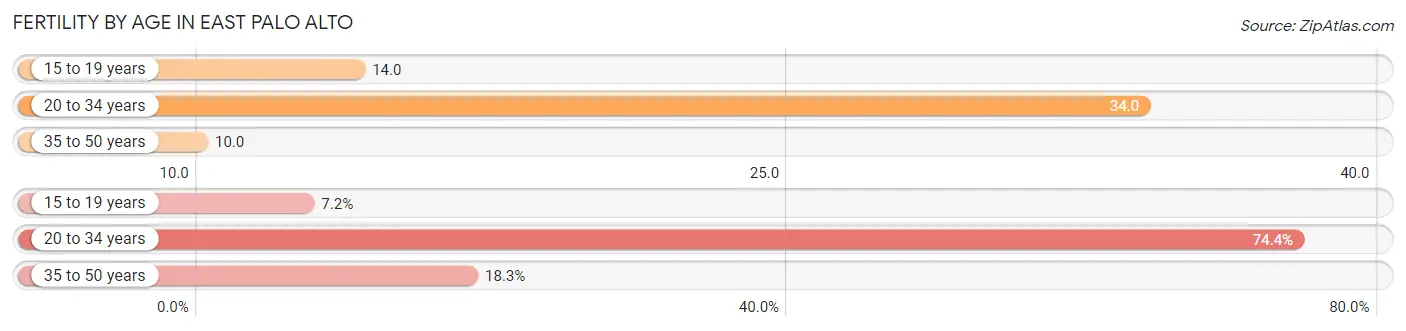
| Age Bracket | Women with Births | Births / 1,000 Women |
| 15 to 19 years | 13 (7.2%) | 14.0 |
| 20 to 34 years | 134 (74.4%) | 34.0 |
| 35 to 50 years | 33 (18.3%) | 10.0 |
| Total | 180 (100.0%) | 22.0 |
Fertility by Age by Marriage Status in East Palo Alto
41.1% of women with births (180) in East Palo Alto are married. The highest percentage of unmarried women with births falls into 15 to 19 years age bracket with 100.0% of them unmarried at the time of birth, while the lowest percentage of unmarried women with births belong to 35 to 50 years age bracket with 24.2% of them unmarried.
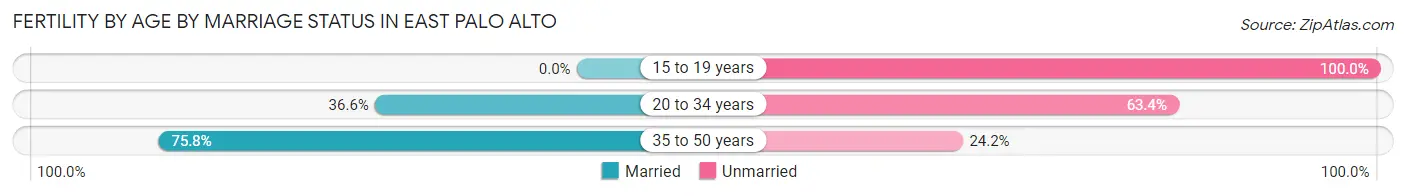
| Age Bracket | Married | Unmarried |
| 15 to 19 years | 0 (0.0%) | 13 (100.0%) |
| 20 to 34 years | 49 (36.6%) | 85 (63.4%) |
| 35 to 50 years | 25 (75.8%) | 8 (24.2%) |
| Total | 74 (41.1%) | 106 (58.9%) |
Fertility by Education in East Palo Alto
Average fertility rate in East Palo Alto is 22.0 births per 1,000 women. Women with the education attainment of bachelor's degree have the highest fertility rate of 50.0 births per 1,000 women, while women with the education attainment of college or associate's degree have the lowest fertility at 10.0 births per 1,000 women. Women with the education attainment of high school diploma represent 33.9% of all women with births.
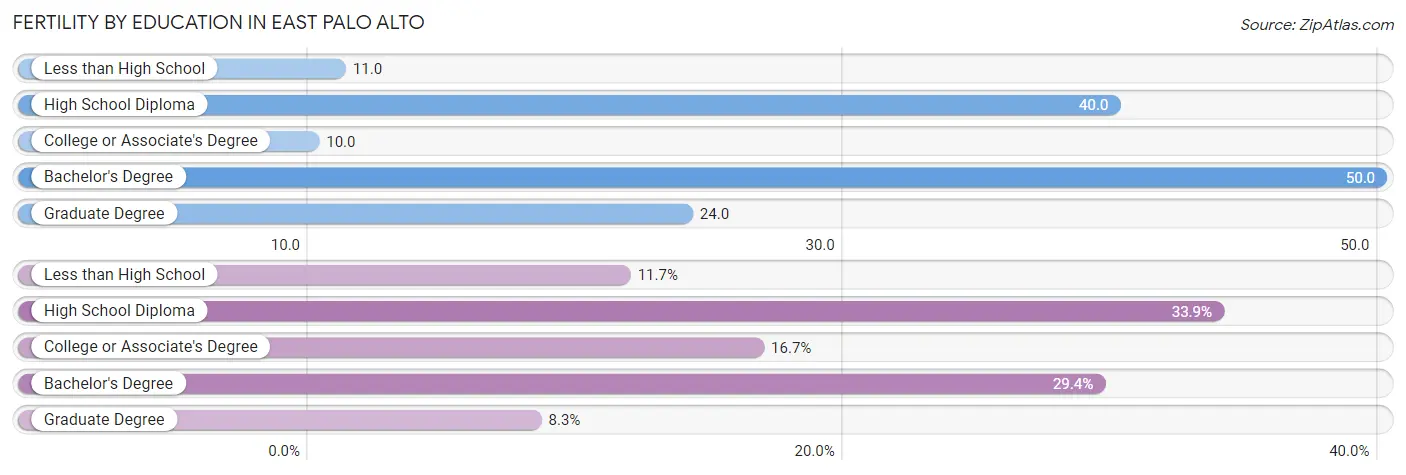
| Educational Attainment | Women with Births | Births / 1,000 Women |
| Less than High School | 21 (11.7%) | 11.0 |
| High School Diploma | 61 (33.9%) | 40.0 |
| College or Associate's Degree | 30 (16.7%) | 10.0 |
| Bachelor's Degree | 53 (29.4%) | 50.0 |
| Graduate Degree | 15 (8.3%) | 24.0 |
| Total | 180 (100.0%) | 22.0 |
Fertility by Education by Marriage Status in East Palo Alto
58.9% of women with births in East Palo Alto are unmarried. Women with the educational attainment of graduate degree are most likely to be married with 100.0% of them married at childbirth, while women with the educational attainment of less than high school are least likely to be married with 100.0% of them unmarried at childbirth.
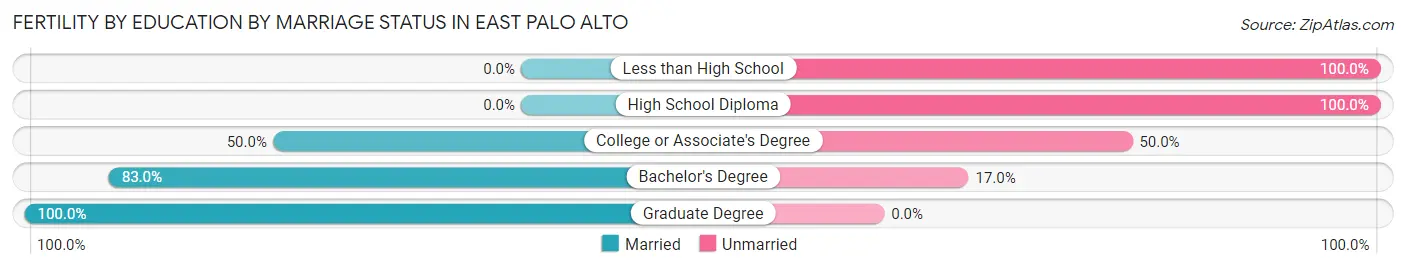
| Educational Attainment | Married | Unmarried |
| Less than High School | 0 (0.0%) | 21 (100.0%) |
| High School Diploma | 0 (0.0%) | 61 (100.0%) |
| College or Associate's Degree | 15 (50.0%) | 15 (50.0%) |
| Bachelor's Degree | 44 (83.0%) | 9 (17.0%) |
| Graduate Degree | 15 (100.0%) | 0 (0.0%) |
| Total | 74 (41.1%) | 106 (58.9%) |
Employment Characteristics in East Palo Alto
Employment by Class of Employer in East Palo Alto
Among the 15,318 employed individuals in East Palo Alto, private company employees (10,680 | 69.7%), not-for-profit organizations (1,354 | 8.8%), and self-employed (not incorporated) (1,319 | 8.6%) make up the most common classes of employment.
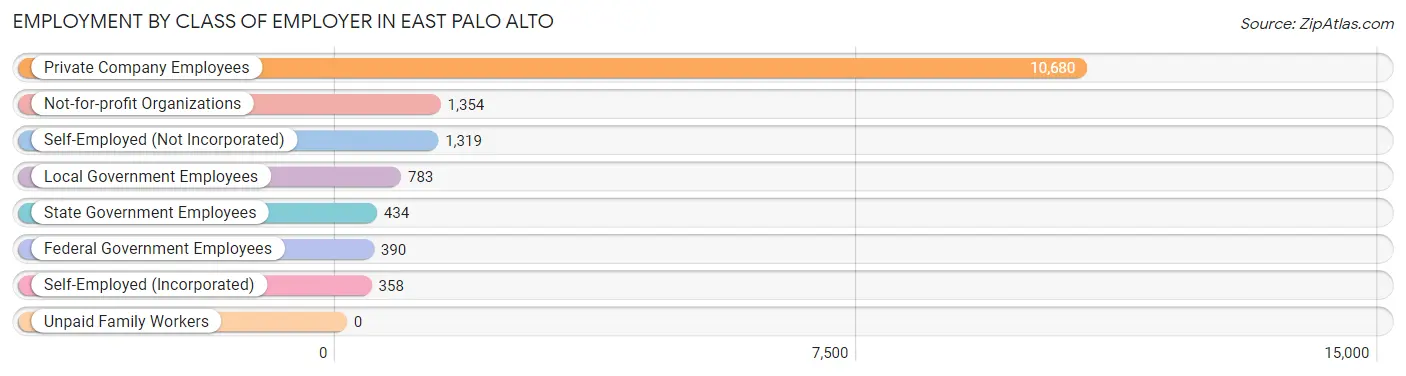
| Employer Class | # Employees | % Employees |
| Private Company Employees | 10,680 | 69.7% |
| Self-Employed (Incorporated) | 358 | 2.3% |
| Self-Employed (Not Incorporated) | 1,319 | 8.6% |
| Not-for-profit Organizations | 1,354 | 8.8% |
| Local Government Employees | 783 | 5.1% |
| State Government Employees | 434 | 2.8% |
| Federal Government Employees | 390 | 2.5% |
| Unpaid Family Workers | 0 | 0.0% |
| Total | 15,318 | 100.0% |
Employment Status by Age in East Palo Alto
According to the labor force statistics for East Palo Alto, out of the total population over 16 years of age (23,980), 68.6% or 16,450 individuals are in the labor force, with 5.0% or 822 of them unemployed. The age group with the highest labor force participation rate is 25 to 29 years, with 89.9% or 2,657 individuals in the labor force. Within the labor force, the 16 to 19 years age range has the highest percentage of unemployed individuals, with 28.3% or 138 of them being unemployed.
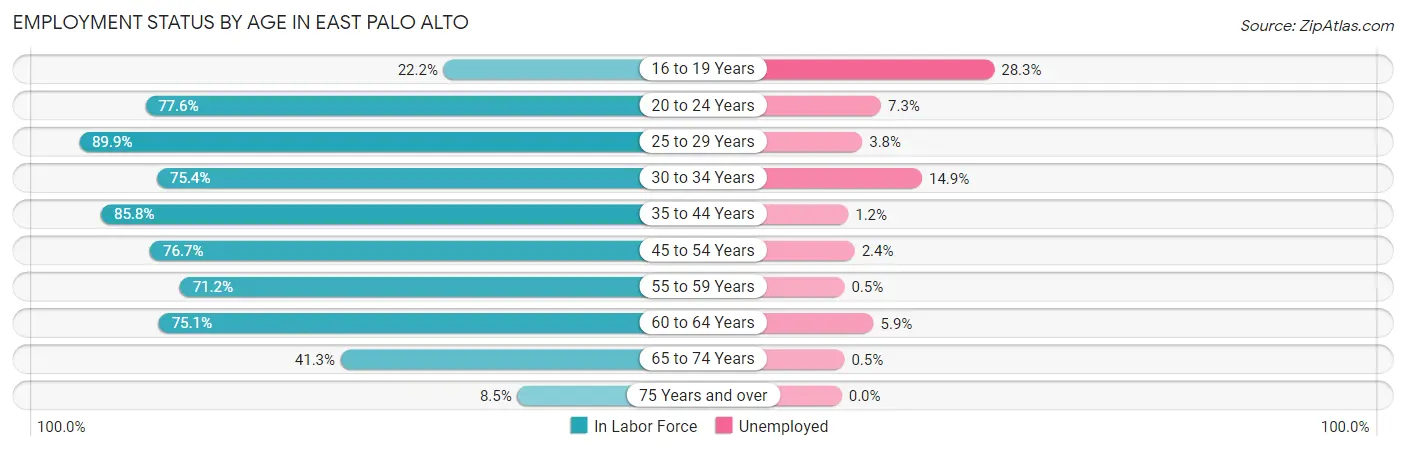
| Age Bracket | In Labor Force | Unemployed |
| 16 to 19 Years | 487 (22.2%) | 138 (28.3%) |
| 20 to 24 Years | 1,602 (77.6%) | 117 (7.3%) |
| 25 to 29 Years | 2,657 (89.9%) | 101 (3.8%) |
| 30 to 34 Years | 1,712 (75.4%) | 255 (14.9%) |
| 35 to 44 Years | 3,741 (85.8%) | 45 (1.2%) |
| 45 to 54 Years | 2,833 (76.7%) | 68 (2.4%) |
| 55 to 59 Years | 1,047 (71.2%) | 5 (0.5%) |
| 60 to 64 Years | 1,618 (75.1%) | 95 (5.9%) |
| 65 to 74 Years | 646 (41.3%) | 3 (0.5%) |
| 75 Years and over | 107 (8.5%) | 0 (0.0%) |
| Total | 16,450 (68.6%) | 822 (5.0%) |
Employment Status by Educational Attainment in East Palo Alto
According to labor force statistics for East Palo Alto, 80.5% of individuals (13,608) out of the total population between 25 and 64 years of age (16,904) are in the labor force, with 4.2% or 572 of them being unemployed. The group with the highest labor force participation rate are those with the educational attainment of bachelor's degree or higher, with 88.4% or 3,727 individuals in the labor force. Within the labor force, individuals with college / associate degree education have the highest percentage of unemployment, with 5.7% or 211 of them being unemployed.
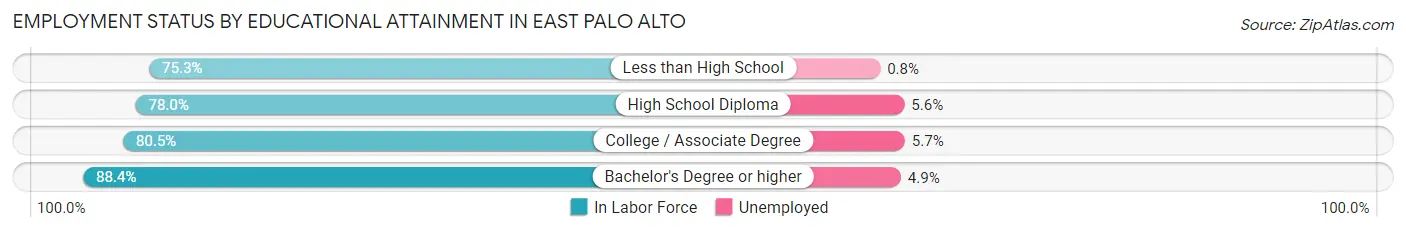
| Educational Attainment | In Labor Force | Unemployed |
| Less than High School | 3,518 (75.3%) | 37 (0.8%) |
| High School Diploma | 2,662 (78.0%) | 191 (5.6%) |
| College / Associate Degree | 3,705 (80.5%) | 262 (5.7%) |
| Bachelor's Degree or higher | 3,727 (88.4%) | 207 (4.9%) |
| Total | 13,608 (80.5%) | 710 (4.2%) |
Employment Occupations by Sex in East Palo Alto
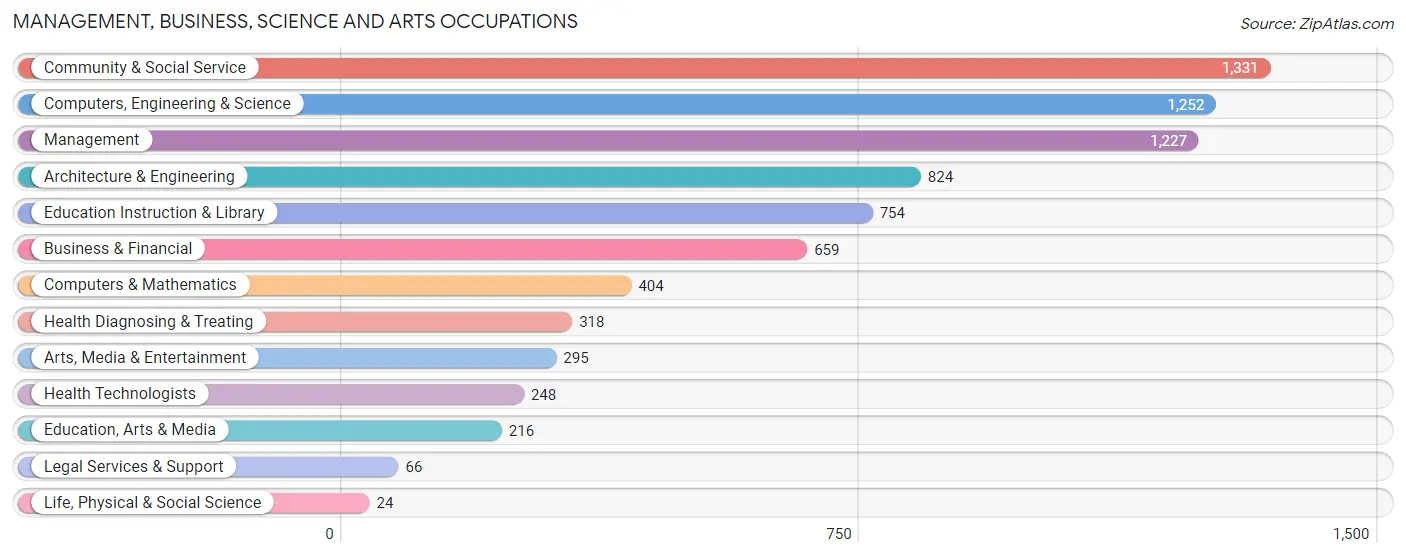
Management, Business, Science and Arts Occupations
The most common Management, Business, Science and Arts occupations in East Palo Alto are Community & Social Service (1,331 | 8.5%), Computers, Engineering & Science (1,252 | 8.0%), Management (1,227 | 7.9%), Architecture & Engineering (824 | 5.3%), and Education Instruction & Library (754 | 4.8%).
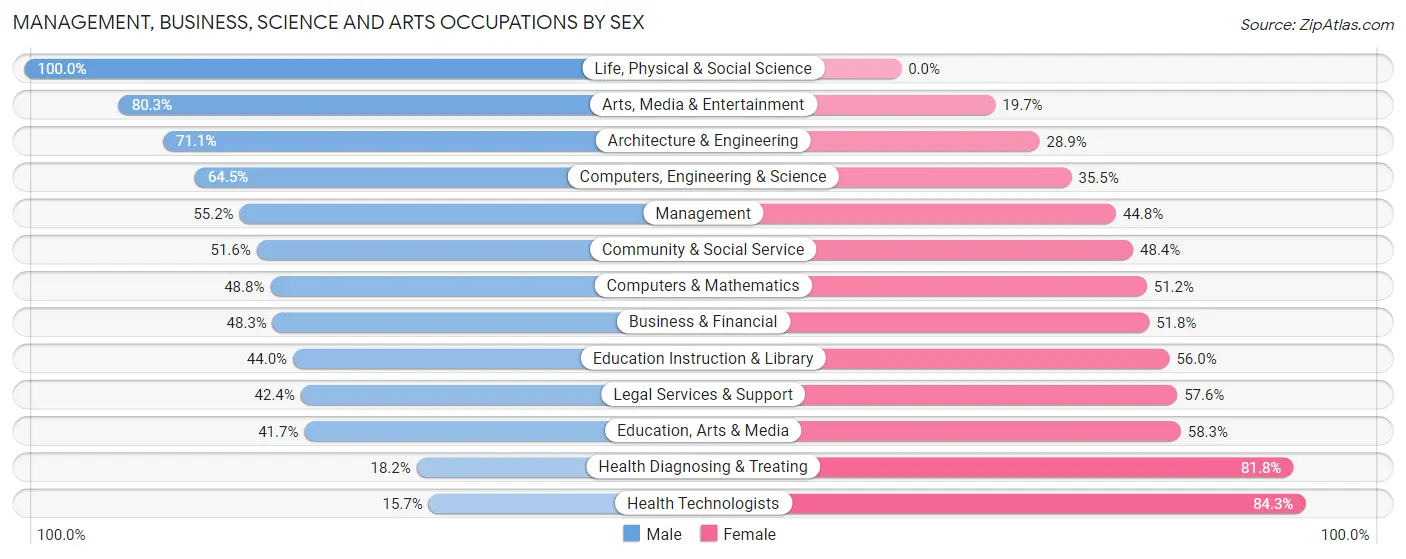
Management, Business, Science and Arts Occupations by Sex
Within the Management, Business, Science and Arts occupations in East Palo Alto, the most male-oriented occupations are Life, Physical & Social Science (100.0%), Arts, Media & Entertainment (80.3%), and Architecture & Engineering (71.1%), while the most female-oriented occupations are Health Technologists (84.3%), Health Diagnosing & Treating (81.8%), and Education, Arts & Media (58.3%).
| Occupation | Male | Female |
| Management | 677 (55.2%) | 550 (44.8%) |
| Business & Financial | 318 (48.2%) | 341 (51.7%) |
| Computers, Engineering & Science | 807 (64.5%) | 445 (35.5%) |
| Computers & Mathematics | 197 (48.8%) | 207 (51.2%) |
| Architecture & Engineering | 586 (71.1%) | 238 (28.9%) |
| Life, Physical & Social Science | 24 (100.0%) | 0 (0.0%) |
| Community & Social Service | 687 (51.6%) | 644 (48.4%) |
| Education, Arts & Media | 90 (41.7%) | 126 (58.3%) |
| Legal Services & Support | 28 (42.4%) | 38 (57.6%) |
| Education Instruction & Library | 332 (44.0%) | 422 (56.0%) |
| Arts, Media & Entertainment | 237 (80.3%) | 58 (19.7%) |
| Health Diagnosing & Treating | 58 (18.2%) | 260 (81.8%) |
| Health Technologists | 39 (15.7%) | 209 (84.3%) |
| Total (Category) | 2,547 (53.2%) | 2,240 (46.8%) |
| Total (Overall) | 8,440 (54.1%) | 7,160 (45.9%) |
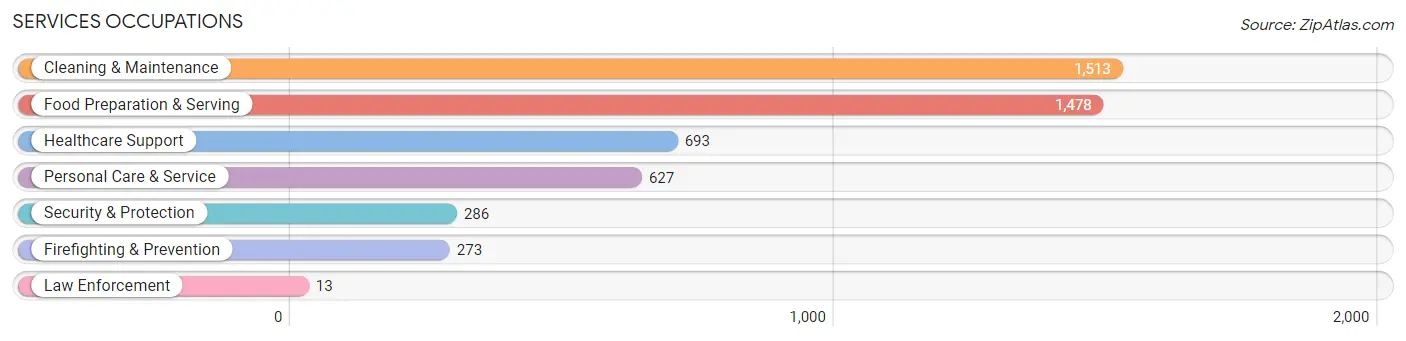
Services Occupations
The most common Services occupations in East Palo Alto are Cleaning & Maintenance (1,513 | 9.7%), Food Preparation & Serving (1,478 | 9.5%), Healthcare Support (693 | 4.4%), Personal Care & Service (627 | 4.0%), and Security & Protection (286 | 1.8%).
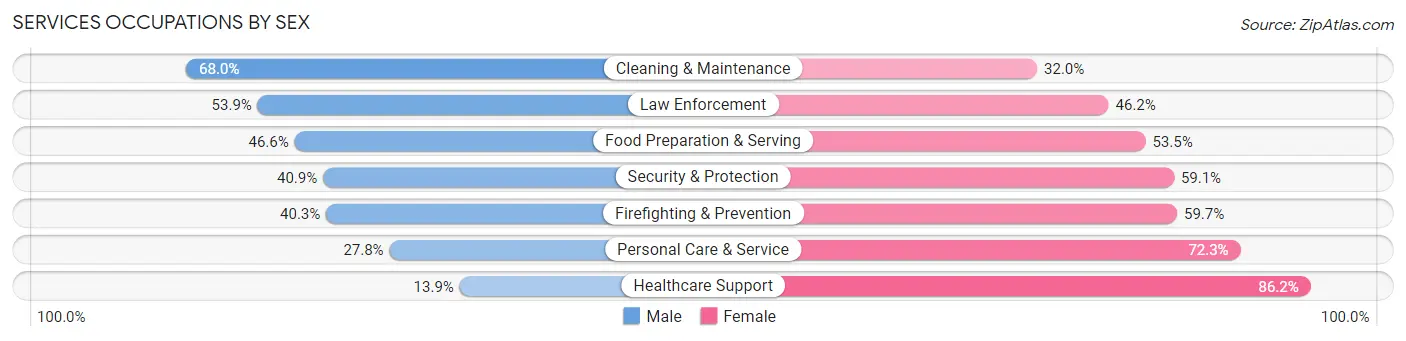
Services Occupations by Sex
Within the Services occupations in East Palo Alto, the most male-oriented occupations are Cleaning & Maintenance (68.0%), Law Enforcement (53.8%), and Food Preparation & Serving (46.6%), while the most female-oriented occupations are Healthcare Support (86.2%), Personal Care & Service (72.3%), and Firefighting & Prevention (59.7%).
| Occupation | Male | Female |
| Healthcare Support | 96 (13.9%) | 597 (86.2%) |
| Security & Protection | 117 (40.9%) | 169 (59.1%) |
| Firefighting & Prevention | 110 (40.3%) | 163 (59.7%) |
| Law Enforcement | 7 (53.8%) | 6 (46.2%) |
| Food Preparation & Serving | 688 (46.6%) | 790 (53.4%) |
| Cleaning & Maintenance | 1,029 (68.0%) | 484 (32.0%) |
| Personal Care & Service | 174 (27.8%) | 453 (72.3%) |
| Total (Category) | 2,104 (45.8%) | 2,493 (54.2%) |
| Total (Overall) | 8,440 (54.1%) | 7,160 (45.9%) |
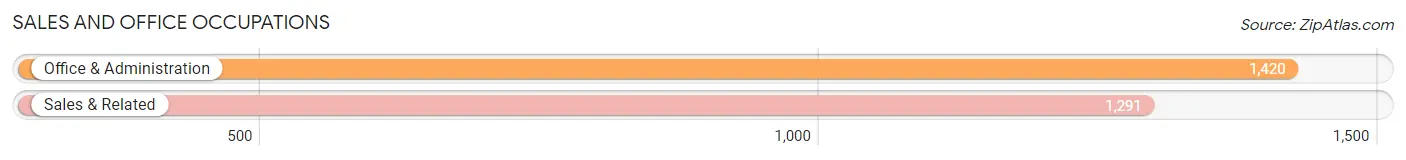
Sales and Office Occupations
The most common Sales and Office occupations in East Palo Alto are Office & Administration (1,420 | 9.1%), and Sales & Related (1,291 | 8.3%).
Sales and Office Occupations by Sex
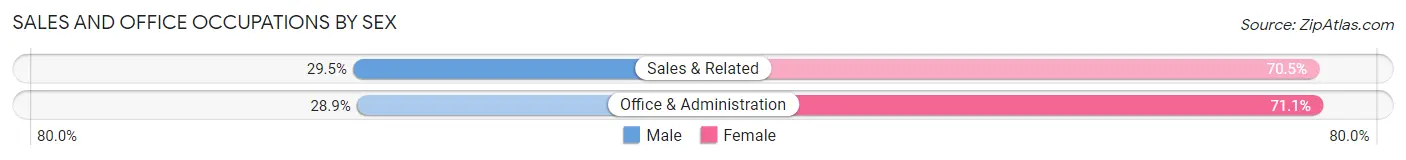
| Occupation | Male | Female |
| Sales & Related | 381 (29.5%) | 910 (70.5%) |
| Office & Administration | 411 (28.9%) | 1,009 (71.1%) |
| Total (Category) | 792 (29.2%) | 1,919 (70.8%) |
| Total (Overall) | 8,440 (54.1%) | 7,160 (45.9%) |
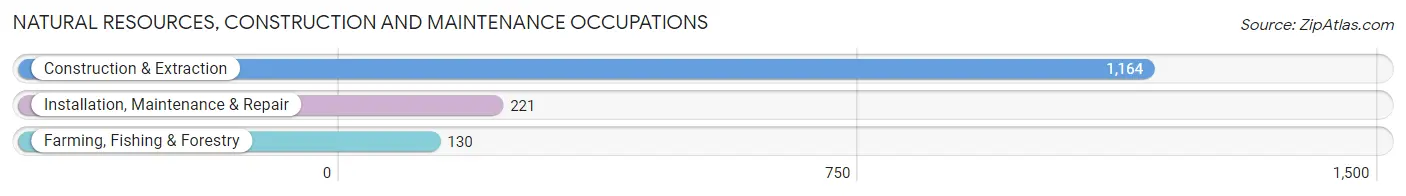
Natural Resources, Construction and Maintenance Occupations
The most common Natural Resources, Construction and Maintenance occupations in East Palo Alto are Construction & Extraction (1,164 | 7.5%), Installation, Maintenance & Repair (221 | 1.4%), and Farming, Fishing & Forestry (130 | 0.8%).
Natural Resources, Construction and Maintenance Occupations by Sex
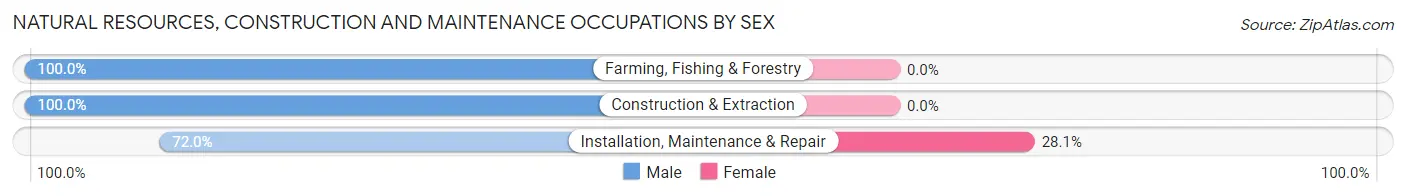
| Occupation | Male | Female |
| Farming, Fishing & Forestry | 130 (100.0%) | 0 (0.0%) |
| Construction & Extraction | 1,164 (100.0%) | 0 (0.0%) |
| Installation, Maintenance & Repair | 159 (72.0%) | 62 (28.1%) |
| Total (Category) | 1,453 (95.9%) | 62 (4.1%) |
| Total (Overall) | 8,440 (54.1%) | 7,160 (45.9%) |
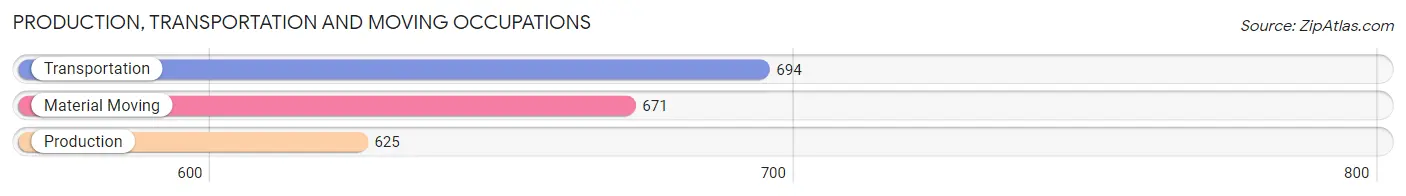
Production, Transportation and Moving Occupations
The most common Production, Transportation and Moving occupations in East Palo Alto are Transportation (694 | 4.4%), Material Moving (671 | 4.3%), and Production (625 | 4.0%).
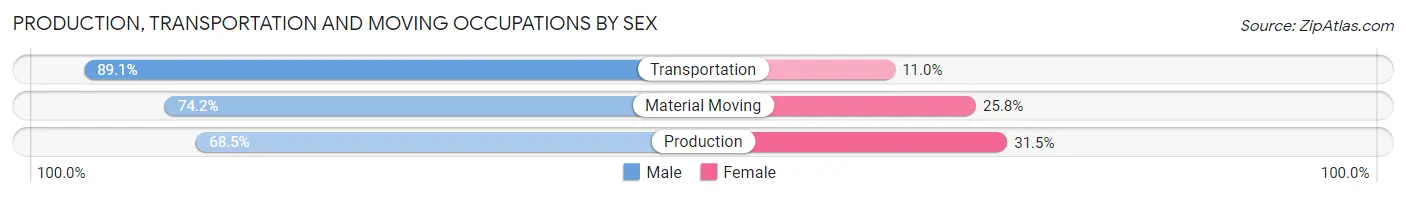
Production, Transportation and Moving Occupations by Sex
| Occupation | Male | Female |
| Production | 428 (68.5%) | 197 (31.5%) |
| Transportation | 618 (89.0%) | 76 (11.0%) |
| Material Moving | 498 (74.2%) | 173 (25.8%) |
| Total (Category) | 1,544 (77.6%) | 446 (22.4%) |
| Total (Overall) | 8,440 (54.1%) | 7,160 (45.9%) |
Employment Industries by Sex in East Palo Alto
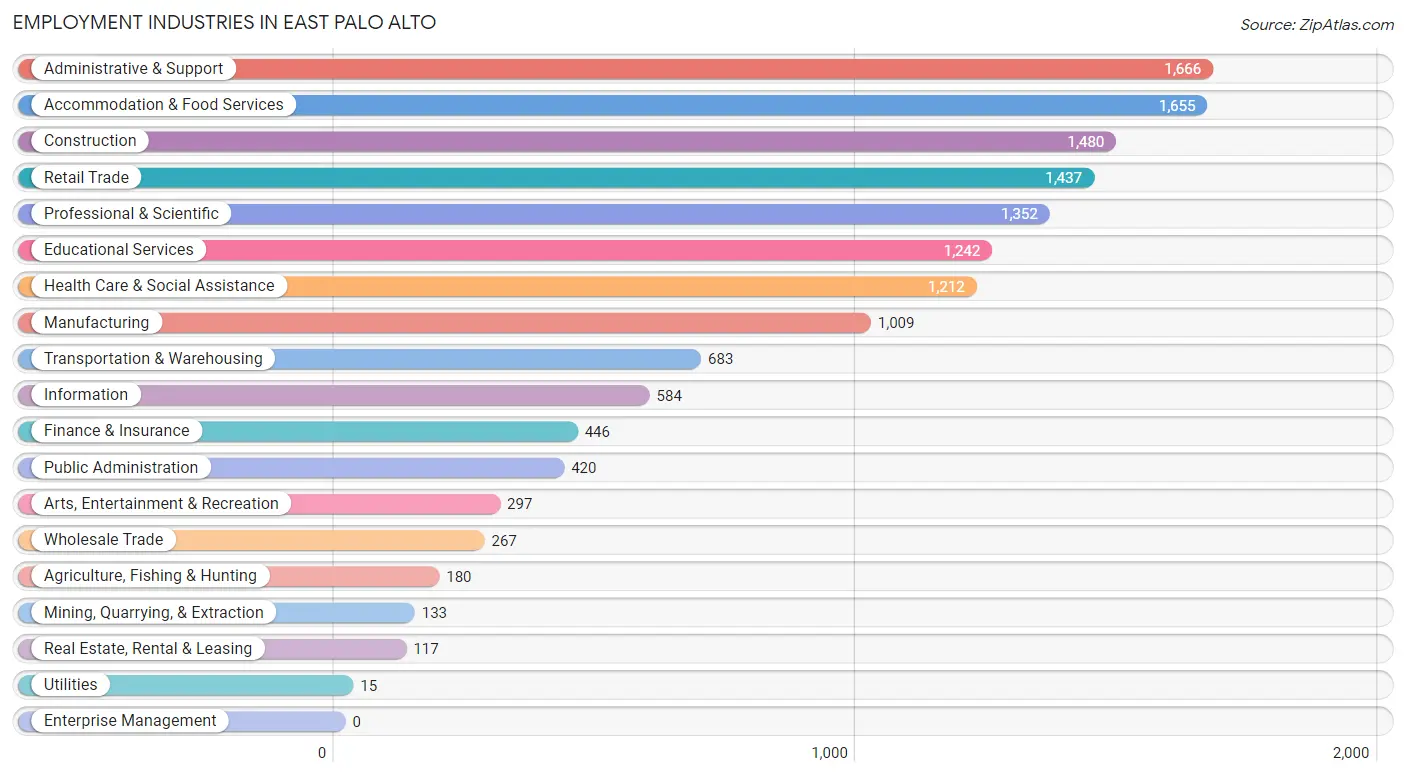
Employment Industries in East Palo Alto
The major employment industries in East Palo Alto include Administrative & Support (1,666 | 10.7%), Accommodation & Food Services (1,655 | 10.6%), Construction (1,480 | 9.5%), Retail Trade (1,437 | 9.2%), and Professional & Scientific (1,352 | 8.7%).
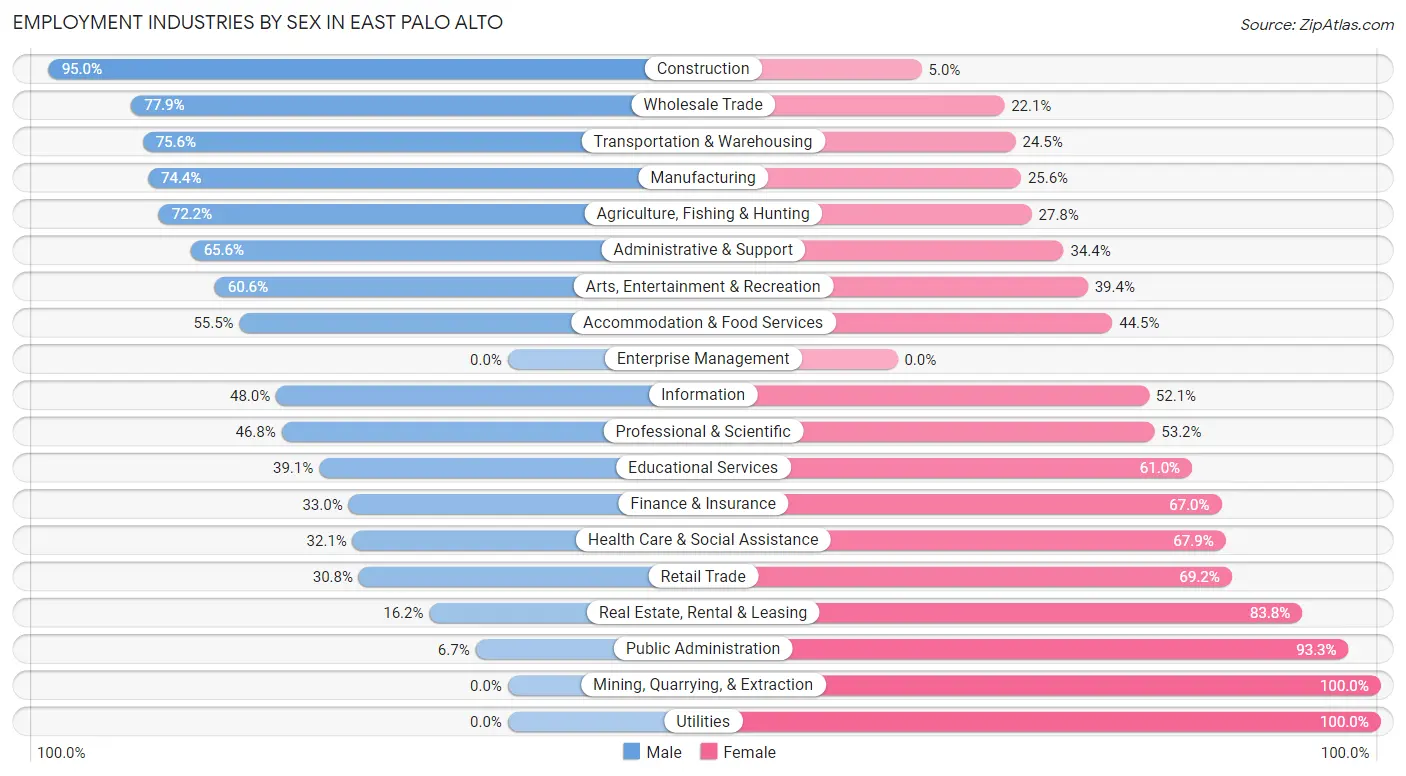
Employment Industries by Sex in East Palo Alto
The East Palo Alto industries that see more men than women are Construction (95.0%), Wholesale Trade (77.9%), and Transportation & Warehousing (75.5%), whereas the industries that tend to have a higher number of women are Mining, Quarrying, & Extraction (100.0%), Utilities (100.0%), and Public Administration (93.3%).
| Industry | Male | Female |
| Agriculture, Fishing & Hunting | 130 (72.2%) | 50 (27.8%) |
| Mining, Quarrying, & Extraction | 0 (0.0%) | 133 (100.0%) |
| Construction | 1,406 (95.0%) | 74 (5.0%) |
| Manufacturing | 751 (74.4%) | 258 (25.6%) |
| Wholesale Trade | 208 (77.9%) | 59 (22.1%) |
| Retail Trade | 443 (30.8%) | 994 (69.2%) |
| Transportation & Warehousing | 516 (75.5%) | 167 (24.4%) |
| Utilities | 0 (0.0%) | 15 (100.0%) |
| Information | 280 (47.9%) | 304 (52.0%) |
| Finance & Insurance | 147 (33.0%) | 299 (67.0%) |
| Real Estate, Rental & Leasing | 19 (16.2%) | 98 (83.8%) |
| Professional & Scientific | 633 (46.8%) | 719 (53.2%) |
| Enterprise Management | 0 (0.0%) | 0 (0.0%) |
| Administrative & Support | 1,093 (65.6%) | 573 (34.4%) |
| Educational Services | 485 (39.1%) | 757 (61.0%) |
| Health Care & Social Assistance | 389 (32.1%) | 823 (67.9%) |
| Arts, Entertainment & Recreation | 180 (60.6%) | 117 (39.4%) |
| Accommodation & Food Services | 919 (55.5%) | 736 (44.5%) |
| Public Administration | 28 (6.7%) | 392 (93.3%) |
| Total | 8,440 (54.1%) | 7,160 (45.9%) |
Education in East Palo Alto
School Enrollment in East Palo Alto
The most common levels of schooling among the 7,625 students in East Palo Alto are high school (2,108 | 27.7%), college / undergraduate (1,901 | 24.9%), and middle school (1,352 | 17.7%).
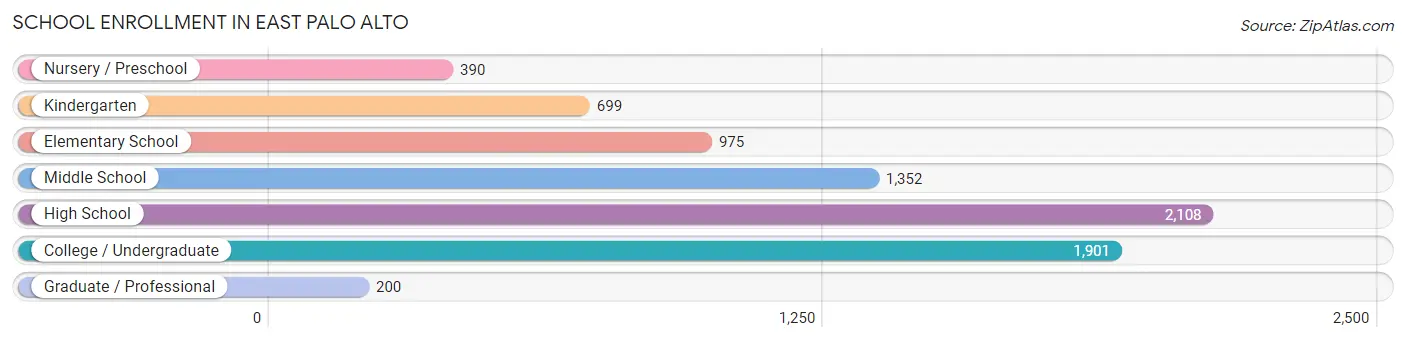
| School Level | # Students | % Students |
| Nursery / Preschool | 390 | 5.1% |
| Kindergarten | 699 | 9.2% |
| Elementary School | 975 | 12.8% |
| Middle School | 1,352 | 17.7% |
| High School | 2,108 | 27.7% |
| College / Undergraduate | 1,901 | 24.9% |
| Graduate / Professional | 200 | 2.6% |
| Total | 7,625 | 100.0% |
School Enrollment by Age by Funding Source in East Palo Alto
Out of a total of 7,625 students who are enrolled in schools in East Palo Alto, 1,174 (15.4%) attend a private institution, while the remaining 6,451 (84.6%) are enrolled in public schools. The age group of 20 to 24 year olds has the highest likelihood of being enrolled in private schools, with 185 (26.4% in the age bracket) enrolled. Conversely, the age group of 18 to 19 year olds has the lowest likelihood of being enrolled in a private school, with 718 (91.0% in the age bracket) attending a public institution.
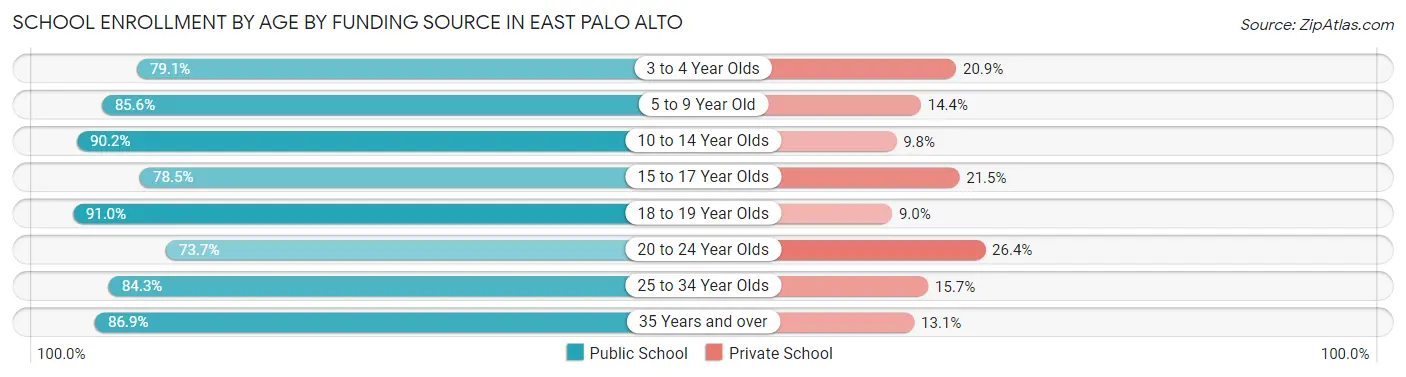
| Age Bracket | Public School | Private School |
| 3 to 4 Year Olds | 204 (79.1%) | 54 (20.9%) |
| 5 to 9 Year Old | 1,412 (85.6%) | 237 (14.4%) |
| 10 to 14 Year Olds | 1,734 (90.2%) | 188 (9.8%) |
| 15 to 17 Year Olds | 1,126 (78.5%) | 309 (21.5%) |
| 18 to 19 Year Olds | 718 (91.0%) | 71 (9.0%) |
| 20 to 24 Year Olds | 517 (73.7%) | 185 (26.4%) |
| 25 to 34 Year Olds | 515 (84.3%) | 96 (15.7%) |
| 35 Years and over | 225 (86.9%) | 34 (13.1%) |
| Total | 6,451 (84.6%) | 1,174 (15.4%) |
Educational Attainment by Field of Study in East Palo Alto
Business (864 | 15.7%), computers & mathematics (854 | 15.6%), engineering (701 | 12.8%), physical & health sciences (595 | 10.8%), and science & technology (396 | 7.2%) are the most common fields of study among 5,488 individuals in East Palo Alto who have obtained a bachelor's degree or higher.
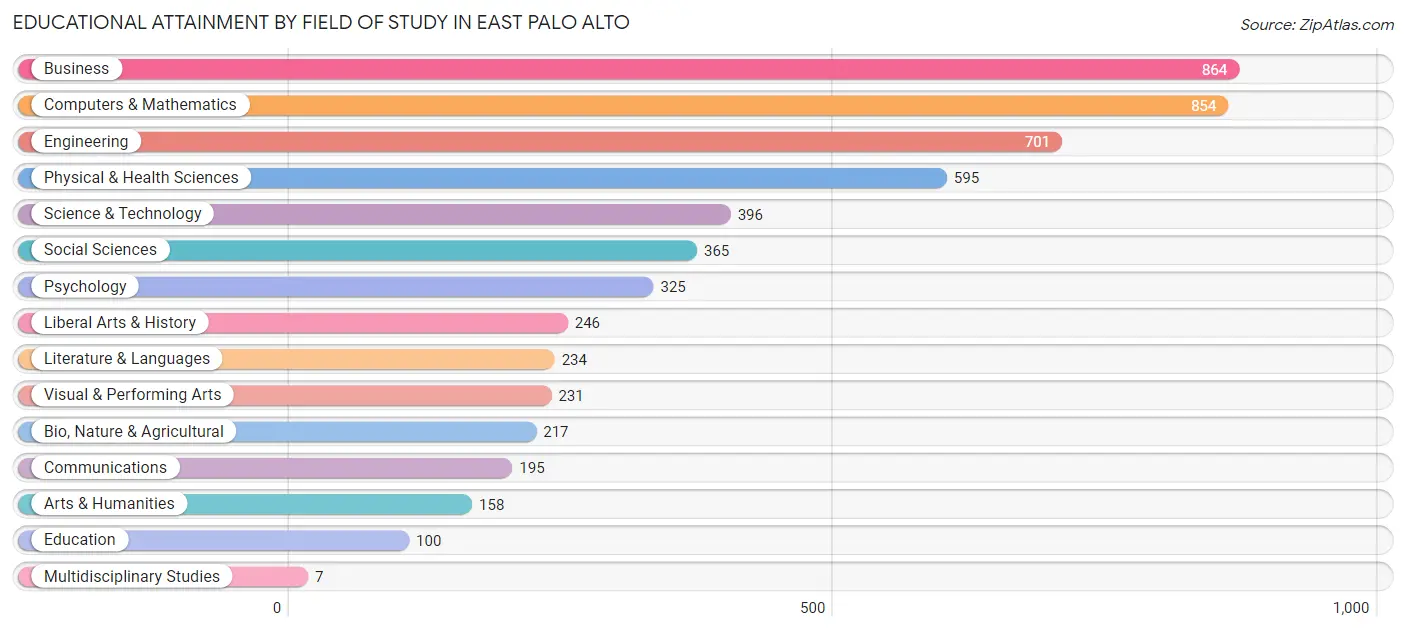
| Field of Study | # Graduates | % Graduates |
| Computers & Mathematics | 854 | 15.6% |
| Bio, Nature & Agricultural | 217 | 4.0% |
| Physical & Health Sciences | 595 | 10.8% |
| Psychology | 325 | 5.9% |
| Social Sciences | 365 | 6.7% |
| Engineering | 701 | 12.8% |
| Multidisciplinary Studies | 7 | 0.1% |
| Science & Technology | 396 | 7.2% |
| Business | 864 | 15.7% |
| Education | 100 | 1.8% |
| Literature & Languages | 234 | 4.3% |
| Liberal Arts & History | 246 | 4.5% |
| Visual & Performing Arts | 231 | 4.2% |
| Communications | 195 | 3.5% |
| Arts & Humanities | 158 | 2.9% |
| Total | 5,488 | 100.0% |
Transportation & Commute in East Palo Alto
Vehicle Availability by Sex in East Palo Alto
The most prevalent vehicle ownership categories in East Palo Alto are males with 2 vehicles (3,042, accounting for 36.7%) and females with 2 vehicles (2,054, making up 43.8%).
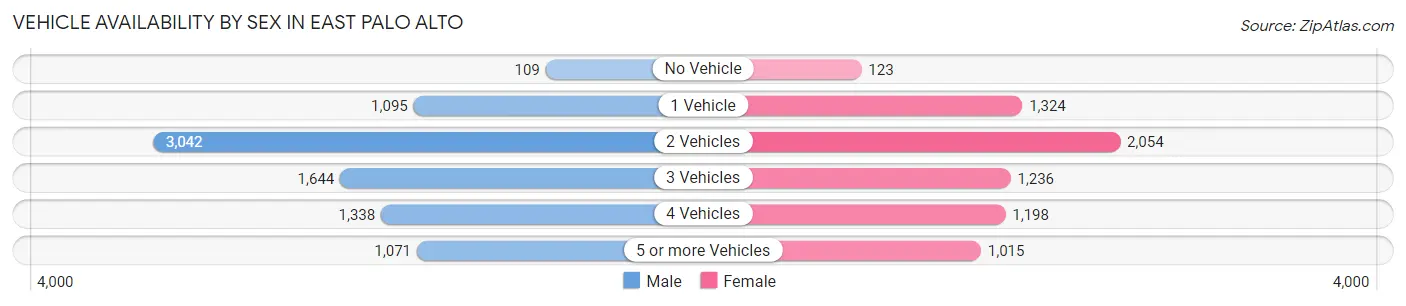
| Vehicles Available | Male | Female |
| No Vehicle | 109 (1.3%) | 123 (1.8%) |
| 1 Vehicle | 1,095 (13.2%) | 1,324 (19.1%) |
| 2 Vehicles | 3,042 (36.7%) | 2,054 (29.5%) |
| 3 Vehicles | 1,644 (19.8%) | 1,236 (17.8%) |
| 4 Vehicles | 1,338 (16.1%) | 1,198 (17.2%) |
| 5 or more Vehicles | 1,071 (12.9%) | 1,015 (14.6%) |
| Total | 8,299 (100.0%) | 6,950 (100.0%) |
Commute Time in East Palo Alto
The most frequently occuring commute durations in East Palo Alto are 20 to 24 minutes (2,918 commuters, 22.0%), 15 to 19 minutes (2,630 commuters, 19.8%), and 10 to 14 minutes (2,223 commuters, 16.7%).
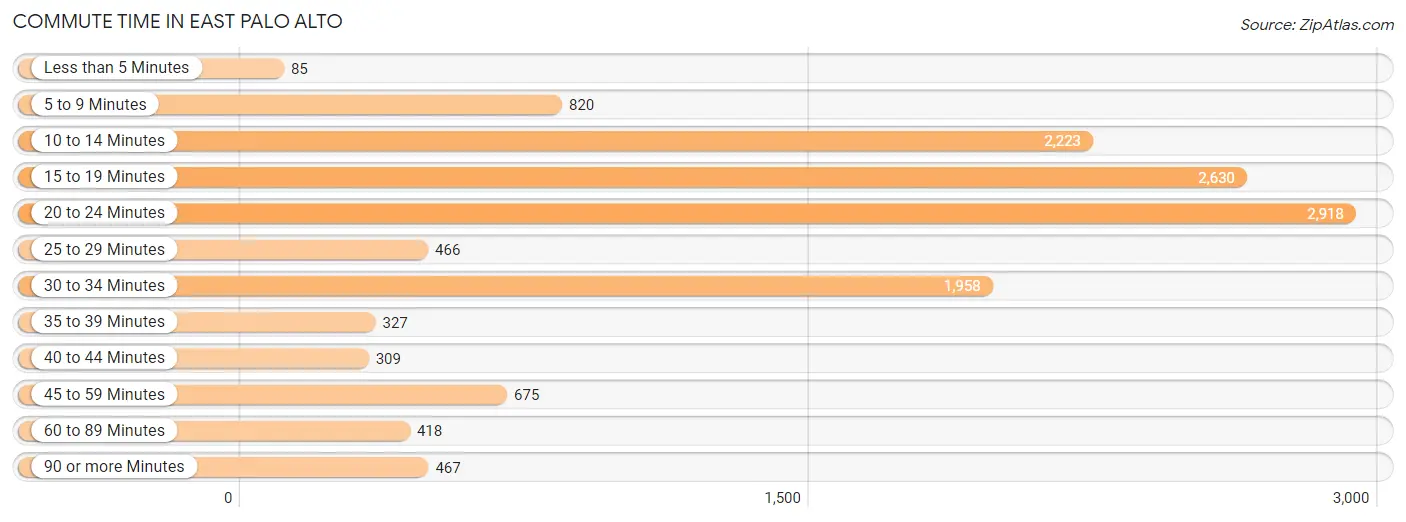
| Commute Time | # Commuters | % Commuters |
| Less than 5 Minutes | 85 | 0.6% |
| 5 to 9 Minutes | 820 | 6.2% |
| 10 to 14 Minutes | 2,223 | 16.7% |
| 15 to 19 Minutes | 2,630 | 19.8% |
| 20 to 24 Minutes | 2,918 | 22.0% |
| 25 to 29 Minutes | 466 | 3.5% |
| 30 to 34 Minutes | 1,958 | 14.7% |
| 35 to 39 Minutes | 327 | 2.5% |
| 40 to 44 Minutes | 309 | 2.3% |
| 45 to 59 Minutes | 675 | 5.1% |
| 60 to 89 Minutes | 418 | 3.1% |
| 90 or more Minutes | 467 | 3.5% |
Commute Time by Sex in East Palo Alto
The most common commute times in East Palo Alto are 20 to 24 minutes (1,475 commuters, 20.5%) for males and 20 to 24 minutes (1,443 commuters, 23.6%) for females.
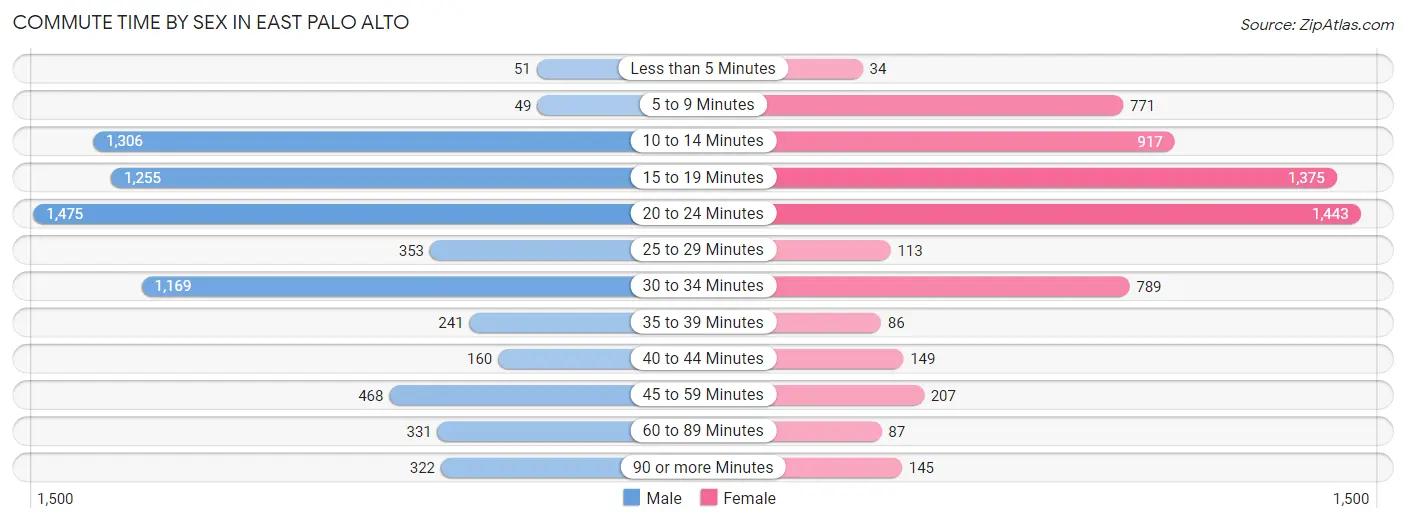
| Commute Time | Male | Female |
| Less than 5 Minutes | 51 (0.7%) | 34 (0.6%) |
| 5 to 9 Minutes | 49 (0.7%) | 771 (12.6%) |
| 10 to 14 Minutes | 1,306 (18.2%) | 917 (15.0%) |
| 15 to 19 Minutes | 1,255 (17.5%) | 1,375 (22.5%) |
| 20 to 24 Minutes | 1,475 (20.5%) | 1,443 (23.6%) |
| 25 to 29 Minutes | 353 (4.9%) | 113 (1.8%) |
| 30 to 34 Minutes | 1,169 (16.3%) | 789 (12.9%) |
| 35 to 39 Minutes | 241 (3.4%) | 86 (1.4%) |
| 40 to 44 Minutes | 160 (2.2%) | 149 (2.4%) |
| 45 to 59 Minutes | 468 (6.5%) | 207 (3.4%) |
| 60 to 89 Minutes | 331 (4.6%) | 87 (1.4%) |
| 90 or more Minutes | 322 (4.5%) | 145 (2.4%) |
Time of Departure to Work by Sex in East Palo Alto
The most frequent times of departure to work in East Palo Alto are 7:00 AM to 7:29 AM (1,642, 22.9%) for males and 9:00 AM to 9:59 AM (1,269, 20.7%) for females.
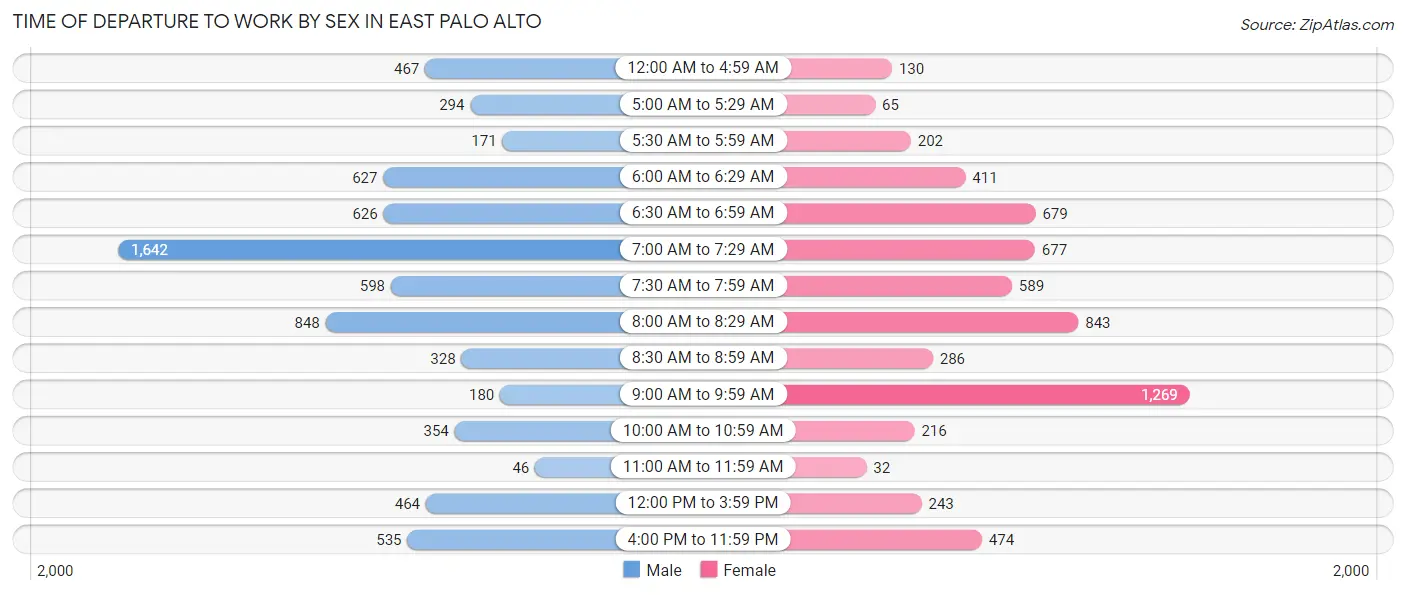
| Time of Departure | Male | Female |
| 12:00 AM to 4:59 AM | 467 (6.5%) | 130 (2.1%) |
| 5:00 AM to 5:29 AM | 294 (4.1%) | 65 (1.1%) |
| 5:30 AM to 5:59 AM | 171 (2.4%) | 202 (3.3%) |
| 6:00 AM to 6:29 AM | 627 (8.7%) | 411 (6.7%) |
| 6:30 AM to 6:59 AM | 626 (8.7%) | 679 (11.1%) |
| 7:00 AM to 7:29 AM | 1,642 (22.9%) | 677 (11.1%) |
| 7:30 AM to 7:59 AM | 598 (8.3%) | 589 (9.6%) |
| 8:00 AM to 8:29 AM | 848 (11.8%) | 843 (13.8%) |
| 8:30 AM to 8:59 AM | 328 (4.6%) | 286 (4.7%) |
| 9:00 AM to 9:59 AM | 180 (2.5%) | 1,269 (20.7%) |
| 10:00 AM to 10:59 AM | 354 (4.9%) | 216 (3.5%) |
| 11:00 AM to 11:59 AM | 46 (0.6%) | 32 (0.5%) |
| 12:00 PM to 3:59 PM | 464 (6.5%) | 243 (4.0%) |
| 4:00 PM to 11:59 PM | 535 (7.4%) | 474 (7.7%) |
| Total | 7,180 (100.0%) | 6,116 (100.0%) |
Housing Occupancy in East Palo Alto
Occupancy by Ownership in East Palo Alto
Of the total 7,998 dwellings in East Palo Alto, owner-occupied units account for 3,813 (47.7%), while renter-occupied units make up 4,185 (52.3%).
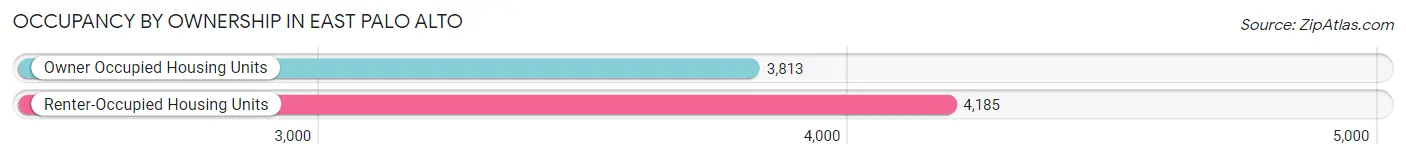
| Occupancy | # Housing Units | % Housing Units |
| Owner Occupied Housing Units | 3,813 | 47.7% |
| Renter-Occupied Housing Units | 4,185 | 52.3% |
| Total Occupied Housing Units | 7,998 | 100.0% |
Occupancy by Household Size in East Palo Alto
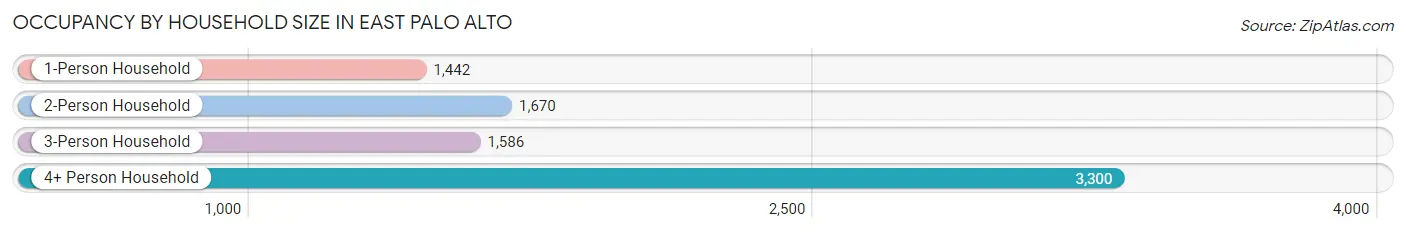
| Household Size | # Housing Units | % Housing Units |
| 1-Person Household | 1,442 | 18.0% |
| 2-Person Household | 1,670 | 20.9% |
| 3-Person Household | 1,586 | 19.8% |
| 4+ Person Household | 3,300 | 41.3% |
| Total Housing Units | 7,998 | 100.0% |
Occupancy by Ownership by Household Size in East Palo Alto
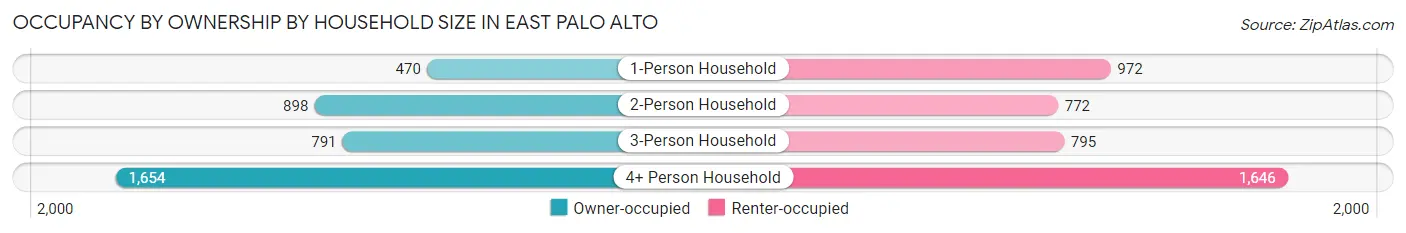
| Household Size | Owner-occupied | Renter-occupied |
| 1-Person Household | 470 (32.6%) | 972 (67.4%) |
| 2-Person Household | 898 (53.8%) | 772 (46.2%) |
| 3-Person Household | 791 (49.9%) | 795 (50.1%) |
| 4+ Person Household | 1,654 (50.1%) | 1,646 (49.9%) |
| Total Housing Units | 3,813 (47.7%) | 4,185 (52.3%) |
Occupancy by Educational Attainment in East Palo Alto
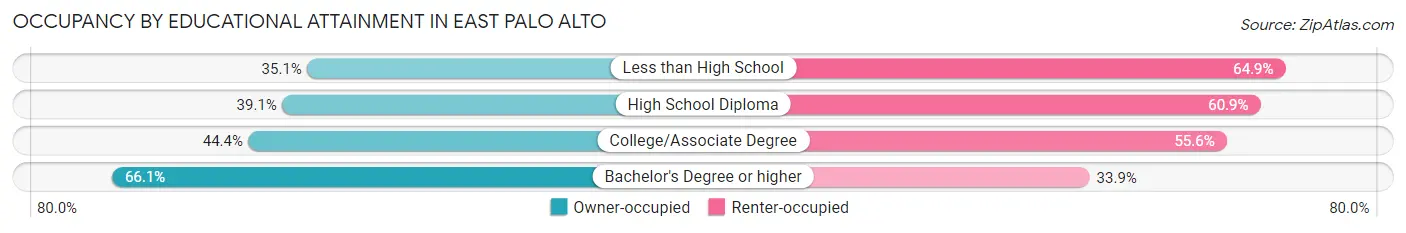
| Household Size | Owner-occupied | Renter-occupied |
| Less than High School | 841 (35.1%) | 1,555 (64.9%) |
| High School Diploma | 452 (39.1%) | 705 (60.9%) |
| College/Associate Degree | 860 (44.4%) | 1,075 (55.6%) |
| Bachelor's Degree or higher | 1,660 (66.1%) | 850 (33.9%) |
Occupancy by Age of Householder in East Palo Alto
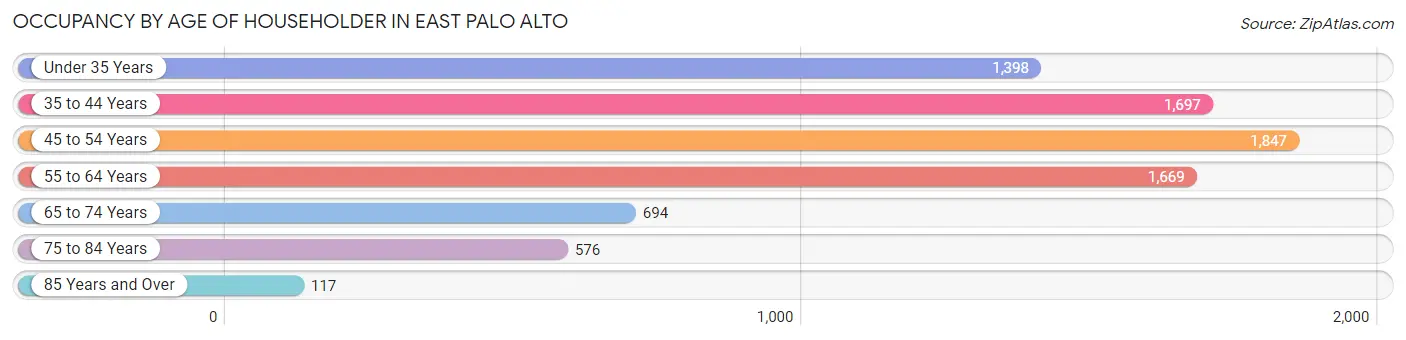
| Age Bracket | # Households | % Households |
| Under 35 Years | 1,398 | 17.5% |
| 35 to 44 Years | 1,697 | 21.2% |
| 45 to 54 Years | 1,847 | 23.1% |
| 55 to 64 Years | 1,669 | 20.9% |
| 65 to 74 Years | 694 | 8.7% |
| 75 to 84 Years | 576 | 7.2% |
| 85 Years and Over | 117 | 1.5% |
| Total | 7,998 | 100.0% |
Housing Finances in East Palo Alto
Median Income by Occupancy in East Palo Alto
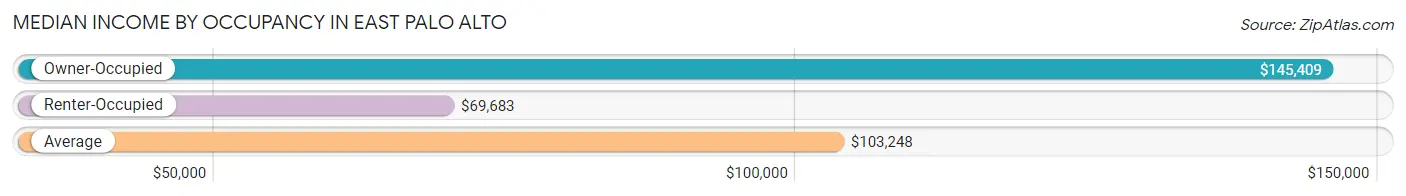
| Occupancy Type | # Households | Median Income |
| Owner-Occupied | 3,813 (47.7%) | $145,409 |
| Renter-Occupied | 4,185 (52.3%) | $69,683 |
| Average | 7,998 (100.0%) | $103,248 |
Occupancy by Householder Income Bracket in East Palo Alto
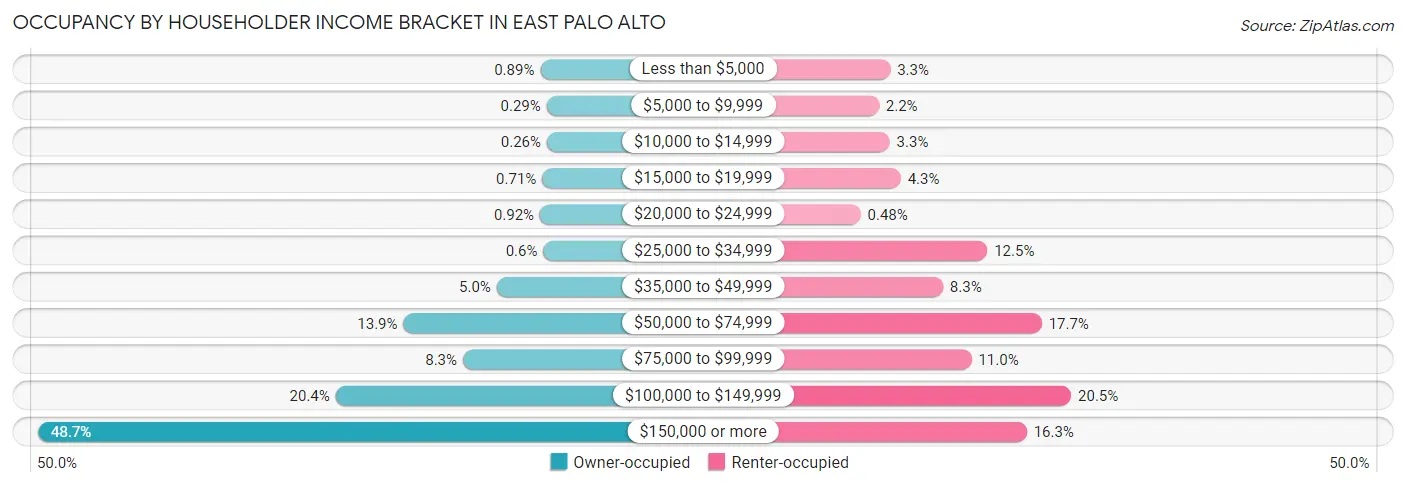
| Income Bracket | Owner-occupied | Renter-occupied |
| Less than $5,000 | 34 (0.9%) | 138 (3.3%) |
| $5,000 to $9,999 | 11 (0.3%) | 93 (2.2%) |
| $10,000 to $14,999 | 10 (0.3%) | 136 (3.3%) |
| $15,000 to $19,999 | 27 (0.7%) | 180 (4.3%) |
| $20,000 to $24,999 | 35 (0.9%) | 20 (0.5%) |
| $25,000 to $34,999 | 23 (0.6%) | 525 (12.5%) |
| $35,000 to $49,999 | 192 (5.0%) | 348 (8.3%) |
| $50,000 to $74,999 | 531 (13.9%) | 742 (17.7%) |
| $75,000 to $99,999 | 315 (8.3%) | 462 (11.0%) |
| $100,000 to $149,999 | 777 (20.4%) | 859 (20.5%) |
| $150,000 or more | 1,858 (48.7%) | 682 (16.3%) |
| Total | 3,813 (100.0%) | 4,185 (100.0%) |
Monthly Housing Cost Tiers in East Palo Alto
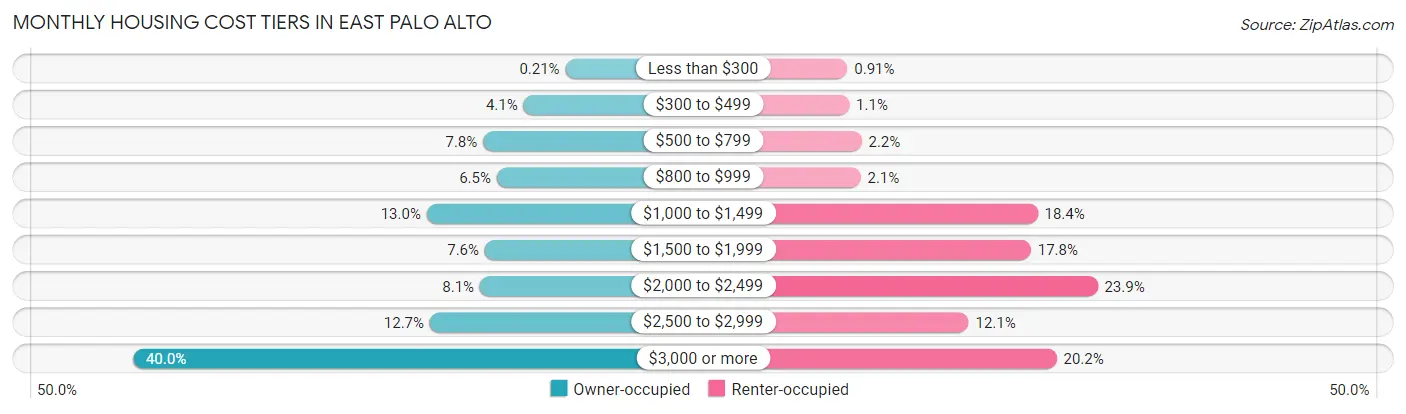
| Monthly Cost | Owner-occupied | Renter-occupied |
| Less than $300 | 8 (0.2%) | 38 (0.9%) |
| $300 to $499 | 155 (4.1%) | 45 (1.1%) |
| $500 to $799 | 297 (7.8%) | 93 (2.2%) |
| $800 to $999 | 249 (6.5%) | 89 (2.1%) |
| $1,000 to $1,499 | 495 (13.0%) | 771 (18.4%) |
| $1,500 to $1,999 | 291 (7.6%) | 745 (17.8%) |
| $2,000 to $2,499 | 308 (8.1%) | 1,002 (23.9%) |
| $2,500 to $2,999 | 484 (12.7%) | 505 (12.1%) |
| $3,000 or more | 1,526 (40.0%) | 844 (20.2%) |
| Total | 3,813 (100.0%) | 4,185 (100.0%) |
Physical Housing Characteristics in East Palo Alto
Housing Structures in East Palo Alto
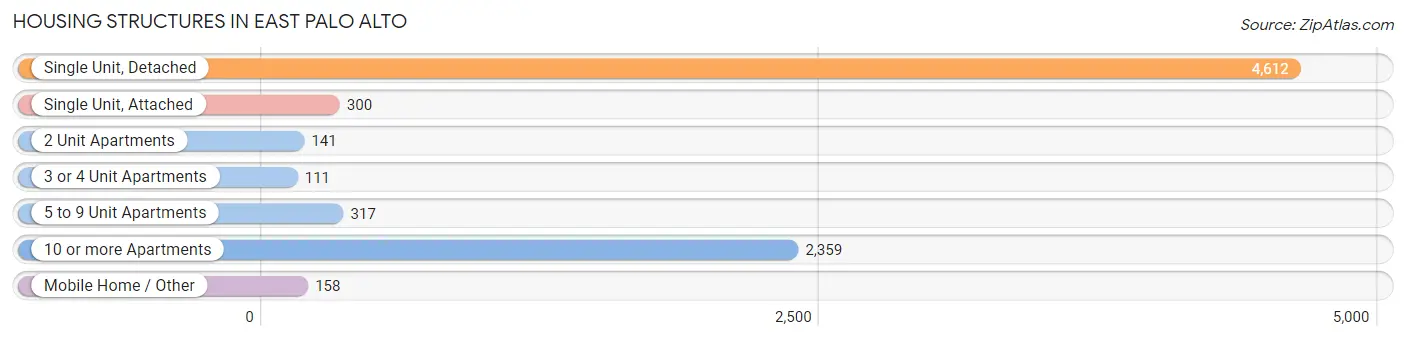
| Structure Type | # Housing Units | % Housing Units |
| Single Unit, Detached | 4,612 | 57.7% |
| Single Unit, Attached | 300 | 3.7% |
| 2 Unit Apartments | 141 | 1.8% |
| 3 or 4 Unit Apartments | 111 | 1.4% |
| 5 to 9 Unit Apartments | 317 | 4.0% |
| 10 or more Apartments | 2,359 | 29.5% |
| Mobile Home / Other | 158 | 2.0% |
| Total | 7,998 | 100.0% |
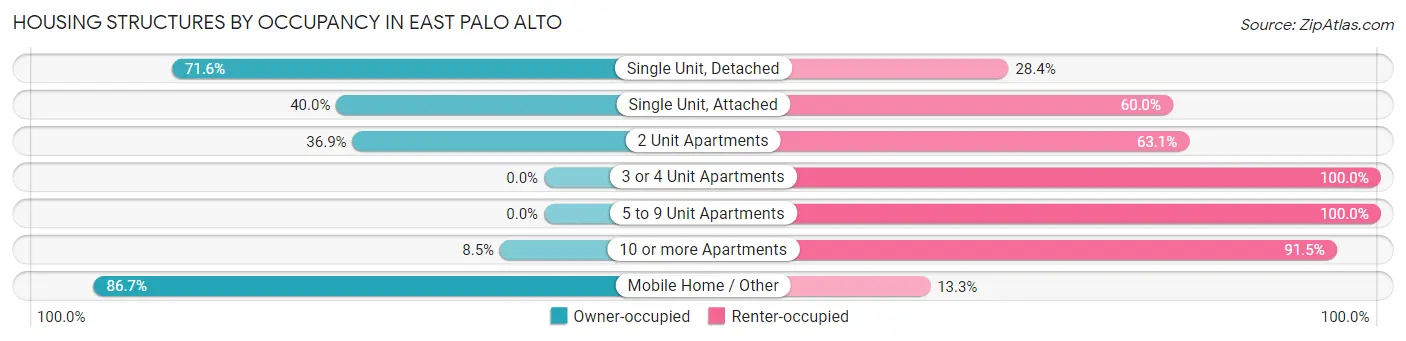
Housing Structures by Occupancy in East Palo Alto
| Structure Type | Owner-occupied | Renter-occupied |
| Single Unit, Detached | 3,304 (71.6%) | 1,308 (28.4%) |
| Single Unit, Attached | 120 (40.0%) | 180 (60.0%) |
| 2 Unit Apartments | 52 (36.9%) | 89 (63.1%) |
| 3 or 4 Unit Apartments | 0 (0.0%) | 111 (100.0%) |
| 5 to 9 Unit Apartments | 0 (0.0%) | 317 (100.0%) |
| 10 or more Apartments | 200 (8.5%) | 2,159 (91.5%) |
| Mobile Home / Other | 137 (86.7%) | 21 (13.3%) |
| Total | 3,813 (47.7%) | 4,185 (52.3%) |
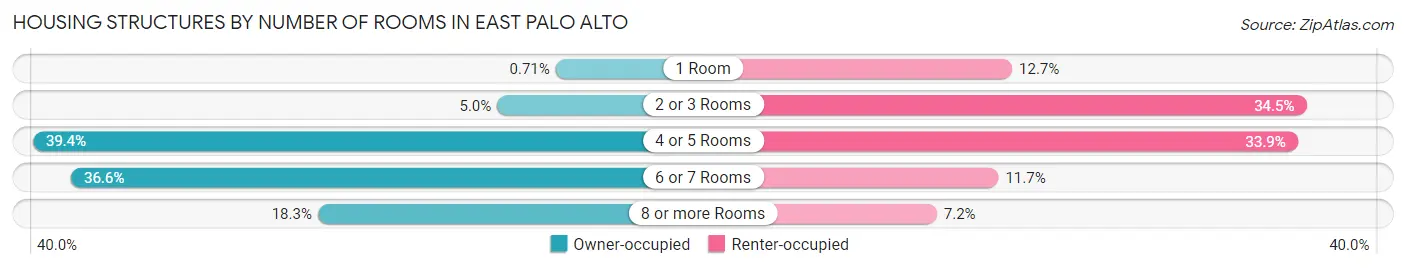
Housing Structures by Number of Rooms in East Palo Alto
| Number of Rooms | Owner-occupied | Renter-occupied |
| 1 Room | 27 (0.7%) | 533 (12.7%) |
| 2 or 3 Rooms | 192 (5.0%) | 1,444 (34.5%) |
| 4 or 5 Rooms | 1,502 (39.4%) | 1,417 (33.9%) |
| 6 or 7 Rooms | 1,394 (36.6%) | 491 (11.7%) |
| 8 or more Rooms | 698 (18.3%) | 300 (7.2%) |
| Total | 3,813 (100.0%) | 4,185 (100.0%) |
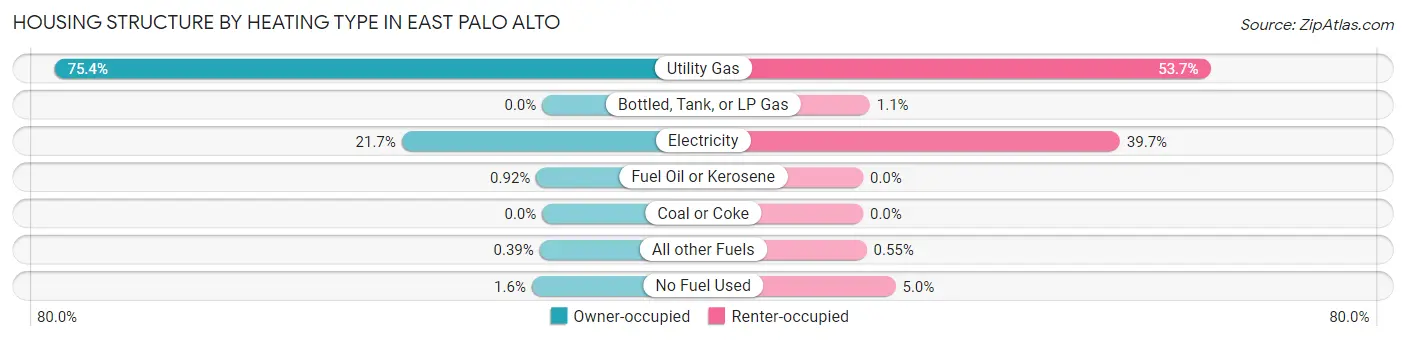
Housing Structure by Heating Type in East Palo Alto
| Heating Type | Owner-occupied | Renter-occupied |
| Utility Gas | 2,874 (75.4%) | 2,246 (53.7%) |
| Bottled, Tank, or LP Gas | 0 (0.0%) | 44 (1.1%) |
| Electricity | 828 (21.7%) | 1,662 (39.7%) |
| Fuel Oil or Kerosene | 35 (0.9%) | 0 (0.0%) |
| Coal or Coke | 0 (0.0%) | 0 (0.0%) |
| All other Fuels | 15 (0.4%) | 23 (0.5%) |
| No Fuel Used | 61 (1.6%) | 210 (5.0%) |
| Total | 3,813 (100.0%) | 4,185 (100.0%) |
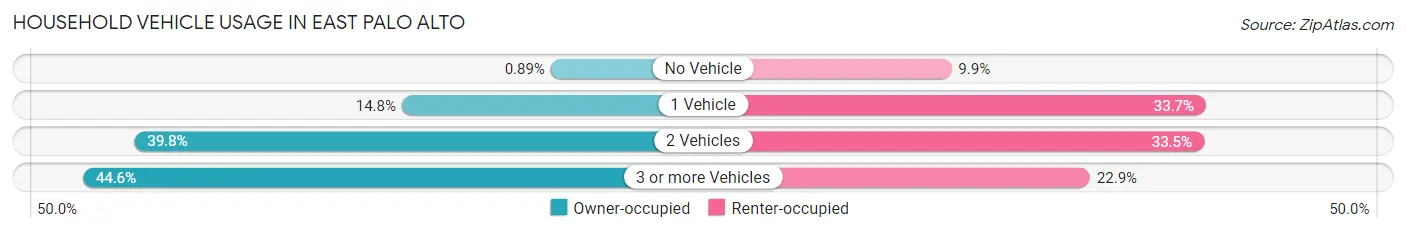
Household Vehicle Usage in East Palo Alto
| Vehicles per Household | Owner-occupied | Renter-occupied |
| No Vehicle | 34 (0.9%) | 416 (9.9%) |
| 1 Vehicle | 564 (14.8%) | 1,410 (33.7%) |
| 2 Vehicles | 1,516 (39.8%) | 1,402 (33.5%) |
| 3 or more Vehicles | 1,699 (44.6%) | 957 (22.9%) |
| Total | 3,813 (100.0%) | 4,185 (100.0%) |
Real Estate & Mortgages in East Palo Alto
Real Estate and Mortgage Overview in East Palo Alto
| Characteristic | Without Mortgage | With Mortgage |
| Housing Units | 1,248 | 2,565 |
| Median Property Value | $1,049,500 | $1,095,000 |
| Median Household Income | $136,317 | $1,287 |
| Monthly Housing Costs | $963 | $1,526 |
| Real Estate Taxes | $6,037 | $0 |
Property Value by Mortgage Status in East Palo Alto
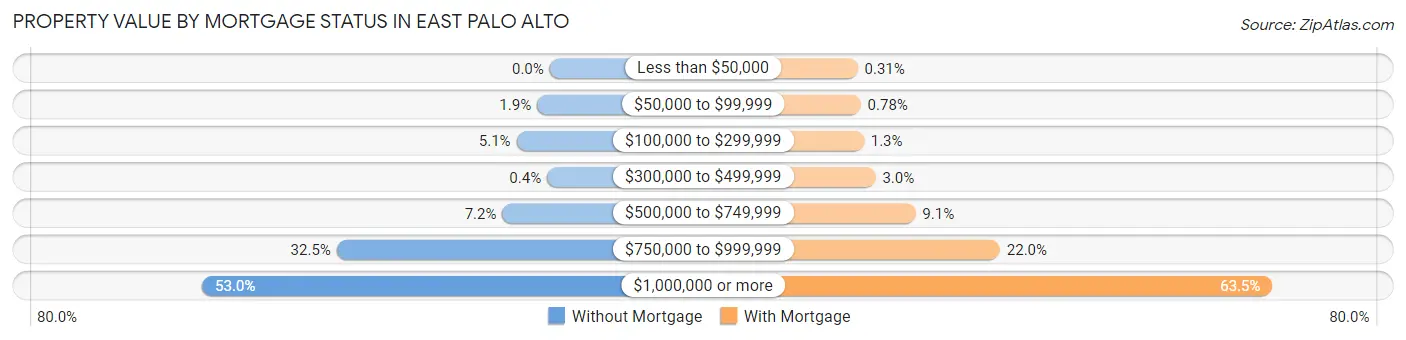
| Property Value | Without Mortgage | With Mortgage |
| Less than $50,000 | 0 (0.0%) | 8 (0.3%) |
| $50,000 to $99,999 | 24 (1.9%) | 20 (0.8%) |
| $100,000 to $299,999 | 63 (5.1%) | 32 (1.3%) |
| $300,000 to $499,999 | 5 (0.4%) | 78 (3.0%) |
| $500,000 to $749,999 | 90 (7.2%) | 234 (9.1%) |
| $750,000 to $999,999 | 405 (32.5%) | 564 (22.0%) |
| $1,000,000 or more | 661 (53.0%) | 1,629 (63.5%) |
| Total | 1,248 (100.0%) | 2,565 (100.0%) |
Household Income by Mortgage Status in East Palo Alto
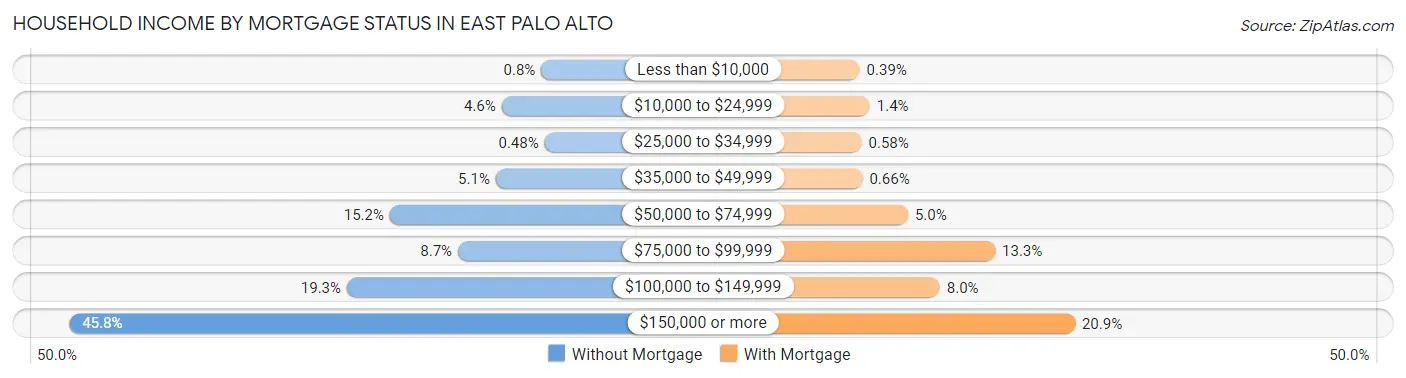
| Household Income | Without Mortgage | With Mortgage |
| Less than $10,000 | 10 (0.8%) | 10 (0.4%) |
| $10,000 to $24,999 | 57 (4.6%) | 35 (1.4%) |
| $25,000 to $34,999 | 6 (0.5%) | 15 (0.6%) |
| $35,000 to $49,999 | 64 (5.1%) | 17 (0.7%) |
| $50,000 to $74,999 | 190 (15.2%) | 128 (5.0%) |
| $75,000 to $99,999 | 109 (8.7%) | 341 (13.3%) |
| $100,000 to $149,999 | 241 (19.3%) | 206 (8.0%) |
| $150,000 or more | 571 (45.8%) | 536 (20.9%) |
| Total | 1,248 (100.0%) | 2,565 (100.0%) |
Property Value to Household Income Ratio in East Palo Alto
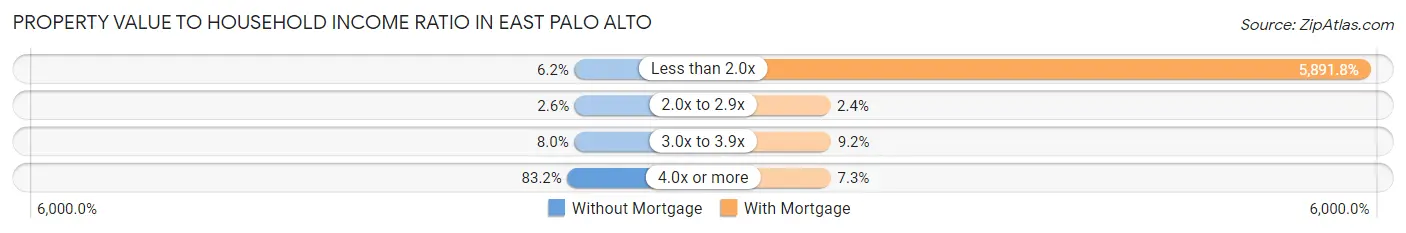
| Value-to-Income Ratio | Without Mortgage | With Mortgage |
| Less than 2.0x | 77 (6.2%) | 151,125 (5,891.8%) |
| 2.0x to 2.9x | 33 (2.6%) | 61 (2.4%) |
| 3.0x to 3.9x | 100 (8.0%) | 235 (9.2%) |
| 4.0x or more | 1,038 (83.2%) | 186 (7.2%) |
| Total | 1,248 (100.0%) | 2,565 (100.0%) |
Real Estate Taxes by Mortgage Status in East Palo Alto
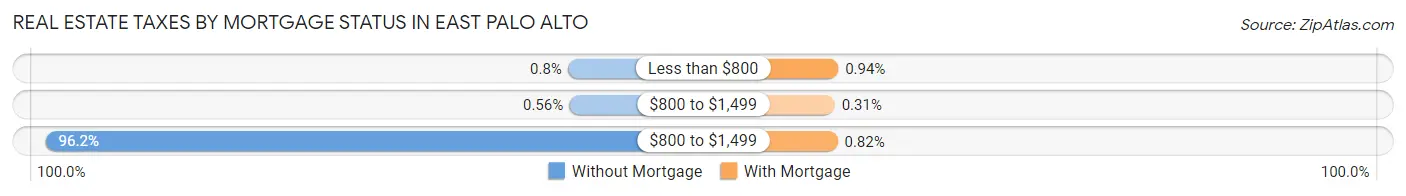
| Property Taxes | Without Mortgage | With Mortgage |
| Less than $800 | 10 (0.8%) | 24 (0.9%) |
| $800 to $1,499 | 7 (0.6%) | 8 (0.3%) |
| $800 to $1,499 | 1,200 (96.2%) | 21 (0.8%) |
| Total | 1,248 (100.0%) | 2,565 (100.0%) |
Health & Disability in East Palo Alto
Health Insurance Coverage by Age in East Palo Alto
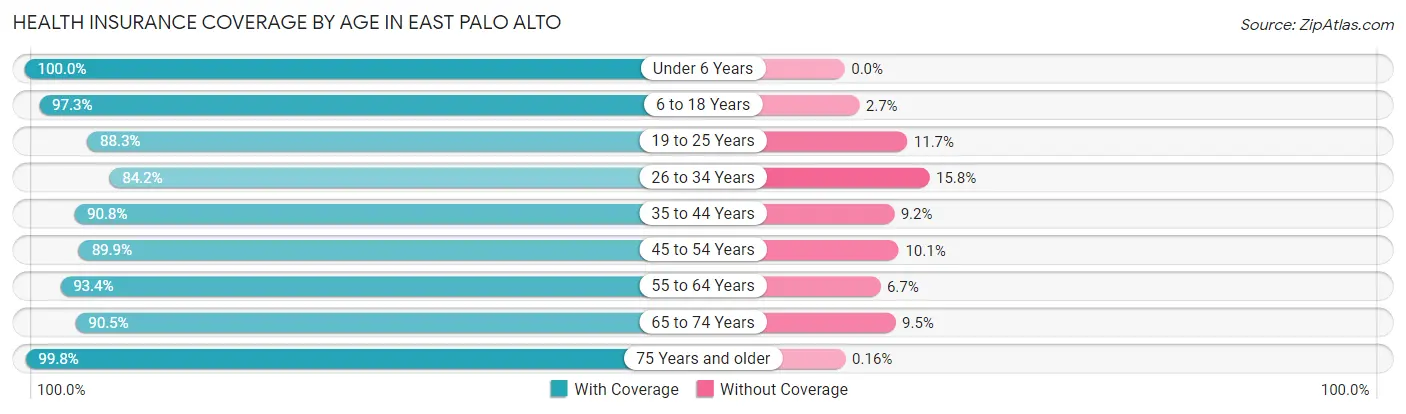
| Age Bracket | With Coverage | Without Coverage |
| Under 6 Years | 2,432 (100.0%) | 0 (0.0%) |
| 6 to 18 Years | 4,634 (97.3%) | 129 (2.7%) |
| 19 to 25 Years | 2,747 (88.3%) | 363 (11.7%) |
| 26 to 34 Years | 3,948 (84.2%) | 741 (15.8%) |
| 35 to 44 Years | 3,958 (90.8%) | 402 (9.2%) |
| 45 to 54 Years | 3,320 (89.9%) | 373 (10.1%) |
| 55 to 64 Years | 3,385 (93.3%) | 241 (6.7%) |
| 65 to 74 Years | 1,415 (90.5%) | 148 (9.5%) |
| 75 Years and older | 1,254 (99.8%) | 2 (0.2%) |
| Total | 27,093 (91.9%) | 2,399 (8.1%) |
Health Insurance Coverage by Citizenship Status in East Palo Alto
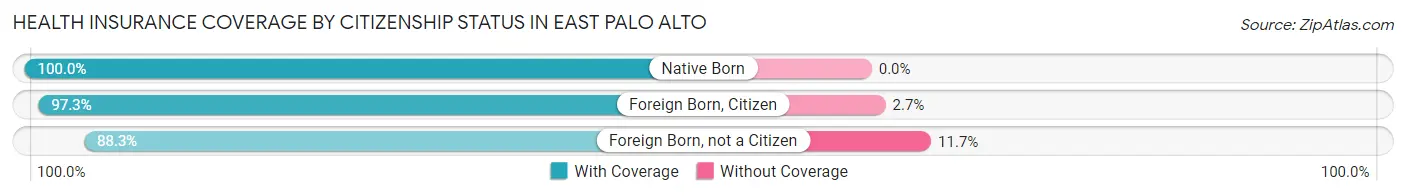
| Citizenship Status | With Coverage | Without Coverage |
| Native Born | 2,432 (100.0%) | 0 (0.0%) |
| Foreign Born, Citizen | 4,634 (97.3%) | 129 (2.7%) |
| Foreign Born, not a Citizen | 2,747 (88.3%) | 363 (11.7%) |
Health Insurance Coverage by Household Income in East Palo Alto
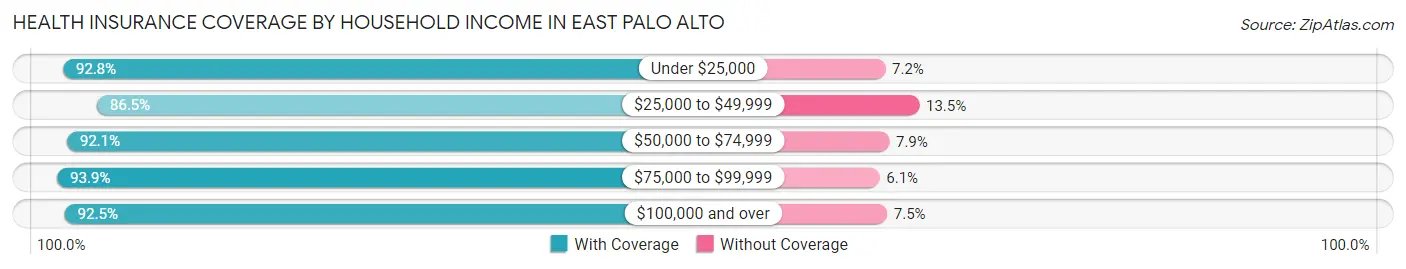
| Household Income | With Coverage | Without Coverage |
| Under $25,000 | 1,347 (92.8%) | 104 (7.2%) |
| $25,000 to $49,999 | 3,232 (86.5%) | 506 (13.5%) |
| $50,000 to $74,999 | 3,425 (92.1%) | 294 (7.9%) |
| $75,000 to $99,999 | 2,803 (93.9%) | 182 (6.1%) |
| $100,000 and over | 16,054 (92.5%) | 1,304 (7.5%) |
Public vs Private Health Insurance Coverage by Age in East Palo Alto
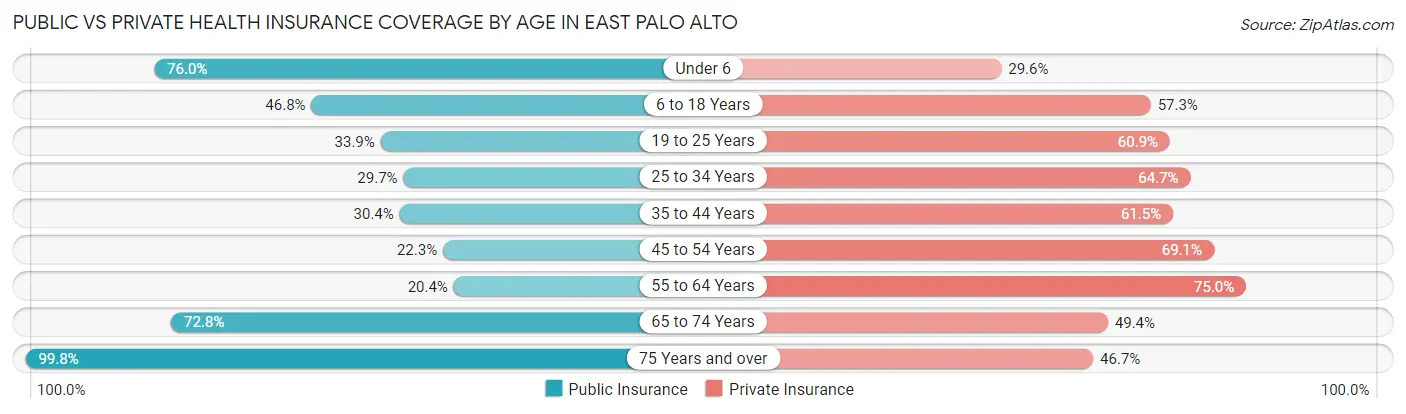
| Age Bracket | Public Insurance | Private Insurance |
| Under 6 | 1,847 (75.9%) | 720 (29.6%) |
| 6 to 18 Years | 2,227 (46.8%) | 2,731 (57.3%) |
| 19 to 25 Years | 1,055 (33.9%) | 1,894 (60.9%) |
| 25 to 34 Years | 1,392 (29.7%) | 3,034 (64.7%) |
| 35 to 44 Years | 1,325 (30.4%) | 2,680 (61.5%) |
| 45 to 54 Years | 825 (22.3%) | 2,550 (69.1%) |
| 55 to 64 Years | 738 (20.3%) | 2,721 (75.0%) |
| 65 to 74 Years | 1,138 (72.8%) | 772 (49.4%) |
| 75 Years and over | 1,254 (99.8%) | 586 (46.7%) |
| Total | 11,801 (40.0%) | 17,688 (60.0%) |
Disability Status by Sex by Age in East Palo Alto
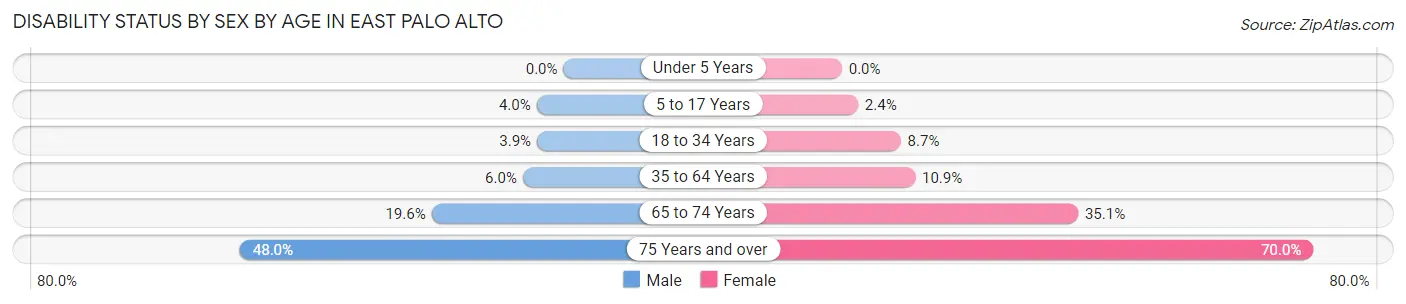
| Age Bracket | Male | Female |
| Under 5 Years | 0 (0.0%) | 0 (0.0%) |
| 5 to 17 Years | 103 (4.0%) | 59 (2.4%) |
| 18 to 34 Years | 160 (3.9%) | 362 (8.7%) |
| 35 to 64 Years | 351 (6.0%) | 637 (10.9%) |
| 65 to 74 Years | 129 (19.6%) | 317 (35.1%) |
| 75 Years and over | 219 (48.0%) | 560 (70.0%) |
Disability Class by Sex by Age in East Palo Alto
Disability Class: Hearing Difficulty
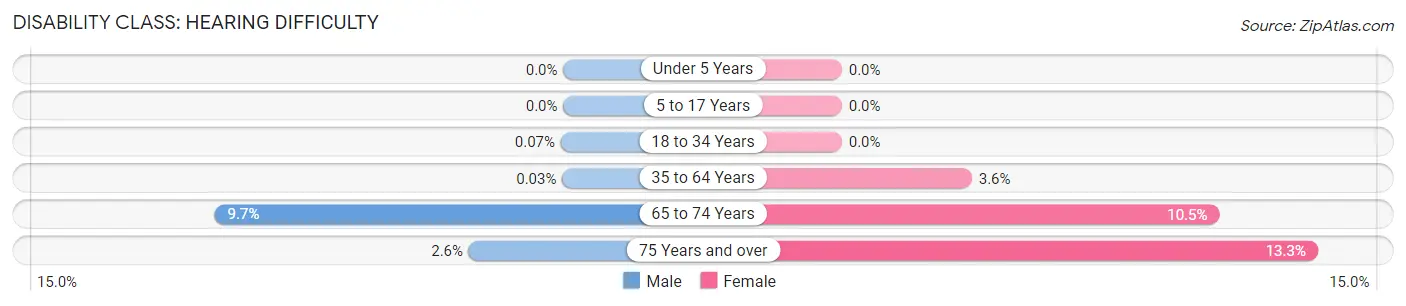
| Age Bracket | Male | Female |
| Under 5 Years | 0 (0.0%) | 0 (0.0%) |
| 5 to 17 Years | 0 (0.0%) | 0 (0.0%) |
| 18 to 34 Years | 3 (0.1%) | 0 (0.0%) |
| 35 to 64 Years | 2 (0.0%) | 212 (3.6%) |
| 65 to 74 Years | 64 (9.7%) | 95 (10.5%) |
| 75 Years and over | 12 (2.6%) | 106 (13.3%) |
Disability Class: Vision Difficulty
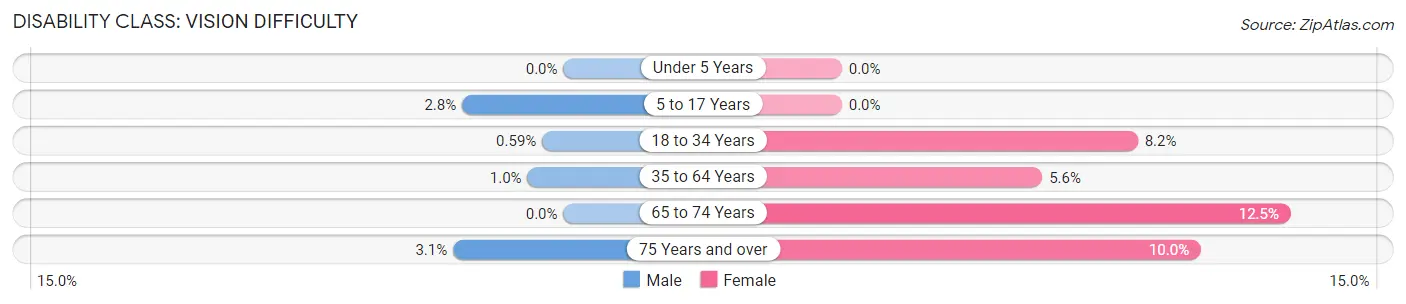
| Age Bracket | Male | Female |
| Under 5 Years | 0 (0.0%) | 0 (0.0%) |
| 5 to 17 Years | 73 (2.8%) | 0 (0.0%) |
| 18 to 34 Years | 24 (0.6%) | 341 (8.2%) |
| 35 to 64 Years | 58 (1.0%) | 327 (5.6%) |
| 65 to 74 Years | 0 (0.0%) | 113 (12.5%) |
| 75 Years and over | 14 (3.1%) | 80 (10.0%) |
Disability Class: Cognitive Difficulty
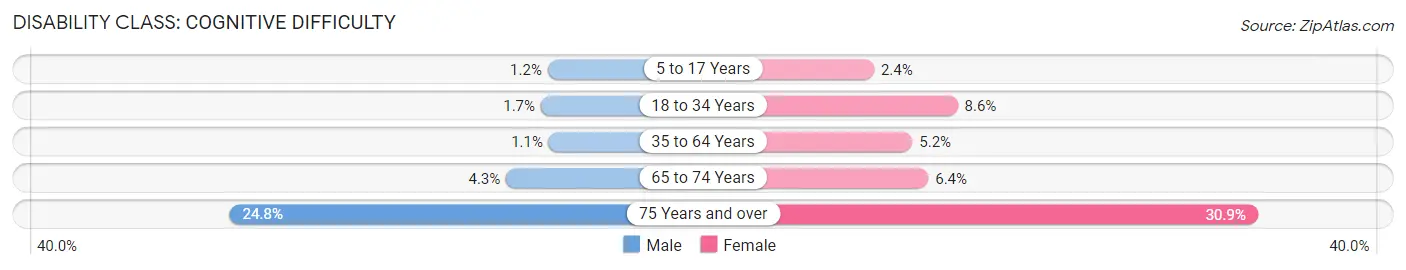
| Age Bracket | Male | Female |
| 5 to 17 Years | 30 (1.2%) | 59 (2.4%) |
| 18 to 34 Years | 68 (1.7%) | 356 (8.6%) |
| 35 to 64 Years | 63 (1.1%) | 307 (5.2%) |
| 65 to 74 Years | 28 (4.3%) | 58 (6.4%) |
| 75 Years and over | 113 (24.8%) | 247 (30.9%) |
Disability Class: Ambulatory Difficulty
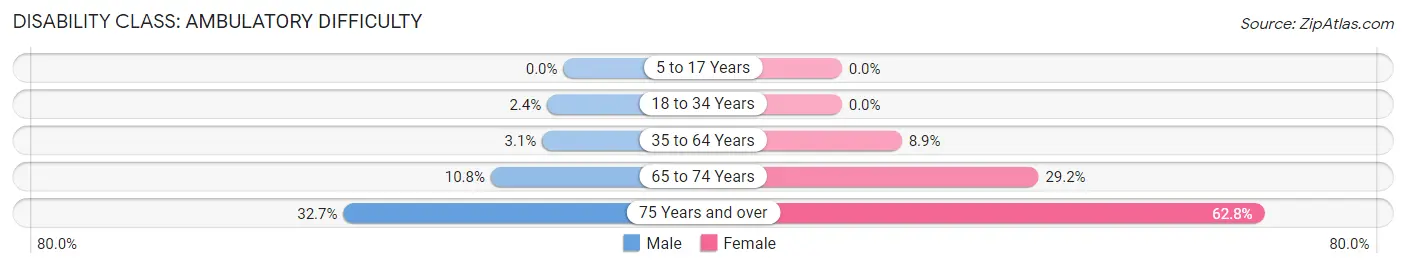
| Age Bracket | Male | Female |
| 5 to 17 Years | 0 (0.0%) | 0 (0.0%) |
| 18 to 34 Years | 99 (2.4%) | 0 (0.0%) |
| 35 to 64 Years | 183 (3.1%) | 521 (8.9%) |
| 65 to 74 Years | 71 (10.8%) | 264 (29.2%) |
| 75 Years and over | 149 (32.7%) | 502 (62.7%) |
Disability Class: Self-Care Difficulty
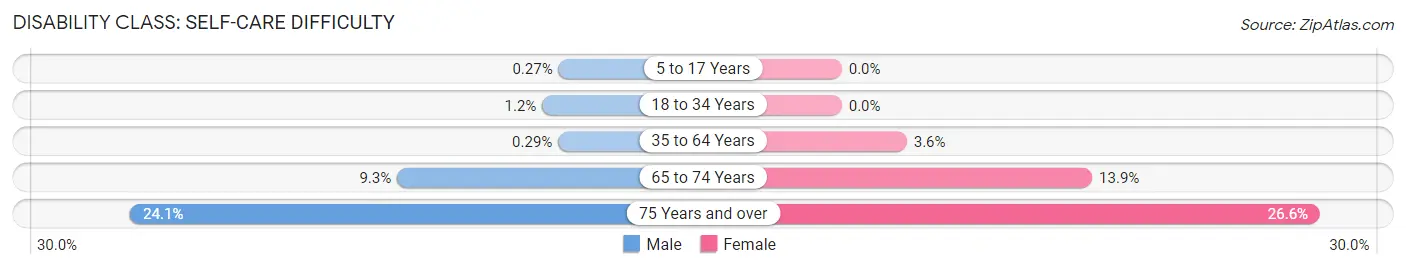
| Age Bracket | Male | Female |
| 5 to 17 Years | 7 (0.3%) | 0 (0.0%) |
| 18 to 34 Years | 48 (1.2%) | 0 (0.0%) |
| 35 to 64 Years | 17 (0.3%) | 212 (3.6%) |
| 65 to 74 Years | 61 (9.3%) | 126 (13.9%) |
| 75 Years and over | 110 (24.1%) | 213 (26.6%) |
Technology Access in East Palo Alto
Computing Device Access in East Palo Alto
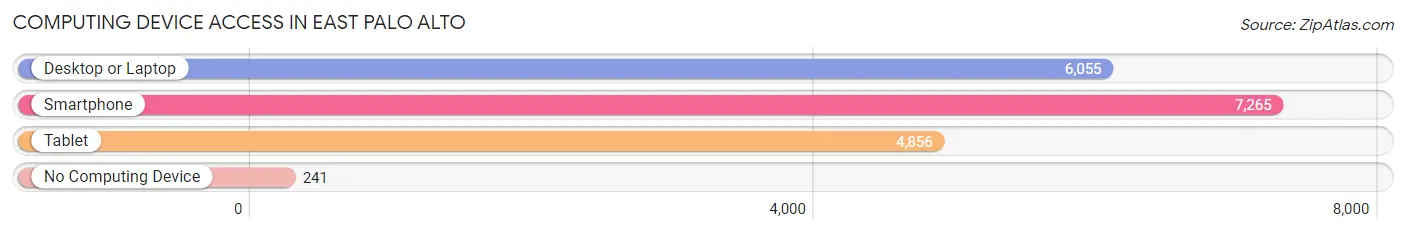
| Device Type | # Households | % Households |
| Desktop or Laptop | 6,055 | 75.7% |
| Smartphone | 7,265 | 90.8% |
| Tablet | 4,856 | 60.7% |
| No Computing Device | 241 | 3.0% |
| Total | 7,998 | 100.0% |
Internet Access in East Palo Alto
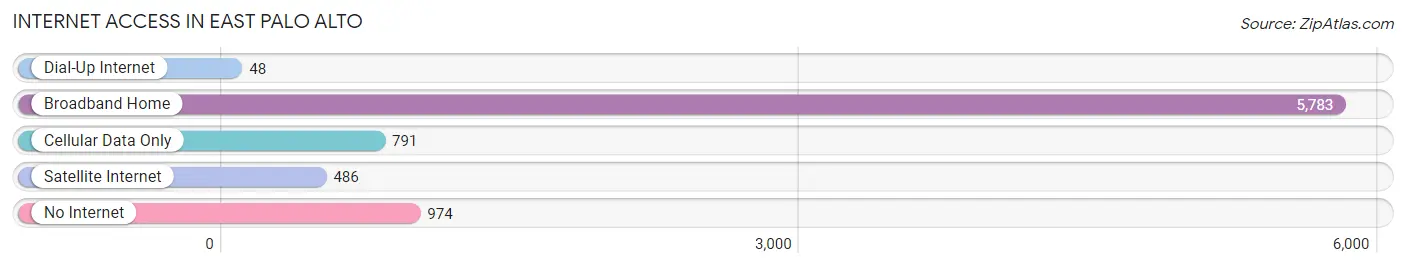
| Internet Type | # Households | % Households |
| Dial-Up Internet | 48 | 0.6% |
| Broadband Home | 5,783 | 72.3% |
| Cellular Data Only | 791 | 9.9% |
| Satellite Internet | 486 | 6.1% |
| No Internet | 974 | 12.2% |
| Total | 7,998 | 100.0% |
East Palo Alto Summary
History
East Palo Alto is a city located in San Mateo County, California, United States. It is situated on the eastern side of the San Francisco Bay, across the Dumbarton Bridge from the city of Palo Alto. East Palo Alto was incorporated in 1983, and is the only city in the county that is predominantly African American.
East Palo Alto has a long and rich history. The area was originally inhabited by the Ohlone people, who lived in the area for thousands of years before the arrival of Europeans. The first Europeans to settle in the area were the Spanish, who established a mission in 1777. The area was then part of the Rancho de las Pulgas, a Mexican land grant.
In the late 19th century, the area was developed as a farming community, with many of the farms owned by Italian immigrants. The area was known as Ravenswood, and was annexed by the city of Palo Alto in 1925.
In the 1950s, the area began to experience rapid population growth, as African Americans moved to the area from the South. This influx of new residents led to overcrowding and poverty, and the area became known as the “Danger Zone” due to its high crime rate.
In 1983, the residents of East Palo Alto voted to incorporate as a city, in order to gain more control over their own destiny. Since then, the city has worked to improve its economy and quality of life.
Geography
East Palo Alto is located in San Mateo County, California, on the eastern side of the San Francisco Bay. It is bordered by the cities of Palo Alto, Menlo Park, and Redwood City. The city covers an area of 4.5 square miles, and has a population of approximately 30,000 people.
The city is situated on the San Francisco Bay, and is crossed by several creeks, including San Francisquito Creek, Adobe Creek, and San Antonio Creek. The city is also home to several parks, including the Ravenswood Open Space Preserve, which is a popular destination for hikers and birdwatchers.
Economy
East Palo Alto’s economy is largely based on technology and services. The city is home to several technology companies, including Hewlett-Packard, Facebook, and Google. The city is also home to several retail stores, restaurants, and other businesses.
The city’s unemployment rate is higher than the national average, and the median household income is lower than the national average. The city has been working to attract new businesses and create jobs, and has seen some success in recent years.
Demographics
East Palo Alto is a diverse city, with a population of approximately 30,000 people. The city is predominantly African American, with a large Hispanic population as well. The city also has a significant Asian population, and a small but growing white population.
The median household income in East Palo Alto is lower than the national average, and the poverty rate is higher than the national average. The city has a high rate of crime, and is considered to be one of the most dangerous cities in the United States.
Conclusion
East Palo Alto is a city located in San Mateo County, California, United States. It is situated on the eastern side of the San Francisco Bay, across the Dumbarton Bridge from the city of Palo Alto. East Palo Alto was incorporated in 1983, and is the only city in the county that is predominantly African American. The city has a long and rich history, and is home to several technology companies, retail stores, restaurants, and other businesses. The city is diverse, with a population of approximately 30,000 people, and a median household income that is lower than the national average. East Palo Alto has a high rate of crime, and is considered to be one of the most dangerous cities in the United States.
Common Questions
What is Per Capita Income in East Palo Alto?
Per Capita income in East Palo Alto is $37,736.
What is the Median Family Income in East Palo Alto?
Median Family Income in East Palo Alto is $101,526.
What is the Median Household income in East Palo Alto?
Median Household Income in East Palo Alto is $103,248.
What is Income or Wage Gap in East Palo Alto?
Income or Wage Gap in East Palo Alto is 20.2%.
Women in East Palo Alto earn 79.8 cents for every dollar earned by a man.
What is Inequality or Gini Index in East Palo Alto?
Inequality or Gini Index in East Palo Alto is 0.44.
What is the Total Population of East Palo Alto?
Total Population of East Palo Alto is 29,520.
What is the Total Male Population of East Palo Alto?
Total Male Population of East Palo Alto is 14,439.
What is the Total Female Population of East Palo Alto?
Total Female Population of East Palo Alto is 15,081.
What is the Ratio of Males per 100 Females in East Palo Alto?
There are 95.74 Males per 100 Females in East Palo Alto.
What is the Ratio of Females per 100 Males in East Palo Alto?
There are 104.45 Females per 100 Males in East Palo Alto.
What is the Median Population Age in East Palo Alto?
Median Population Age in East Palo Alto is 34.3 Years.
What is the Average Family Size in East Palo Alto
Average Family Size in East Palo Alto is 4.1 People.
What is the Average Household Size in East Palo Alto
Average Household Size in East Palo Alto is 3.7 People.
How Large is the Labor Force in East Palo Alto?
There are 16,450 People in the Labor Forcein in East Palo Alto.
What is the Percentage of People in the Labor Force in East Palo Alto?
68.6% of People are in the Labor Force in East Palo Alto.
What is the Unemployment Rate in East Palo Alto?
Unemployment Rate in East Palo Alto is 5.0%.