Zip Codes with the Highest Percentage of Population with a Degree in Physical and Health Sciences in San Jacinto, CA
RELATED REPORTS & OPTIONS
Physical and Health Sciences
San Jacinto
Compare Zip Codes
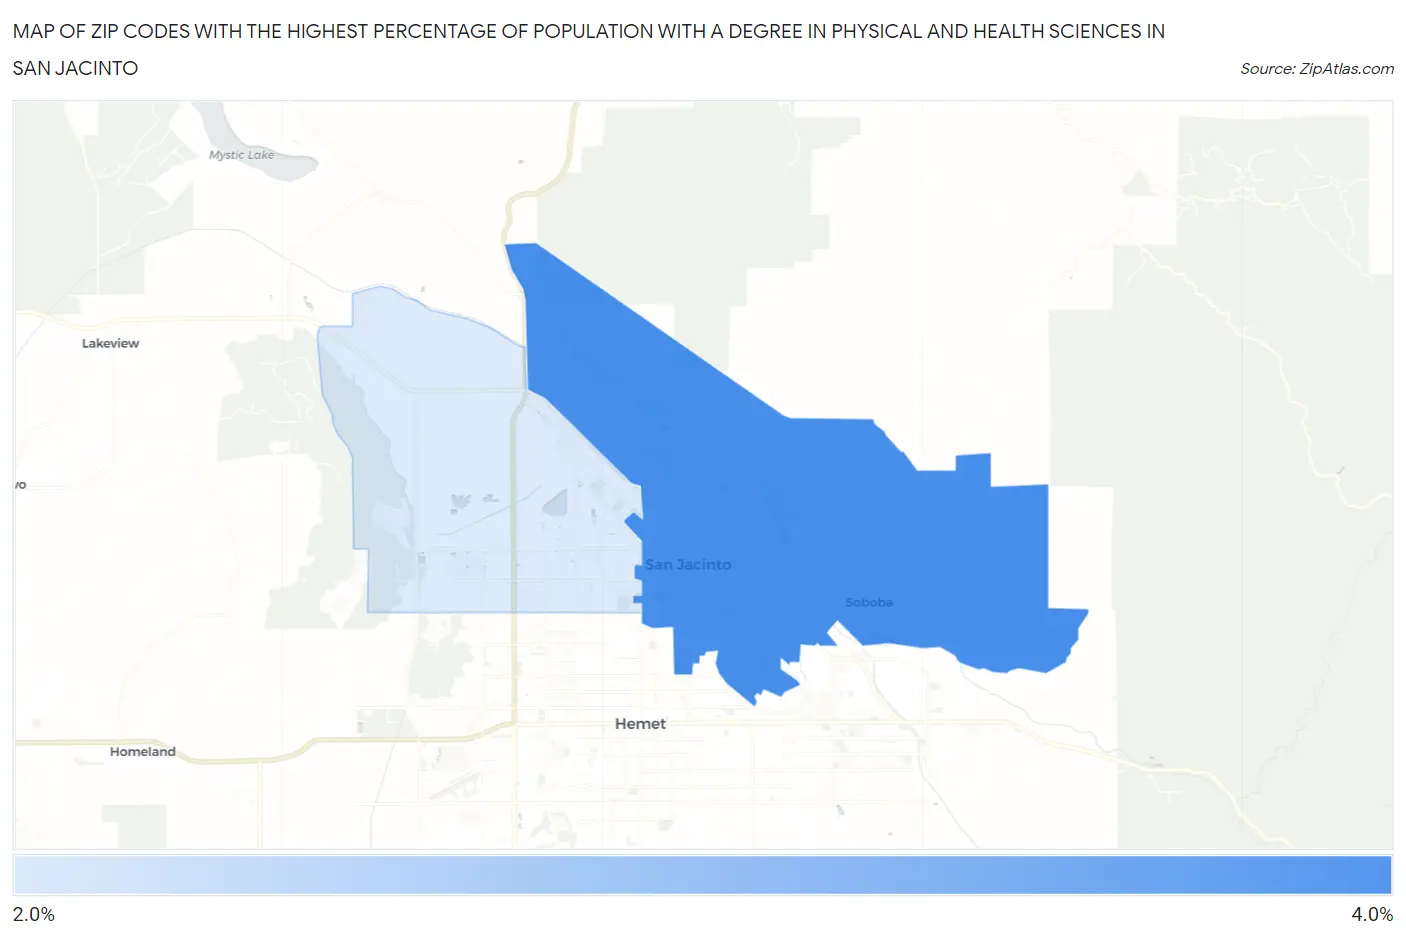
Map of Zip Codes with the Highest Percentage of Population with a Degree in Physical and Health Sciences in San Jacinto
2.2%
3.8%
Zip Codes with the Highest Percentage of Population with a Degree in Physical and Health Sciences in San Jacinto, CA
| Zip Code | % Graduates | vs State | vs National | |
| 1. | 92583 | 3.8% | 3.1%(+0.637)#415 | 3.1%(+0.652)#7,525 |
| 2. | 92582 | 2.2% | 3.1%(-0.959)#955 | 3.1%(-0.943)#14,339 |
1
Common Questions
What are the Top Zip Codes with the Highest Percentage of Population with a Degree in Physical and Health Sciences in San Jacinto, CA?
Top Zip Codes with the Highest Percentage of Population with a Degree in Physical and Health Sciences in San Jacinto, CA are:
What zip code has the Highest Percentage of Population with a Degree in Physical and Health Sciences in San Jacinto, CA?
92583 has the Highest Percentage of Population with a Degree in Physical and Health Sciences in San Jacinto, CA with 3.8%.
What is the Percentage of Population with a Degree in Physical and Health Sciences in San Jacinto, CA?
Percentage of Population with a Degree in Physical and Health Sciences in San Jacinto is 3.1%.
What is the Percentage of Population with a Degree in Physical and Health Sciences in California?
Percentage of Population with a Degree in Physical and Health Sciences in California is 3.1%.
What is the Percentage of Population with a Degree in Physical and Health Sciences in the United States?
Percentage of Population with a Degree in Physical and Health Sciences in the United States is 3.1%.