Cutten, CA Map & Demographics
Cutten Map
Cutten Overview
$38,912
PER CAPITA INCOME
$103,194
AVG FAMILY INCOME
$89,728
AVG HOUSEHOLD INCOME
0.33
INEQUALITY / GINI INDEX
3,309
TOTAL POPULATION
1,657
MALE POPULATION
1,652
FEMALE POPULATION
100.30
MALES / 100 FEMALES
99.70
FEMALES / 100 MALES
39.4
MEDIAN AGE
3.2
AVG FAMILY SIZE
2.6
AVG HOUSEHOLD SIZE
1,344
LABOR FORCE [ PEOPLE ]
52.6%
PERCENT IN LABOR FORCE
3.9%
UNEMPLOYMENT RATE
Cutten Area Codes
Income in Cutten
Income Overview in Cutten
Per Capita Income in Cutten is $38,912, while median incomes of families and households are $103,194 and $89,728 respectively.
| Characteristic | Number | Measure |
| Per Capita Income | 3,309 | $38,912 |
| Median Family Income | 862 | $103,194 |
| Mean Family Income | 862 | $112,142 |
| Median Household Income | 1,240 | $89,728 |
| Mean Household Income | 1,240 | $103,706 |
| Income Deficit | 862 | $0 |
| Wage / Income Gap (%) | 3,309 | 0.00% |
| Wage / Income Gap ($) | 3,309 | 100.00¢ per $1 |
| Gini / Inequality Index | 3,309 | 0.33 |
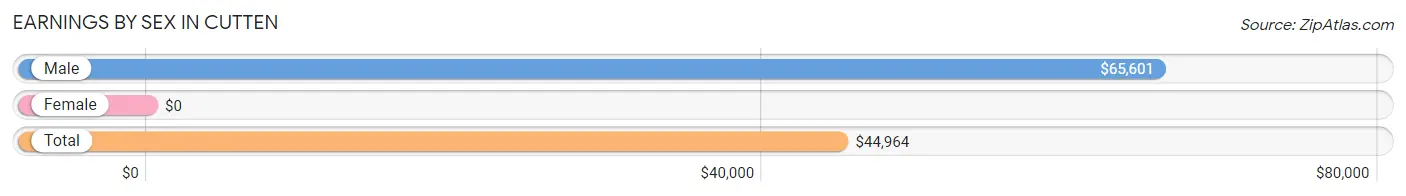
Earnings by Sex in Cutten
| Sex | Number | Average Earnings |
| Male | 781 (51.4%) | $65,601 |
| Female | 738 (48.6%) | $0 |
| Total | 1,519 (100.0%) | $44,964 |
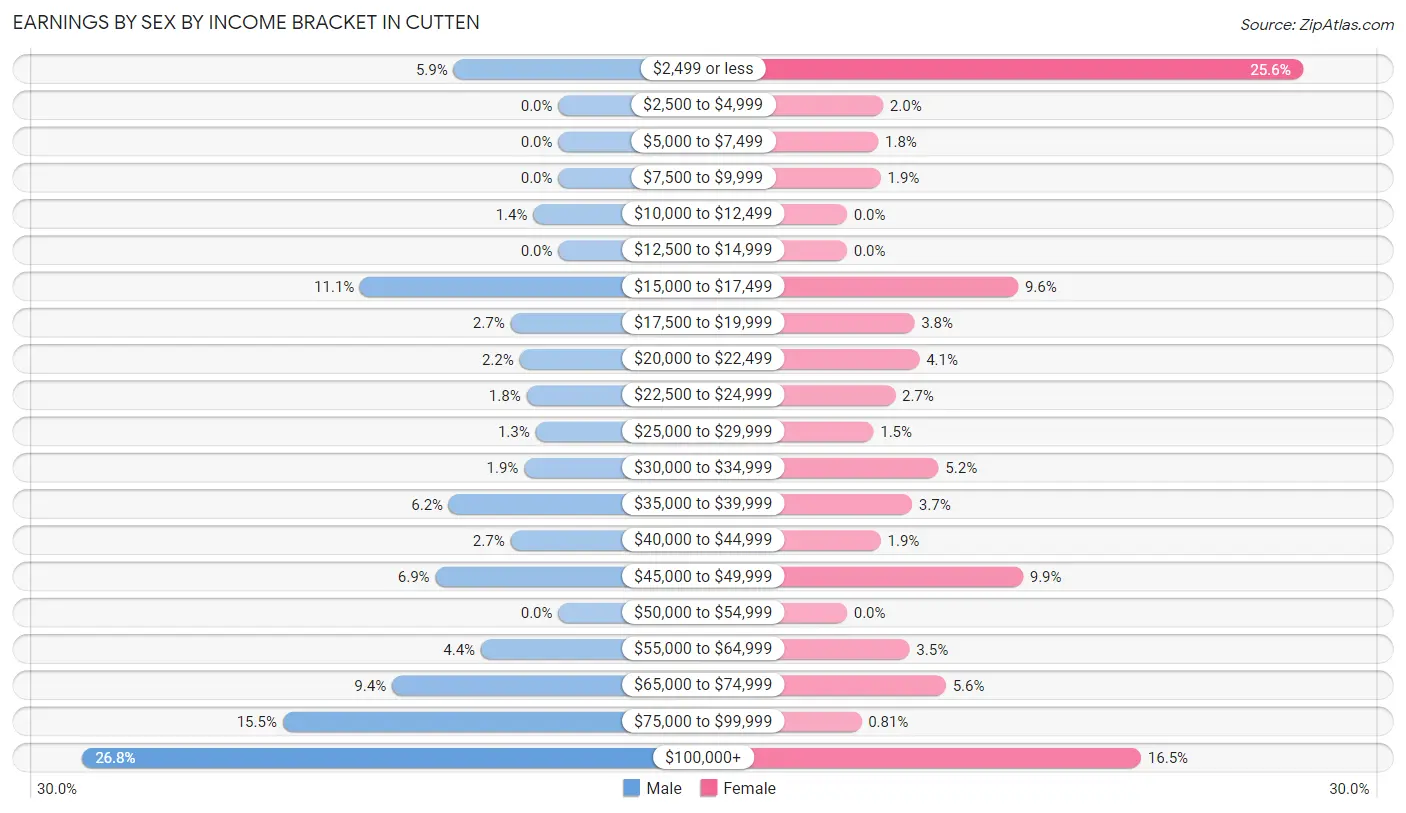
Earnings by Sex by Income Bracket in Cutten
The most common earnings brackets in Cutten are $100,000+ for men (209 | 26.8%) and $2,499 or less for women (189 | 25.6%).
| Income | Male | Female |
| $2,499 or less | 46 (5.9%) | 189 (25.6%) |
| $2,500 to $4,999 | 0 (0.0%) | 15 (2.0%) |
| $5,000 to $7,499 | 0 (0.0%) | 13 (1.8%) |
| $7,500 to $9,999 | 0 (0.0%) | 14 (1.9%) |
| $10,000 to $12,499 | 11 (1.4%) | 0 (0.0%) |
| $12,500 to $14,999 | 0 (0.0%) | 0 (0.0%) |
| $15,000 to $17,499 | 87 (11.1%) | 71 (9.6%) |
| $17,500 to $19,999 | 21 (2.7%) | 28 (3.8%) |
| $20,000 to $22,499 | 17 (2.2%) | 30 (4.1%) |
| $22,500 to $24,999 | 14 (1.8%) | 20 (2.7%) |
| $25,000 to $29,999 | 10 (1.3%) | 11 (1.5%) |
| $30,000 to $34,999 | 15 (1.9%) | 38 (5.1%) |
| $35,000 to $39,999 | 48 (6.1%) | 27 (3.7%) |
| $40,000 to $44,999 | 21 (2.7%) | 14 (1.9%) |
| $45,000 to $49,999 | 54 (6.9%) | 73 (9.9%) |
| $50,000 to $54,999 | 0 (0.0%) | 0 (0.0%) |
| $55,000 to $64,999 | 34 (4.3%) | 26 (3.5%) |
| $65,000 to $74,999 | 73 (9.3%) | 41 (5.6%) |
| $75,000 to $99,999 | 121 (15.5%) | 6 (0.8%) |
| $100,000+ | 209 (26.8%) | 122 (16.5%) |
| Total | 781 (100.0%) | 738 (100.0%) |
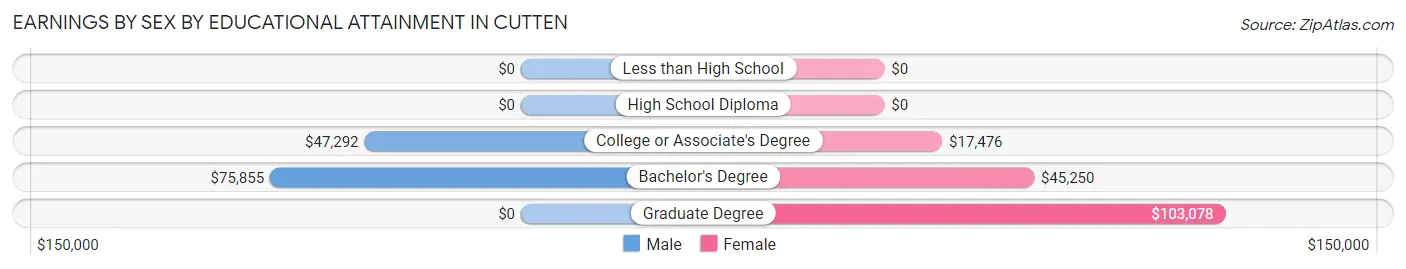
Earnings by Sex by Educational Attainment in Cutten
Average earnings in Cutten are $74,940 for men and $36,713 for women, a difference of 51.0%. Men with an educational attainment of bachelor's degree enjoy the highest average annual earnings of $75,855, while those with college or associate's degree education earn the least with $47,292. Women with an educational attainment of graduate degree earn the most with the average annual earnings of $103,078, while those with college or associate's degree education have the smallest earnings of $17,476.
| Educational Attainment | Male Income | Female Income |
| Less than High School | - | - |
| High School Diploma | - | - |
| College or Associate's Degree | $47,292 | $17,476 |
| Bachelor's Degree | $75,855 | $45,250 |
| Graduate Degree | - | - |
| Total | $74,940 | $36,713 |
Family Income in Cutten
Family Income Brackets in Cutten
According to the Cutten family income data, there are 271 families falling into the $100,000 to $149,999 income range, which is the most common income bracket and makes up 31.4% of all families.
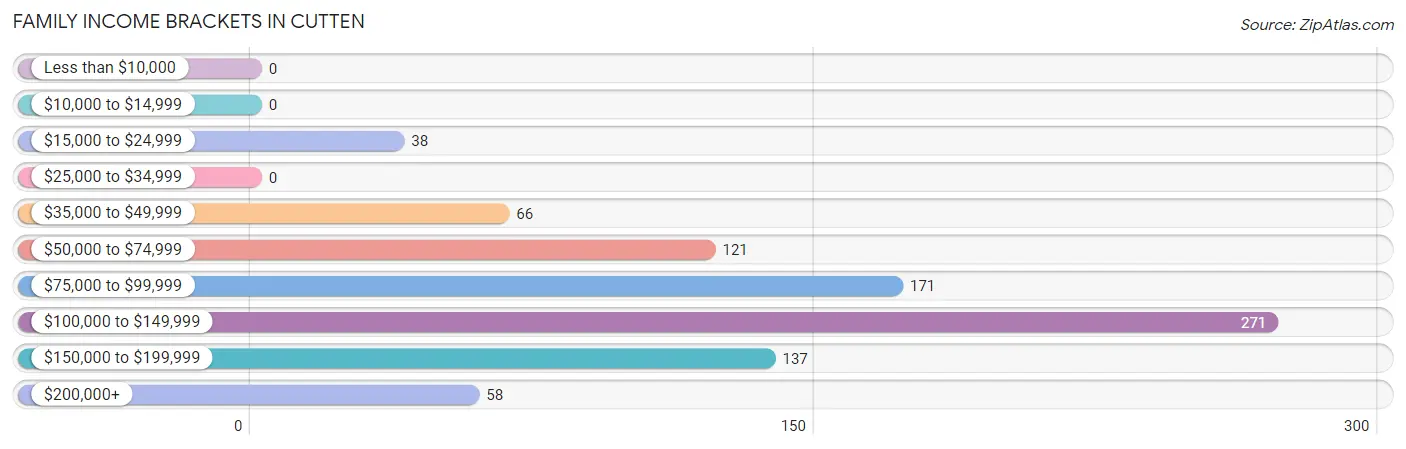
| Income Bracket | # Families | % Families |
| Less than $10,000 | 0 | 0.0% |
| $10,000 to $14,999 | 0 | 0.0% |
| $15,000 to $24,999 | 38 | 4.4% |
| $25,000 to $34,999 | 0 | 0.0% |
| $35,000 to $49,999 | 66 | 7.7% |
| $50,000 to $74,999 | 121 | 14.0% |
| $75,000 to $99,999 | 171 | 19.8% |
| $100,000 to $149,999 | 271 | 31.4% |
| $150,000 to $199,999 | 137 | 15.9% |
| $200,000+ | 58 | 6.7% |
Family Income by Famaliy Size in Cutten
3-person families (245 | 28.4%) account for the highest median family income in Cutten with $121,797 per family, while 2-person families (306 | 35.5%) have the highest median income of $42,084 per family member.
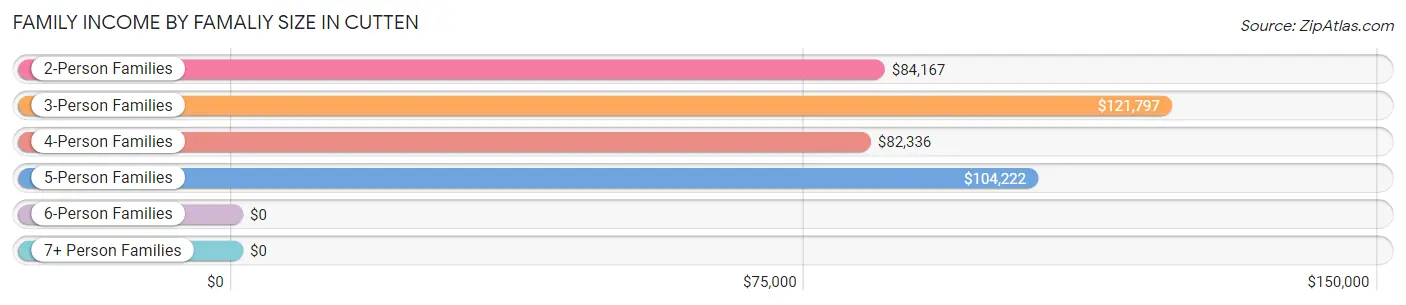
| Income Bracket | # Families | Median Income |
| 2-Person Families | 306 (35.5%) | $84,167 |
| 3-Person Families | 245 (28.4%) | $121,797 |
| 4-Person Families | 99 (11.5%) | $82,336 |
| 5-Person Families | 168 (19.5%) | $104,222 |
| 6-Person Families | 44 (5.1%) | $0 |
| 7+ Person Families | 0 (0.0%) | $0 |
| Total | 862 (100.0%) | $103,194 |
Family Income by Number of Earners in Cutten
The median family income in Cutten is $103,194, with families comprising 3+ earners (124) having the highest median family income of $126,017, while families with 2 earners (172) have the lowest median family income of $76,346, accounting for 14.4% and 20.0% of families, respectively.
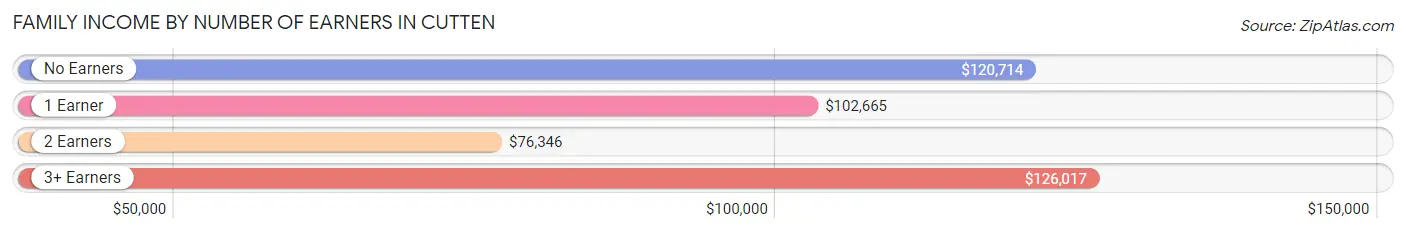
| Number of Earners | # Families | Median Income |
| No Earners | 226 (26.2%) | $120,714 |
| 1 Earner | 340 (39.4%) | $102,665 |
| 2 Earners | 172 (20.0%) | $76,346 |
| 3+ Earners | 124 (14.4%) | $126,017 |
| Total | 862 (100.0%) | $103,194 |
Household Income in Cutten
Household Income Brackets in Cutten
With 319 households falling in the category, the $100,000 to $149,999 income range is the most frequent in Cutten, accounting for 25.7% of all households.
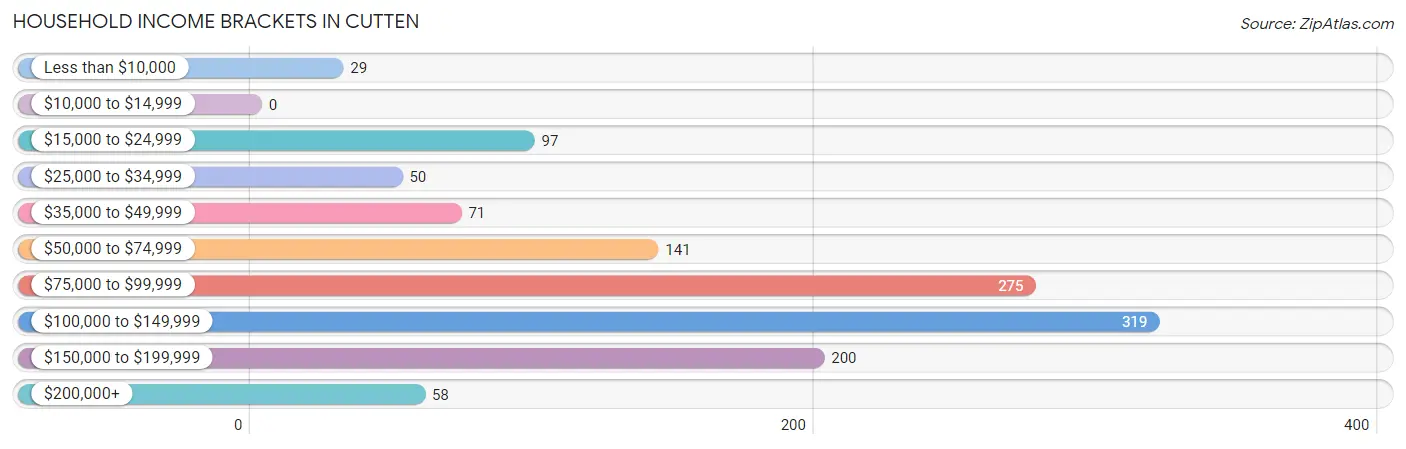
| Income Bracket | # Households | % Households |
| Less than $10,000 | 29 | 2.3% |
| $10,000 to $14,999 | 0 | 0.0% |
| $15,000 to $24,999 | 97 | 7.8% |
| $25,000 to $34,999 | 50 | 4.0% |
| $35,000 to $49,999 | 71 | 5.7% |
| $50,000 to $74,999 | 141 | 11.4% |
| $75,000 to $99,999 | 275 | 22.2% |
| $100,000 to $149,999 | 319 | 25.7% |
| $150,000 to $199,999 | 200 | 16.1% |
| $200,000+ | 58 | 4.7% |
Household Income by Householder Age in Cutten
The median household income in Cutten is $89,728, with the highest median household income of $102,948 found in the 25 to 44 years age bracket for the primary householder. A total of 374 households (30.2%) fall into this category. Meanwhile, the 15 to 24 years age bracket for the primary householder has the lowest median household income of $0, with 29 households (2.3%) in this group.
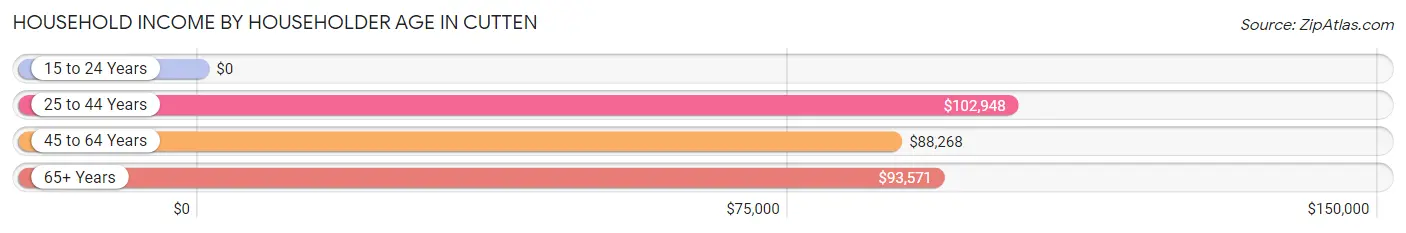
| Income Bracket | # Households | Median Income |
| 15 to 24 Years | 29 (2.3%) | $0 |
| 25 to 44 Years | 374 (30.2%) | $102,948 |
| 45 to 64 Years | 405 (32.7%) | $88,268 |
| 65+ Years | 432 (34.8%) | $93,571 |
| Total | 1,240 (100.0%) | $89,728 |
Poverty in Cutten
Income Below Poverty by Sex and Age in Cutten
With 6.5% poverty level for males and 5.9% for females among the residents of Cutten, 18 to 24 year old males and 15 year old females are the most vulnerable to poverty, with 29 males (24.2%) and 16 females (50.0%) in their respective age groups living below the poverty level.
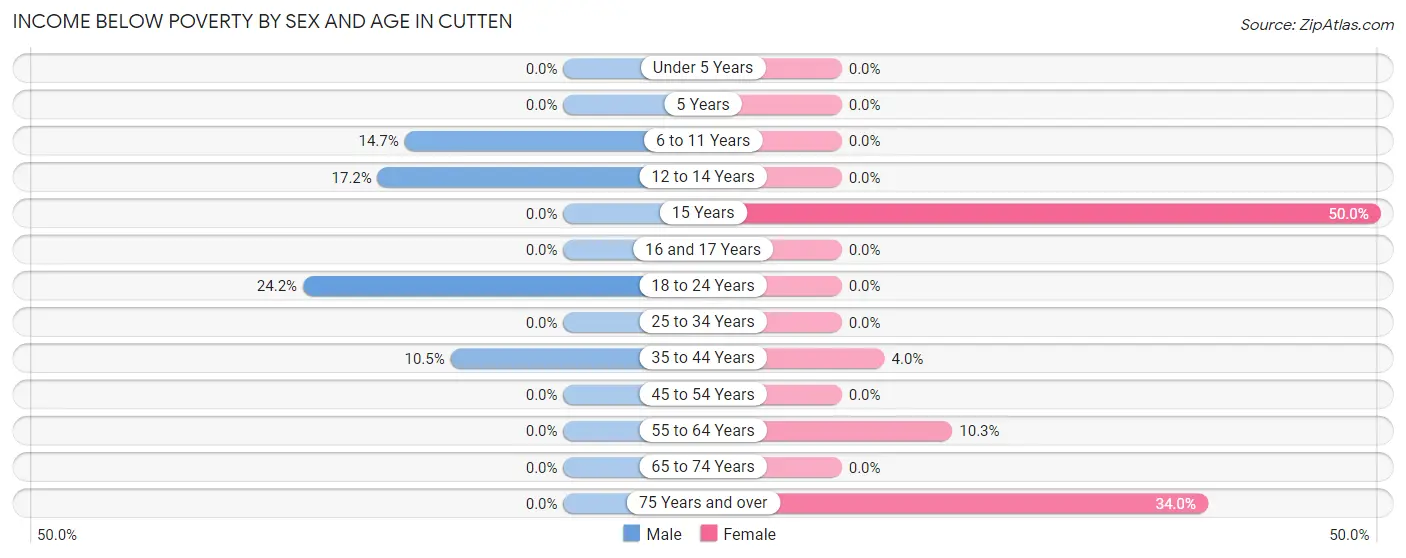
| Age Bracket | Male | Female |
| Under 5 Years | 0 (0.0%) | 0 (0.0%) |
| 5 Years | 0 (0.0%) | 0 (0.0%) |
| 6 to 11 Years | 14 (14.7%) | 0 (0.0%) |
| 12 to 14 Years | 15 (17.2%) | 0 (0.0%) |
| 15 Years | 0 (0.0%) | 16 (50.0%) |
| 16 and 17 Years | 0 (0.0%) | 0 (0.0%) |
| 18 to 24 Years | 29 (24.2%) | 0 (0.0%) |
| 25 to 34 Years | 0 (0.0%) | 0 (0.0%) |
| 35 to 44 Years | 47 (10.5%) | 11 (4.0%) |
| 45 to 54 Years | 0 (0.0%) | 0 (0.0%) |
| 55 to 64 Years | 0 (0.0%) | 16 (10.3%) |
| 65 to 74 Years | 0 (0.0%) | 0 (0.0%) |
| 75 Years and over | 0 (0.0%) | 54 (34.0%) |
| Total | 105 (6.5%) | 97 (5.9%) |
Income Above Poverty by Sex and Age in Cutten
According to the poverty statistics in Cutten, males aged under 5 years and females aged under 5 years are the age groups that are most secure financially, with 100.0% of males and 100.0% of females in these age groups living above the poverty line.
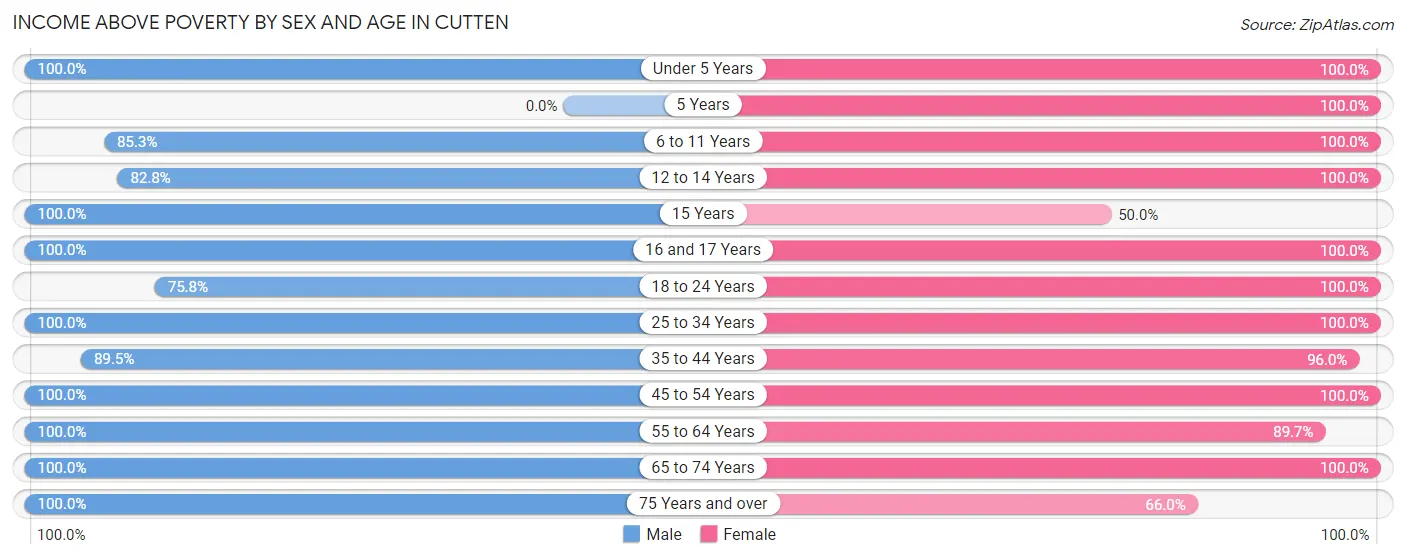
| Age Bracket | Male | Female |
| Under 5 Years | 95 (100.0%) | 83 (100.0%) |
| 5 Years | 0 (0.0%) | 6 (100.0%) |
| 6 to 11 Years | 81 (85.3%) | 170 (100.0%) |
| 12 to 14 Years | 72 (82.8%) | 100 (100.0%) |
| 15 Years | 46 (100.0%) | 16 (50.0%) |
| 16 and 17 Years | 28 (100.0%) | 63 (100.0%) |
| 18 to 24 Years | 91 (75.8%) | 122 (100.0%) |
| 25 to 34 Years | 48 (100.0%) | 133 (100.0%) |
| 35 to 44 Years | 402 (89.5%) | 266 (96.0%) |
| 45 to 54 Years | 209 (100.0%) | 97 (100.0%) |
| 55 to 64 Years | 131 (100.0%) | 140 (89.7%) |
| 65 to 74 Years | 211 (100.0%) | 243 (100.0%) |
| 75 Years and over | 96 (100.0%) | 105 (66.0%) |
| Total | 1,510 (93.5%) | 1,544 (94.1%) |
Income Below Poverty Among Married-Couple Families in Cutten
The poverty statistics for married-couple families in Cutten show that 1.6% or 11 of the total 691 families live below the poverty line. Families with 3 or 4 children have the highest poverty rate of 10.4%, comprising of 11 families. On the other hand, families with no children have the lowest poverty rate of 0.0%, which includes 0 families.
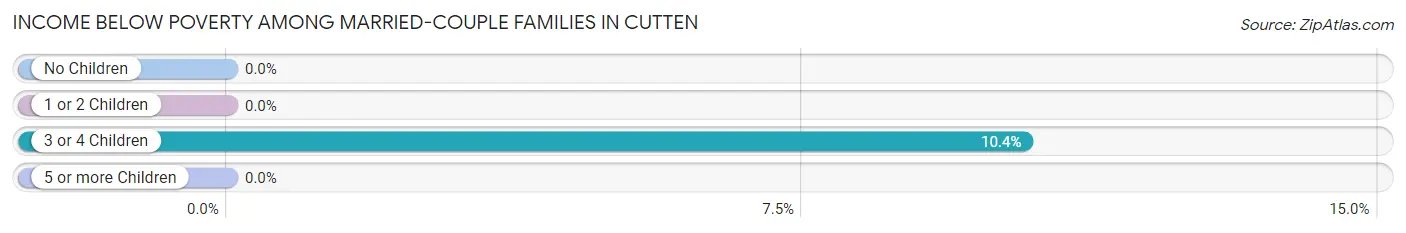
| Children | Above Poverty | Below Poverty |
| No Children | 427 (100.0%) | 0 (0.0%) |
| 1 or 2 Children | 158 (100.0%) | 0 (0.0%) |
| 3 or 4 Children | 95 (89.6%) | 11 (10.4%) |
| 5 or more Children | 0 (0.0%) | 0 (0.0%) |
| Total | 680 (98.4%) | 11 (1.6%) |
Income Below Poverty Among Single-Parent Households in Cutten
| Children | Single Father | Single Mother |
| No Children | 0 (0.0%) | 0 (0.0%) |
| 1 or 2 Children | 0 (0.0%) | 0 (0.0%) |
| 3 or 4 Children | 0 (0.0%) | 0 (0.0%) |
| 5 or more Children | 0 (0.0%) | 0 (0.0%) |
| Total | 0 (0.0%) | 0 (0.0%) |
Income Below Poverty Among Married-Couple vs Single-Parent Households in Cutten
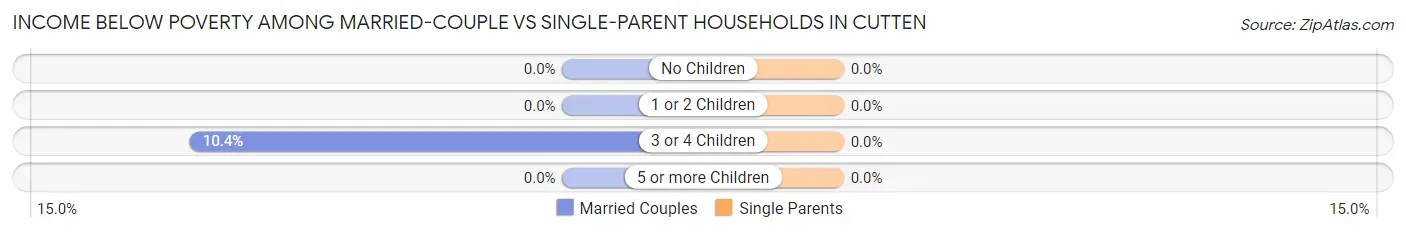
| Children | Married-Couple Families | Single-Parent Households |
| No Children | 0 (0.0%) | 0 (0.0%) |
| 1 or 2 Children | 0 (0.0%) | 0 (0.0%) |
| 3 or 4 Children | 11 (10.4%) | 0 (0.0%) |
| 5 or more Children | 0 (0.0%) | 0 (0.0%) |
| Total | 11 (1.6%) | 0 (0.0%) |
Race in Cutten
The most populous races in Cutten are White / Caucasian (2,670 | 80.7%), Hispanic or Latino (289 | 8.7%), and Native / Alaskan (257 | 7.8%).
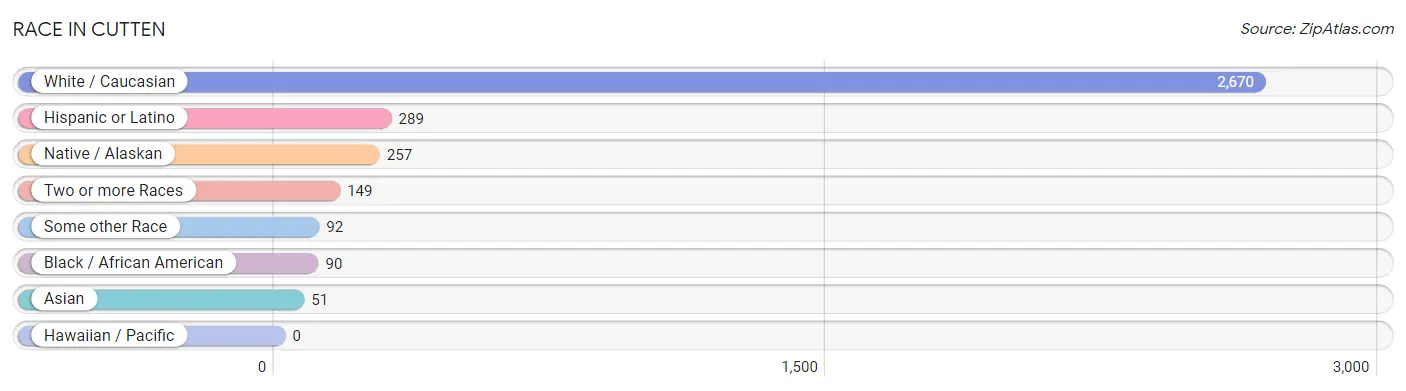
| Race | # Population | % Population |
| Asian | 51 | 1.5% |
| Black / African American | 90 | 2.7% |
| Hawaiian / Pacific | 0 | 0.0% |
| Hispanic or Latino | 289 | 8.7% |
| Native / Alaskan | 257 | 7.8% |
| White / Caucasian | 2,670 | 80.7% |
| Two or more Races | 149 | 4.5% |
| Some other Race | 92 | 2.8% |
| Total | 3,309 | 100.0% |
Ancestry in Cutten
The most populous ancestries reported in Cutten are German (534 | 16.1%), English (210 | 6.4%), Danish (204 | 6.2%), American (202 | 6.1%), and Central American (179 | 5.4%), together accounting for 40.2% of all Cutten residents.
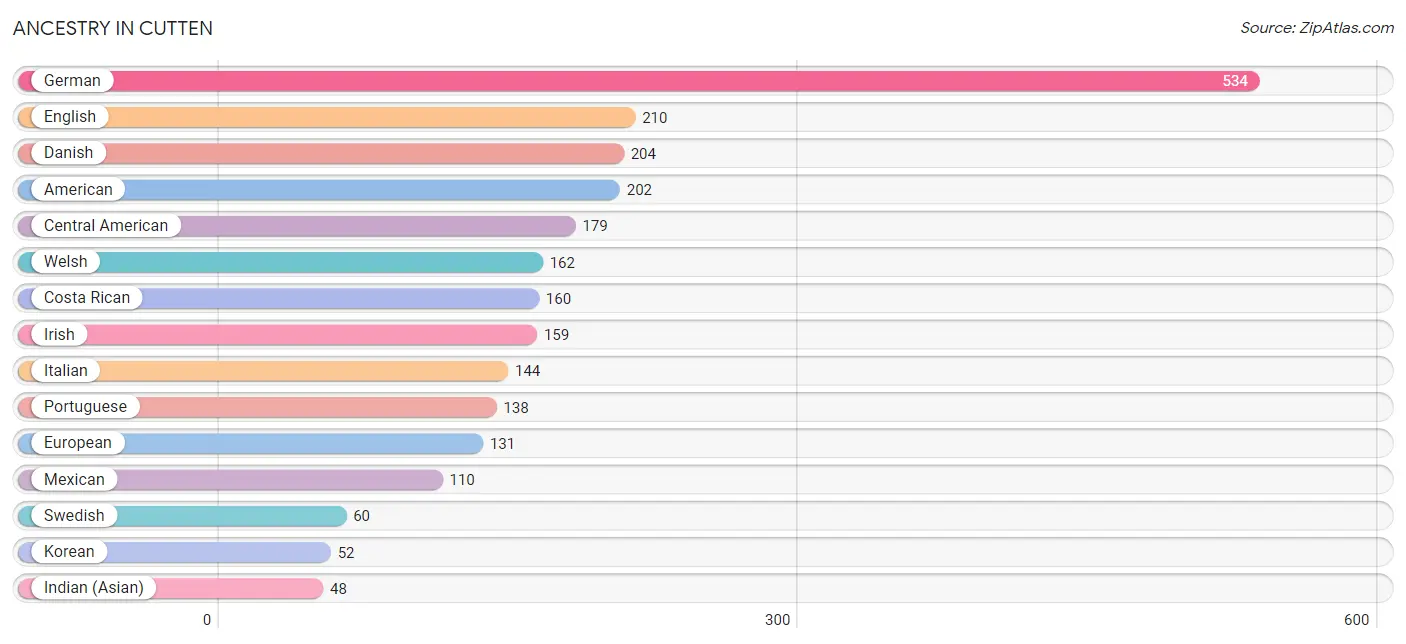
| Ancestry | # Population | % Population |
| African | 15 | 0.4% |
| Albanian | 27 | 0.8% |
| American | 202 | 6.1% |
| Apache | 16 | 0.5% |
| Bhutanese | 21 | 0.6% |
| Central American | 179 | 5.4% |
| Choctaw | 14 | 0.4% |
| Costa Rican | 160 | 4.8% |
| Croatian | 37 | 1.1% |
| Danish | 204 | 6.2% |
| English | 210 | 6.4% |
| European | 131 | 4.0% |
| German | 534 | 16.1% |
| Indian (Asian) | 48 | 1.5% |
| Irish | 159 | 4.8% |
| Italian | 144 | 4.3% |
| Japanese | 10 | 0.3% |
| Korean | 52 | 1.6% |
| Mexican | 110 | 3.3% |
| Northern European | 38 | 1.1% |
| Portuguese | 138 | 4.2% |
| Salvadoran | 19 | 0.6% |
| Scotch-Irish | 28 | 0.9% |
| Scottish | 38 | 1.1% |
| Subsaharan African | 15 | 0.4% |
| Swedish | 60 | 1.8% |
| Swiss | 14 | 0.4% |
| Welsh | 162 | 4.9% | View All 28 Rows |
Immigrants in Cutten
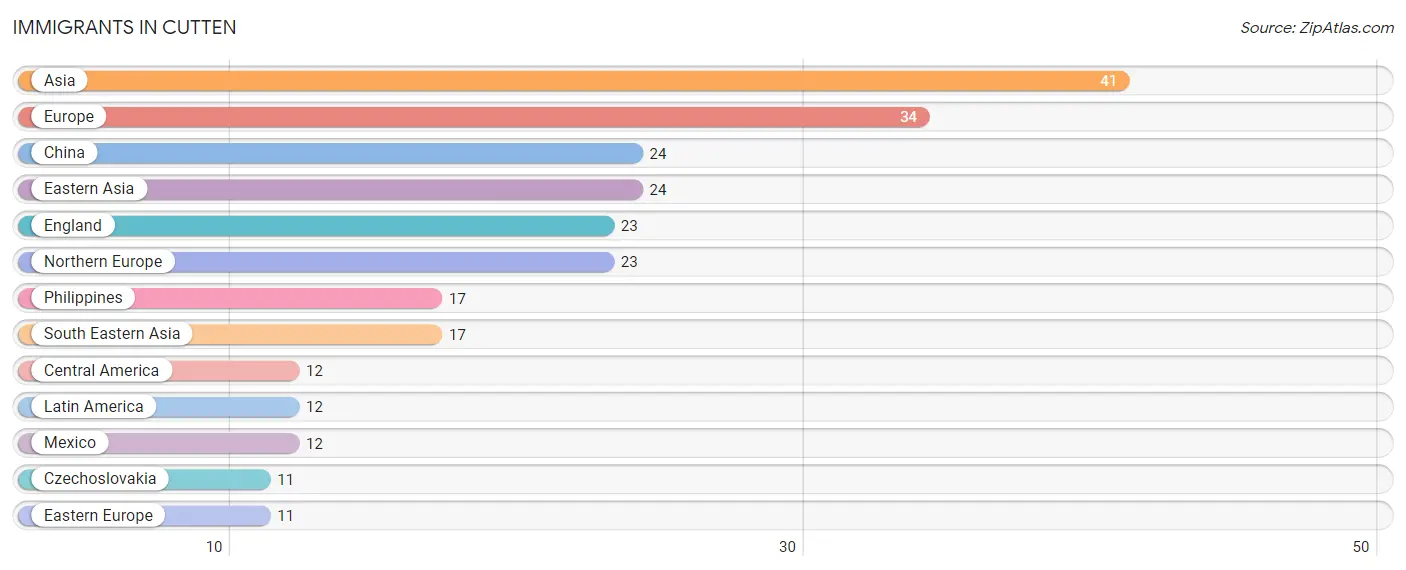
The most numerous immigrant groups reported in Cutten came from Asia (41 | 1.2%), Europe (34 | 1.0%), China (24 | 0.7%), Eastern Asia (24 | 0.7%), and England (23 | 0.7%), together accounting for 4.4% of all Cutten residents.
| Immigration Origin | # Population | % Population |
| Asia | 41 | 1.2% |
| Central America | 12 | 0.4% |
| China | 24 | 0.7% |
| Czechoslovakia | 11 | 0.3% |
| Eastern Asia | 24 | 0.7% |
| Eastern Europe | 11 | 0.3% |
| England | 23 | 0.7% |
| Europe | 34 | 1.0% |
| Latin America | 12 | 0.4% |
| Mexico | 12 | 0.4% |
| Northern Europe | 23 | 0.7% |
| Philippines | 17 | 0.5% |
| South Eastern Asia | 17 | 0.5% | View All 13 Rows |
Sex and Age in Cutten
Sex and Age in Cutten
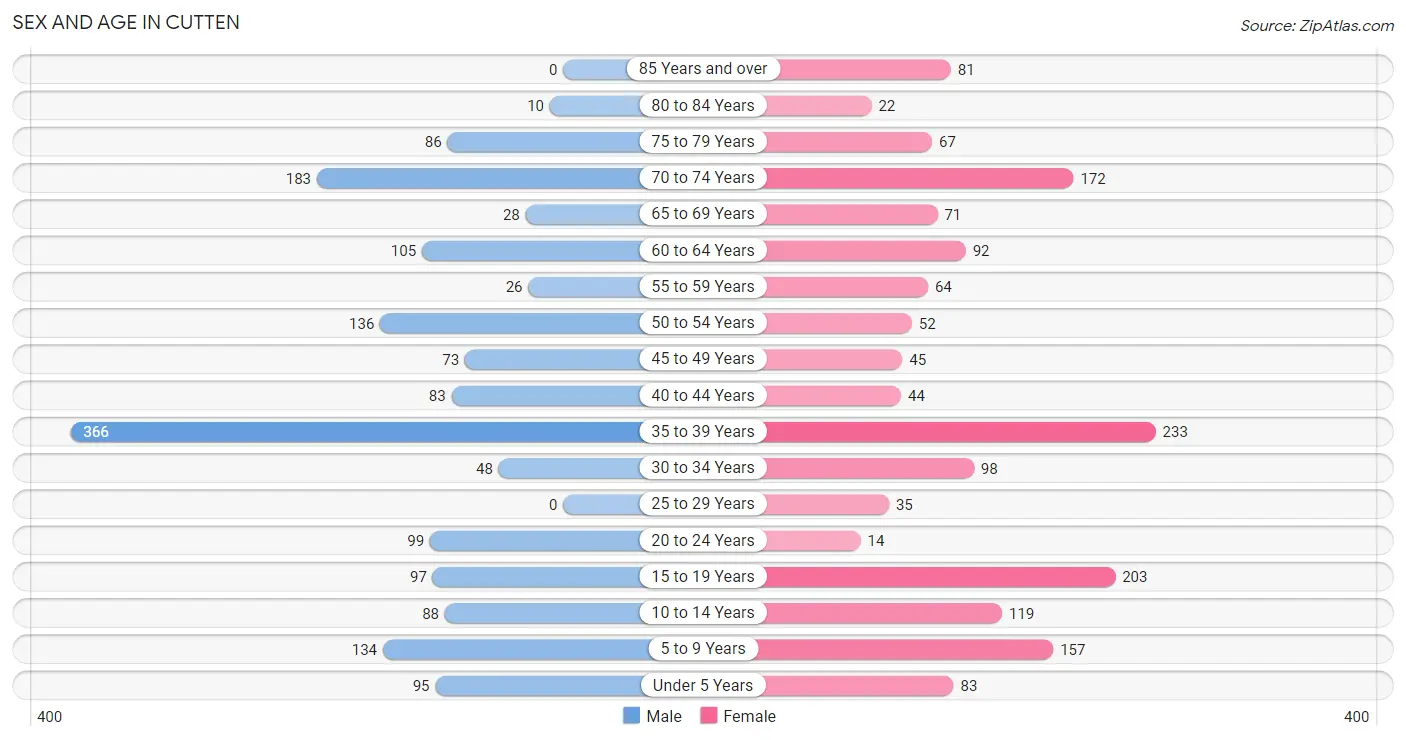
The most populous age groups in Cutten are 35 to 39 Years (366 | 22.1%) for men and 35 to 39 Years (233 | 14.1%) for women.
| Age Bracket | Male | Female |
| Under 5 Years | 95 (5.7%) | 83 (5.0%) |
| 5 to 9 Years | 134 (8.1%) | 157 (9.5%) |
| 10 to 14 Years | 88 (5.3%) | 119 (7.2%) |
| 15 to 19 Years | 97 (5.9%) | 203 (12.3%) |
| 20 to 24 Years | 99 (6.0%) | 14 (0.9%) |
| 25 to 29 Years | 0 (0.0%) | 35 (2.1%) |
| 30 to 34 Years | 48 (2.9%) | 98 (5.9%) |
| 35 to 39 Years | 366 (22.1%) | 233 (14.1%) |
| 40 to 44 Years | 83 (5.0%) | 44 (2.7%) |
| 45 to 49 Years | 73 (4.4%) | 45 (2.7%) |
| 50 to 54 Years | 136 (8.2%) | 52 (3.2%) |
| 55 to 59 Years | 26 (1.6%) | 64 (3.9%) |
| 60 to 64 Years | 105 (6.3%) | 92 (5.6%) |
| 65 to 69 Years | 28 (1.7%) | 71 (4.3%) |
| 70 to 74 Years | 183 (11.0%) | 172 (10.4%) |
| 75 to 79 Years | 86 (5.2%) | 67 (4.1%) |
| 80 to 84 Years | 10 (0.6%) | 22 (1.3%) |
| 85 Years and over | 0 (0.0%) | 81 (4.9%) |
| Total | 1,657 (100.0%) | 1,652 (100.0%) |
Families and Households in Cutten
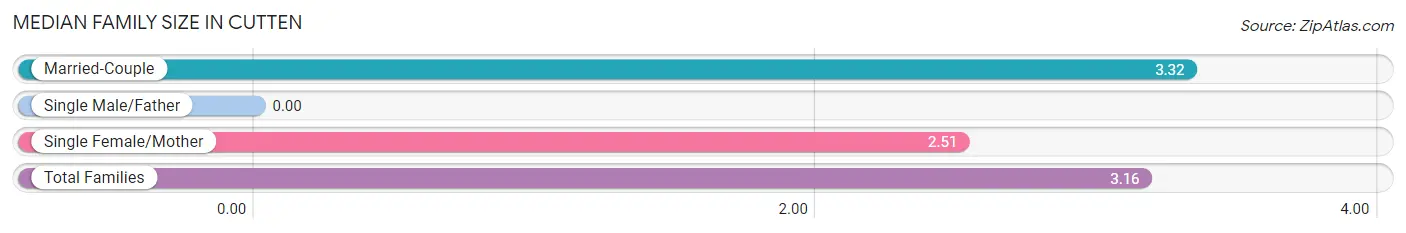
Median Family Size in Cutten
| Family Type | # Families | Family Size |
| Married-Couple | 691 (80.2%) | 3.32 |
| Single Male/Father | 0 (0.0%) | - |
| Single Female/Mother | 171 (19.8%) | 2.51 |
| Total Families | 862 (100.0%) | 3.16 |
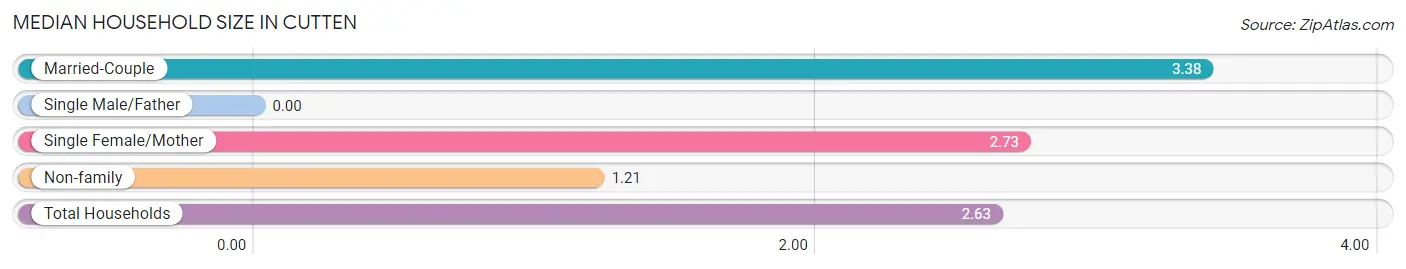
Median Household Size in Cutten
| Household Type | # Households | Household Size |
| Married-Couple | 691 (55.7%) | 3.38 |
| Single Male/Father | 0 (0.0%) | - |
| Single Female/Mother | 171 (13.8%) | 2.73 |
| Non-family | 378 (30.5%) | 1.21 |
| Total Households | 1,240 (100.0%) | 2.63 |
Household Size by Marriage Status in Cutten
Out of a total of 1,240 households in Cutten, 862 (69.5%) are family households, while 378 (30.5%) are nonfamily households. The most numerous type of family households are 3-person households, comprising 280, and the most common type of nonfamily households are 1-person households, comprising 305.
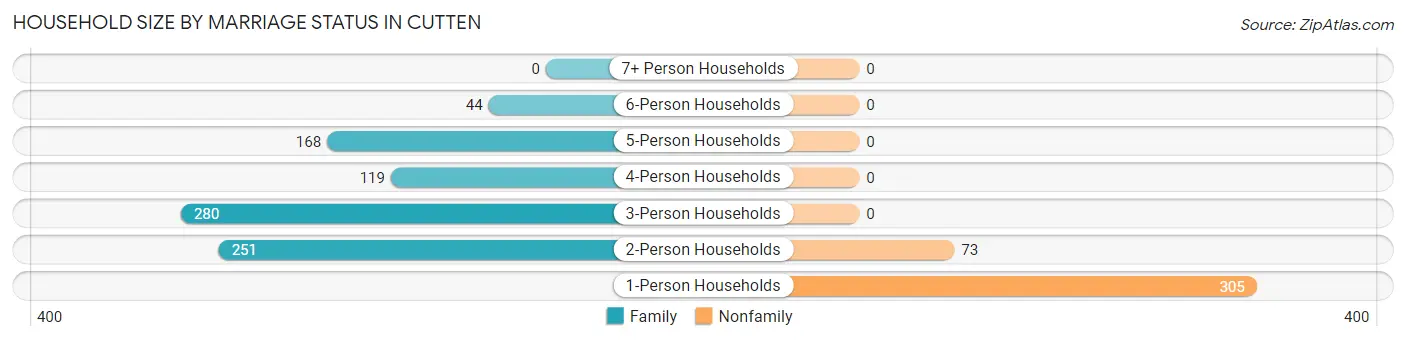
| Household Size | Family Households | Nonfamily Households |
| 1-Person Households | - | 305 (24.6%) |
| 2-Person Households | 251 (20.2%) | 73 (5.9%) |
| 3-Person Households | 280 (22.6%) | 0 (0.0%) |
| 4-Person Households | 119 (9.6%) | 0 (0.0%) |
| 5-Person Households | 168 (13.6%) | 0 (0.0%) |
| 6-Person Households | 44 (3.5%) | 0 (0.0%) |
| 7+ Person Households | 0 (0.0%) | 0 (0.0%) |
| Total | 862 (69.5%) | 378 (30.5%) |
Female Fertility in Cutten
Fertility by Age in Cutten
Average fertility rate in Cutten is 40.0 births per 1,000 women. Women in the age bracket of 20 to 34 years have the highest fertility rate with 184.0 births per 1,000 women. Women in the age bracket of 20 to 34 years acount for 100.0% of all women with births.
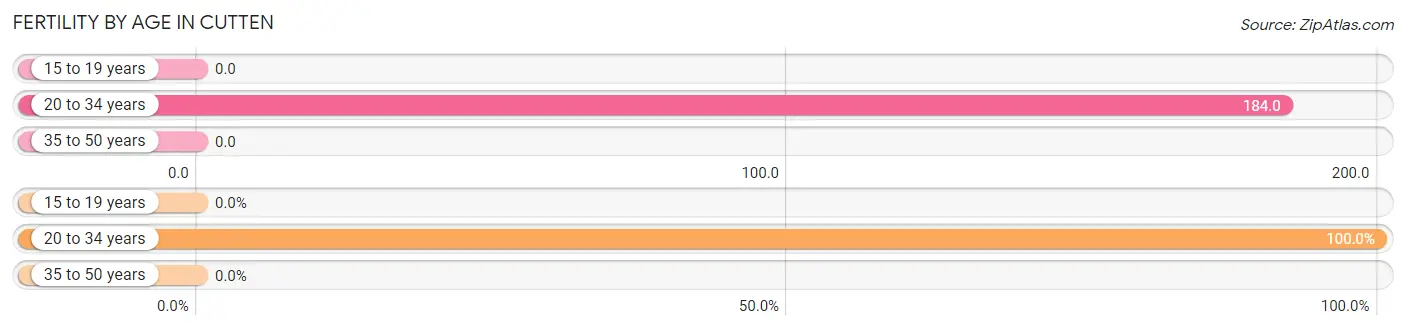
| Age Bracket | Women with Births | Births / 1,000 Women |
| 15 to 19 years | 0 (0.0%) | 0.0 |
| 20 to 34 years | 27 (100.0%) | 184.0 |
| 35 to 50 years | 0 (0.0%) | 0.0 |
| Total | 27 (100.0%) | 40.0 |
Fertility by Age by Marriage Status in Cutten
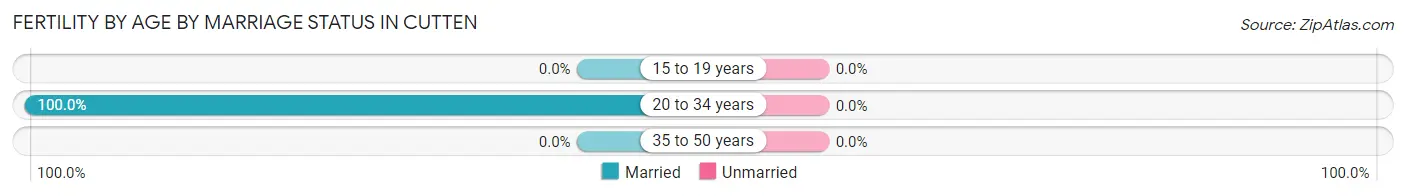
| Age Bracket | Married | Unmarried |
| 15 to 19 years | 0 (0.0%) | 0 (0.0%) |
| 20 to 34 years | 27 (100.0%) | 0 (0.0%) |
| 35 to 50 years | 0 (0.0%) | 0 (0.0%) |
| Total | 27 (100.0%) | 0 (0.0%) |
Fertility by Education in Cutten
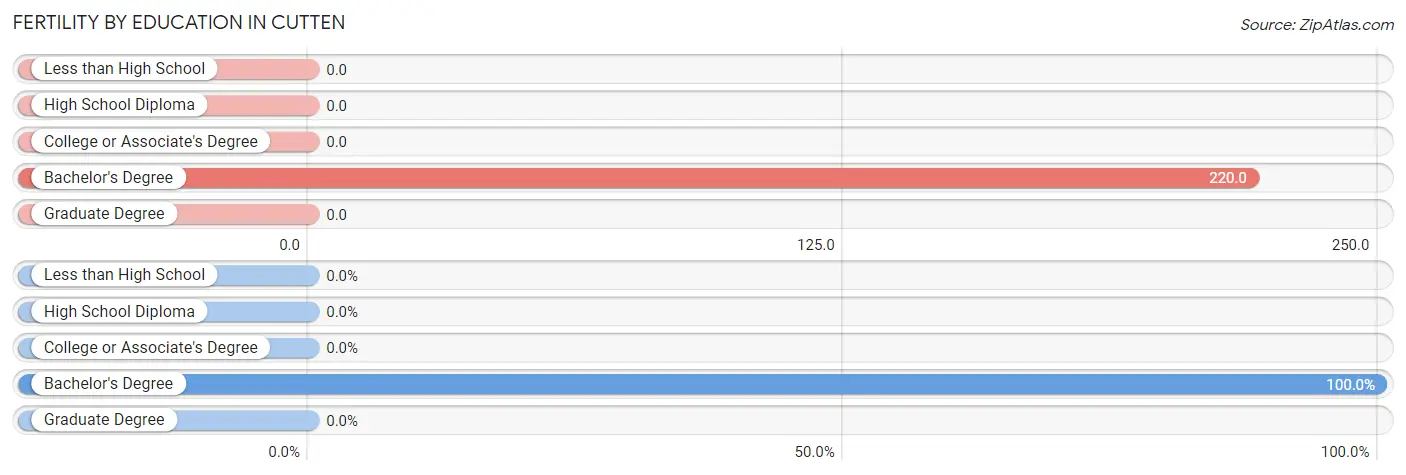
| Educational Attainment | Women with Births | Births / 1,000 Women |
| Less than High School | 0 (0.0%) | 0.0 |
| High School Diploma | 0 (0.0%) | 0.0 |
| College or Associate's Degree | 0 (0.0%) | 0.0 |
| Bachelor's Degree | 27 (100.0%) | 220.0 |
| Graduate Degree | 0 (0.0%) | 0.0 |
| Total | 27 (100.0%) | 40.0 |
Fertility by Education by Marriage Status in Cutten
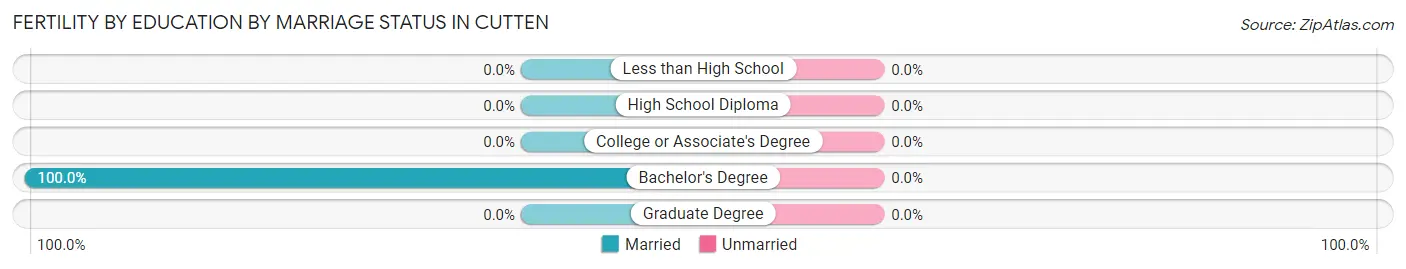
| Educational Attainment | Married | Unmarried |
| Less than High School | 0 (0.0%) | 0 (0.0%) |
| High School Diploma | 0 (0.0%) | 0 (0.0%) |
| College or Associate's Degree | 0 (0.0%) | 0 (0.0%) |
| Bachelor's Degree | 27 (100.0%) | 0 (0.0%) |
| Graduate Degree | 0 (0.0%) | 0 (0.0%) |
| Total | 27 (100.0%) | 0 (0.0%) |
Employment Characteristics in Cutten
Employment by Class of Employer in Cutten
Among the 1,274 employed individuals in Cutten, private company employees (746 | 58.6%), not-for-profit organizations (271 | 21.3%), and self-employed (not incorporated) (90 | 7.1%) make up the most common classes of employment.
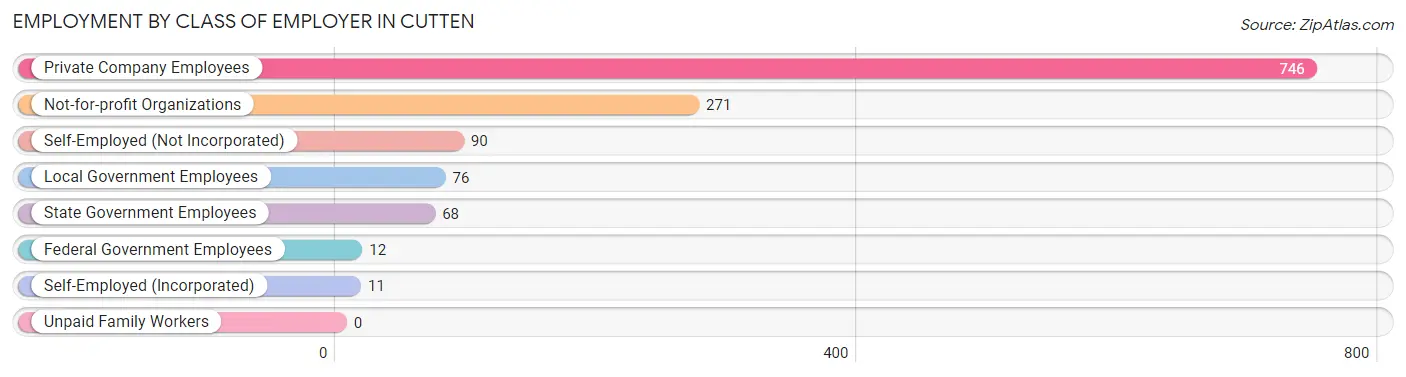
| Employer Class | # Employees | % Employees |
| Private Company Employees | 746 | 58.6% |
| Self-Employed (Incorporated) | 11 | 0.9% |
| Self-Employed (Not Incorporated) | 90 | 7.1% |
| Not-for-profit Organizations | 271 | 21.3% |
| Local Government Employees | 76 | 6.0% |
| State Government Employees | 68 | 5.3% |
| Federal Government Employees | 12 | 0.9% |
| Unpaid Family Workers | 0 | 0.0% |
| Total | 1,274 | 100.0% |
Employment Status by Age in Cutten
According to the labor force statistics for Cutten, out of the total population over 16 years of age (2,555), 52.6% or 1,344 individuals are in the labor force, with 3.9% or 52 of them unemployed. The age group with the highest labor force participation rate is 20 to 24 years, with 100.0% or 113 individuals in the labor force. Within the labor force, the 35 to 44 years age range has the highest percentage of unemployed individuals, with 10.9% or 53 of them being unemployed.
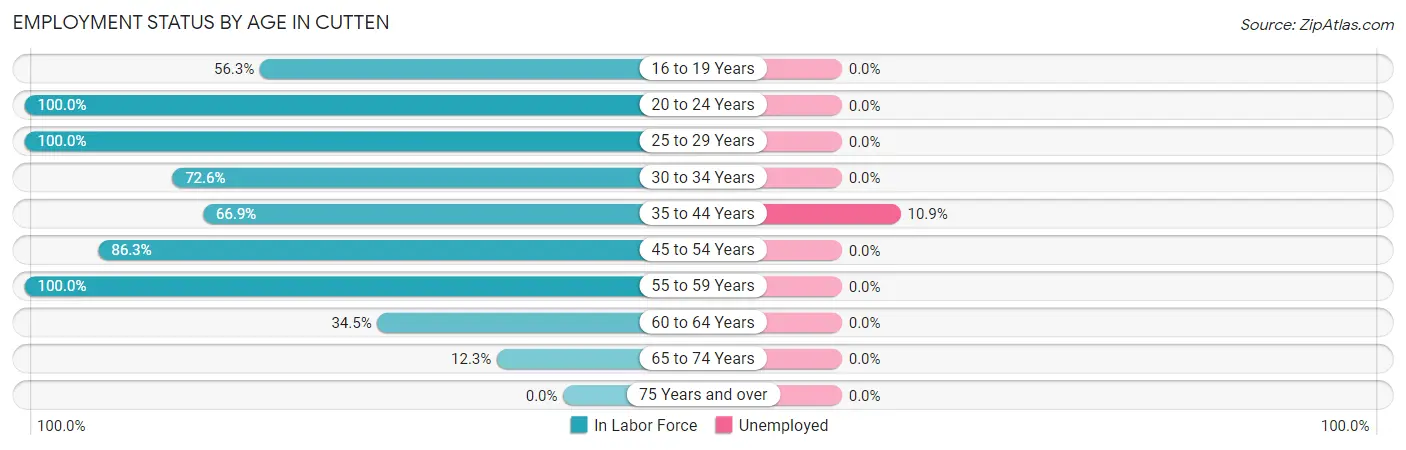
| Age Bracket | In Labor Force | Unemployed |
| 16 to 19 Years | 125 (56.3%) | 0 (0.0%) |
| 20 to 24 Years | 113 (100.0%) | 0 (0.0%) |
| 25 to 29 Years | 35 (100.0%) | 0 (0.0%) |
| 30 to 34 Years | 106 (72.6%) | 0 (0.0%) |
| 35 to 44 Years | 486 (66.9%) | 53 (10.9%) |
| 45 to 54 Years | 264 (86.3%) | 0 (0.0%) |
| 55 to 59 Years | 90 (100.0%) | 0 (0.0%) |
| 60 to 64 Years | 68 (34.5%) | 0 (0.0%) |
| 65 to 74 Years | 56 (12.3%) | 0 (0.0%) |
| 75 Years and over | 0 (0.0%) | 0 (0.0%) |
| Total | 1,344 (52.6%) | 52 (3.9%) |
Employment Status by Educational Attainment in Cutten
According to labor force statistics for Cutten, 69.9% of individuals (1,048) out of the total population between 25 and 64 years of age (1,500) are in the labor force, with 5.1% or 53 of them being unemployed. The group with the highest labor force participation rate are those with the educational attainment of bachelor's degree or higher, with 93.9% or 476 individuals in the labor force. Within the labor force, individuals with college / associate degree education have the highest percentage of unemployment, with 9.7% or 36 of them being unemployed.
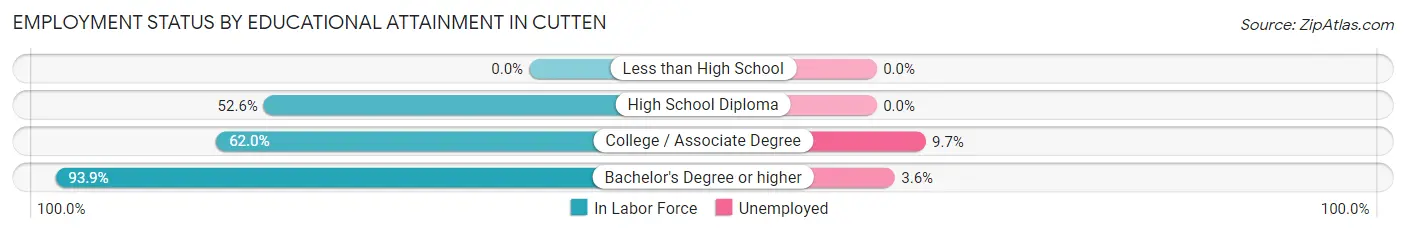
| Educational Attainment | In Labor Force | Unemployed |
| Less than High School | 0 (0.0%) | 0 (0.0%) |
| High School Diploma | 201 (52.6%) | 0 (0.0%) |
| College / Associate Degree | 372 (62.0%) | 58 (9.7%) |
| Bachelor's Degree or higher | 476 (93.9%) | 18 (3.6%) |
| Total | 1,049 (69.9%) | 76 (5.1%) |
Employment Occupations by Sex in Cutten
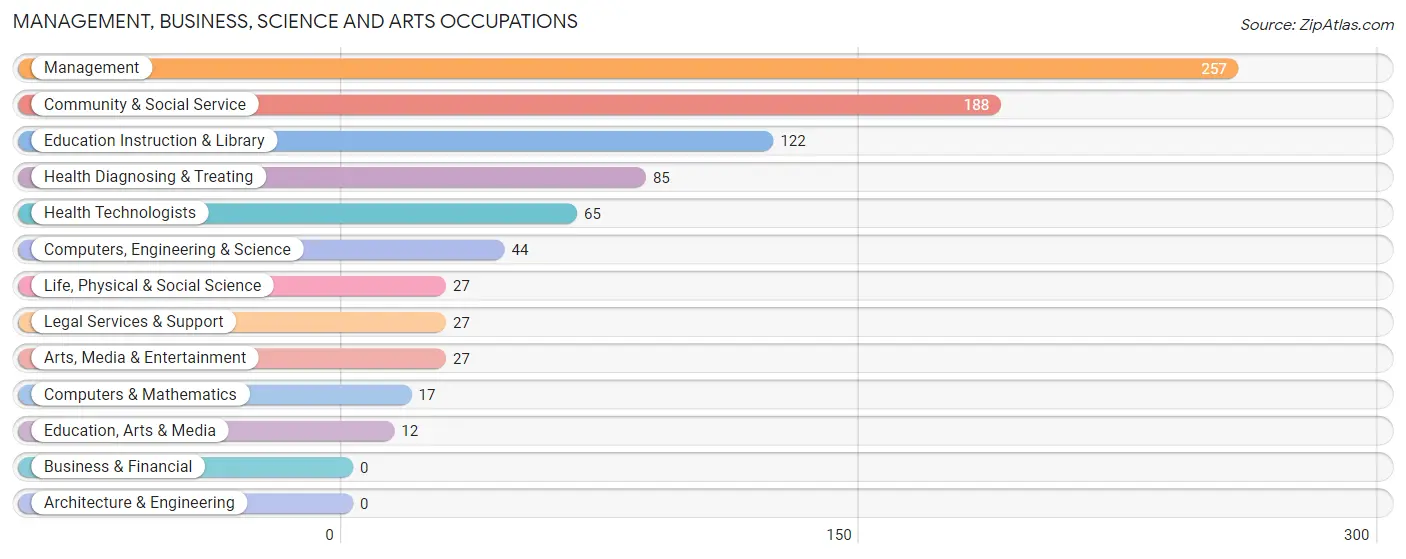
Management, Business, Science and Arts Occupations
The most common Management, Business, Science and Arts occupations in Cutten are Management (257 | 19.9%), Community & Social Service (188 | 14.6%), Education Instruction & Library (122 | 9.5%), Health Diagnosing & Treating (85 | 6.6%), and Health Technologists (65 | 5.0%).
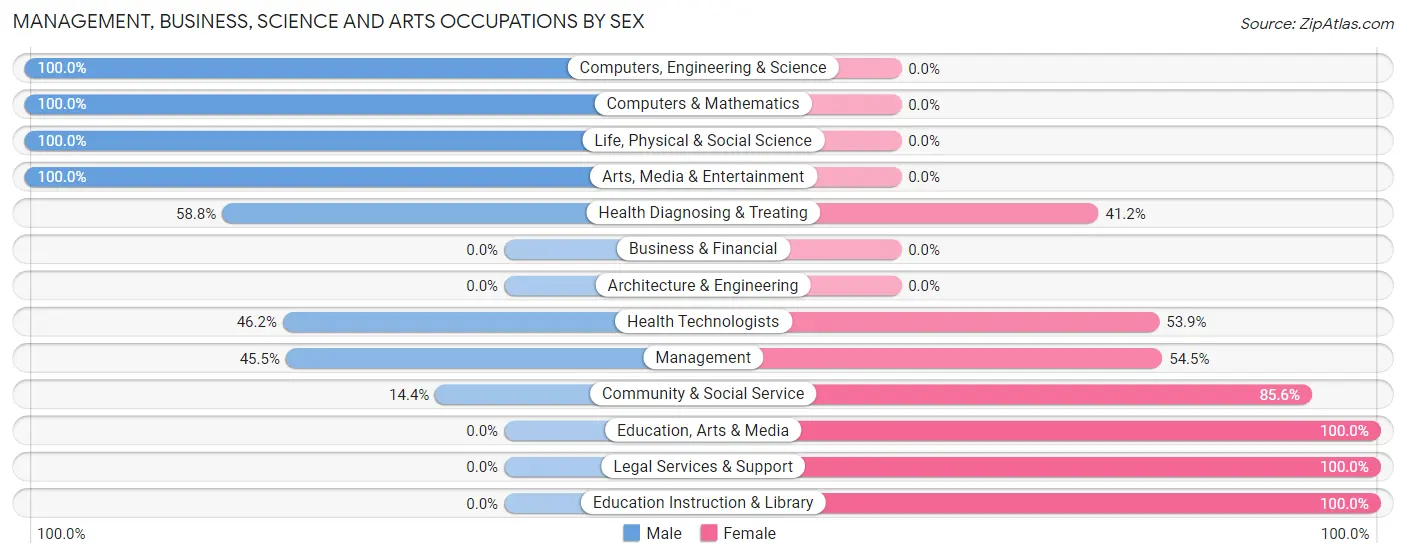
Management, Business, Science and Arts Occupations by Sex
Within the Management, Business, Science and Arts occupations in Cutten, the most male-oriented occupations are Computers, Engineering & Science (100.0%), Computers & Mathematics (100.0%), and Life, Physical & Social Science (100.0%), while the most female-oriented occupations are Education, Arts & Media (100.0%), Legal Services & Support (100.0%), and Education Instruction & Library (100.0%).
| Occupation | Male | Female |
| Management | 117 (45.5%) | 140 (54.5%) |
| Business & Financial | 0 (0.0%) | 0 (0.0%) |
| Computers, Engineering & Science | 44 (100.0%) | 0 (0.0%) |
| Computers & Mathematics | 17 (100.0%) | 0 (0.0%) |
| Architecture & Engineering | 0 (0.0%) | 0 (0.0%) |
| Life, Physical & Social Science | 27 (100.0%) | 0 (0.0%) |
| Community & Social Service | 27 (14.4%) | 161 (85.6%) |
| Education, Arts & Media | 0 (0.0%) | 12 (100.0%) |
| Legal Services & Support | 0 (0.0%) | 27 (100.0%) |
| Education Instruction & Library | 0 (0.0%) | 122 (100.0%) |
| Arts, Media & Entertainment | 27 (100.0%) | 0 (0.0%) |
| Health Diagnosing & Treating | 50 (58.8%) | 35 (41.2%) |
| Health Technologists | 30 (46.2%) | 35 (53.8%) |
| Total (Category) | 238 (41.5%) | 336 (58.5%) |
| Total (Overall) | 686 (53.2%) | 604 (46.8%) |
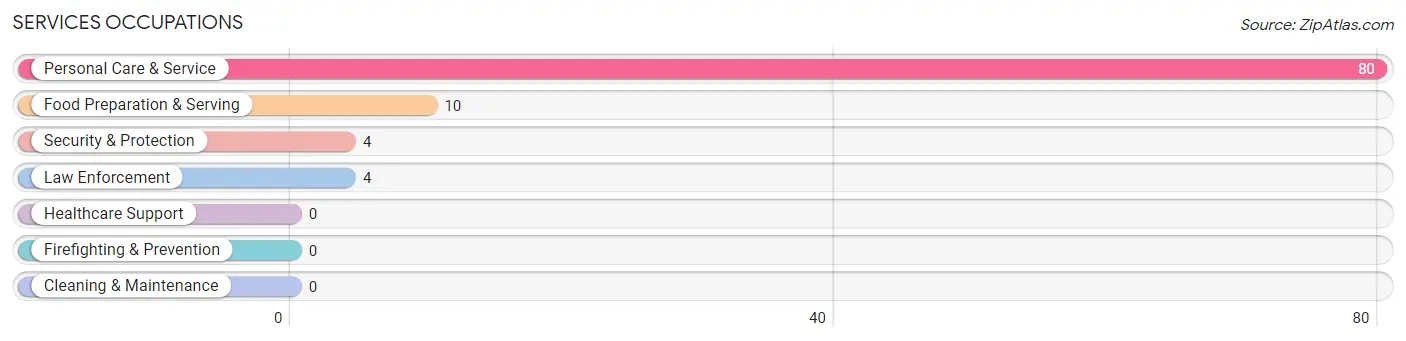
Services Occupations
The most common Services occupations in Cutten are Personal Care & Service (80 | 6.2%), Food Preparation & Serving (10 | 0.8%), Security & Protection (4 | 0.3%), and Law Enforcement (4 | 0.3%).
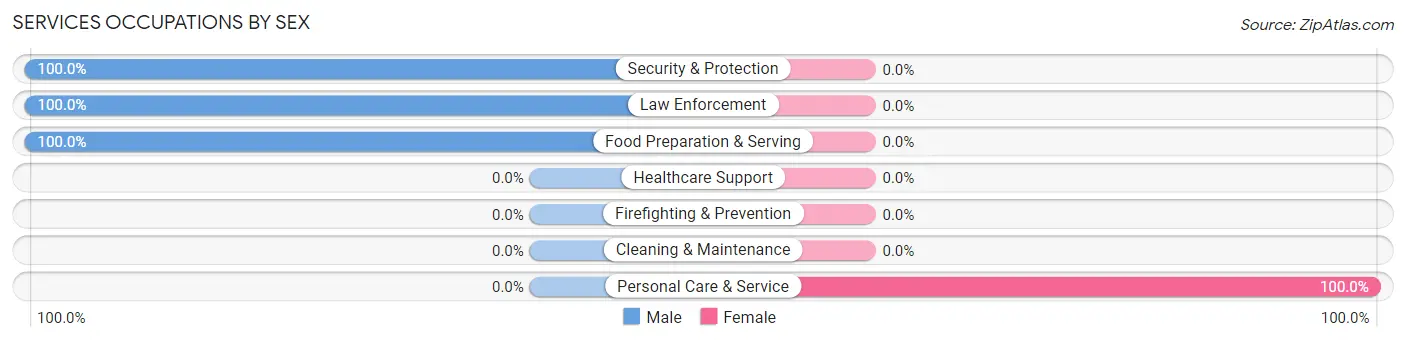
Services Occupations by Sex
| Occupation | Male | Female |
| Healthcare Support | 0 (0.0%) | 0 (0.0%) |
| Security & Protection | 4 (100.0%) | 0 (0.0%) |
| Firefighting & Prevention | 0 (0.0%) | 0 (0.0%) |
| Law Enforcement | 4 (100.0%) | 0 (0.0%) |
| Food Preparation & Serving | 10 (100.0%) | 0 (0.0%) |
| Cleaning & Maintenance | 0 (0.0%) | 0 (0.0%) |
| Personal Care & Service | 0 (0.0%) | 80 (100.0%) |
| Total (Category) | 14 (14.9%) | 80 (85.1%) |
| Total (Overall) | 686 (53.2%) | 604 (46.8%) |
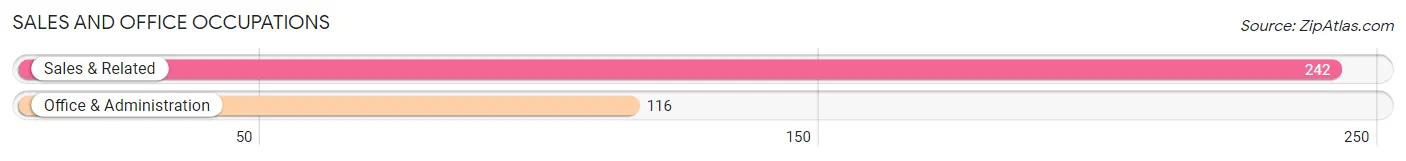
Sales and Office Occupations
The most common Sales and Office occupations in Cutten are Sales & Related (242 | 18.8%), and Office & Administration (116 | 9.0%).
Sales and Office Occupations by Sex
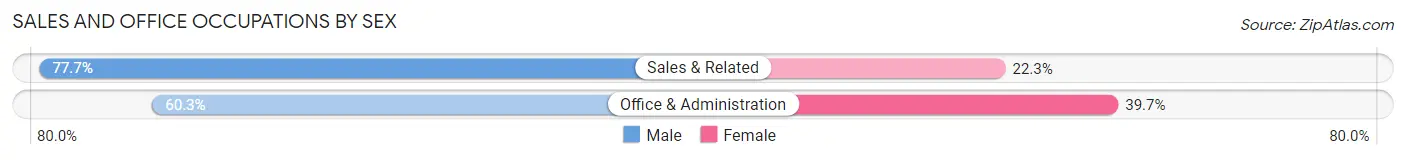
| Occupation | Male | Female |
| Sales & Related | 188 (77.7%) | 54 (22.3%) |
| Office & Administration | 70 (60.3%) | 46 (39.7%) |
| Total (Category) | 258 (72.1%) | 100 (27.9%) |
| Total (Overall) | 686 (53.2%) | 604 (46.8%) |
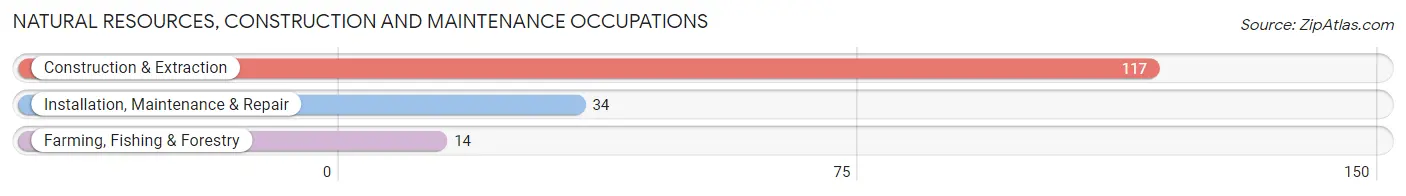
Natural Resources, Construction and Maintenance Occupations
The most common Natural Resources, Construction and Maintenance occupations in Cutten are Construction & Extraction (117 | 9.1%), Installation, Maintenance & Repair (34 | 2.6%), and Farming, Fishing & Forestry (14 | 1.1%).
Natural Resources, Construction and Maintenance Occupations by Sex
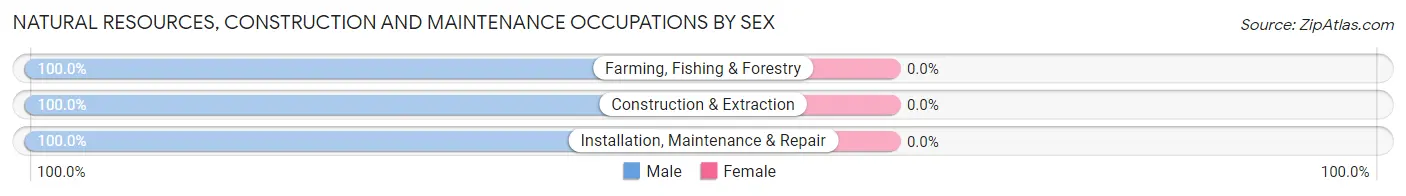
| Occupation | Male | Female |
| Farming, Fishing & Forestry | 14 (100.0%) | 0 (0.0%) |
| Construction & Extraction | 117 (100.0%) | 0 (0.0%) |
| Installation, Maintenance & Repair | 34 (100.0%) | 0 (0.0%) |
| Total (Category) | 165 (100.0%) | 0 (0.0%) |
| Total (Overall) | 686 (53.2%) | 604 (46.8%) |
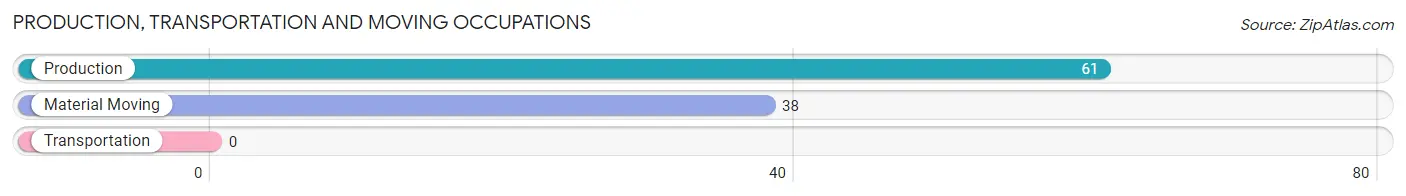
Production, Transportation and Moving Occupations
The most common Production, Transportation and Moving occupations in Cutten are Production (61 | 4.7%), and Material Moving (38 | 2.9%).
Production, Transportation and Moving Occupations by Sex
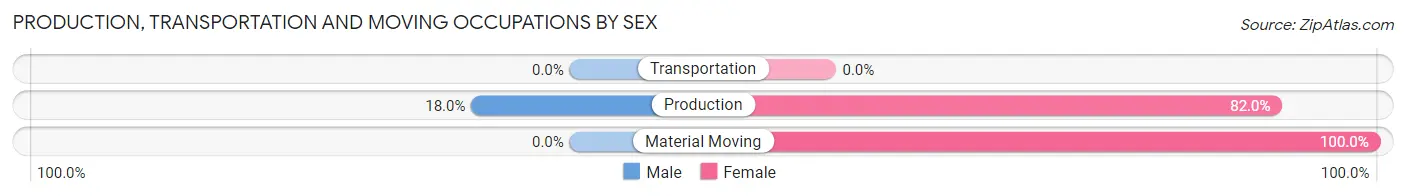
| Occupation | Male | Female |
| Production | 11 (18.0%) | 50 (82.0%) |
| Transportation | 0 (0.0%) | 0 (0.0%) |
| Material Moving | 0 (0.0%) | 38 (100.0%) |
| Total (Category) | 11 (11.1%) | 88 (88.9%) |
| Total (Overall) | 686 (53.2%) | 604 (46.8%) |
Employment Industries by Sex in Cutten
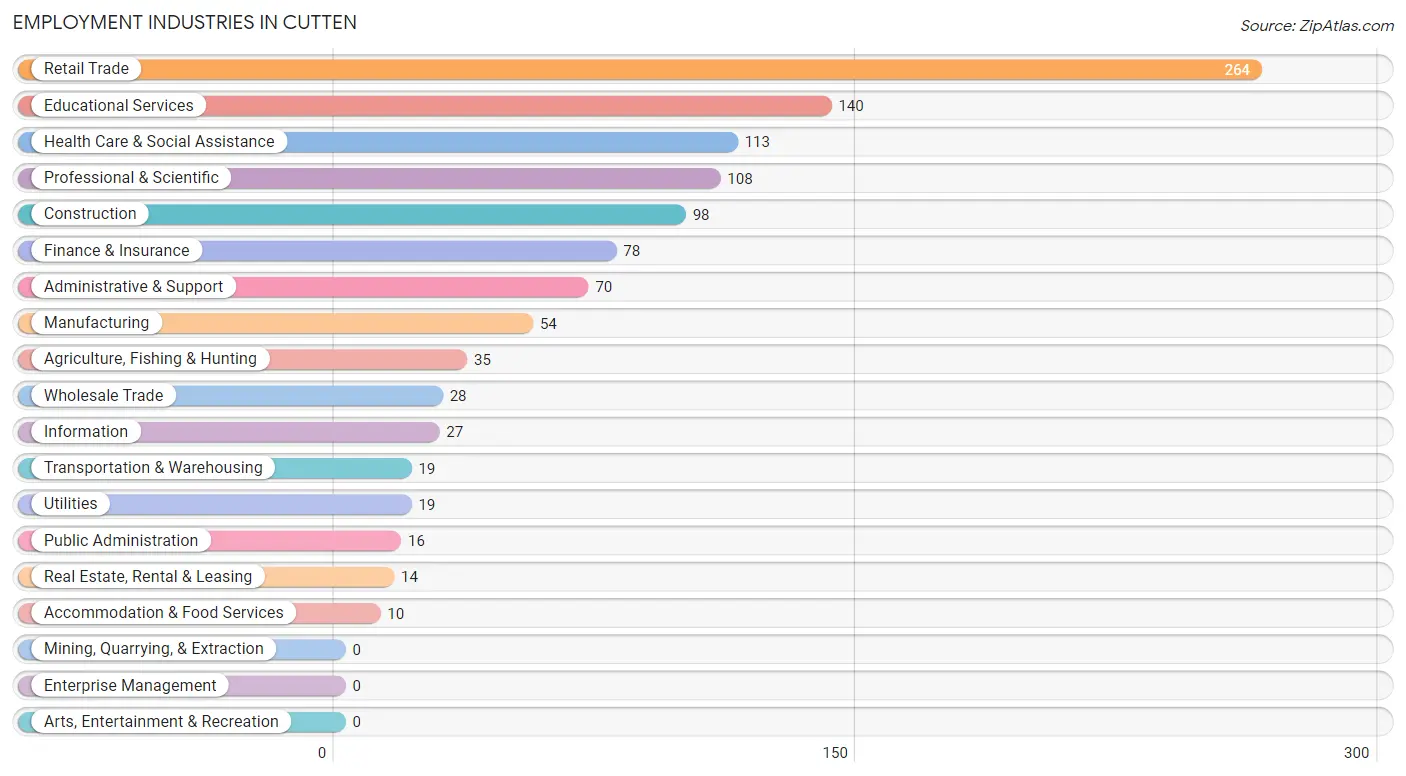
Employment Industries in Cutten
The major employment industries in Cutten include Retail Trade (264 | 20.5%), Educational Services (140 | 10.8%), Health Care & Social Assistance (113 | 8.8%), Professional & Scientific (108 | 8.4%), and Construction (98 | 7.6%).
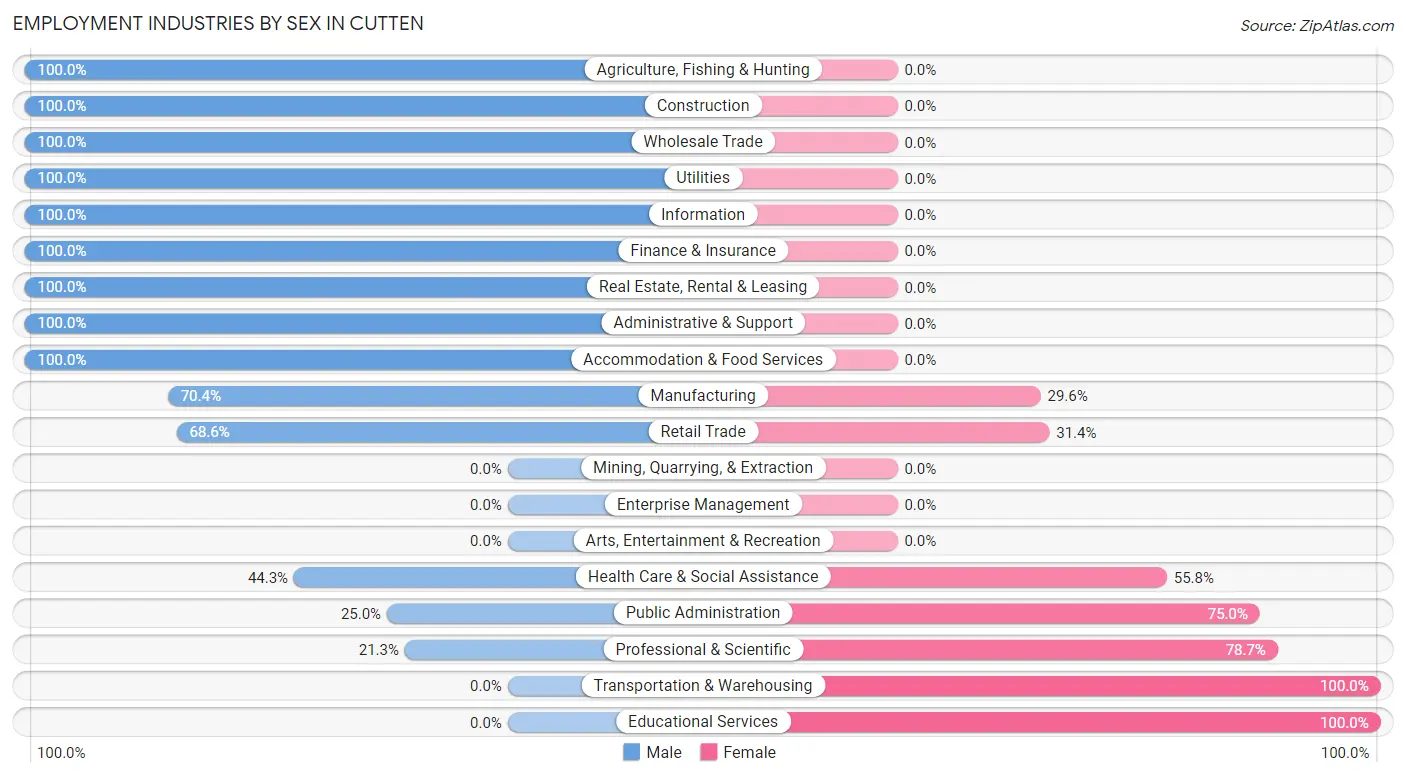
Employment Industries by Sex in Cutten
The Cutten industries that see more men than women are Agriculture, Fishing & Hunting (100.0%), Construction (100.0%), and Wholesale Trade (100.0%), whereas the industries that tend to have a higher number of women are Transportation & Warehousing (100.0%), Educational Services (100.0%), and Professional & Scientific (78.7%).
| Industry | Male | Female |
| Agriculture, Fishing & Hunting | 35 (100.0%) | 0 (0.0%) |
| Mining, Quarrying, & Extraction | 0 (0.0%) | 0 (0.0%) |
| Construction | 98 (100.0%) | 0 (0.0%) |
| Manufacturing | 38 (70.4%) | 16 (29.6%) |
| Wholesale Trade | 28 (100.0%) | 0 (0.0%) |
| Retail Trade | 181 (68.6%) | 83 (31.4%) |
| Transportation & Warehousing | 0 (0.0%) | 19 (100.0%) |
| Utilities | 19 (100.0%) | 0 (0.0%) |
| Information | 27 (100.0%) | 0 (0.0%) |
| Finance & Insurance | 78 (100.0%) | 0 (0.0%) |
| Real Estate, Rental & Leasing | 14 (100.0%) | 0 (0.0%) |
| Professional & Scientific | 23 (21.3%) | 85 (78.7%) |
| Enterprise Management | 0 (0.0%) | 0 (0.0%) |
| Administrative & Support | 70 (100.0%) | 0 (0.0%) |
| Educational Services | 0 (0.0%) | 140 (100.0%) |
| Health Care & Social Assistance | 50 (44.3%) | 63 (55.7%) |
| Arts, Entertainment & Recreation | 0 (0.0%) | 0 (0.0%) |
| Accommodation & Food Services | 10 (100.0%) | 0 (0.0%) |
| Public Administration | 4 (25.0%) | 12 (75.0%) |
| Total | 686 (53.2%) | 604 (46.8%) |
Education in Cutten
School Enrollment in Cutten
The most common levels of schooling among the 904 students in Cutten are elementary school (228 | 25.2%), high school (224 | 24.8%), and middle school (154 | 17.0%).
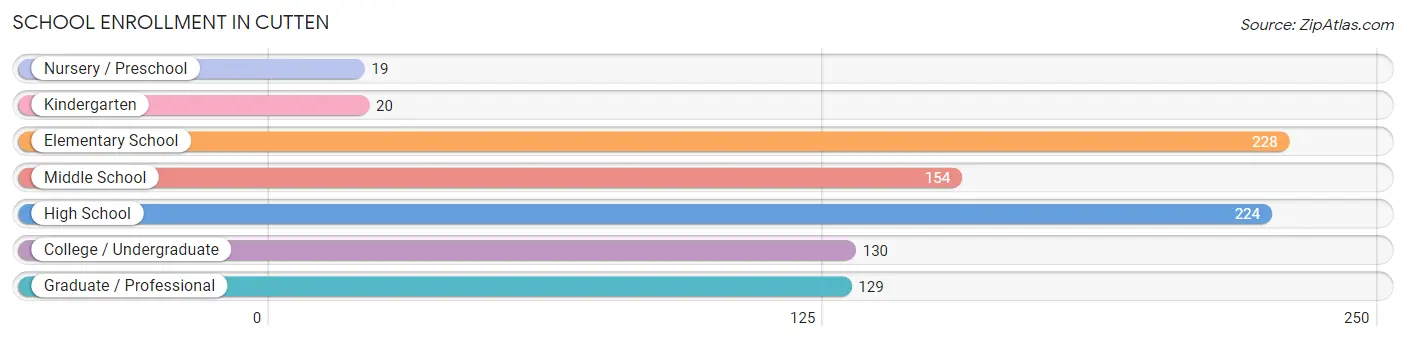
| School Level | # Students | % Students |
| Nursery / Preschool | 19 | 2.1% |
| Kindergarten | 20 | 2.2% |
| Elementary School | 228 | 25.2% |
| Middle School | 154 | 17.0% |
| High School | 224 | 24.8% |
| College / Undergraduate | 130 | 14.4% |
| Graduate / Professional | 129 | 14.3% |
| Total | 904 | 100.0% |
School Enrollment by Age by Funding Source in Cutten
Out of a total of 904 students who are enrolled in schools in Cutten, 118 (13.1%) attend a private institution, while the remaining 786 (86.9%) are enrolled in public schools. The age group of 3 to 4 year olds has the highest likelihood of being enrolled in private schools, with 8 (42.1% in the age bracket) enrolled. Conversely, the age group of 18 to 19 year olds has the lowest likelihood of being enrolled in a private school, with 85 (100.0% in the age bracket) attending a public institution.
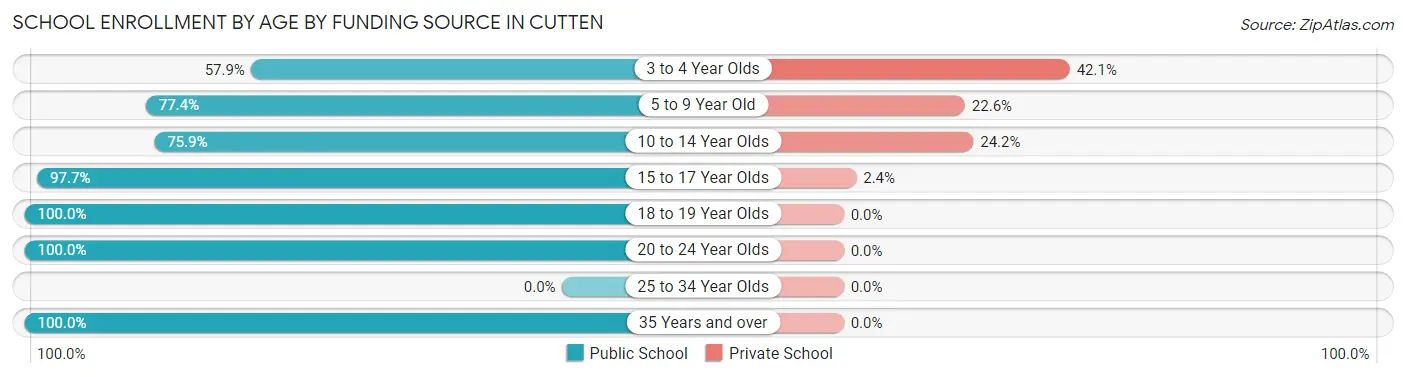
| Age Bracket | Public School | Private School |
| 3 to 4 Year Olds | 11 (57.9%) | 8 (42.1%) |
| 5 to 9 Year Old | 192 (77.4%) | 56 (22.6%) |
| 10 to 14 Year Olds | 157 (75.8%) | 50 (24.1%) |
| 15 to 17 Year Olds | 166 (97.7%) | 4 (2.4%) |
| 18 to 19 Year Olds | 85 (100.0%) | 0 (0.0%) |
| 20 to 24 Year Olds | 29 (100.0%) | 0 (0.0%) |
| 25 to 34 Year Olds | 0 (0.0%) | 0 (0.0%) |
| 35 Years and over | 146 (100.0%) | 0 (0.0%) |
| Total | 786 (86.9%) | 118 (13.1%) |
Educational Attainment by Field of Study in Cutten
Education (174 | 17.4%), engineering (135 | 13.5%), liberal arts & history (106 | 10.6%), physical & health sciences (98 | 9.8%), and science & technology (96 | 9.6%) are the most common fields of study among 1,002 individuals in Cutten who have obtained a bachelor's degree or higher.
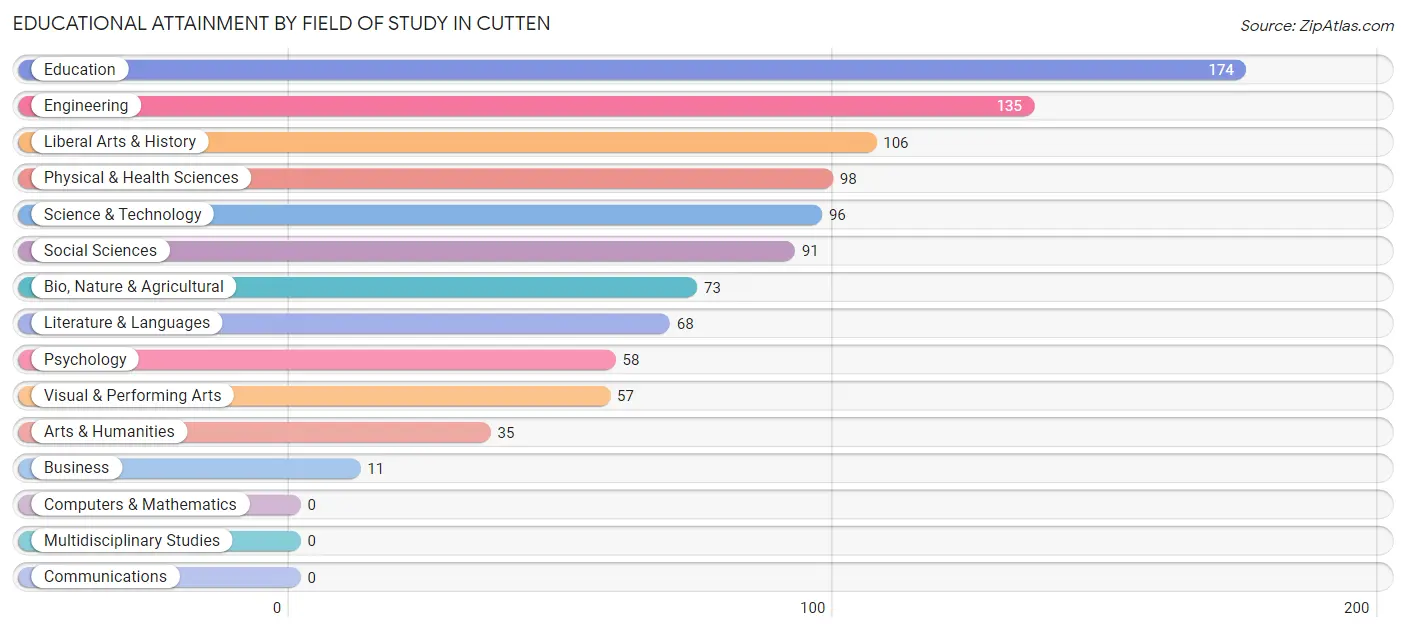
| Field of Study | # Graduates | % Graduates |
| Computers & Mathematics | 0 | 0.0% |
| Bio, Nature & Agricultural | 73 | 7.3% |
| Physical & Health Sciences | 98 | 9.8% |
| Psychology | 58 | 5.8% |
| Social Sciences | 91 | 9.1% |
| Engineering | 135 | 13.5% |
| Multidisciplinary Studies | 0 | 0.0% |
| Science & Technology | 96 | 9.6% |
| Business | 11 | 1.1% |
| Education | 174 | 17.4% |
| Literature & Languages | 68 | 6.8% |
| Liberal Arts & History | 106 | 10.6% |
| Visual & Performing Arts | 57 | 5.7% |
| Communications | 0 | 0.0% |
| Arts & Humanities | 35 | 3.5% |
| Total | 1,002 | 100.0% |
Transportation & Commute in Cutten
Vehicle Availability by Sex in Cutten
The most prevalent vehicle ownership categories in Cutten are males with 2 vehicles (252, accounting for 36.7%) and females with 2 vehicles (153, making up 42.9%).
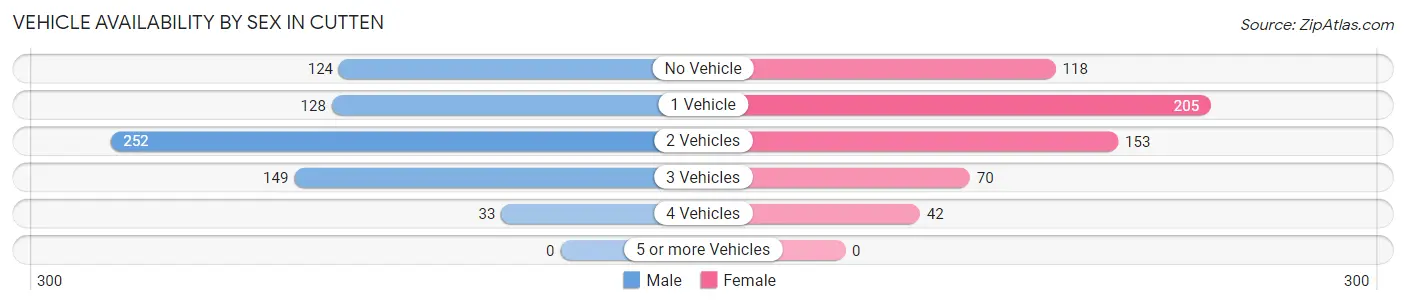
| Vehicles Available | Male | Female |
| No Vehicle | 124 (18.1%) | 118 (20.1%) |
| 1 Vehicle | 128 (18.7%) | 205 (34.9%) |
| 2 Vehicles | 252 (36.7%) | 153 (26.0%) |
| 3 Vehicles | 149 (21.7%) | 70 (11.9%) |
| 4 Vehicles | 33 (4.8%) | 42 (7.1%) |
| 5 or more Vehicles | 0 (0.0%) | 0 (0.0%) |
| Total | 686 (100.0%) | 588 (100.0%) |
Commute Time in Cutten
The most frequently occuring commute durations in Cutten are 10 to 14 minutes (519 commuters, 41.6%), 5 to 9 minutes (348 commuters, 27.9%), and 20 to 24 minutes (153 commuters, 12.3%).
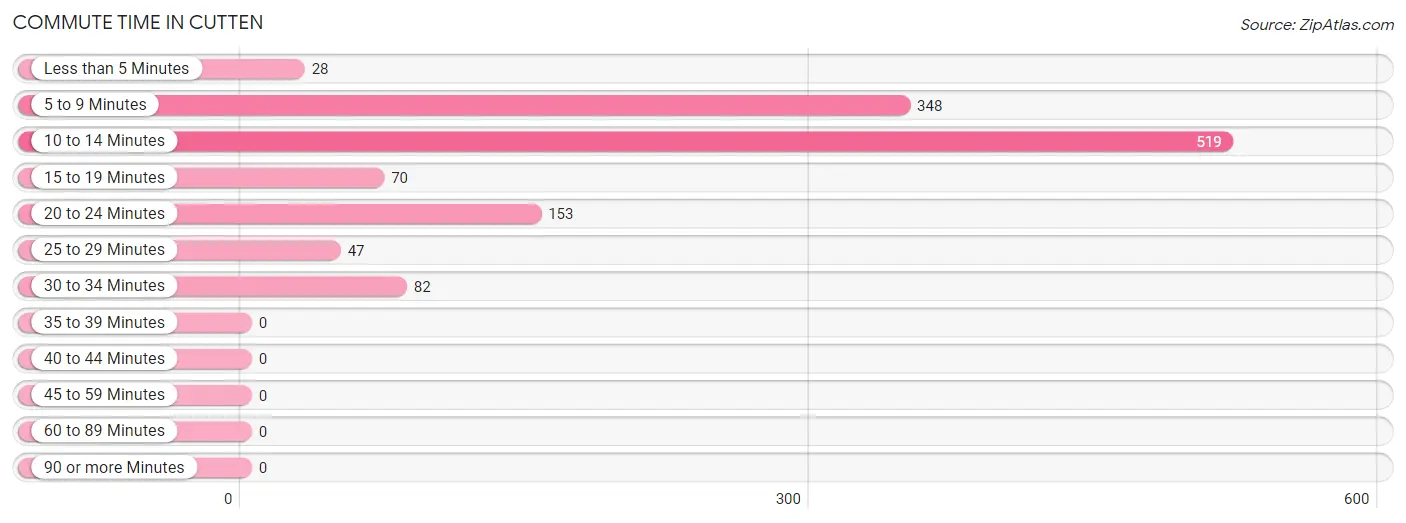
| Commute Time | # Commuters | % Commuters |
| Less than 5 Minutes | 28 | 2.2% |
| 5 to 9 Minutes | 348 | 27.9% |
| 10 to 14 Minutes | 519 | 41.6% |
| 15 to 19 Minutes | 70 | 5.6% |
| 20 to 24 Minutes | 153 | 12.3% |
| 25 to 29 Minutes | 47 | 3.8% |
| 30 to 34 Minutes | 82 | 6.6% |
| 35 to 39 Minutes | 0 | 0.0% |
| 40 to 44 Minutes | 0 | 0.0% |
| 45 to 59 Minutes | 0 | 0.0% |
| 60 to 89 Minutes | 0 | 0.0% |
| 90 or more Minutes | 0 | 0.0% |
Commute Time by Sex in Cutten
The most common commute times in Cutten are 10 to 14 minutes (276 commuters, 41.9%) for males and 10 to 14 minutes (243 commuters, 41.3%) for females.
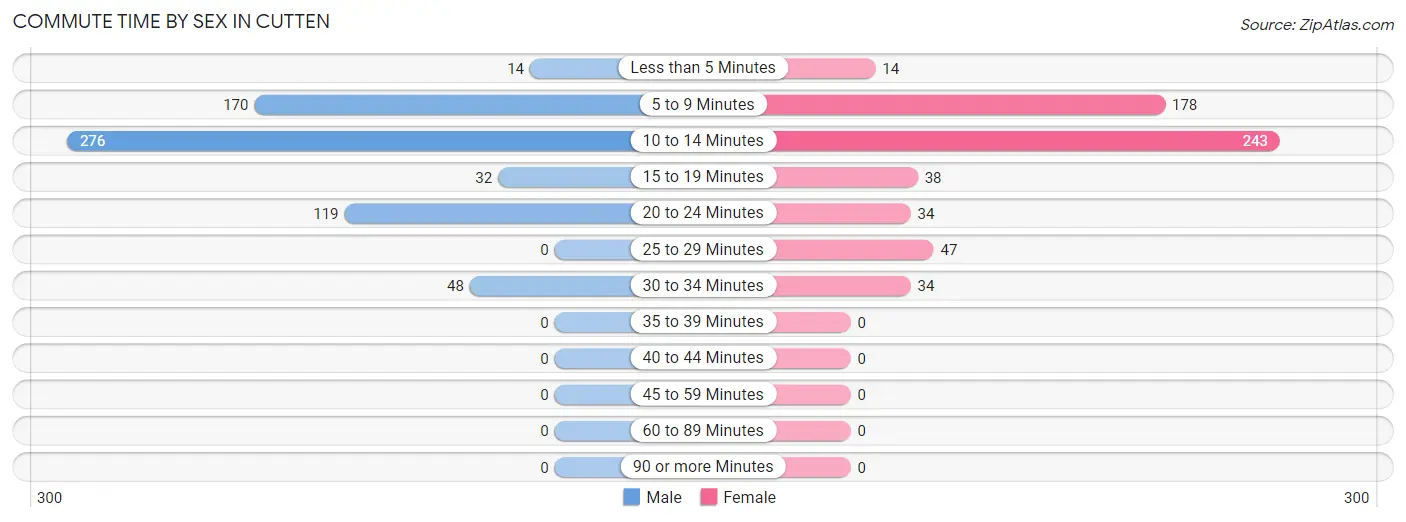
| Commute Time | Male | Female |
| Less than 5 Minutes | 14 (2.1%) | 14 (2.4%) |
| 5 to 9 Minutes | 170 (25.8%) | 178 (30.3%) |
| 10 to 14 Minutes | 276 (41.9%) | 243 (41.3%) |
| 15 to 19 Minutes | 32 (4.9%) | 38 (6.5%) |
| 20 to 24 Minutes | 119 (18.1%) | 34 (5.8%) |
| 25 to 29 Minutes | 0 (0.0%) | 47 (8.0%) |
| 30 to 34 Minutes | 48 (7.3%) | 34 (5.8%) |
| 35 to 39 Minutes | 0 (0.0%) | 0 (0.0%) |
| 40 to 44 Minutes | 0 (0.0%) | 0 (0.0%) |
| 45 to 59 Minutes | 0 (0.0%) | 0 (0.0%) |
| 60 to 89 Minutes | 0 (0.0%) | 0 (0.0%) |
| 90 or more Minutes | 0 (0.0%) | 0 (0.0%) |
Time of Departure to Work by Sex in Cutten
The most frequent times of departure to work in Cutten are 9:00 AM to 9:59 AM (162, 24.6%) for males and 7:30 AM to 7:59 AM (186, 31.6%) for females.
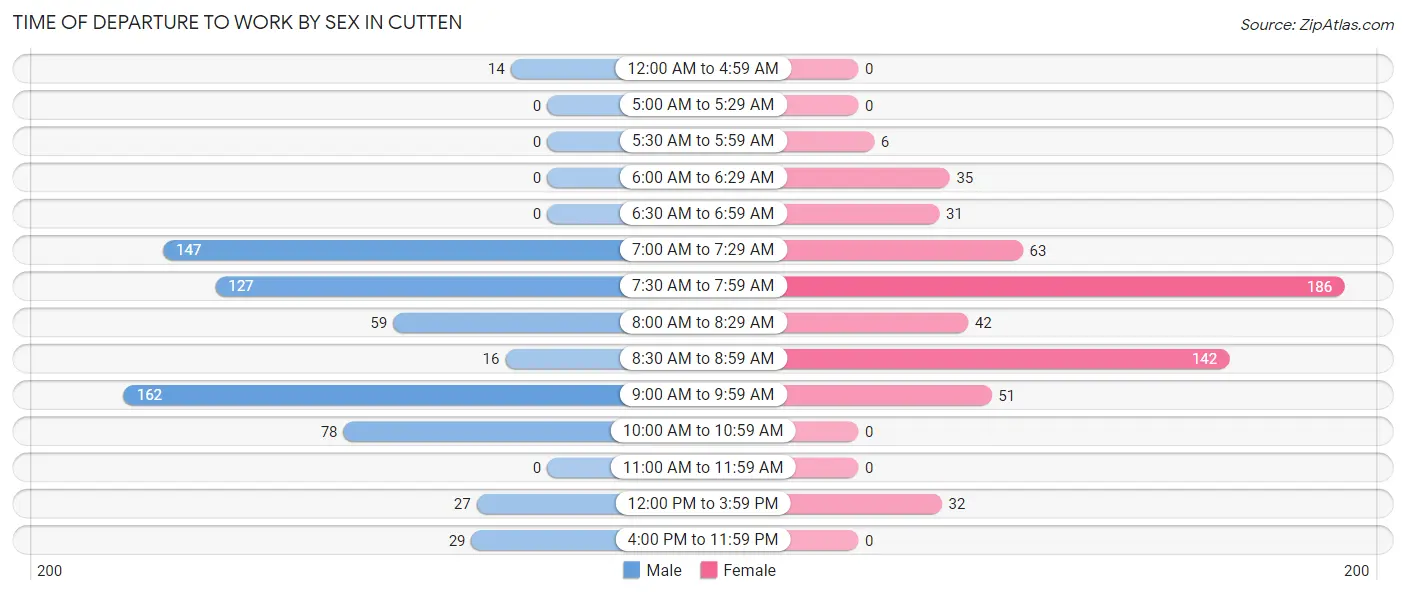
| Time of Departure | Male | Female |
| 12:00 AM to 4:59 AM | 14 (2.1%) | 0 (0.0%) |
| 5:00 AM to 5:29 AM | 0 (0.0%) | 0 (0.0%) |
| 5:30 AM to 5:59 AM | 0 (0.0%) | 6 (1.0%) |
| 6:00 AM to 6:29 AM | 0 (0.0%) | 35 (5.9%) |
| 6:30 AM to 6:59 AM | 0 (0.0%) | 31 (5.3%) |
| 7:00 AM to 7:29 AM | 147 (22.3%) | 63 (10.7%) |
| 7:30 AM to 7:59 AM | 127 (19.3%) | 186 (31.6%) |
| 8:00 AM to 8:29 AM | 59 (8.9%) | 42 (7.1%) |
| 8:30 AM to 8:59 AM | 16 (2.4%) | 142 (24.1%) |
| 9:00 AM to 9:59 AM | 162 (24.6%) | 51 (8.7%) |
| 10:00 AM to 10:59 AM | 78 (11.8%) | 0 (0.0%) |
| 11:00 AM to 11:59 AM | 0 (0.0%) | 0 (0.0%) |
| 12:00 PM to 3:59 PM | 27 (4.1%) | 32 (5.4%) |
| 4:00 PM to 11:59 PM | 29 (4.4%) | 0 (0.0%) |
| Total | 659 (100.0%) | 588 (100.0%) |
Housing Occupancy in Cutten
Occupancy by Ownership in Cutten
Of the total 1,240 dwellings in Cutten, owner-occupied units account for 900 (72.6%), while renter-occupied units make up 340 (27.4%).
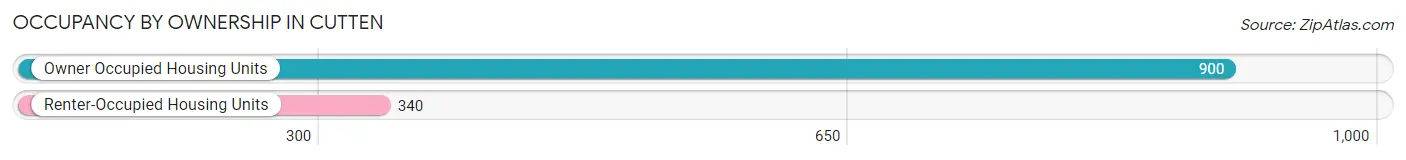
| Occupancy | # Housing Units | % Housing Units |
| Owner Occupied Housing Units | 900 | 72.6% |
| Renter-Occupied Housing Units | 340 | 27.4% |
| Total Occupied Housing Units | 1,240 | 100.0% |
Occupancy by Household Size in Cutten
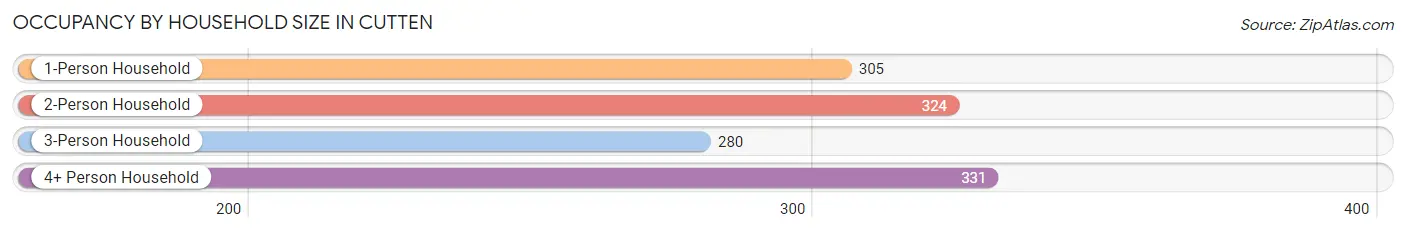
| Household Size | # Housing Units | % Housing Units |
| 1-Person Household | 305 | 24.6% |
| 2-Person Household | 324 | 26.1% |
| 3-Person Household | 280 | 22.6% |
| 4+ Person Household | 331 | 26.7% |
| Total Housing Units | 1,240 | 100.0% |
Occupancy by Ownership by Household Size in Cutten
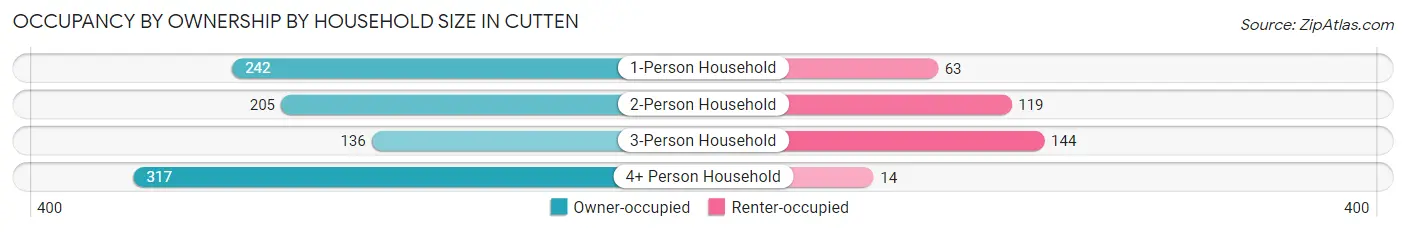
| Household Size | Owner-occupied | Renter-occupied |
| 1-Person Household | 242 (79.3%) | 63 (20.7%) |
| 2-Person Household | 205 (63.3%) | 119 (36.7%) |
| 3-Person Household | 136 (48.6%) | 144 (51.4%) |
| 4+ Person Household | 317 (95.8%) | 14 (4.2%) |
| Total Housing Units | 900 (72.6%) | 340 (27.4%) |
Occupancy by Educational Attainment in Cutten
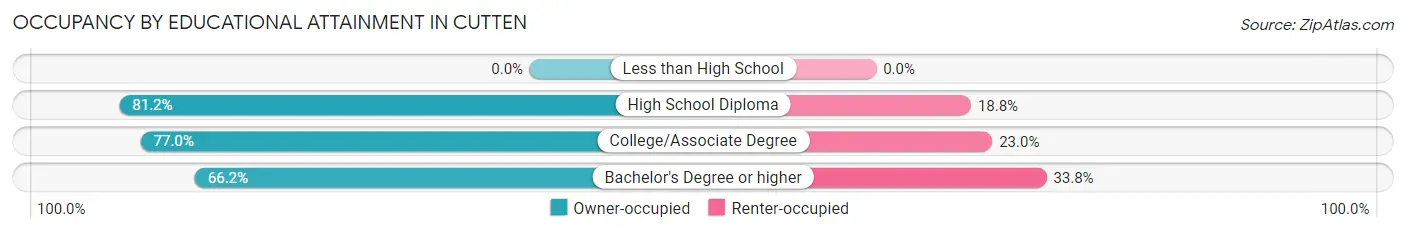
| Household Size | Owner-occupied | Renter-occupied |
| Less than High School | 0 (0.0%) | 0 (0.0%) |
| High School Diploma | 229 (81.2%) | 53 (18.8%) |
| College/Associate Degree | 261 (77.0%) | 78 (23.0%) |
| Bachelor's Degree or higher | 410 (66.2%) | 209 (33.8%) |
Occupancy by Age of Householder in Cutten
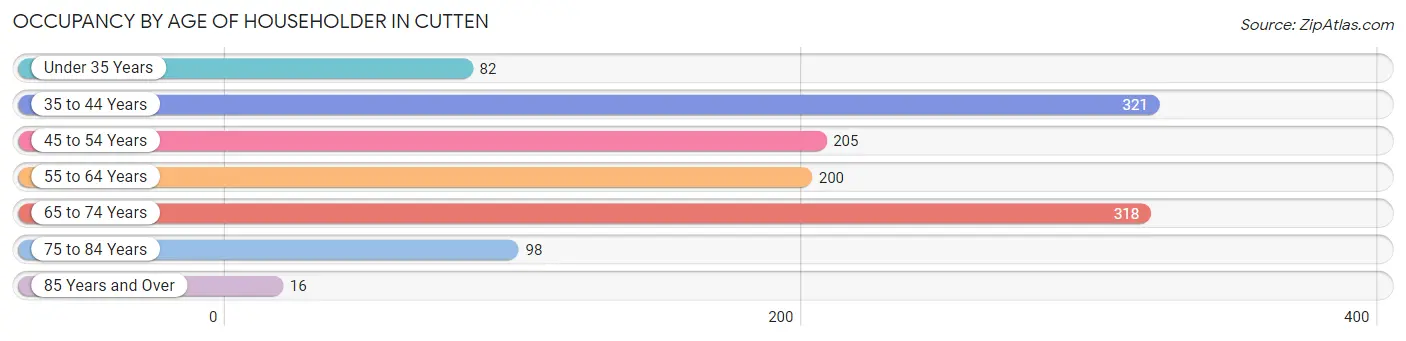
| Age Bracket | # Households | % Households |
| Under 35 Years | 82 | 6.6% |
| 35 to 44 Years | 321 | 25.9% |
| 45 to 54 Years | 205 | 16.5% |
| 55 to 64 Years | 200 | 16.1% |
| 65 to 74 Years | 318 | 25.7% |
| 75 to 84 Years | 98 | 7.9% |
| 85 Years and Over | 16 | 1.3% |
| Total | 1,240 | 100.0% |
Housing Finances in Cutten
Median Income by Occupancy in Cutten
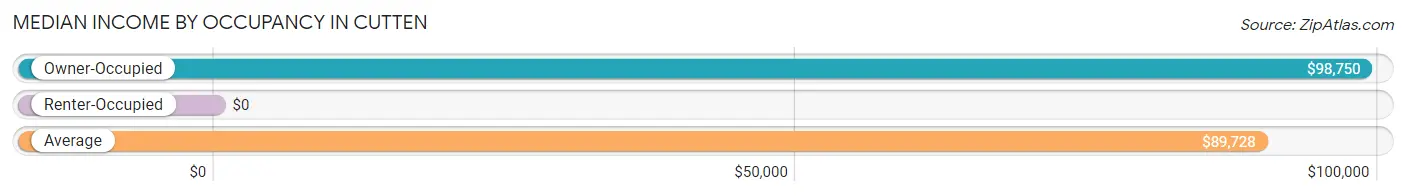
| Occupancy Type | # Households | Median Income |
| Owner-Occupied | 900 (72.6%) | $98,750 |
| Renter-Occupied | 340 (27.4%) | $0 |
| Average | 1,240 (100.0%) | $89,728 |
Occupancy by Householder Income Bracket in Cutten
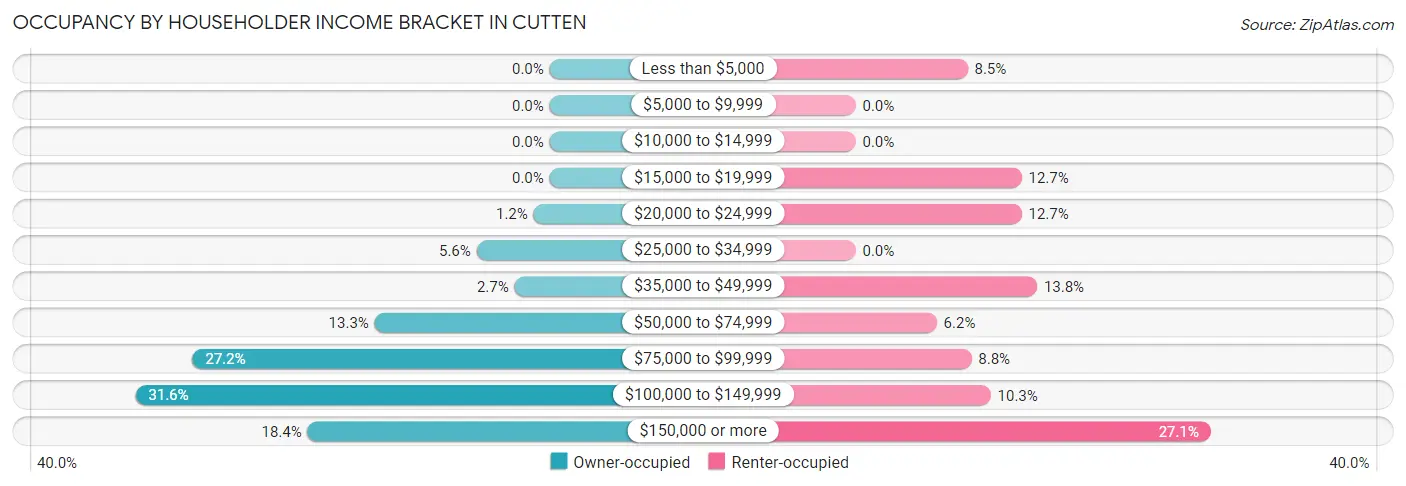
| Income Bracket | Owner-occupied | Renter-occupied |
| Less than $5,000 | 0 (0.0%) | 29 (8.5%) |
| $5,000 to $9,999 | 0 (0.0%) | 0 (0.0%) |
| $10,000 to $14,999 | 0 (0.0%) | 0 (0.0%) |
| $15,000 to $19,999 | 0 (0.0%) | 43 (12.7%) |
| $20,000 to $24,999 | 11 (1.2%) | 43 (12.7%) |
| $25,000 to $34,999 | 50 (5.6%) | 0 (0.0%) |
| $35,000 to $49,999 | 24 (2.7%) | 47 (13.8%) |
| $50,000 to $74,999 | 120 (13.3%) | 21 (6.2%) |
| $75,000 to $99,999 | 245 (27.2%) | 30 (8.8%) |
| $100,000 to $149,999 | 284 (31.6%) | 35 (10.3%) |
| $150,000 or more | 166 (18.4%) | 92 (27.1%) |
| Total | 900 (100.0%) | 340 (100.0%) |
Monthly Housing Cost Tiers in Cutten
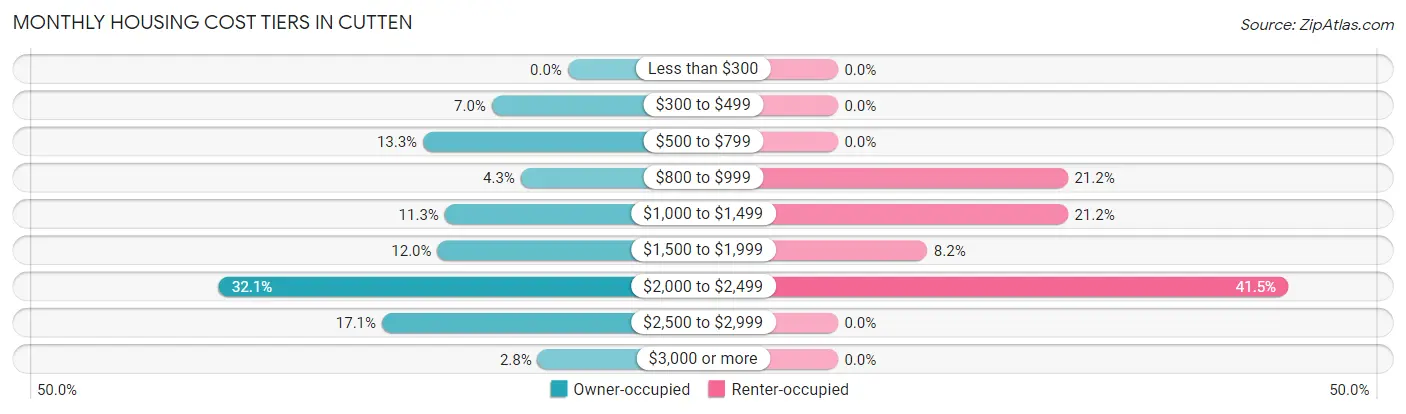
| Monthly Cost | Owner-occupied | Renter-occupied |
| Less than $300 | 0 (0.0%) | 0 (0.0%) |
| $300 to $499 | 63 (7.0%) | 0 (0.0%) |
| $500 to $799 | 120 (13.3%) | 0 (0.0%) |
| $800 to $999 | 39 (4.3%) | 72 (21.2%) |
| $1,000 to $1,499 | 102 (11.3%) | 72 (21.2%) |
| $1,500 to $1,999 | 108 (12.0%) | 28 (8.2%) |
| $2,000 to $2,499 | 289 (32.1%) | 141 (41.5%) |
| $2,500 to $2,999 | 154 (17.1%) | 0 (0.0%) |
| $3,000 or more | 25 (2.8%) | 0 (0.0%) |
| Total | 900 (100.0%) | 340 (100.0%) |
Physical Housing Characteristics in Cutten
Housing Structures in Cutten
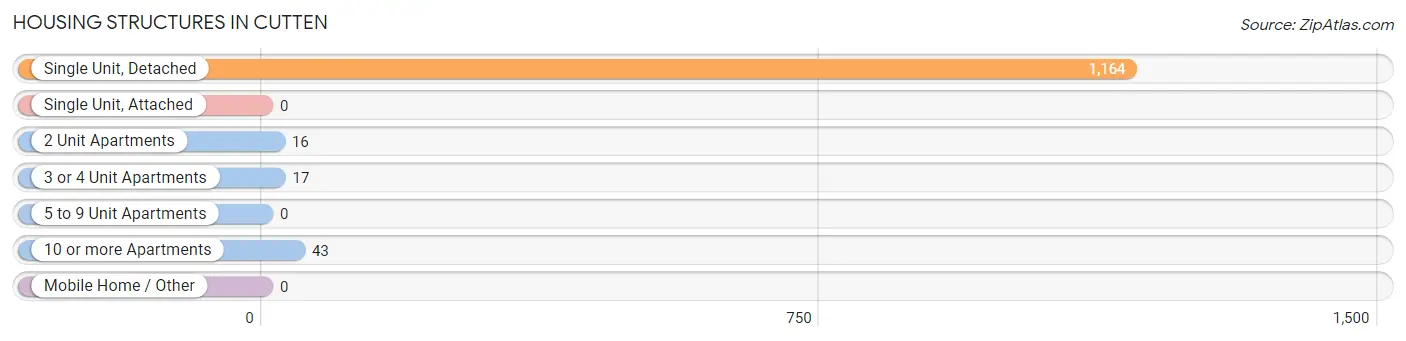
| Structure Type | # Housing Units | % Housing Units |
| Single Unit, Detached | 1,164 | 93.9% |
| Single Unit, Attached | 0 | 0.0% |
| 2 Unit Apartments | 16 | 1.3% |
| 3 or 4 Unit Apartments | 17 | 1.4% |
| 5 to 9 Unit Apartments | 0 | 0.0% |
| 10 or more Apartments | 43 | 3.5% |
| Mobile Home / Other | 0 | 0.0% |
| Total | 1,240 | 100.0% |
Housing Structures by Occupancy in Cutten
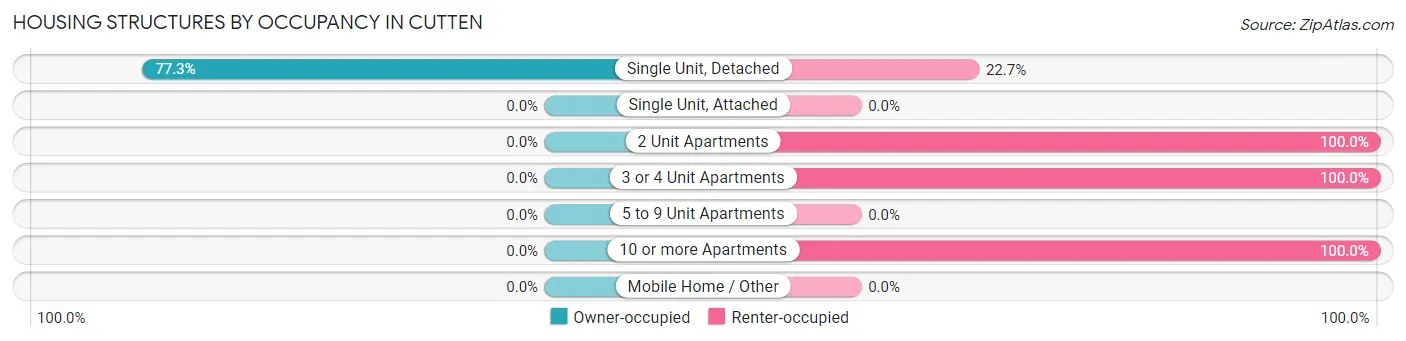
| Structure Type | Owner-occupied | Renter-occupied |
| Single Unit, Detached | 900 (77.3%) | 264 (22.7%) |
| Single Unit, Attached | 0 (0.0%) | 0 (0.0%) |
| 2 Unit Apartments | 0 (0.0%) | 16 (100.0%) |
| 3 or 4 Unit Apartments | 0 (0.0%) | 17 (100.0%) |
| 5 to 9 Unit Apartments | 0 (0.0%) | 0 (0.0%) |
| 10 or more Apartments | 0 (0.0%) | 43 (100.0%) |
| Mobile Home / Other | 0 (0.0%) | 0 (0.0%) |
| Total | 900 (72.6%) | 340 (27.4%) |
Housing Structures by Number of Rooms in Cutten
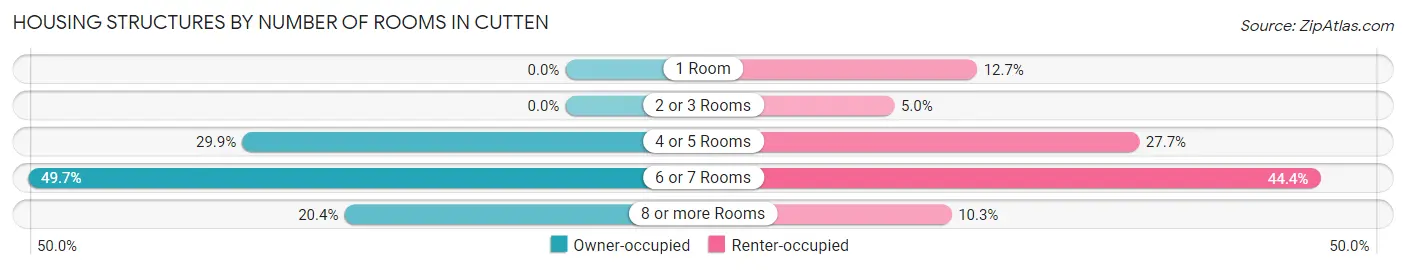
| Number of Rooms | Owner-occupied | Renter-occupied |
| 1 Room | 0 (0.0%) | 43 (12.7%) |
| 2 or 3 Rooms | 0 (0.0%) | 17 (5.0%) |
| 4 or 5 Rooms | 269 (29.9%) | 94 (27.7%) |
| 6 or 7 Rooms | 447 (49.7%) | 151 (44.4%) |
| 8 or more Rooms | 184 (20.4%) | 35 (10.3%) |
| Total | 900 (100.0%) | 340 (100.0%) |
Housing Structure by Heating Type in Cutten
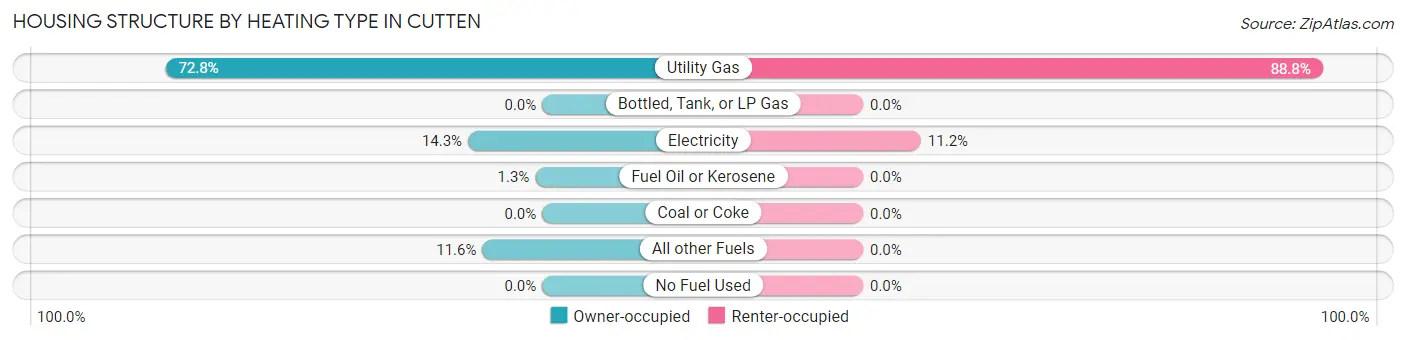
| Heating Type | Owner-occupied | Renter-occupied |
| Utility Gas | 655 (72.8%) | 302 (88.8%) |
| Bottled, Tank, or LP Gas | 0 (0.0%) | 0 (0.0%) |
| Electricity | 129 (14.3%) | 38 (11.2%) |
| Fuel Oil or Kerosene | 12 (1.3%) | 0 (0.0%) |
| Coal or Coke | 0 (0.0%) | 0 (0.0%) |
| All other Fuels | 104 (11.6%) | 0 (0.0%) |
| No Fuel Used | 0 (0.0%) | 0 (0.0%) |
| Total | 900 (100.0%) | 340 (100.0%) |
Household Vehicle Usage in Cutten
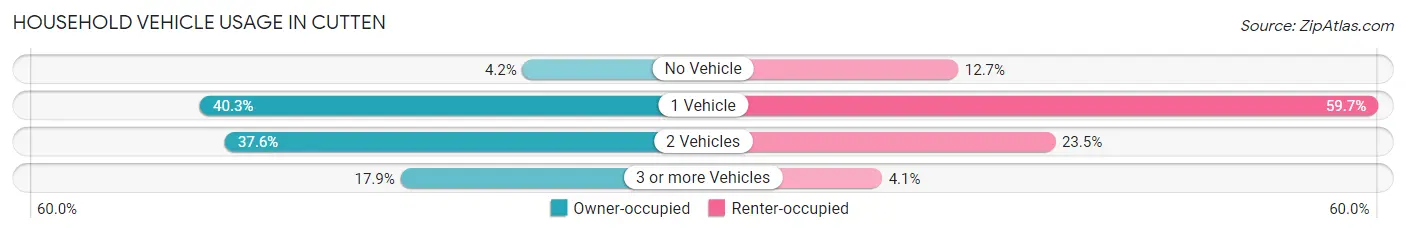
| Vehicles per Household | Owner-occupied | Renter-occupied |
| No Vehicle | 38 (4.2%) | 43 (12.7%) |
| 1 Vehicle | 363 (40.3%) | 203 (59.7%) |
| 2 Vehicles | 338 (37.6%) | 80 (23.5%) |
| 3 or more Vehicles | 161 (17.9%) | 14 (4.1%) |
| Total | 900 (100.0%) | 340 (100.0%) |
Real Estate & Mortgages in Cutten
Real Estate and Mortgage Overview in Cutten
| Characteristic | Without Mortgage | With Mortgage |
| Housing Units | 223 | 677 |
| Median Property Value | $393,000 | $418,200 |
| Median Household Income | $76,635 | $155 |
| Monthly Housing Costs | $563 | $25 |
| Real Estate Taxes | $2,565 | $0 |
Property Value by Mortgage Status in Cutten
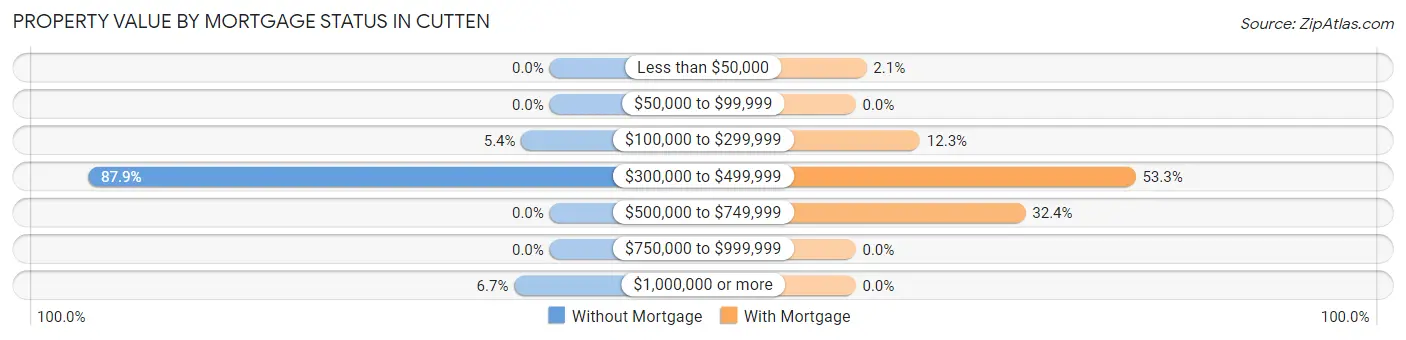
| Property Value | Without Mortgage | With Mortgage |
| Less than $50,000 | 0 (0.0%) | 14 (2.1%) |
| $50,000 to $99,999 | 0 (0.0%) | 0 (0.0%) |
| $100,000 to $299,999 | 12 (5.4%) | 83 (12.3%) |
| $300,000 to $499,999 | 196 (87.9%) | 361 (53.3%) |
| $500,000 to $749,999 | 0 (0.0%) | 219 (32.4%) |
| $750,000 to $999,999 | 0 (0.0%) | 0 (0.0%) |
| $1,000,000 or more | 15 (6.7%) | 0 (0.0%) |
| Total | 223 (100.0%) | 677 (100.0%) |
Household Income by Mortgage Status in Cutten
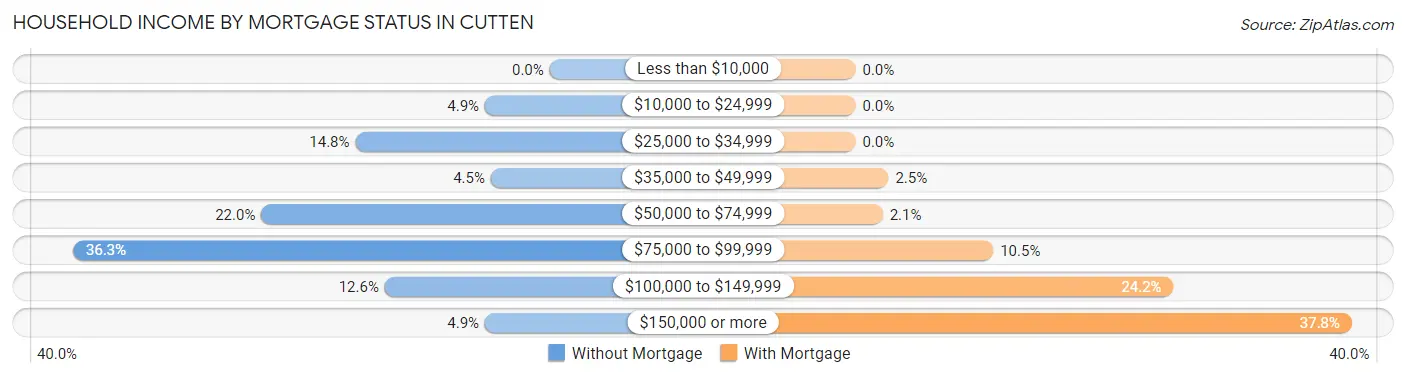
| Household Income | Without Mortgage | With Mortgage |
| Less than $10,000 | 0 (0.0%) | 0 (0.0%) |
| $10,000 to $24,999 | 11 (4.9%) | 0 (0.0%) |
| $25,000 to $34,999 | 33 (14.8%) | 0 (0.0%) |
| $35,000 to $49,999 | 10 (4.5%) | 17 (2.5%) |
| $50,000 to $74,999 | 49 (22.0%) | 14 (2.1%) |
| $75,000 to $99,999 | 81 (36.3%) | 71 (10.5%) |
| $100,000 to $149,999 | 28 (12.6%) | 164 (24.2%) |
| $150,000 or more | 11 (4.9%) | 256 (37.8%) |
| Total | 223 (100.0%) | 677 (100.0%) |
Property Value to Household Income Ratio in Cutten
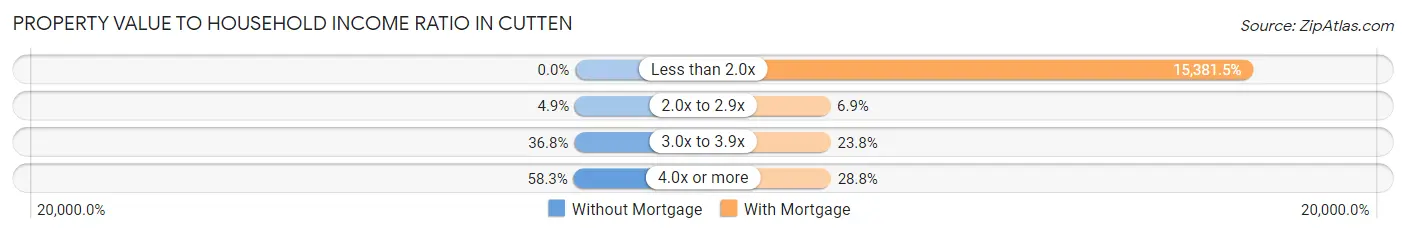
| Value-to-Income Ratio | Without Mortgage | With Mortgage |
| Less than 2.0x | 0 (0.0%) | 104,133 (15,381.5%) |
| 2.0x to 2.9x | 11 (4.9%) | 47 (6.9%) |
| 3.0x to 3.9x | 82 (36.8%) | 161 (23.8%) |
| 4.0x or more | 130 (58.3%) | 195 (28.8%) |
| Total | 223 (100.0%) | 677 (100.0%) |
Real Estate Taxes by Mortgage Status in Cutten
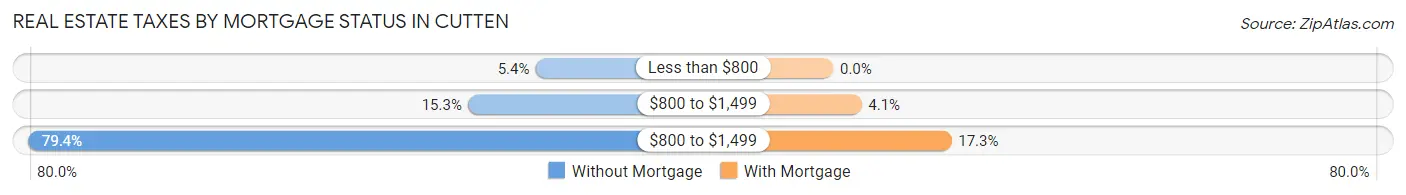
| Property Taxes | Without Mortgage | With Mortgage |
| Less than $800 | 12 (5.4%) | 0 (0.0%) |
| $800 to $1,499 | 34 (15.2%) | 28 (4.1%) |
| $800 to $1,499 | 177 (79.4%) | 117 (17.3%) |
| Total | 223 (100.0%) | 677 (100.0%) |
Health & Disability in Cutten
Health Insurance Coverage by Age in Cutten
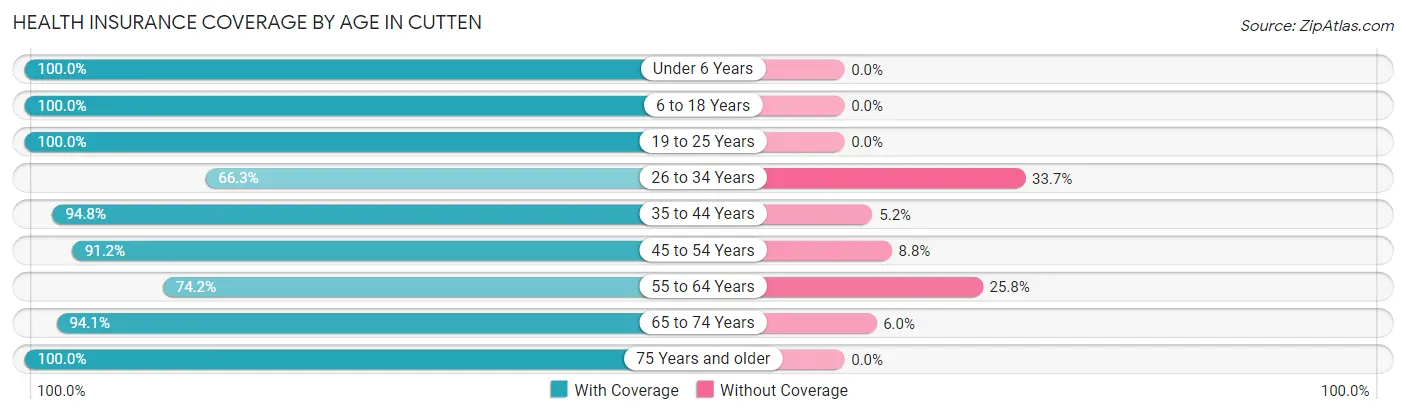
| Age Bracket | With Coverage | Without Coverage |
| Under 6 Years | 184 (100.0%) | 0 (0.0%) |
| 6 to 18 Years | 768 (100.0%) | 0 (0.0%) |
| 19 to 25 Years | 134 (100.0%) | 0 (0.0%) |
| 26 to 34 Years | 120 (66.3%) | 61 (33.7%) |
| 35 to 44 Years | 688 (94.8%) | 38 (5.2%) |
| 45 to 54 Years | 279 (91.2%) | 27 (8.8%) |
| 55 to 64 Years | 213 (74.2%) | 74 (25.8%) |
| 65 to 74 Years | 427 (94.1%) | 27 (5.9%) |
| 75 Years and older | 255 (100.0%) | 0 (0.0%) |
| Total | 3,068 (93.1%) | 227 (6.9%) |
Health Insurance Coverage by Citizenship Status in Cutten
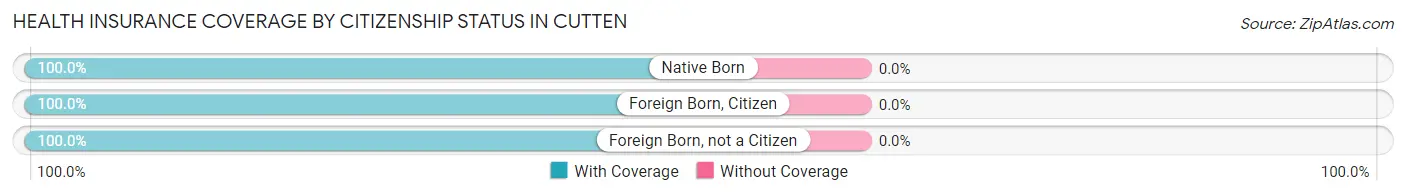
| Citizenship Status | With Coverage | Without Coverage |
| Native Born | 184 (100.0%) | 0 (0.0%) |
| Foreign Born, Citizen | 768 (100.0%) | 0 (0.0%) |
| Foreign Born, not a Citizen | 134 (100.0%) | 0 (0.0%) |
Health Insurance Coverage by Household Income in Cutten
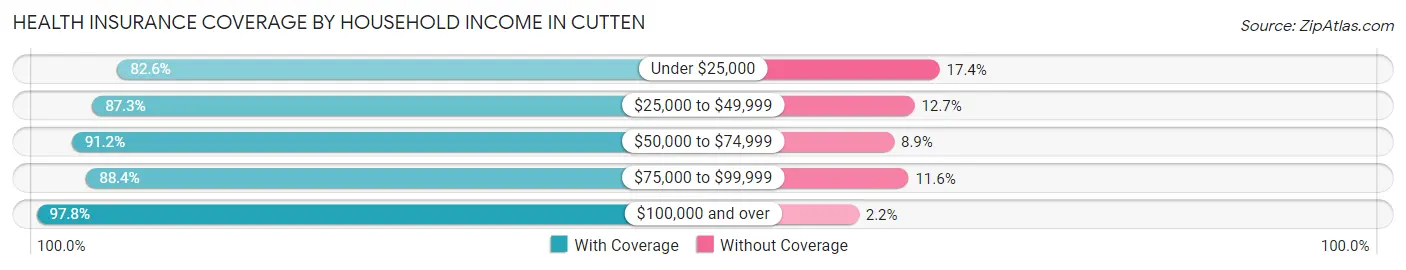
| Household Income | With Coverage | Without Coverage |
| Under $25,000 | 209 (82.6%) | 44 (17.4%) |
| $25,000 to $49,999 | 179 (87.3%) | 26 (12.7%) |
| $50,000 to $74,999 | 278 (91.1%) | 27 (8.8%) |
| $75,000 to $99,999 | 704 (88.4%) | 92 (11.6%) |
| $100,000 and over | 1,662 (97.8%) | 38 (2.2%) |
Public vs Private Health Insurance Coverage by Age in Cutten
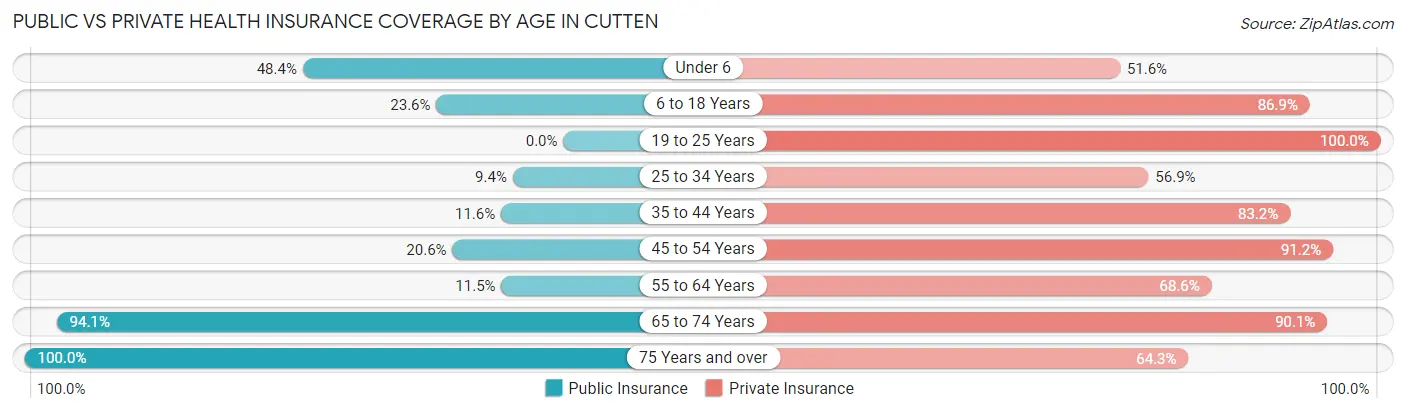
| Age Bracket | Public Insurance | Private Insurance |
| Under 6 | 89 (48.4%) | 95 (51.6%) |
| 6 to 18 Years | 181 (23.6%) | 667 (86.9%) |
| 19 to 25 Years | 0 (0.0%) | 134 (100.0%) |
| 25 to 34 Years | 17 (9.4%) | 103 (56.9%) |
| 35 to 44 Years | 84 (11.6%) | 604 (83.2%) |
| 45 to 54 Years | 63 (20.6%) | 279 (91.2%) |
| 55 to 64 Years | 33 (11.5%) | 197 (68.6%) |
| 65 to 74 Years | 427 (94.1%) | 409 (90.1%) |
| 75 Years and over | 255 (100.0%) | 164 (64.3%) |
| Total | 1,149 (34.9%) | 2,652 (80.5%) |
Disability Status by Sex by Age in Cutten
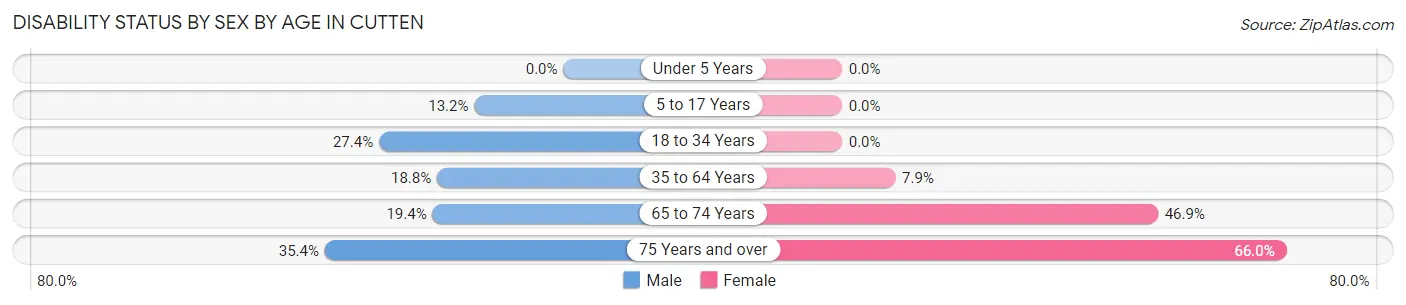
| Age Bracket | Male | Female |
| Under 5 Years | 0 (0.0%) | 0 (0.0%) |
| 5 to 17 Years | 39 (13.2%) | 0 (0.0%) |
| 18 to 34 Years | 46 (27.4%) | 0 (0.0%) |
| 35 to 64 Years | 148 (18.8%) | 42 (7.9%) |
| 65 to 74 Years | 41 (19.4%) | 114 (46.9%) |
| 75 Years and over | 34 (35.4%) | 105 (66.0%) |
Disability Class by Sex by Age in Cutten
Disability Class: Hearing Difficulty
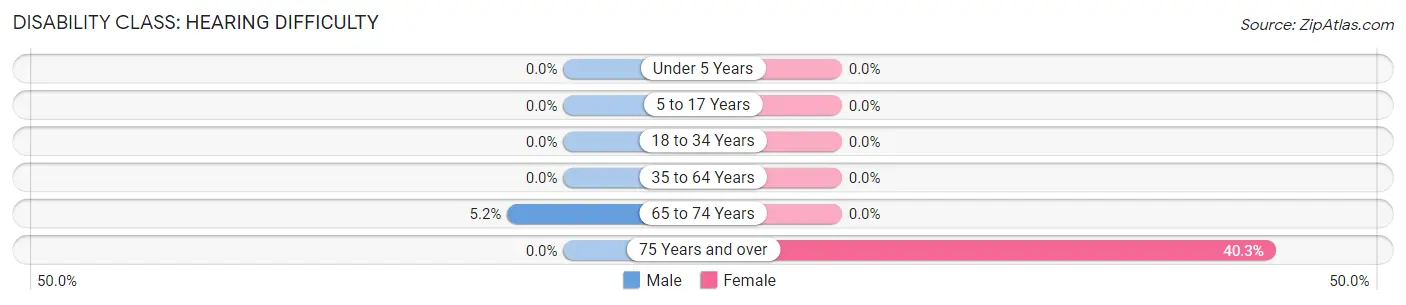
| Age Bracket | Male | Female |
| Under 5 Years | 0 (0.0%) | 0 (0.0%) |
| 5 to 17 Years | 0 (0.0%) | 0 (0.0%) |
| 18 to 34 Years | 0 (0.0%) | 0 (0.0%) |
| 35 to 64 Years | 0 (0.0%) | 0 (0.0%) |
| 65 to 74 Years | 11 (5.2%) | 0 (0.0%) |
| 75 Years and over | 0 (0.0%) | 64 (40.3%) |
Disability Class: Vision Difficulty
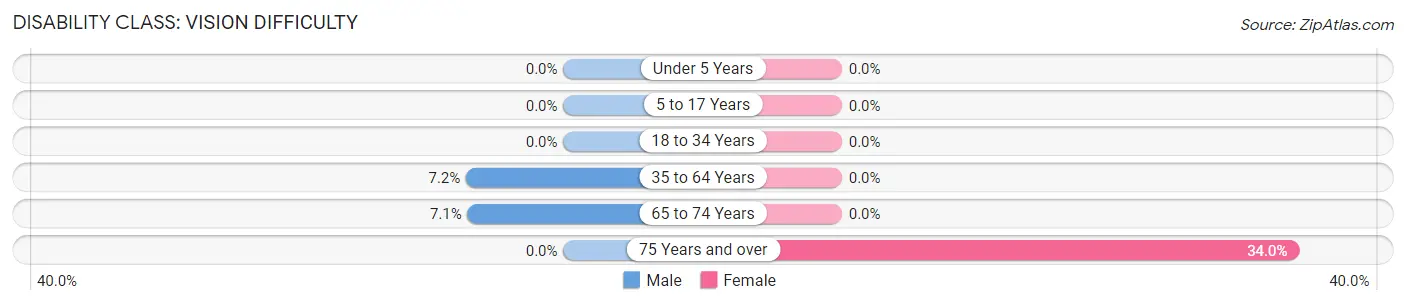
| Age Bracket | Male | Female |
| Under 5 Years | 0 (0.0%) | 0 (0.0%) |
| 5 to 17 Years | 0 (0.0%) | 0 (0.0%) |
| 18 to 34 Years | 0 (0.0%) | 0 (0.0%) |
| 35 to 64 Years | 57 (7.2%) | 0 (0.0%) |
| 65 to 74 Years | 15 (7.1%) | 0 (0.0%) |
| 75 Years and over | 0 (0.0%) | 54 (34.0%) |
Disability Class: Cognitive Difficulty
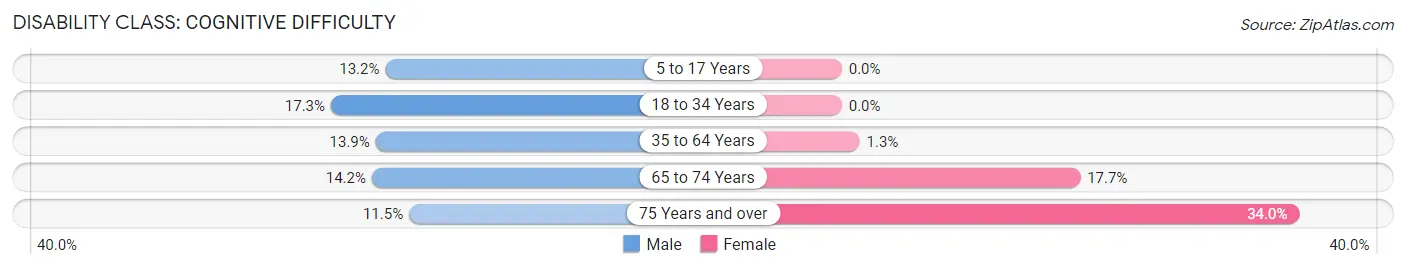
| Age Bracket | Male | Female |
| 5 to 17 Years | 39 (13.2%) | 0 (0.0%) |
| 18 to 34 Years | 29 (17.3%) | 0 (0.0%) |
| 35 to 64 Years | 110 (13.9%) | 7 (1.3%) |
| 65 to 74 Years | 30 (14.2%) | 43 (17.7%) |
| 75 Years and over | 11 (11.5%) | 54 (34.0%) |
Disability Class: Ambulatory Difficulty
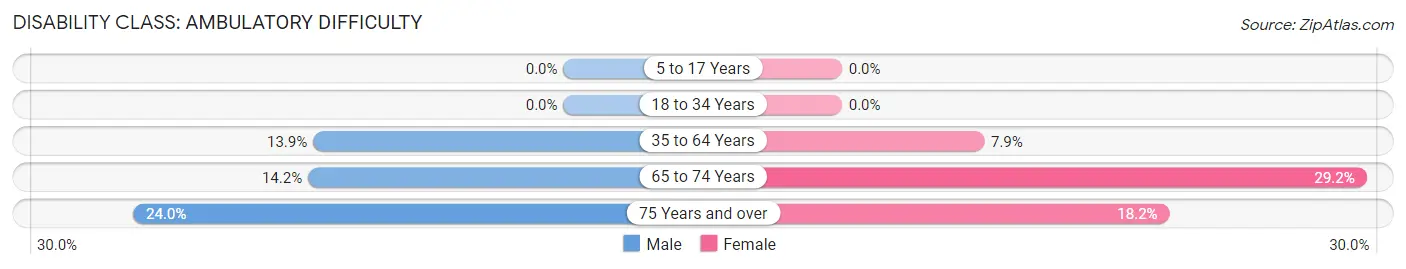
| Age Bracket | Male | Female |
| 5 to 17 Years | 0 (0.0%) | 0 (0.0%) |
| 18 to 34 Years | 0 (0.0%) | 0 (0.0%) |
| 35 to 64 Years | 110 (13.9%) | 42 (7.9%) |
| 65 to 74 Years | 30 (14.2%) | 71 (29.2%) |
| 75 Years and over | 23 (24.0%) | 29 (18.2%) |
Disability Class: Self-Care Difficulty
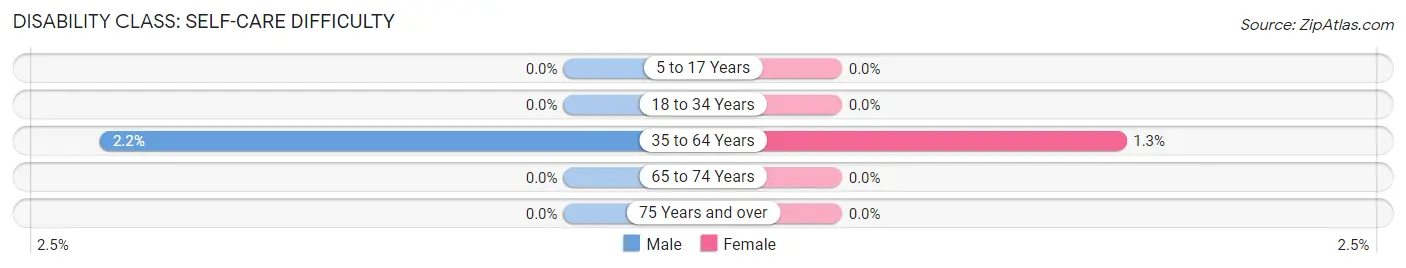
| Age Bracket | Male | Female |
| 5 to 17 Years | 0 (0.0%) | 0 (0.0%) |
| 18 to 34 Years | 0 (0.0%) | 0 (0.0%) |
| 35 to 64 Years | 17 (2.1%) | 7 (1.3%) |
| 65 to 74 Years | 0 (0.0%) | 0 (0.0%) |
| 75 Years and over | 0 (0.0%) | 0 (0.0%) |
Technology Access in Cutten
Computing Device Access in Cutten
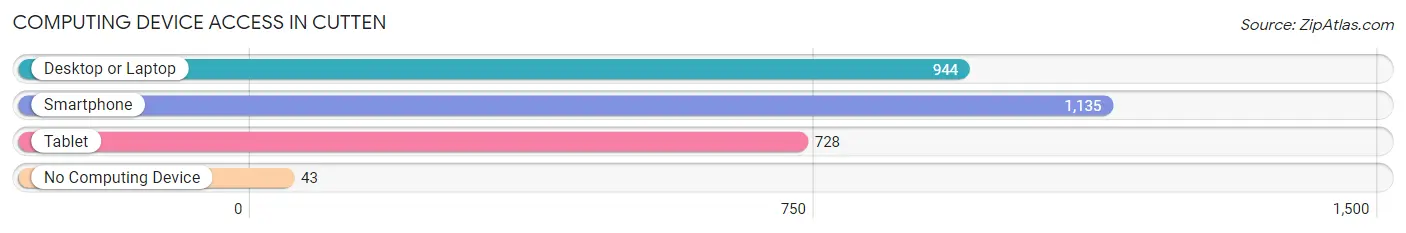
| Device Type | # Households | % Households |
| Desktop or Laptop | 944 | 76.1% |
| Smartphone | 1,135 | 91.5% |
| Tablet | 728 | 58.7% |
| No Computing Device | 43 | 3.5% |
| Total | 1,240 | 100.0% |
Internet Access in Cutten
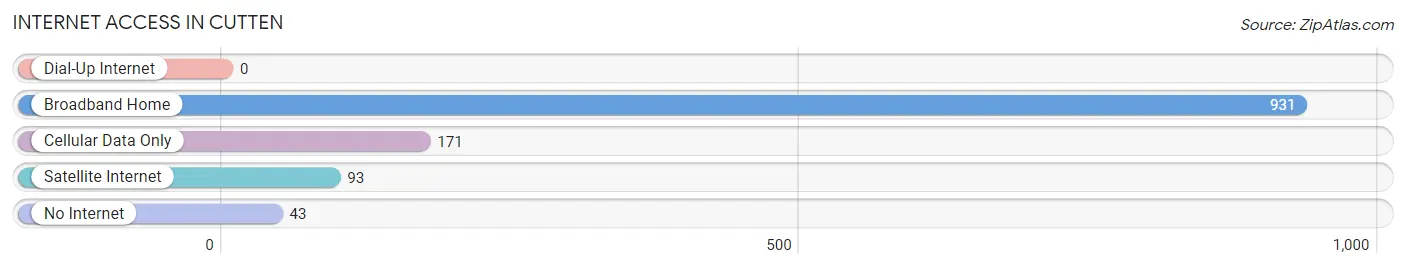
| Internet Type | # Households | % Households |
| Dial-Up Internet | 0 | 0.0% |
| Broadband Home | 931 | 75.1% |
| Cellular Data Only | 171 | 13.8% |
| Satellite Internet | 93 | 7.5% |
| No Internet | 43 | 3.5% |
| Total | 1,240 | 100.0% |
Cutten Summary
Cutten is a census-designated place located in Humboldt County, California. It is situated on the western edge of the county, approximately 8 miles north of Eureka and 6 miles south of Arcata. The population was 3,717 at the 2010 census.
Geography
Cutten is located at an elevation of approximately 200 feet above sea level. It is situated on the western edge of Humboldt County, approximately 8 miles north of Eureka and 6 miles south of Arcata. The area is surrounded by redwood forests and is located near the Pacific Ocean.
History
Cutten was originally inhabited by the Wiyot people, who lived in the area for thousands of years before the arrival of European settlers. The first European settlers arrived in the area in the 1850s, and the town was officially founded in 1887. The town was named after William Cutten, a local businessman and landowner.
In the early 1900s, Cutten was a thriving logging town. The town was home to several sawmills and lumber companies, and the local economy was largely dependent on the timber industry. The town also had a thriving fishing industry, and the local canneries were a major source of employment.
In the 1950s, the timber industry began to decline, and the local economy shifted to tourism and services. The town is now home to several restaurants, shops, and other businesses.
Economy
The economy of Cutten is largely based on tourism and services. The town is home to several restaurants, shops, and other businesses. The local economy is also supported by the timber industry, fishing, and agriculture.
Demographics
As of the 2010 census, the population of Cutten was 3,717. The racial makeup of the town was 87.3% White, 0.7% African American, 2.2% Native American, 1.2% Asian, 0.2% Pacific Islander, 5.2% from other races, and 3.2% from two or more races. Hispanic or Latino of any race were 11.2% of the population.
The median income for a household in Cutten was $41,944, and the median income for a family was $50,917. The per capita income for the town was $20,945. About 11.2% of families and 14.2% of the population were below the poverty line, including 19.2% of those under age 18 and 8.2% of those age 65 or over.
Conclusion
Cutten is a census-designated place located in Humboldt County, California. It is situated on the western edge of the county, approximately 8 miles north of Eureka and 6 miles south of Arcata. The population was 3,717 at the 2010 census. The town was originally inhabited by the Wiyot people, and was officially founded in 1887. The economy of Cutten is largely based on tourism and services, and the local economy is also supported by the timber industry, fishing, and agriculture. The racial makeup of the town was 87.3% White, 0.7% African American, 2.2% Native American, 1.2% Asian, 0.2% Pacific Islander, 5.2% from other races, and 3.2% from two or more races. The median income for a household in Cutten was $41,944, and the median income for a family was $50,917.
Common Questions
What is Per Capita Income in Cutten?
Per Capita income in Cutten is $38,912.
What is the Median Family Income in Cutten?
Median Family Income in Cutten is $103,194.
What is the Median Household income in Cutten?
Median Household Income in Cutten is $89,728.
What is Inequality or Gini Index in Cutten?
Inequality or Gini Index in Cutten is 0.33.
What is the Total Population of Cutten?
Total Population of Cutten is 3,309.
What is the Total Male Population of Cutten?
Total Male Population of Cutten is 1,657.
What is the Total Female Population of Cutten?
Total Female Population of Cutten is 1,652.
What is the Ratio of Males per 100 Females in Cutten?
There are 100.30 Males per 100 Females in Cutten.
What is the Ratio of Females per 100 Males in Cutten?
There are 99.70 Females per 100 Males in Cutten.
What is the Median Population Age in Cutten?
Median Population Age in Cutten is 39.4 Years.
What is the Average Family Size in Cutten
Average Family Size in Cutten is 3.2 People.
What is the Average Household Size in Cutten
Average Household Size in Cutten is 2.6 People.
How Large is the Labor Force in Cutten?
There are 1,344 People in the Labor Forcein in Cutten.
What is the Percentage of People in the Labor Force in Cutten?
52.6% of People are in the Labor Force in Cutten.
What is the Unemployment Rate in Cutten?
Unemployment Rate in Cutten is 3.9%.