North Edwards, CA Map & Demographics
North Edwards Map
North Edwards Overview
$24,880
PER CAPITA INCOME
$42,981
AVG FAMILY INCOME
$44,231
AVG HOUSEHOLD INCOME
43.8%
WAGE / INCOME GAP [ % ]
56.2¢/ $1
WAGE / INCOME GAP [ $ ]
0.47
INEQUALITY / GINI INDEX
1,086
TOTAL POPULATION
670
MALE POPULATION
416
FEMALE POPULATION
161.06
MALES / 100 FEMALES
62.09
FEMALES / 100 MALES
28.4
MEDIAN AGE
3.2
AVG FAMILY SIZE
2.6
AVG HOUSEHOLD SIZE
496
LABOR FORCE [ PEOPLE ]
60.6%
PERCENT IN LABOR FORCE
12.1%
UNEMPLOYMENT RATE
Income in North Edwards
Income Overview in North Edwards
Per Capita Income in North Edwards is $24,880, while median incomes of families and households are $42,981 and $44,231 respectively.
| Characteristic | Number | Measure |
| Per Capita Income | 1,086 | $24,880 |
| Median Family Income | 279 | $42,981 |
| Mean Family Income | 279 | $66,770 |
| Median Household Income | 420 | $44,231 |
| Mean Household Income | 420 | $62,539 |
| Income Deficit | 279 | $0 |
| Wage / Income Gap (%) | 1,086 | 43.78% |
| Wage / Income Gap ($) | 1,086 | 56.22¢ per $1 |
| Gini / Inequality Index | 1,086 | 0.47 |
Earnings by Sex in North Edwards
Average Earnings in North Edwards are $25,417, $34,917 for men and $19,632 for women, a difference of 43.8%.
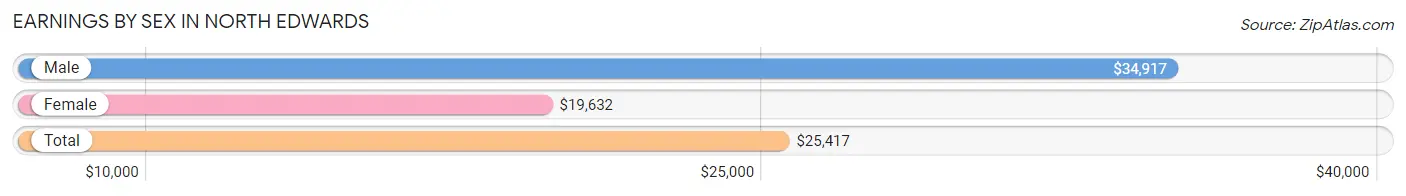
| Sex | Number | Average Earnings |
| Male | 242 (50.7%) | $34,917 |
| Female | 235 (49.3%) | $19,632 |
| Total | 477 (100.0%) | $25,417 |
Earnings by Sex by Income Bracket in North Edwards
The most common earnings brackets in North Edwards are $65,000 to $74,999 for men (53 | 21.9%) and $25,000 to $29,999 for women (51 | 21.7%).
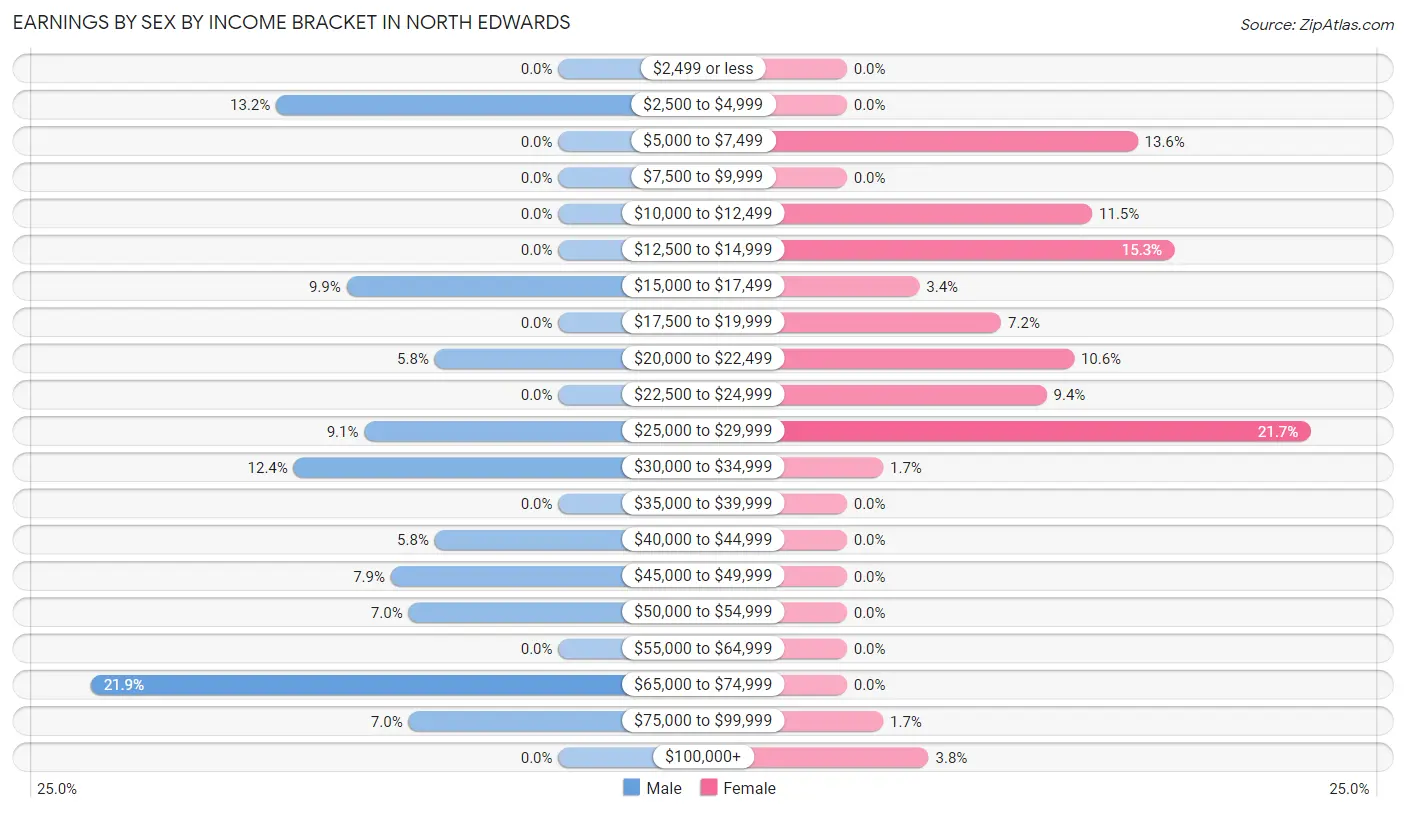
| Income | Male | Female |
| $2,499 or less | 0 (0.0%) | 0 (0.0%) |
| $2,500 to $4,999 | 32 (13.2%) | 0 (0.0%) |
| $5,000 to $7,499 | 0 (0.0%) | 32 (13.6%) |
| $7,500 to $9,999 | 0 (0.0%) | 0 (0.0%) |
| $10,000 to $12,499 | 0 (0.0%) | 27 (11.5%) |
| $12,500 to $14,999 | 0 (0.0%) | 36 (15.3%) |
| $15,000 to $17,499 | 24 (9.9%) | 8 (3.4%) |
| $17,500 to $19,999 | 0 (0.0%) | 17 (7.2%) |
| $20,000 to $22,499 | 14 (5.8%) | 25 (10.6%) |
| $22,500 to $24,999 | 0 (0.0%) | 22 (9.4%) |
| $25,000 to $29,999 | 22 (9.1%) | 51 (21.7%) |
| $30,000 to $34,999 | 30 (12.4%) | 4 (1.7%) |
| $35,000 to $39,999 | 0 (0.0%) | 0 (0.0%) |
| $40,000 to $44,999 | 14 (5.8%) | 0 (0.0%) |
| $45,000 to $49,999 | 19 (7.9%) | 0 (0.0%) |
| $50,000 to $54,999 | 17 (7.0%) | 0 (0.0%) |
| $55,000 to $64,999 | 0 (0.0%) | 0 (0.0%) |
| $65,000 to $74,999 | 53 (21.9%) | 0 (0.0%) |
| $75,000 to $99,999 | 17 (7.0%) | 4 (1.7%) |
| $100,000+ | 0 (0.0%) | 9 (3.8%) |
| Total | 242 (100.0%) | 235 (100.0%) |
Earnings by Sex by Educational Attainment in North Edwards
Average earnings in North Edwards are $47,961 for men and $18,603 for women, a difference of 61.2%. Men with an educational attainment of high school diploma enjoy the highest average annual earnings of $72,819, while those with college or associate's degree education earn the least with $33,583. Women with an educational attainment of college or associate's degree earn the most with the average annual earnings of $22,670, while those with college or associate's degree education have the smallest earnings of $22,670.
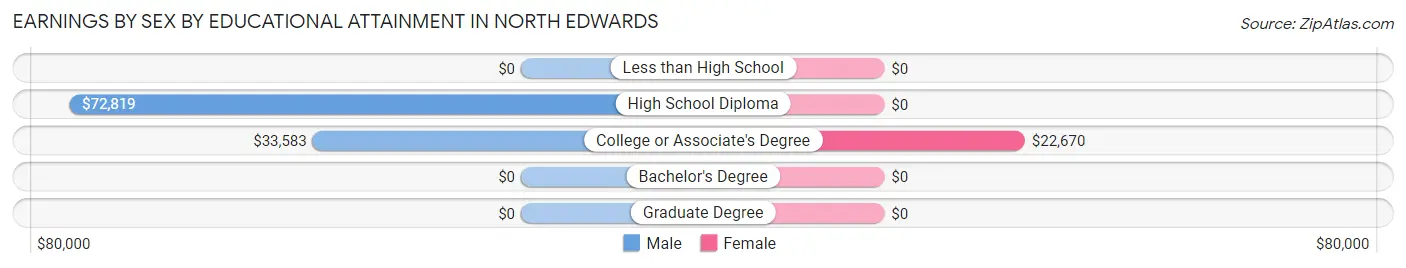
| Educational Attainment | Male Income | Female Income |
| Less than High School | - | - |
| High School Diploma | $72,819 | $0 |
| College or Associate's Degree | $33,583 | $22,670 |
| Bachelor's Degree | - | - |
| Graduate Degree | - | - |
| Total | $47,961 | $18,603 |
Family Income in North Edwards
Family Income Brackets in North Edwards
According to the North Edwards family income data, there are 85 families falling into the $50,000 to $74,999 income range, which is the most common income bracket and makes up 30.5% of all families.
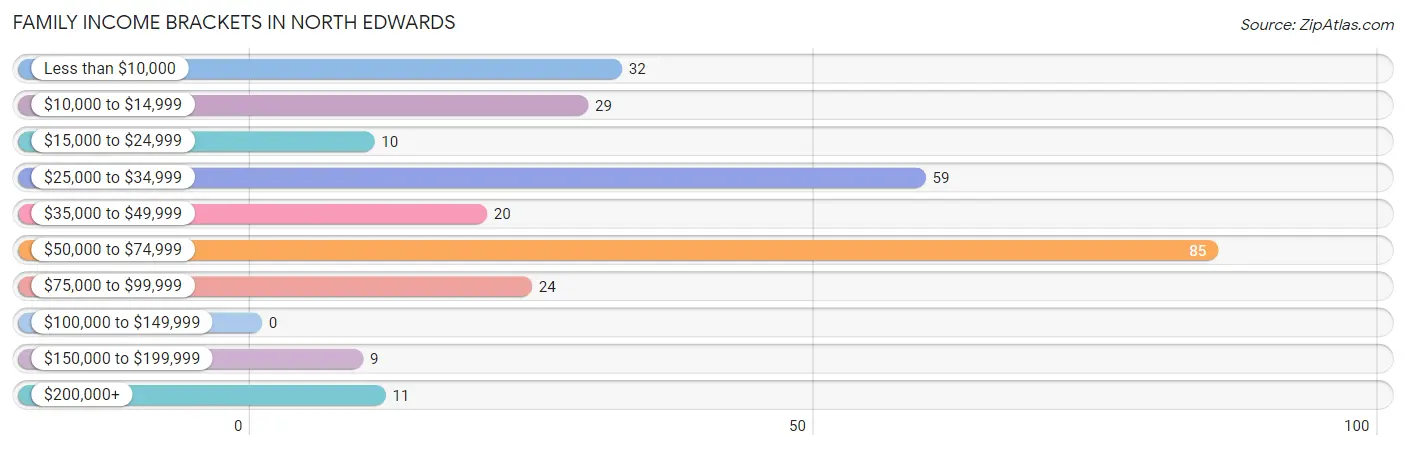
| Income Bracket | # Families | % Families |
| Less than $10,000 | 32 | 11.5% |
| $10,000 to $14,999 | 29 | 10.4% |
| $15,000 to $24,999 | 10 | 3.6% |
| $25,000 to $34,999 | 59 | 21.1% |
| $35,000 to $49,999 | 20 | 7.2% |
| $50,000 to $74,999 | 85 | 30.5% |
| $75,000 to $99,999 | 24 | 8.6% |
| $100,000 to $149,999 | 0 | 0.0% |
| $150,000 to $199,999 | 9 | 3.2% |
| $200,000+ | 11 | 3.9% |
Family Income by Famaliy Size in North Edwards
2-person families (139 | 49.8%) account for the highest median family income in North Edwards with $61,080 per family, while 2-person families (139 | 49.8%) have the highest median income of $30,540 per family member.
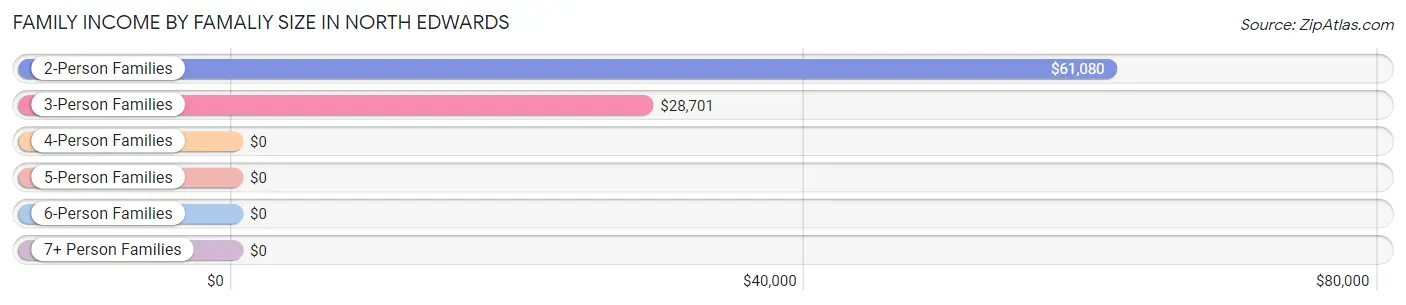
| Income Bracket | # Families | Median Income |
| 2-Person Families | 139 (49.8%) | $61,080 |
| 3-Person Families | 107 (38.4%) | $28,701 |
| 4-Person Families | 9 (3.2%) | $0 |
| 5-Person Families | 10 (3.6%) | $0 |
| 6-Person Families | 14 (5.0%) | $0 |
| 7+ Person Families | 0 (0.0%) | $0 |
| Total | 279 (100.0%) | $42,981 |
Family Income by Number of Earners in North Edwards
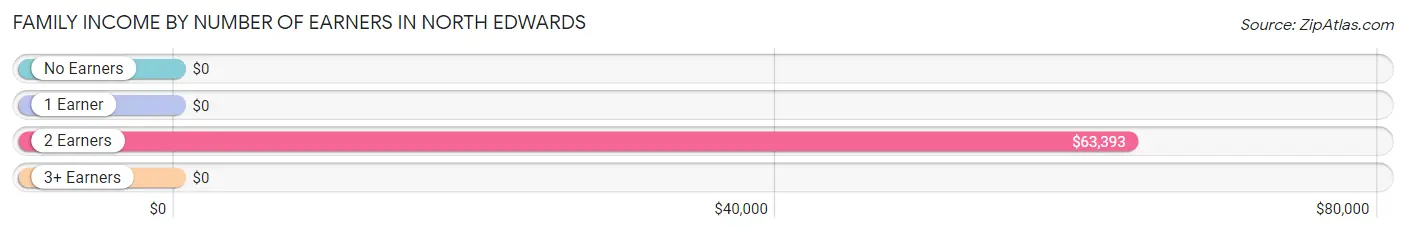
| Number of Earners | # Families | Median Income |
| No Earners | 59 (21.1%) | $0 |
| 1 Earner | 157 (56.3%) | $0 |
| 2 Earners | 54 (19.4%) | $63,393 |
| 3+ Earners | 9 (3.2%) | $0 |
| Total | 279 (100.0%) | $42,981 |
Household Income in North Edwards
Household Income Brackets in North Edwards
With 106 households falling in the category, the $50,000 to $74,999 income range is the most frequent in North Edwards, accounting for 25.2% of all households.
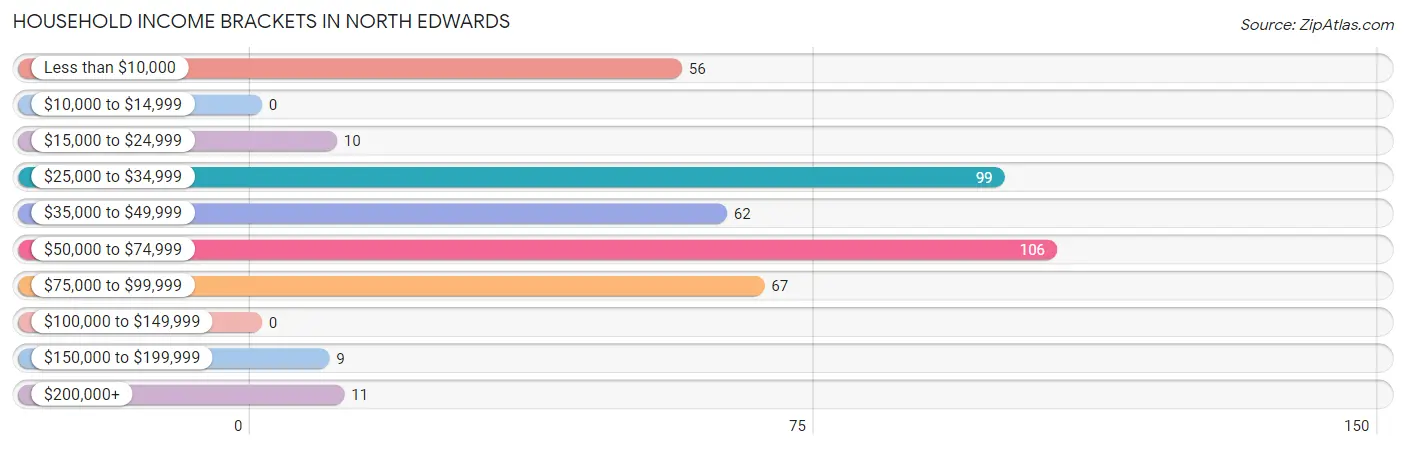
| Income Bracket | # Households | % Households |
| Less than $10,000 | 56 | 13.3% |
| $10,000 to $14,999 | 0 | 0.0% |
| $15,000 to $24,999 | 10 | 2.4% |
| $25,000 to $34,999 | 99 | 23.6% |
| $35,000 to $49,999 | 62 | 14.8% |
| $50,000 to $74,999 | 106 | 25.2% |
| $75,000 to $99,999 | 67 | 16.0% |
| $100,000 to $149,999 | 0 | 0.0% |
| $150,000 to $199,999 | 9 | 2.1% |
| $200,000+ | 11 | 2.6% |
Household Income by Householder Age in North Edwards
The median household income in North Edwards is $44,231, with the highest median household income of $90,000 found in the 65+ years age bracket for the primary householder. A total of 52 households (12.4%) fall into this category. Meanwhile, the 15 to 24 years age bracket for the primary householder has the lowest median household income of $0, with 37 households (8.8%) in this group.
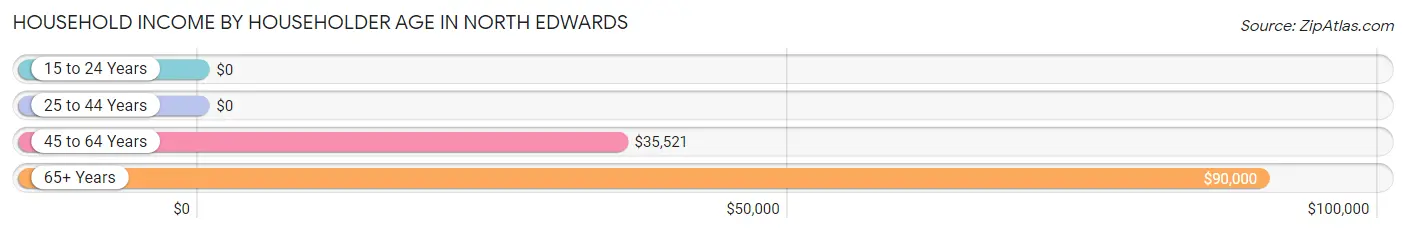
| Income Bracket | # Households | Median Income |
| 15 to 24 Years | 37 (8.8%) | $0 |
| 25 to 44 Years | 136 (32.4%) | $0 |
| 45 to 64 Years | 195 (46.4%) | $35,521 |
| 65+ Years | 52 (12.4%) | $90,000 |
| Total | 420 (100.0%) | $44,231 |
Poverty in North Edwards
Income Below Poverty by Sex and Age in North Edwards
With 26.7% poverty level for males and 18.8% for females among the residents of North Edwards, 12 to 14 year old males and 6 to 11 year old females are the most vulnerable to poverty, with 66 males (100.0%) and 24 females (66.7%) in their respective age groups living below the poverty level.
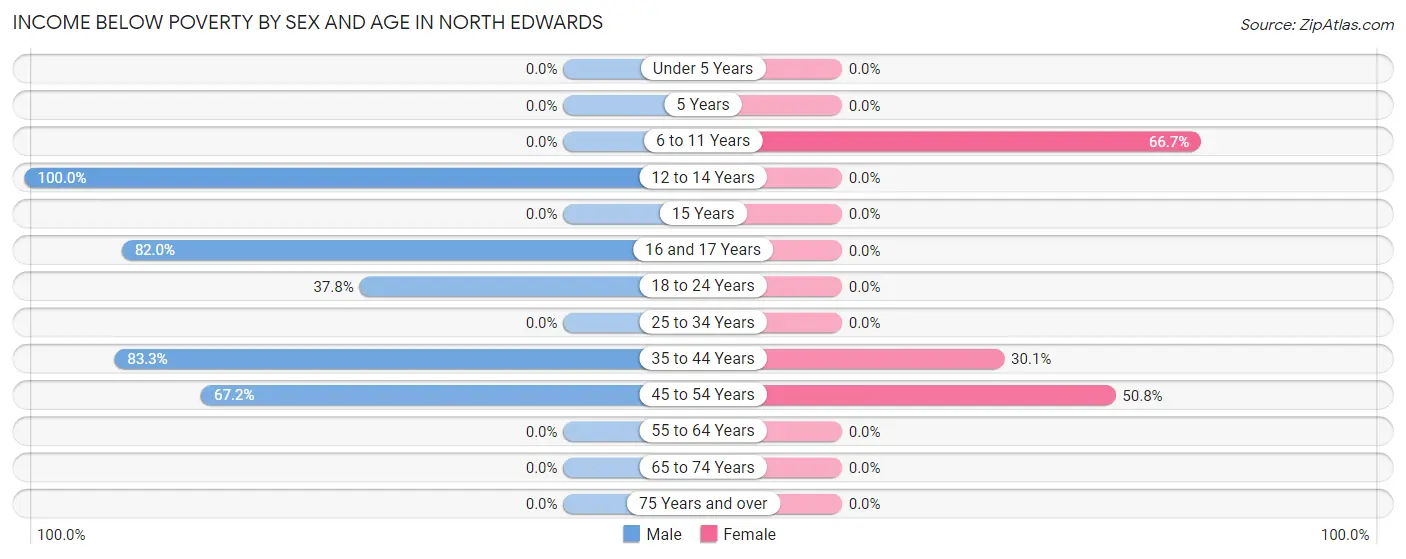
| Age Bracket | Male | Female |
| Under 5 Years | 0 (0.0%) | 0 (0.0%) |
| 5 Years | 0 (0.0%) | 0 (0.0%) |
| 6 to 11 Years | 0 (0.0%) | 24 (66.7%) |
| 12 to 14 Years | 66 (100.0%) | 0 (0.0%) |
| 15 Years | 0 (0.0%) | 0 (0.0%) |
| 16 and 17 Years | 50 (82.0%) | 0 (0.0%) |
| 18 to 24 Years | 14 (37.8%) | 0 (0.0%) |
| 25 to 34 Years | 0 (0.0%) | 0 (0.0%) |
| 35 to 44 Years | 10 (83.3%) | 22 (30.1%) |
| 45 to 54 Years | 39 (67.2%) | 32 (50.8%) |
| 55 to 64 Years | 0 (0.0%) | 0 (0.0%) |
| 65 to 74 Years | 0 (0.0%) | 0 (0.0%) |
| 75 Years and over | 0 (0.0%) | 0 (0.0%) |
| Total | 179 (26.7%) | 78 (18.8%) |
Income Above Poverty by Sex and Age in North Edwards
According to the poverty statistics in North Edwards, males aged 6 to 11 years and females aged 5 years are the age groups that are most secure financially, with 100.0% of males and 100.0% of females in these age groups living above the poverty line.
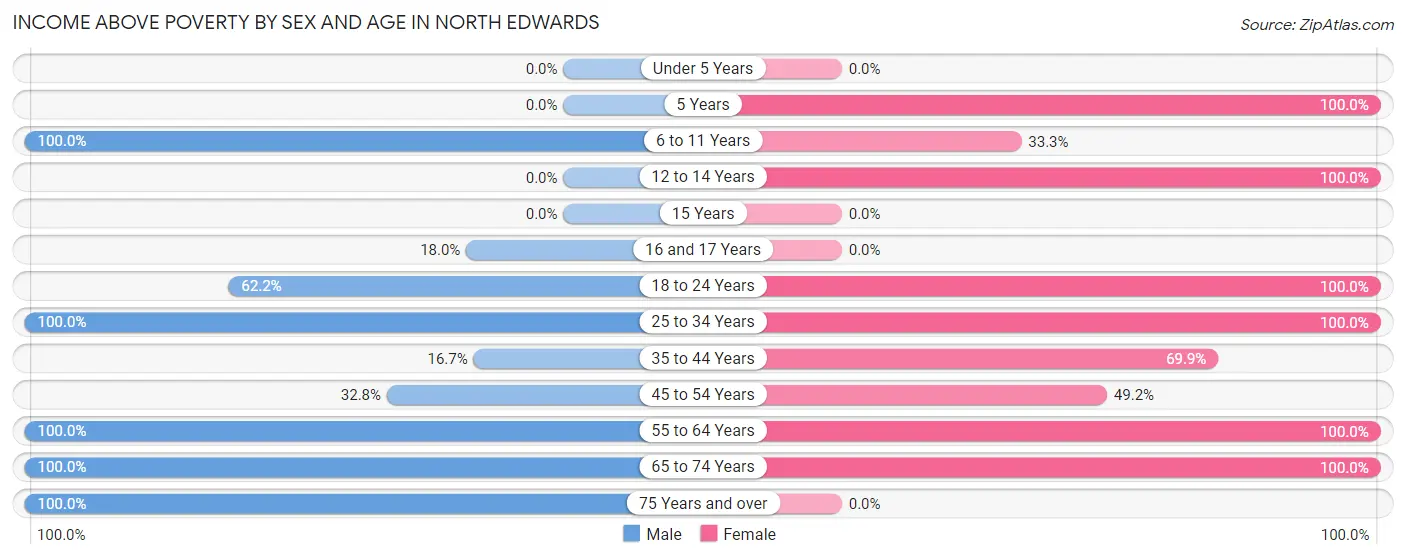
| Age Bracket | Male | Female |
| Under 5 Years | 0 (0.0%) | 0 (0.0%) |
| 5 Years | 0 (0.0%) | 14 (100.0%) |
| 6 to 11 Years | 140 (100.0%) | 12 (33.3%) |
| 12 to 14 Years | 0 (0.0%) | 11 (100.0%) |
| 15 Years | 0 (0.0%) | 0 (0.0%) |
| 16 and 17 Years | 11 (18.0%) | 0 (0.0%) |
| 18 to 24 Years | 23 (62.2%) | 14 (100.0%) |
| 25 to 34 Years | 200 (100.0%) | 78 (100.0%) |
| 35 to 44 Years | 2 (16.7%) | 51 (69.9%) |
| 45 to 54 Years | 19 (32.8%) | 31 (49.2%) |
| 55 to 64 Years | 53 (100.0%) | 102 (100.0%) |
| 65 to 74 Years | 24 (100.0%) | 25 (100.0%) |
| 75 Years and over | 19 (100.0%) | 0 (0.0%) |
| Total | 491 (73.3%) | 338 (81.2%) |
Income Below Poverty Among Married-Couple Families in North Edwards
The poverty statistics for married-couple families in North Edwards show that 13.5% or 10 of the total 74 families live below the poverty line. Families with 3 or 4 children have the highest poverty rate of 100.0%, comprising of 10 families. On the other hand, families with no children have the lowest poverty rate of 0.0%, which includes 0 families.
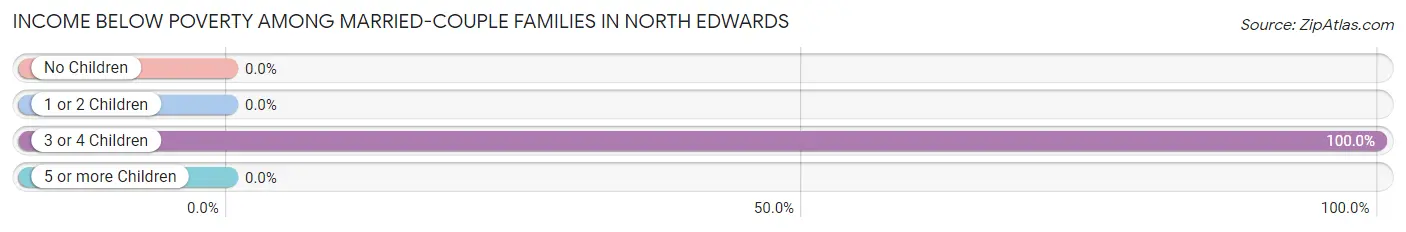
| Children | Above Poverty | Below Poverty |
| No Children | 32 (100.0%) | 0 (0.0%) |
| 1 or 2 Children | 32 (100.0%) | 0 (0.0%) |
| 3 or 4 Children | 0 (0.0%) | 10 (100.0%) |
| 5 or more Children | 0 (0.0%) | 0 (0.0%) |
| Total | 64 (86.5%) | 10 (13.5%) |
Income Below Poverty Among Single-Parent Households in North Edwards
According to the poverty data in North Edwards, 36.2% or 29 single-father households and 25.6% or 32 single-mother households are living below the poverty line. Among single-father households, those with 1 or 2 children have the highest poverty rate, with 29 households (100.0%) experiencing poverty. Likewise, among single-mother households, those with 1 or 2 children have the highest poverty rate, with 32 households (38.6%) falling below the poverty line.
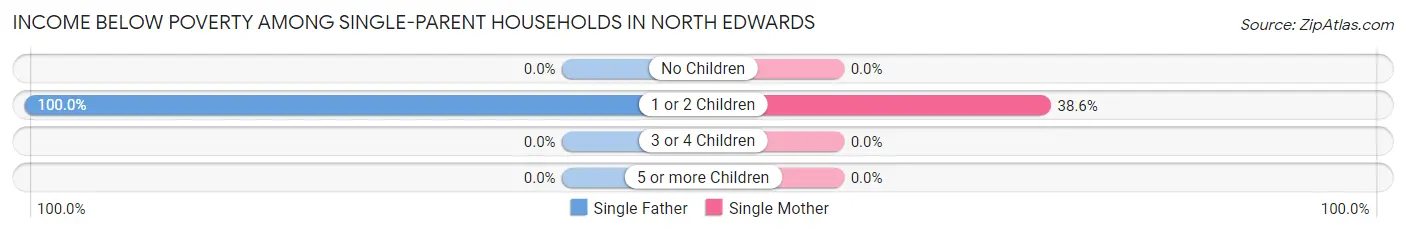
| Children | Single Father | Single Mother |
| No Children | 0 (0.0%) | 0 (0.0%) |
| 1 or 2 Children | 29 (100.0%) | 32 (38.6%) |
| 3 or 4 Children | 0 (0.0%) | 0 (0.0%) |
| 5 or more Children | 0 (0.0%) | 0 (0.0%) |
| Total | 29 (36.2%) | 32 (25.6%) |
Income Below Poverty Among Married-Couple vs Single-Parent Households in North Edwards
The poverty data for North Edwards shows that 10 of the married-couple family households (13.5%) and 61 of the single-parent households (29.8%) are living below the poverty level. Within the married-couple family households, those with 3 or 4 children have the highest poverty rate, with 10 households (100.0%) falling below the poverty line. Among the single-parent households, those with 1 or 2 children have the highest poverty rate, with 61 household (54.5%) living below poverty.
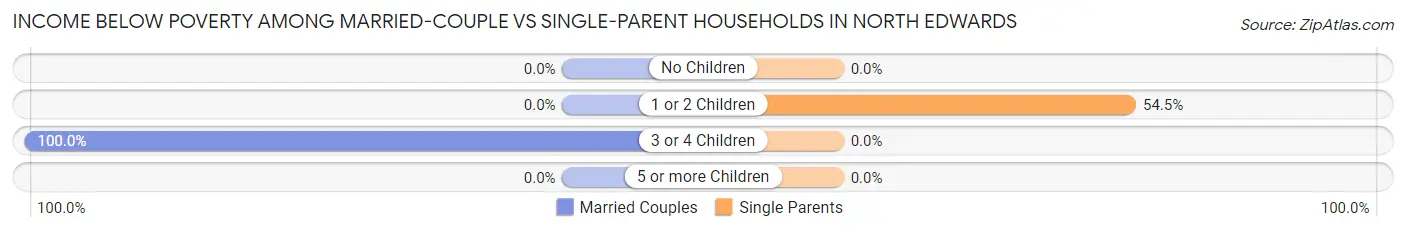
| Children | Married-Couple Families | Single-Parent Households |
| No Children | 0 (0.0%) | 0 (0.0%) |
| 1 or 2 Children | 0 (0.0%) | 61 (54.5%) |
| 3 or 4 Children | 10 (100.0%) | 0 (0.0%) |
| 5 or more Children | 0 (0.0%) | 0 (0.0%) |
| Total | 10 (13.5%) | 61 (29.8%) |
Race in North Edwards
The most populous races in North Edwards are White / Caucasian (519 | 47.8%), Two or more Races (355 | 32.7%), and Hispanic or Latino (213 | 19.6%).
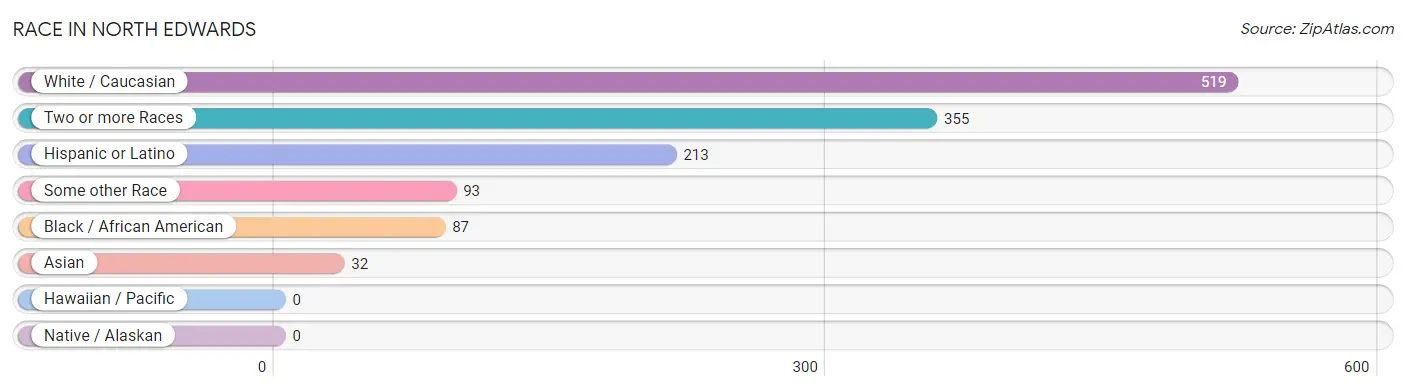
| Race | # Population | % Population |
| Asian | 32 | 2.9% |
| Black / African American | 87 | 8.0% |
| Hawaiian / Pacific | 0 | 0.0% |
| Hispanic or Latino | 213 | 19.6% |
| Native / Alaskan | 0 | 0.0% |
| White / Caucasian | 519 | 47.8% |
| Two or more Races | 355 | 32.7% |
| Some other Race | 93 | 8.6% |
| Total | 1,086 | 100.0% |
Ancestry in North Edwards
The most populous ancestries reported in North Edwards are German (206 | 19.0%), Irish (204 | 18.8%), Puerto Rican (151 | 13.9%), European (137 | 12.6%), and Cherokee (73 | 6.7%), together accounting for 71.0% of all North Edwards residents.
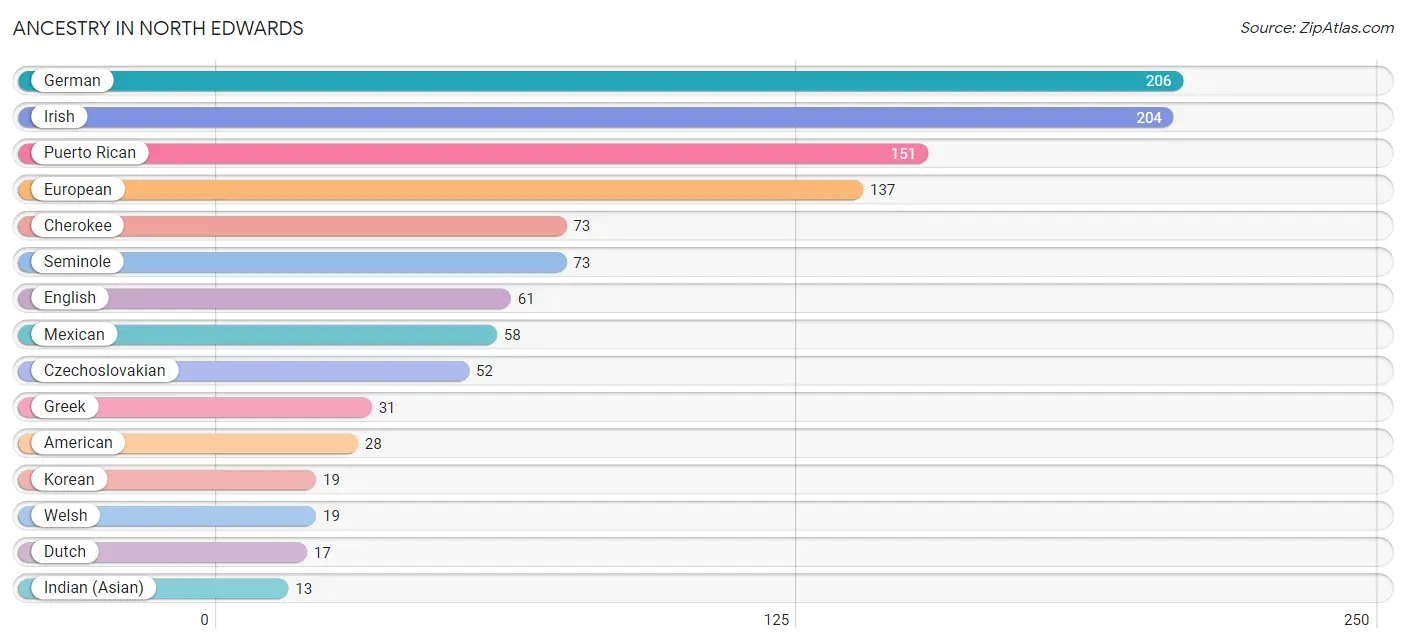
| Ancestry | # Population | % Population |
| American | 28 | 2.6% |
| Celtic | 6 | 0.5% |
| Central American | 4 | 0.4% |
| Cherokee | 73 | 6.7% |
| Czechoslovakian | 52 | 4.8% |
| Dutch | 17 | 1.6% |
| English | 61 | 5.6% |
| European | 137 | 12.6% |
| Finnish | 6 | 0.5% |
| French | 10 | 0.9% |
| German | 206 | 19.0% |
| Greek | 31 | 2.9% |
| Guatemalan | 4 | 0.4% |
| Indian (Asian) | 13 | 1.2% |
| Irish | 204 | 18.8% |
| Italian | 4 | 0.4% |
| Korean | 19 | 1.8% |
| Mexican | 58 | 5.3% |
| Puerto Rican | 151 | 13.9% |
| Seminole | 73 | 6.7% |
| Welsh | 19 | 1.8% | View All 21 Rows |
Immigrants in North Edwards
The most numerous immigrant groups reported in North Edwards came from Asia (19 | 1.8%), Philippines (19 | 1.8%), South Eastern Asia (19 | 1.8%), Central America (15 | 1.4%), and Latin America (15 | 1.4%), together accounting for 8.0% of all North Edwards residents.
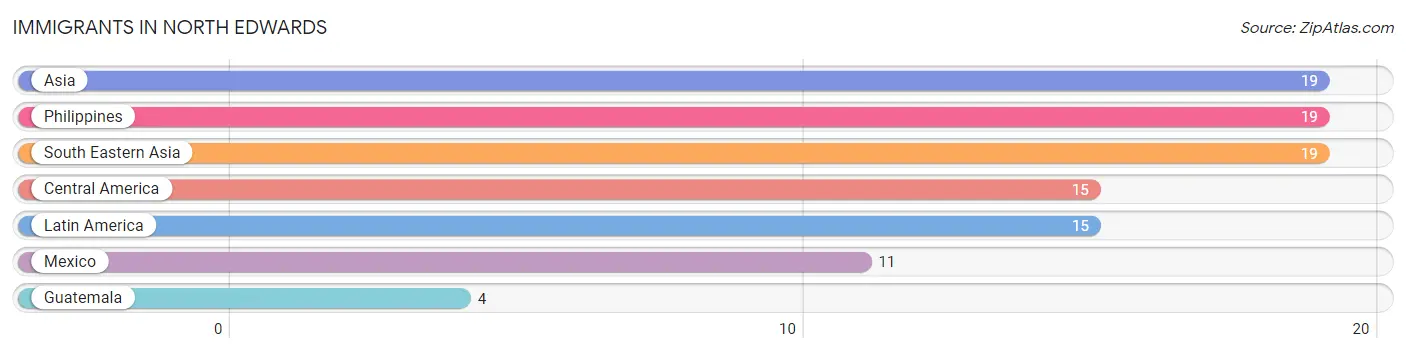
| Immigration Origin | # Population | % Population |
| Asia | 19 | 1.8% |
| Central America | 15 | 1.4% |
| Guatemala | 4 | 0.4% |
| Latin America | 15 | 1.4% |
| Mexico | 11 | 1.0% |
| Philippines | 19 | 1.8% |
| South Eastern Asia | 19 | 1.8% | View All 7 Rows |
Sex and Age in North Edwards
Sex and Age in North Edwards
The most populous age groups in North Edwards are 25 to 29 Years (149 | 22.2%) for men and 60 to 64 Years (83 | 20.0%) for women.
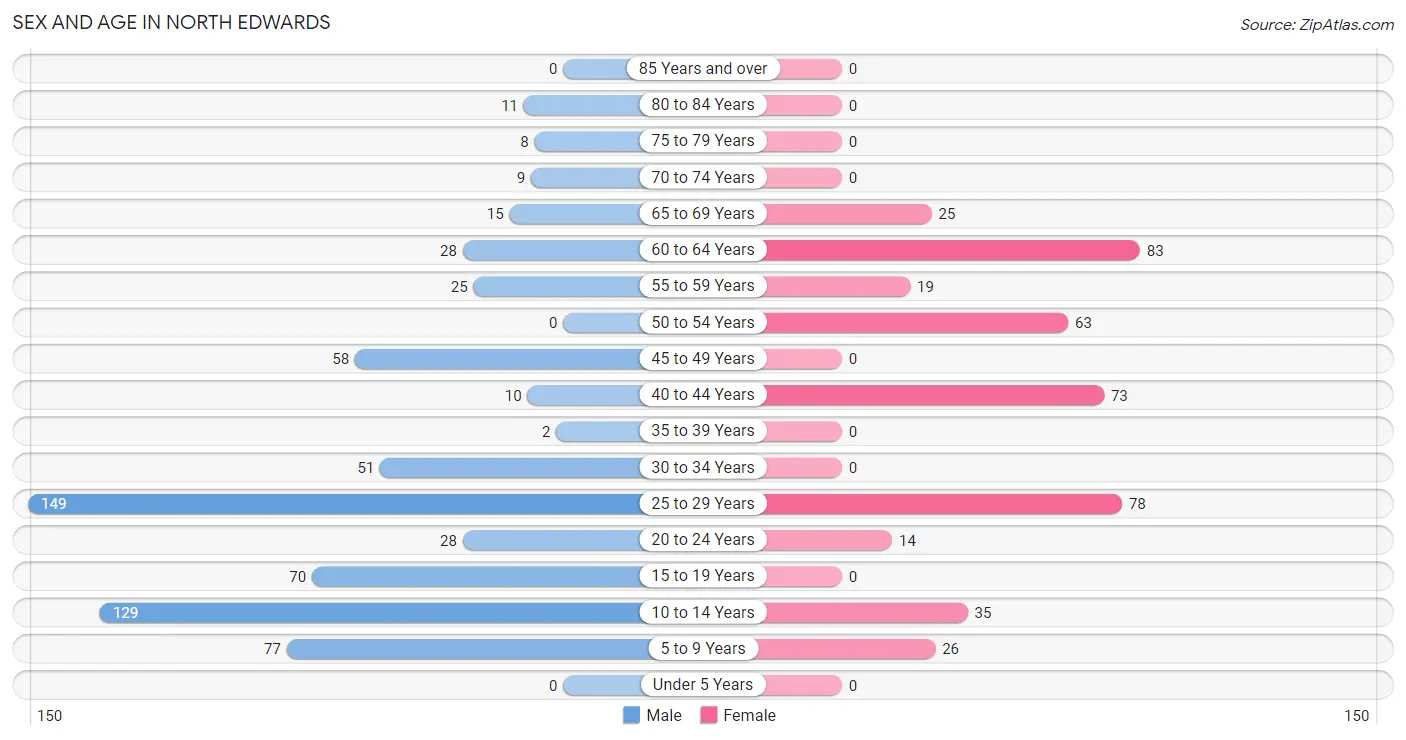
| Age Bracket | Male | Female |
| Under 5 Years | 0 (0.0%) | 0 (0.0%) |
| 5 to 9 Years | 77 (11.5%) | 26 (6.2%) |
| 10 to 14 Years | 129 (19.3%) | 35 (8.4%) |
| 15 to 19 Years | 70 (10.4%) | 0 (0.0%) |
| 20 to 24 Years | 28 (4.2%) | 14 (3.4%) |
| 25 to 29 Years | 149 (22.2%) | 78 (18.8%) |
| 30 to 34 Years | 51 (7.6%) | 0 (0.0%) |
| 35 to 39 Years | 2 (0.3%) | 0 (0.0%) |
| 40 to 44 Years | 10 (1.5%) | 73 (17.5%) |
| 45 to 49 Years | 58 (8.7%) | 0 (0.0%) |
| 50 to 54 Years | 0 (0.0%) | 63 (15.1%) |
| 55 to 59 Years | 25 (3.7%) | 19 (4.6%) |
| 60 to 64 Years | 28 (4.2%) | 83 (20.0%) |
| 65 to 69 Years | 15 (2.2%) | 25 (6.0%) |
| 70 to 74 Years | 9 (1.3%) | 0 (0.0%) |
| 75 to 79 Years | 8 (1.2%) | 0 (0.0%) |
| 80 to 84 Years | 11 (1.6%) | 0 (0.0%) |
| 85 Years and over | 0 (0.0%) | 0 (0.0%) |
| Total | 670 (100.0%) | 416 (100.0%) |
Families and Households in North Edwards
Median Family Size in North Edwards
The median family size in North Edwards is 3.17 persons per family, with married-couple families (74 | 26.5%) accounting for the largest median family size of 4.57 persons per family. On the other hand, single male/father families (80 | 28.7%) represent the smallest median family size with 2.65 persons per family.
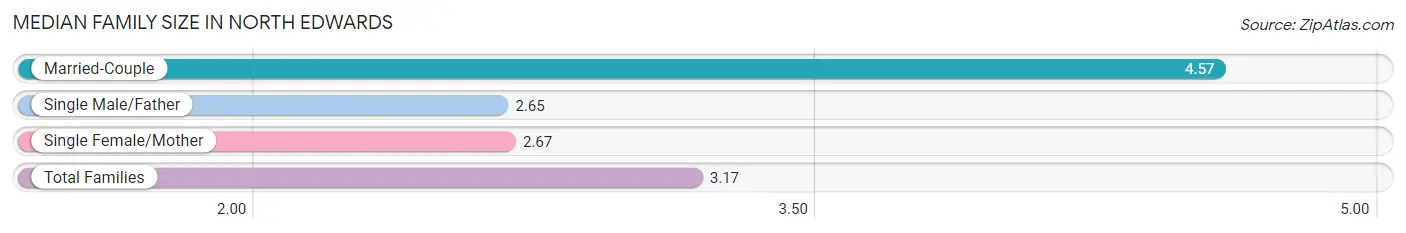
| Family Type | # Families | Family Size |
| Married-Couple | 74 (26.5%) | 4.57 |
| Single Male/Father | 80 (28.7%) | 2.65 |
| Single Female/Mother | 125 (44.8%) | 2.67 |
| Total Families | 279 (100.0%) | 3.17 |
Median Household Size in North Edwards
The median household size in North Edwards is 2.59 persons per household, with married-couple households (74 | 17.6%) accounting for the largest median household size of 4.72 persons per household. non-family households (141 | 33.6%) represent the smallest median household size with 1.19 persons per household.
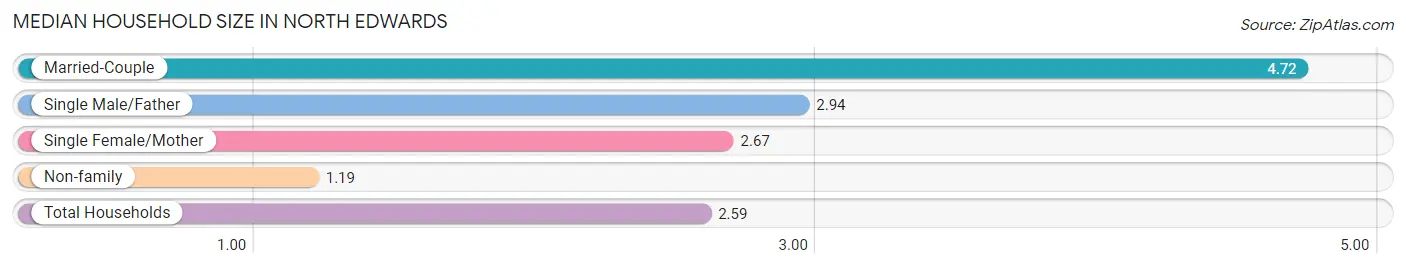
| Household Type | # Households | Household Size |
| Married-Couple | 74 (17.6%) | 4.72 |
| Single Male/Father | 80 (19.1%) | 2.94 |
| Single Female/Mother | 125 (29.8%) | 2.67 |
| Non-family | 141 (33.6%) | 1.19 |
| Total Households | 420 (100.0%) | 2.59 |
Household Size by Marriage Status in North Edwards
Out of a total of 420 households in North Edwards, 279 (66.4%) are family households, while 141 (33.6%) are nonfamily households. The most numerous type of family households are 2-person households, comprising 139, and the most common type of nonfamily households are 1-person households, comprising 114.
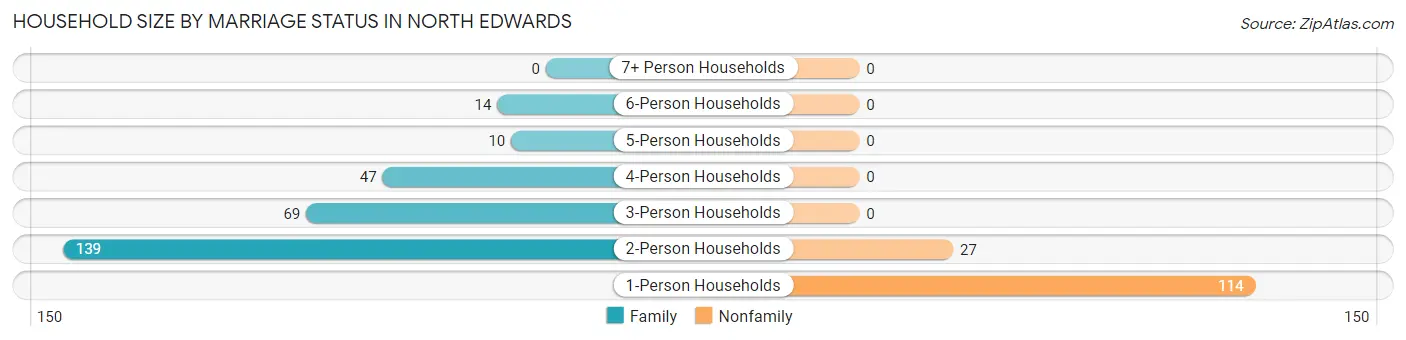
| Household Size | Family Households | Nonfamily Households |
| 1-Person Households | - | 114 (27.1%) |
| 2-Person Households | 139 (33.1%) | 27 (6.4%) |
| 3-Person Households | 69 (16.4%) | 0 (0.0%) |
| 4-Person Households | 47 (11.2%) | 0 (0.0%) |
| 5-Person Households | 10 (2.4%) | 0 (0.0%) |
| 6-Person Households | 14 (3.3%) | 0 (0.0%) |
| 7+ Person Households | 0 (0.0%) | 0 (0.0%) |
| Total | 279 (66.4%) | 141 (33.6%) |
Female Fertility in North Edwards
Fertility by Age in North Edwards
Average fertility rate in North Edwards is 97.0 births per 1,000 women. Women in the age bracket of 20 to 34 years have the highest fertility rate with 174.0 births per 1,000 women. Women in the age bracket of 20 to 34 years acount for 100.0% of all women with births.
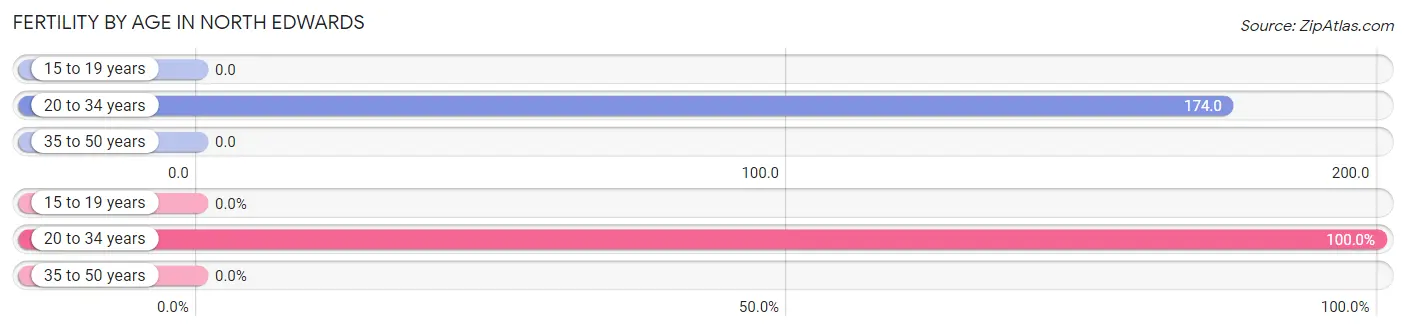
| Age Bracket | Women with Births | Births / 1,000 Women |
| 15 to 19 years | 0 (0.0%) | 0.0 |
| 20 to 34 years | 16 (100.0%) | 174.0 |
| 35 to 50 years | 0 (0.0%) | 0.0 |
| Total | 16 (100.0%) | 97.0 |
Fertility by Age by Marriage Status in North Edwards
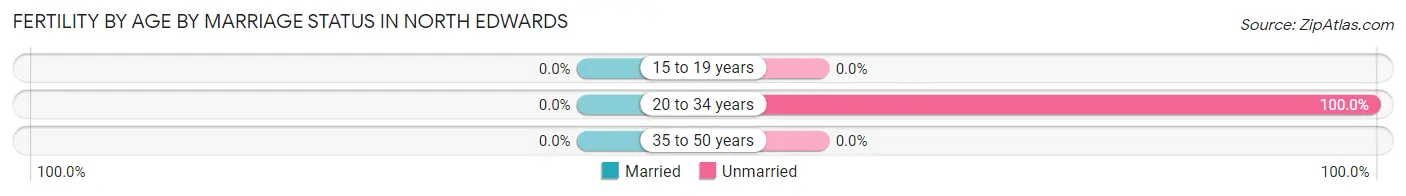
| Age Bracket | Married | Unmarried |
| 15 to 19 years | 0 (0.0%) | 0 (0.0%) |
| 20 to 34 years | 0 (0.0%) | 16 (100.0%) |
| 35 to 50 years | 0 (0.0%) | 0 (0.0%) |
| Total | 0 (0.0%) | 16 (100.0%) |
Fertility by Education in North Edwards
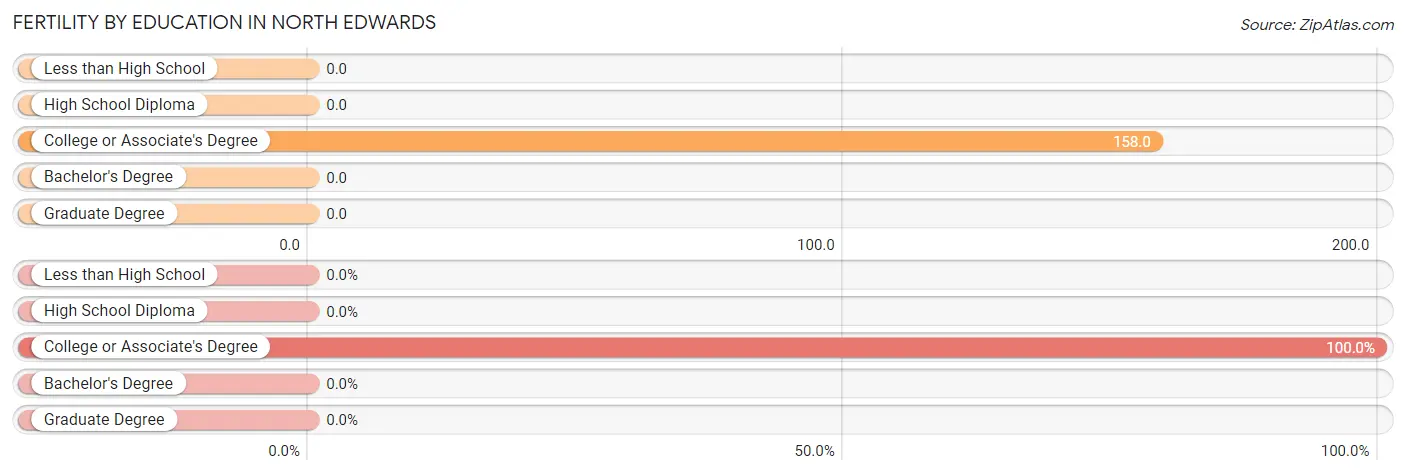
| Educational Attainment | Women with Births | Births / 1,000 Women |
| Less than High School | 0 (0.0%) | 0.0 |
| High School Diploma | 0 (0.0%) | 0.0 |
| College or Associate's Degree | 16 (100.0%) | 158.0 |
| Bachelor's Degree | 0 (0.0%) | 0.0 |
| Graduate Degree | 0 (0.0%) | 0.0 |
| Total | 16 (100.0%) | 97.0 |
Fertility by Education by Marriage Status in North Edwards
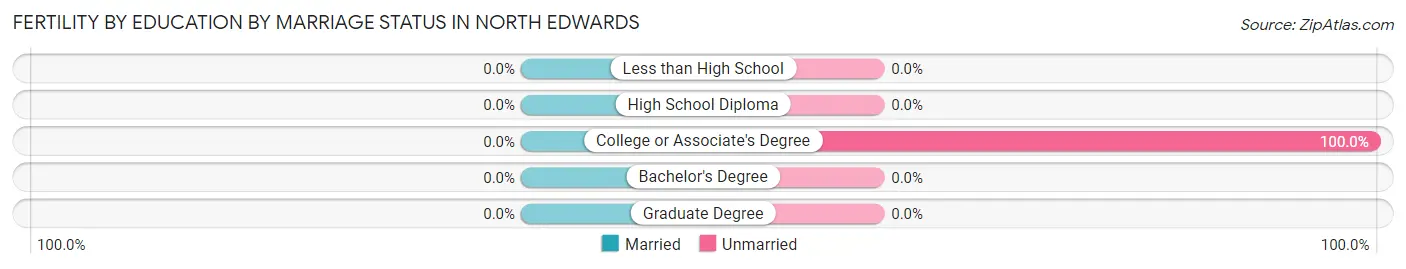
| Educational Attainment | Married | Unmarried |
| Less than High School | 0 (0.0%) | 0 (0.0%) |
| High School Diploma | 0 (0.0%) | 0 (0.0%) |
| College or Associate's Degree | 0 (0.0%) | 16 (100.0%) |
| Bachelor's Degree | 0 (0.0%) | 0 (0.0%) |
| Graduate Degree | 0 (0.0%) | 0 (0.0%) |
| Total | 0 (0.0%) | 16 (100.0%) |
Employment Characteristics in North Edwards
Employment by Class of Employer in North Edwards
Among the 418 employed individuals in North Edwards, private company employees (218 | 52.1%), self-employed (not incorporated) (55 | 13.2%), and not-for-profit organizations (51 | 12.2%) make up the most common classes of employment.
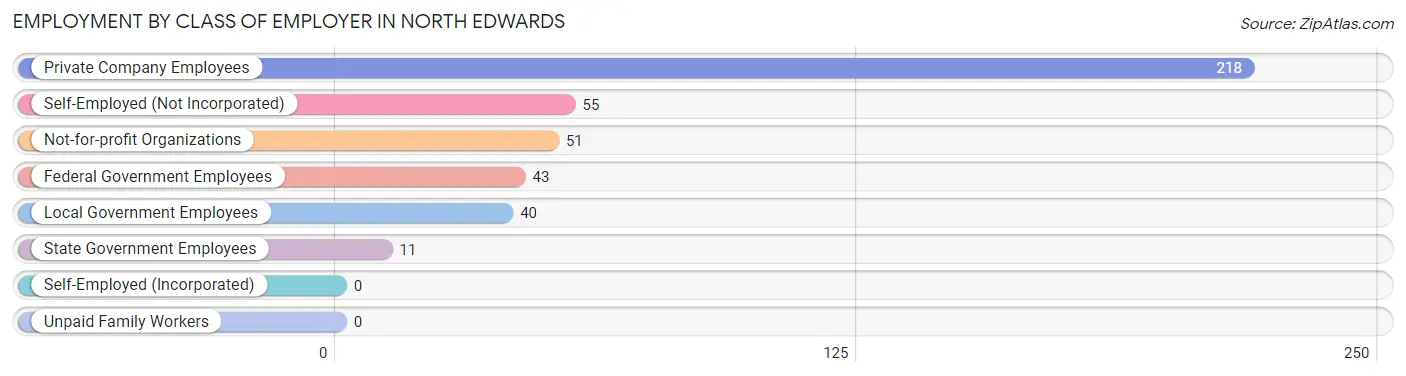
| Employer Class | # Employees | % Employees |
| Private Company Employees | 218 | 52.1% |
| Self-Employed (Incorporated) | 0 | 0.0% |
| Self-Employed (Not Incorporated) | 55 | 13.2% |
| Not-for-profit Organizations | 51 | 12.2% |
| Local Government Employees | 40 | 9.6% |
| State Government Employees | 11 | 2.6% |
| Federal Government Employees | 43 | 10.3% |
| Unpaid Family Workers | 0 | 0.0% |
| Total | 418 | 100.0% |
Employment Status by Age in North Edwards
According to the labor force statistics for North Edwards, out of the total population over 16 years of age (819), 60.6% or 496 individuals are in the labor force, with 12.1% or 60 of them unemployed. The age group with the highest labor force participation rate is 20 to 24 years, with 100.0% or 42 individuals in the labor force. Within the labor force, the 45 to 54 years age range has the highest percentage of unemployed individuals, with 26.1% or 29 of them being unemployed.
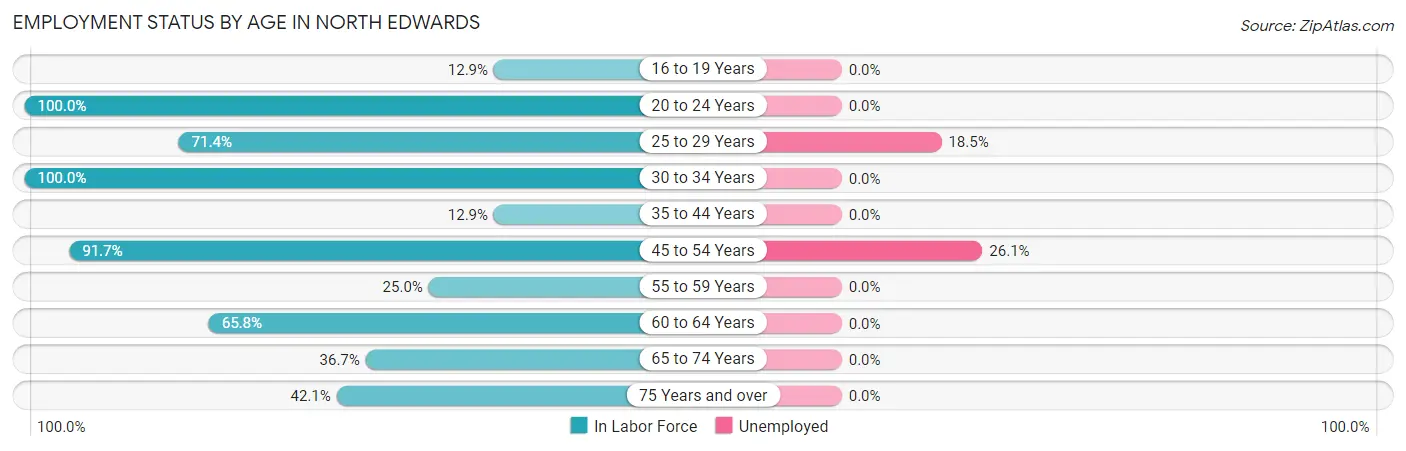
| Age Bracket | In Labor Force | Unemployed |
| 16 to 19 Years | 9 (12.9%) | 0 (0.0%) |
| 20 to 24 Years | 42 (100.0%) | 0 (0.0%) |
| 25 to 29 Years | 162 (71.4%) | 30 (18.5%) |
| 30 to 34 Years | 51 (100.0%) | 0 (0.0%) |
| 35 to 44 Years | 11 (12.9%) | 0 (0.0%) |
| 45 to 54 Years | 111 (91.7%) | 29 (26.1%) |
| 55 to 59 Years | 11 (25.0%) | 0 (0.0%) |
| 60 to 64 Years | 73 (65.8%) | 0 (0.0%) |
| 65 to 74 Years | 18 (36.7%) | 0 (0.0%) |
| 75 Years and over | 8 (42.1%) | 0 (0.0%) |
| Total | 496 (60.6%) | 60 (12.1%) |
Employment Status by Educational Attainment in North Edwards
According to labor force statistics for North Edwards, 65.6% of individuals (419) out of the total population between 25 and 64 years of age (639) are in the labor force, with 14.1% or 59 of them being unemployed. The group with the highest labor force participation rate are those with the educational attainment of college / associate degree, with 94.2% or 294 individuals in the labor force. Within the labor force, individuals with college / associate degree education have the highest percentage of unemployment, with 20.1% or 59 of them being unemployed.
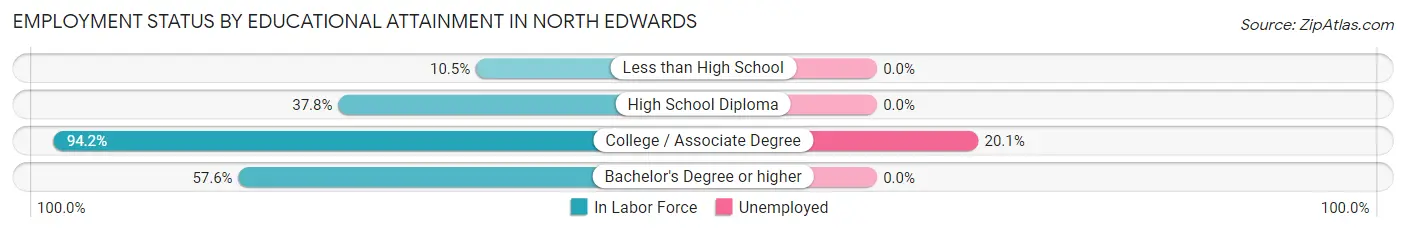
| Educational Attainment | In Labor Force | Unemployed |
| Less than High School | 4 (10.5%) | 0 (0.0%) |
| High School Diploma | 87 (37.8%) | 0 (0.0%) |
| College / Associate Degree | 294 (94.2%) | 63 (20.1%) |
| Bachelor's Degree or higher | 34 (57.6%) | 0 (0.0%) |
| Total | 419 (65.6%) | 90 (14.1%) |
Employment Occupations by Sex in North Edwards
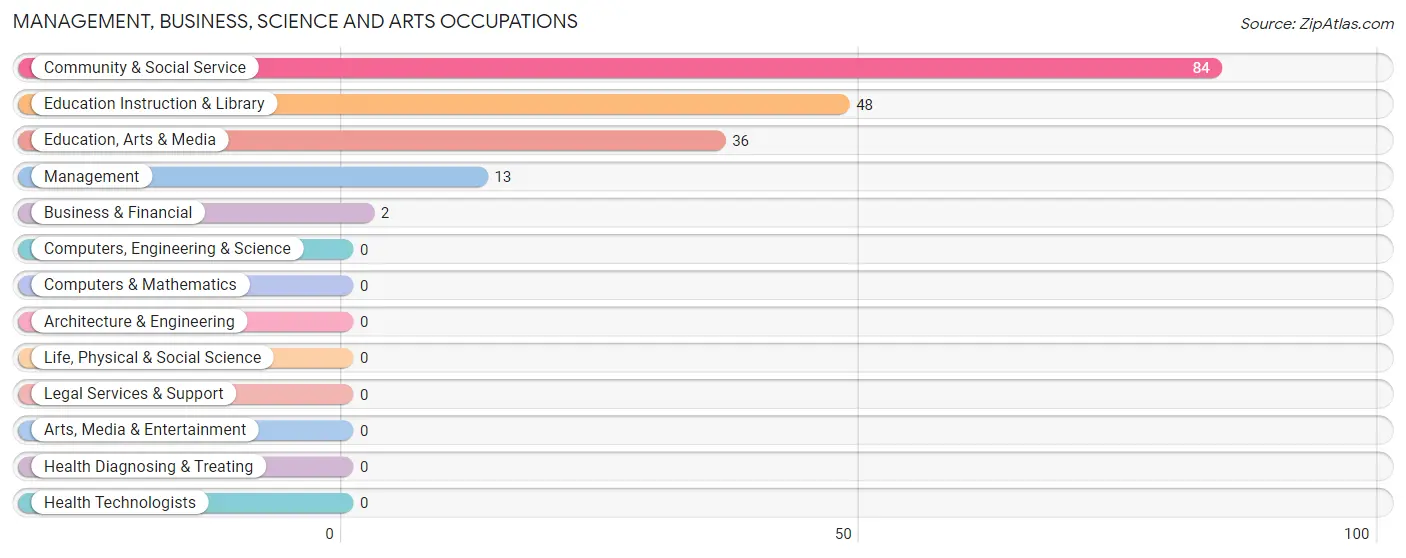
Management, Business, Science and Arts Occupations
The most common Management, Business, Science and Arts occupations in North Edwards are Community & Social Service (84 | 19.6%), Education Instruction & Library (48 | 11.2%), Education, Arts & Media (36 | 8.4%), Management (13 | 3.0%), and Business & Financial (2 | 0.5%).
Management, Business, Science and Arts Occupations by Sex
Within the Management, Business, Science and Arts occupations in North Edwards, the most male-oriented occupations are Management (100.0%), and Business & Financial (100.0%), while the most female-oriented occupations are Community & Social Service (100.0%), Education, Arts & Media (100.0%), and Education Instruction & Library (100.0%).
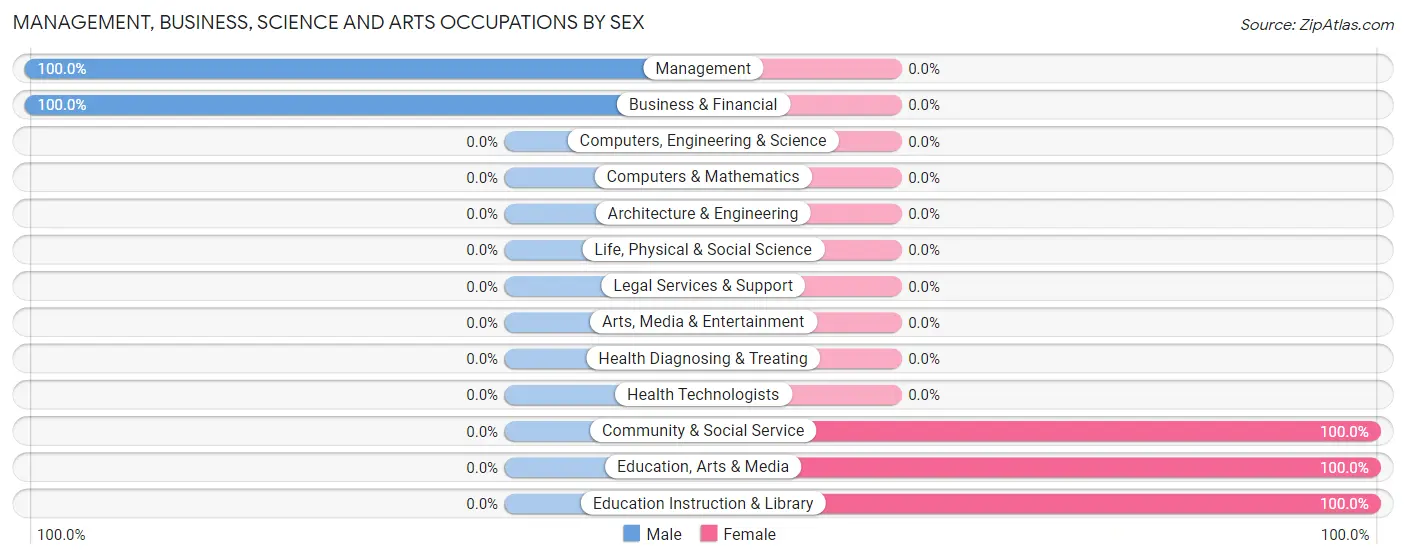
| Occupation | Male | Female |
| Management | 13 (100.0%) | 0 (0.0%) |
| Business & Financial | 2 (100.0%) | 0 (0.0%) |
| Computers, Engineering & Science | 0 (0.0%) | 0 (0.0%) |
| Computers & Mathematics | 0 (0.0%) | 0 (0.0%) |
| Architecture & Engineering | 0 (0.0%) | 0 (0.0%) |
| Life, Physical & Social Science | 0 (0.0%) | 0 (0.0%) |
| Community & Social Service | 0 (0.0%) | 84 (100.0%) |
| Education, Arts & Media | 0 (0.0%) | 36 (100.0%) |
| Legal Services & Support | 0 (0.0%) | 0 (0.0%) |
| Education Instruction & Library | 0 (0.0%) | 48 (100.0%) |
| Arts, Media & Entertainment | 0 (0.0%) | 0 (0.0%) |
| Health Diagnosing & Treating | 0 (0.0%) | 0 (0.0%) |
| Health Technologists | 0 (0.0%) | 0 (0.0%) |
| Total (Category) | 15 (15.1%) | 84 (84.9%) |
| Total (Overall) | 193 (45.1%) | 235 (54.9%) |
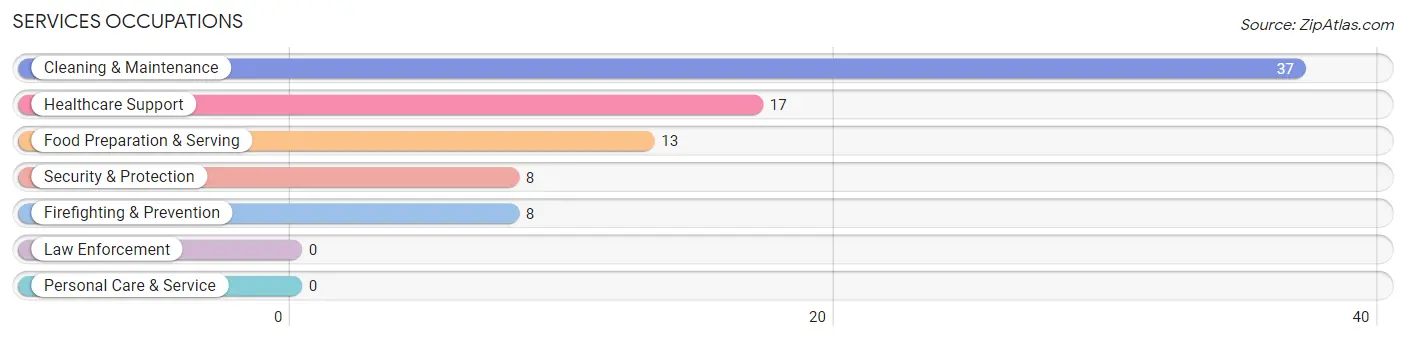
Services Occupations
The most common Services occupations in North Edwards are Cleaning & Maintenance (37 | 8.6%), Healthcare Support (17 | 4.0%), Food Preparation & Serving (13 | 3.0%), Security & Protection (8 | 1.9%), and Firefighting & Prevention (8 | 1.9%).
Services Occupations by Sex
Within the Services occupations in North Edwards, the most male-oriented occupations are Security & Protection (100.0%), Firefighting & Prevention (100.0%), and Food Preparation & Serving (100.0%), while the most female-oriented occupations are Healthcare Support (100.0%), and Cleaning & Maintenance (100.0%).
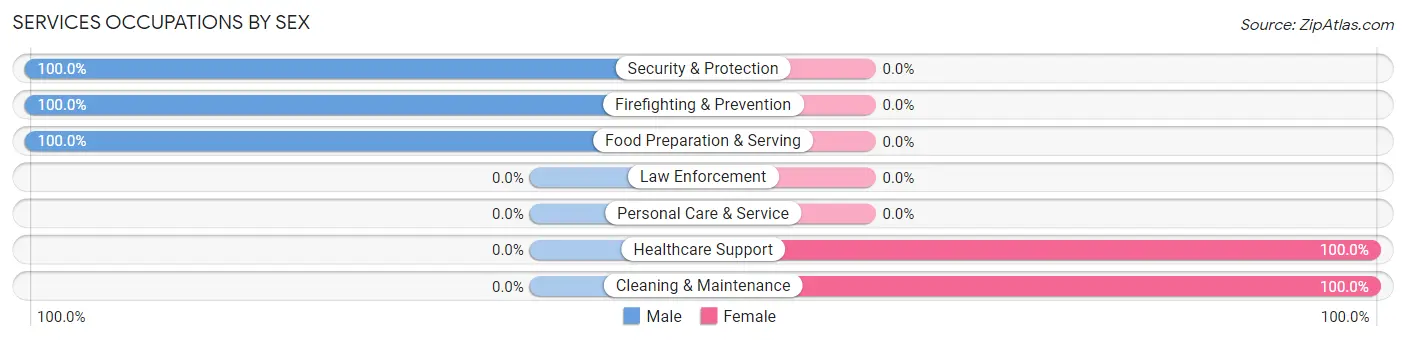
| Occupation | Male | Female |
| Healthcare Support | 0 (0.0%) | 17 (100.0%) |
| Security & Protection | 8 (100.0%) | 0 (0.0%) |
| Firefighting & Prevention | 8 (100.0%) | 0 (0.0%) |
| Law Enforcement | 0 (0.0%) | 0 (0.0%) |
| Food Preparation & Serving | 13 (100.0%) | 0 (0.0%) |
| Cleaning & Maintenance | 0 (0.0%) | 37 (100.0%) |
| Personal Care & Service | 0 (0.0%) | 0 (0.0%) |
| Total (Category) | 21 (28.0%) | 54 (72.0%) |
| Total (Overall) | 193 (45.1%) | 235 (54.9%) |
Sales and Office Occupations
The most common Sales and Office occupations in North Edwards are Sales & Related (54 | 12.6%), and Office & Administration (37 | 8.6%).
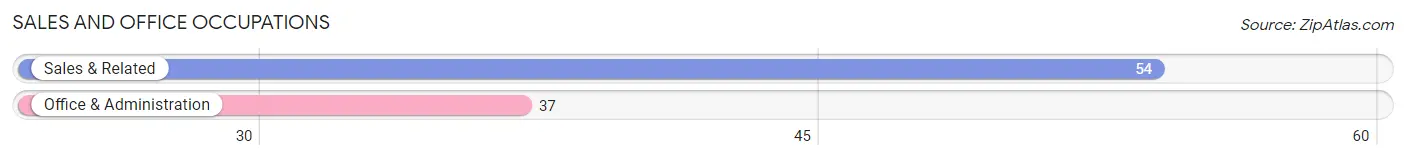
Sales and Office Occupations by Sex
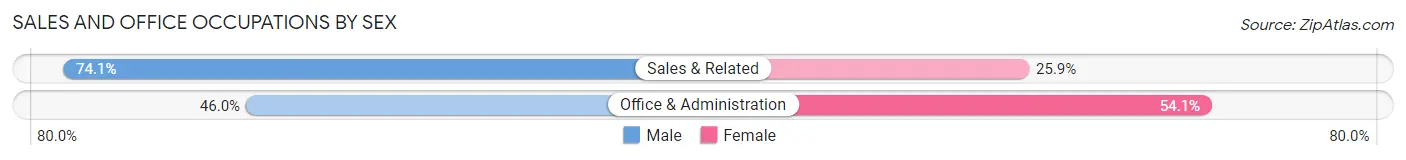
| Occupation | Male | Female |
| Sales & Related | 40 (74.1%) | 14 (25.9%) |
| Office & Administration | 17 (46.0%) | 20 (54.0%) |
| Total (Category) | 57 (62.6%) | 34 (37.4%) |
| Total (Overall) | 193 (45.1%) | 235 (54.9%) |
Natural Resources, Construction and Maintenance Occupations
The most common Natural Resources, Construction and Maintenance occupations in North Edwards are , and Construction & Extraction (65 | 15.2%).
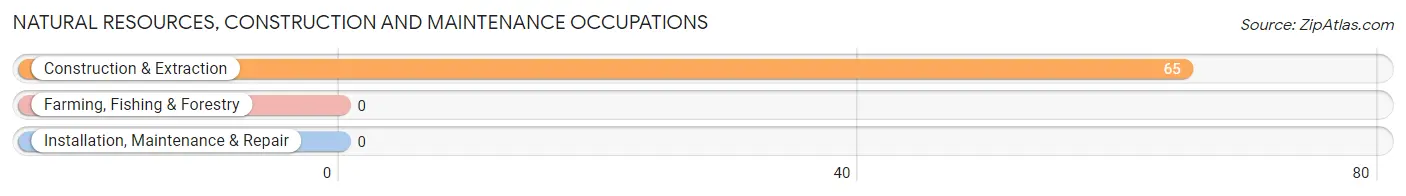
Natural Resources, Construction and Maintenance Occupations by Sex
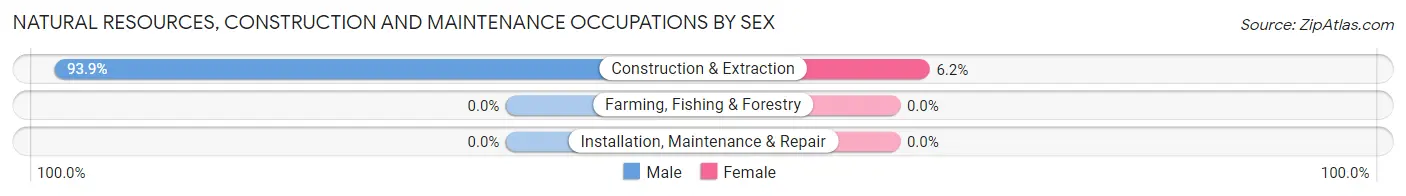
| Occupation | Male | Female |
| Farming, Fishing & Forestry | 0 (0.0%) | 0 (0.0%) |
| Construction & Extraction | 61 (93.9%) | 4 (6.1%) |
| Installation, Maintenance & Repair | 0 (0.0%) | 0 (0.0%) |
| Total (Category) | 61 (93.9%) | 4 (6.1%) |
| Total (Overall) | 193 (45.1%) | 235 (54.9%) |
Production, Transportation and Moving Occupations
The most common Production, Transportation and Moving occupations in North Edwards are Transportation (65 | 15.2%), and Production (33 | 7.7%).
Production, Transportation and Moving Occupations by Sex
| Occupation | Male | Female |
| Production | 25 (75.8%) | 8 (24.2%) |
| Transportation | 14 (21.5%) | 51 (78.5%) |
| Material Moving | 0 (0.0%) | 0 (0.0%) |
| Total (Category) | 39 (39.8%) | 59 (60.2%) |
| Total (Overall) | 193 (45.1%) | 235 (54.9%) |
Employment Industries by Sex in North Edwards
Employment Industries in North Edwards
The major employment industries in North Edwards include Health Care & Social Assistance (104 | 24.3%), Retail Trade (54 | 12.6%), Educational Services (52 | 12.1%), Public Administration (45 | 10.5%), and Administrative & Support (41 | 9.6%).
Employment Industries by Sex in North Edwards
The North Edwards industries that see more men than women are Mining, Quarrying, & Extraction (100.0%), Construction (100.0%), and Manufacturing (100.0%), whereas the industries that tend to have a higher number of women are Educational Services (100.0%), Health Care & Social Assistance (100.0%), and Administrative & Support (80.5%).
| Industry | Male | Female |
| Agriculture, Fishing & Hunting | 0 (0.0%) | 0 (0.0%) |
| Mining, Quarrying, & Extraction | 33 (100.0%) | 0 (0.0%) |
| Construction | 17 (100.0%) | 0 (0.0%) |
| Manufacturing | 11 (100.0%) | 0 (0.0%) |
| Wholesale Trade | 0 (0.0%) | 0 (0.0%) |
| Retail Trade | 40 (74.1%) | 14 (25.9%) |
| Transportation & Warehousing | 28 (100.0%) | 0 (0.0%) |
| Utilities | 11 (55.0%) | 9 (45.0%) |
| Information | 0 (0.0%) | 0 (0.0%) |
| Finance & Insurance | 2 (100.0%) | 0 (0.0%) |
| Real Estate, Rental & Leasing | 0 (0.0%) | 0 (0.0%) |
| Professional & Scientific | 0 (0.0%) | 0 (0.0%) |
| Enterprise Management | 0 (0.0%) | 0 (0.0%) |
| Administrative & Support | 8 (19.5%) | 33 (80.5%) |
| Educational Services | 0 (0.0%) | 52 (100.0%) |
| Health Care & Social Assistance | 0 (0.0%) | 104 (100.0%) |
| Arts, Entertainment & Recreation | 0 (0.0%) | 0 (0.0%) |
| Accommodation & Food Services | 13 (61.9%) | 8 (38.1%) |
| Public Administration | 30 (66.7%) | 15 (33.3%) |
| Total | 193 (45.1%) | 235 (54.9%) |
Education in North Edwards
School Enrollment in North Edwards
The most common levels of schooling among the 391 students in North Edwards are middle school (144 | 36.8%), elementary school (89 | 22.8%), and high school (85 | 21.7%).
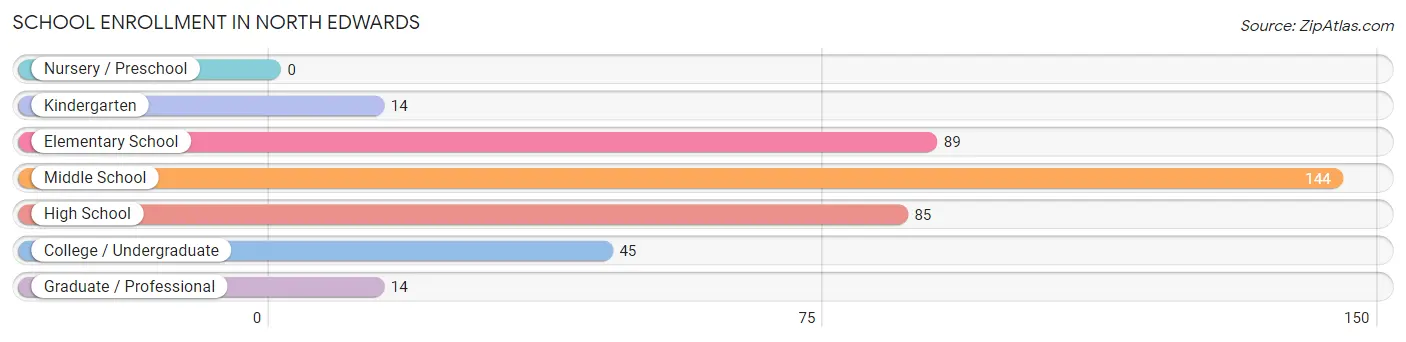
| School Level | # Students | % Students |
| Nursery / Preschool | 0 | 0.0% |
| Kindergarten | 14 | 3.6% |
| Elementary School | 89 | 22.8% |
| Middle School | 144 | 36.8% |
| High School | 85 | 21.7% |
| College / Undergraduate | 45 | 11.5% |
| Graduate / Professional | 14 | 3.6% |
| Total | 391 | 100.0% |
School Enrollment by Age by Funding Source in North Edwards
Out of a total of 391 students who are enrolled in schools in North Edwards, 40 (10.2%) attend a private institution, while the remaining 351 (89.8%) are enrolled in public schools. The age group of 10 to 14 year olds has the highest likelihood of being enrolled in private schools, with 40 (24.4% in the age bracket) enrolled. Conversely, the age group of 5 to 9 year old has the lowest likelihood of being enrolled in a private school, with 103 (100.0% in the age bracket) attending a public institution.
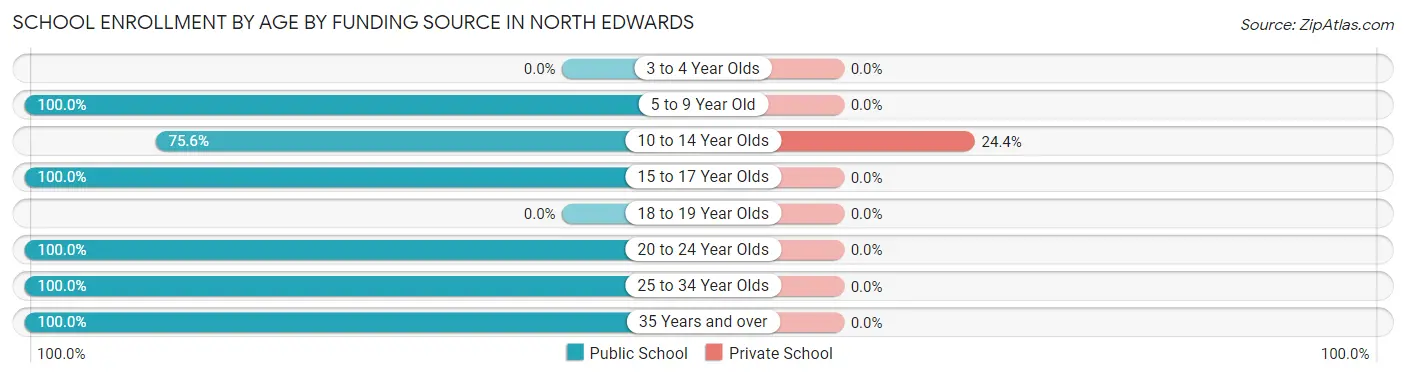
| Age Bracket | Public School | Private School |
| 3 to 4 Year Olds | 0 (0.0%) | 0 (0.0%) |
| 5 to 9 Year Old | 103 (100.0%) | 0 (0.0%) |
| 10 to 14 Year Olds | 124 (75.6%) | 40 (24.4%) |
| 15 to 17 Year Olds | 61 (100.0%) | 0 (0.0%) |
| 18 to 19 Year Olds | 0 (0.0%) | 0 (0.0%) |
| 20 to 24 Year Olds | 14 (100.0%) | 0 (0.0%) |
| 25 to 34 Year Olds | 16 (100.0%) | 0 (0.0%) |
| 35 Years and over | 33 (100.0%) | 0 (0.0%) |
| Total | 351 (89.8%) | 40 (10.2%) |
Educational Attainment by Field of Study in North Edwards
Business (42 | 53.8%), physical & health sciences (19 | 24.4%), and education (17 | 21.8%) are the most common fields of study among 78 individuals in North Edwards who have obtained a bachelor's degree or higher.
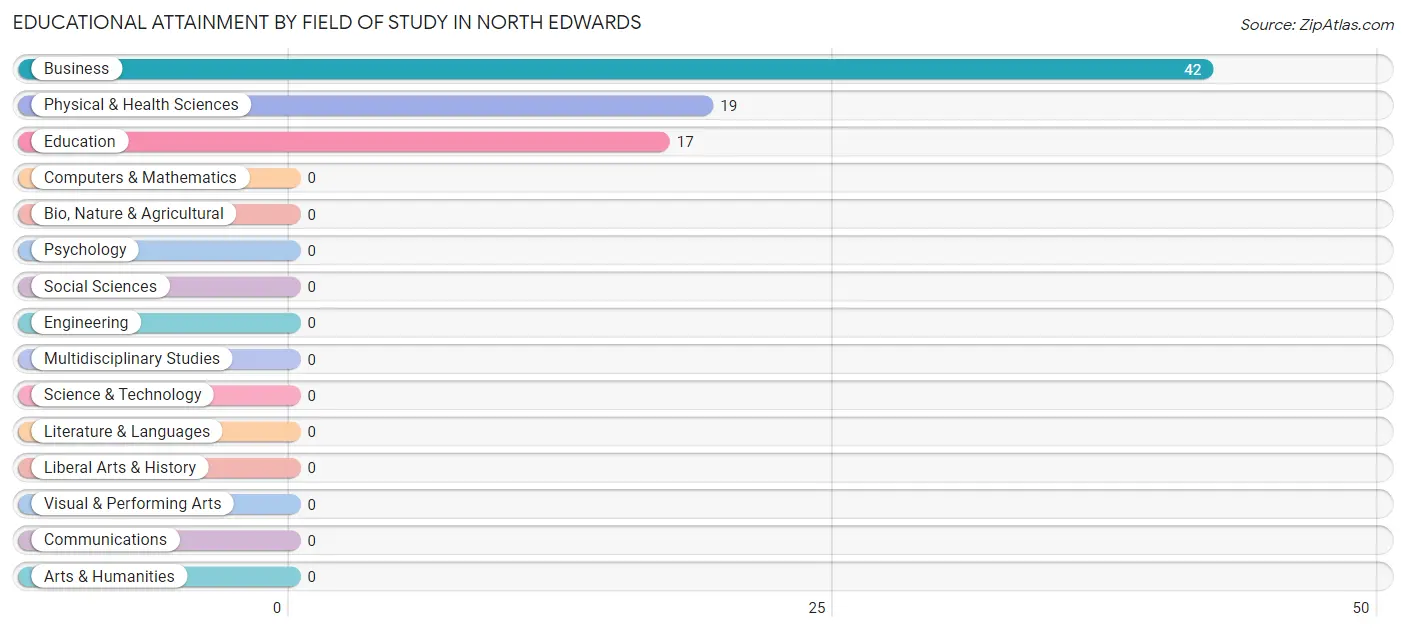
| Field of Study | # Graduates | % Graduates |
| Computers & Mathematics | 0 | 0.0% |
| Bio, Nature & Agricultural | 0 | 0.0% |
| Physical & Health Sciences | 19 | 24.4% |
| Psychology | 0 | 0.0% |
| Social Sciences | 0 | 0.0% |
| Engineering | 0 | 0.0% |
| Multidisciplinary Studies | 0 | 0.0% |
| Science & Technology | 0 | 0.0% |
| Business | 42 | 53.8% |
| Education | 17 | 21.8% |
| Literature & Languages | 0 | 0.0% |
| Liberal Arts & History | 0 | 0.0% |
| Visual & Performing Arts | 0 | 0.0% |
| Communications | 0 | 0.0% |
| Arts & Humanities | 0 | 0.0% |
| Total | 78 | 100.0% |
Transportation & Commute in North Edwards
Vehicle Availability by Sex in North Edwards
The most prevalent vehicle ownership categories in North Edwards are males with 1 vehicle (87, accounting for 47.5%) and females with 1 vehicle (107, making up 37.0%).
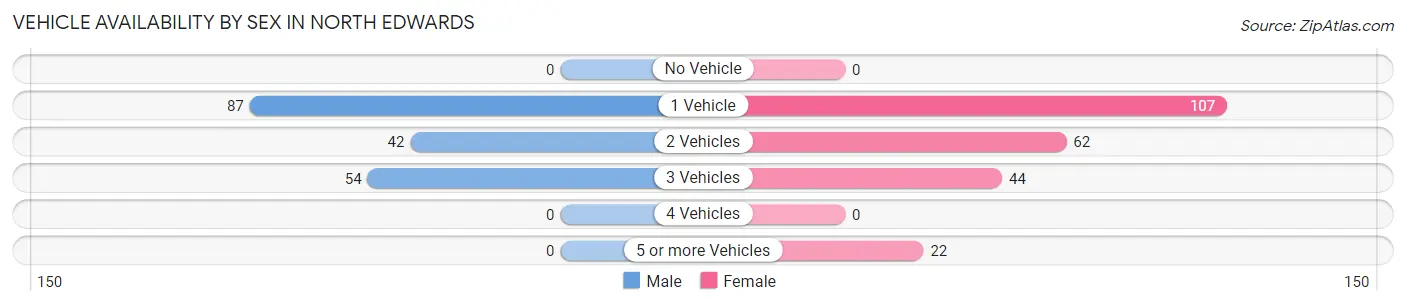
| Vehicles Available | Male | Female |
| No Vehicle | 0 (0.0%) | 0 (0.0%) |
| 1 Vehicle | 87 (47.5%) | 107 (45.5%) |
| 2 Vehicles | 42 (23.0%) | 62 (26.4%) |
| 3 Vehicles | 54 (29.5%) | 44 (18.7%) |
| 4 Vehicles | 0 (0.0%) | 0 (0.0%) |
| 5 or more Vehicles | 0 (0.0%) | 22 (9.4%) |
| Total | 183 (100.0%) | 235 (100.0%) |
Commute Time in North Edwards
The most frequently occuring commute durations in North Edwards are 15 to 19 minutes (119 commuters, 30.4%), 40 to 44 minutes (62 commuters, 15.8%), and 20 to 24 minutes (55 commuters, 14.0%).
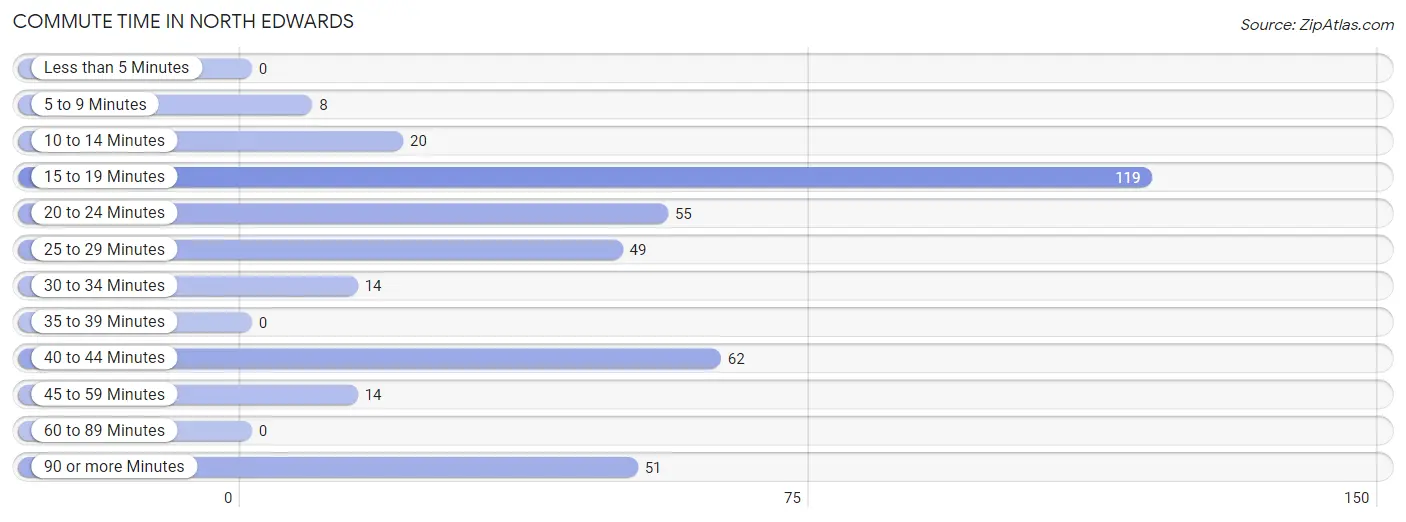
| Commute Time | # Commuters | % Commuters |
| Less than 5 Minutes | 0 | 0.0% |
| 5 to 9 Minutes | 8 | 2.0% |
| 10 to 14 Minutes | 20 | 5.1% |
| 15 to 19 Minutes | 119 | 30.4% |
| 20 to 24 Minutes | 55 | 14.0% |
| 25 to 29 Minutes | 49 | 12.5% |
| 30 to 34 Minutes | 14 | 3.6% |
| 35 to 39 Minutes | 0 | 0.0% |
| 40 to 44 Minutes | 62 | 15.8% |
| 45 to 59 Minutes | 14 | 3.6% |
| 60 to 89 Minutes | 0 | 0.0% |
| 90 or more Minutes | 51 | 13.0% |
Commute Time by Sex in North Edwards
The most common commute times in North Edwards are 15 to 19 minutes (42 commuters, 24.3%) for males and 15 to 19 minutes (77 commuters, 35.2%) for females.
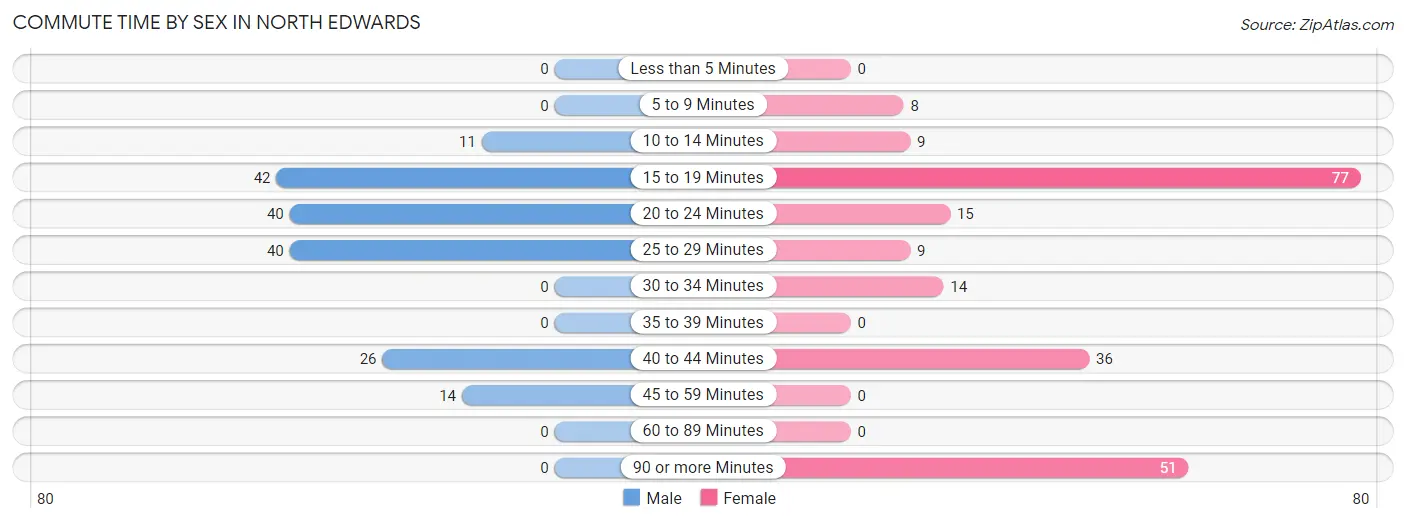
| Commute Time | Male | Female |
| Less than 5 Minutes | 0 (0.0%) | 0 (0.0%) |
| 5 to 9 Minutes | 0 (0.0%) | 8 (3.6%) |
| 10 to 14 Minutes | 11 (6.4%) | 9 (4.1%) |
| 15 to 19 Minutes | 42 (24.3%) | 77 (35.2%) |
| 20 to 24 Minutes | 40 (23.1%) | 15 (6.9%) |
| 25 to 29 Minutes | 40 (23.1%) | 9 (4.1%) |
| 30 to 34 Minutes | 0 (0.0%) | 14 (6.4%) |
| 35 to 39 Minutes | 0 (0.0%) | 0 (0.0%) |
| 40 to 44 Minutes | 26 (15.0%) | 36 (16.4%) |
| 45 to 59 Minutes | 14 (8.1%) | 0 (0.0%) |
| 60 to 89 Minutes | 0 (0.0%) | 0 (0.0%) |
| 90 or more Minutes | 0 (0.0%) | 51 (23.3%) |
Time of Departure to Work by Sex in North Edwards
The most frequent times of departure to work in North Edwards are 4:00 PM to 11:59 PM (40, 23.1%) for males and 6:30 AM to 6:59 AM (54, 24.7%) for females.
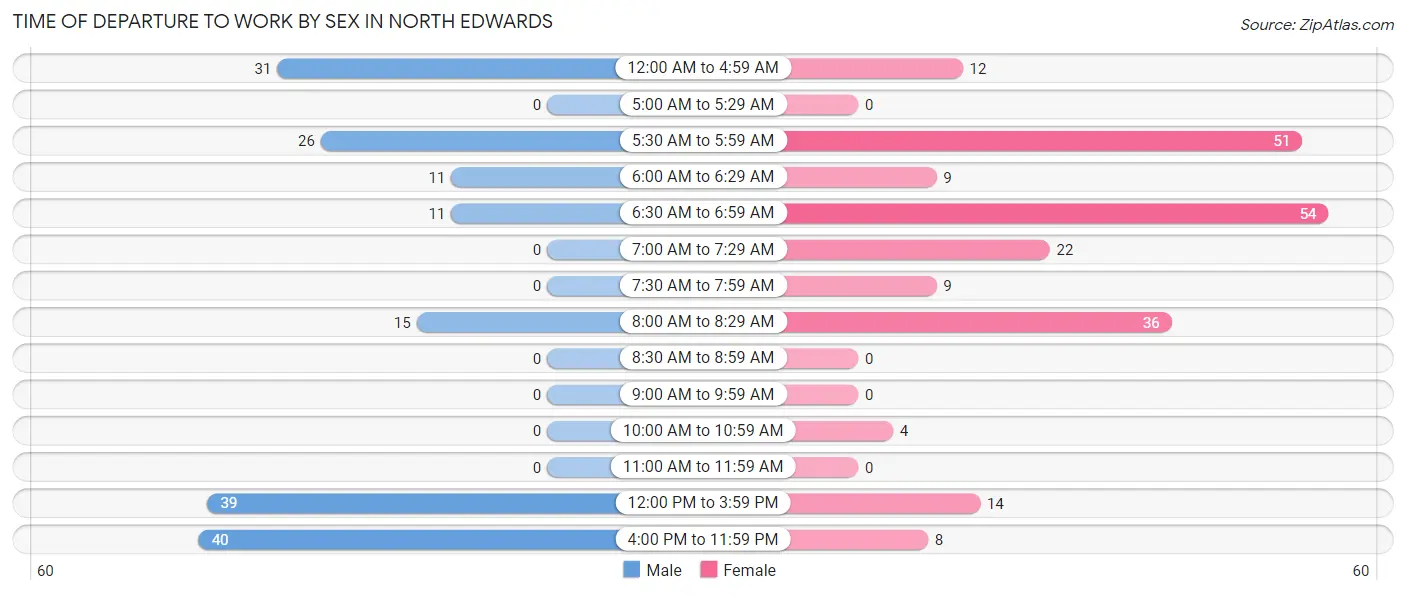
| Time of Departure | Male | Female |
| 12:00 AM to 4:59 AM | 31 (17.9%) | 12 (5.5%) |
| 5:00 AM to 5:29 AM | 0 (0.0%) | 0 (0.0%) |
| 5:30 AM to 5:59 AM | 26 (15.0%) | 51 (23.3%) |
| 6:00 AM to 6:29 AM | 11 (6.4%) | 9 (4.1%) |
| 6:30 AM to 6:59 AM | 11 (6.4%) | 54 (24.7%) |
| 7:00 AM to 7:29 AM | 0 (0.0%) | 22 (10.1%) |
| 7:30 AM to 7:59 AM | 0 (0.0%) | 9 (4.1%) |
| 8:00 AM to 8:29 AM | 15 (8.7%) | 36 (16.4%) |
| 8:30 AM to 8:59 AM | 0 (0.0%) | 0 (0.0%) |
| 9:00 AM to 9:59 AM | 0 (0.0%) | 0 (0.0%) |
| 10:00 AM to 10:59 AM | 0 (0.0%) | 4 (1.8%) |
| 11:00 AM to 11:59 AM | 0 (0.0%) | 0 (0.0%) |
| 12:00 PM to 3:59 PM | 39 (22.5%) | 14 (6.4%) |
| 4:00 PM to 11:59 PM | 40 (23.1%) | 8 (3.6%) |
| Total | 173 (100.0%) | 219 (100.0%) |
Housing Occupancy in North Edwards
Occupancy by Ownership in North Edwards
Of the total 420 dwellings in North Edwards, owner-occupied units account for 244 (58.1%), while renter-occupied units make up 176 (41.9%).
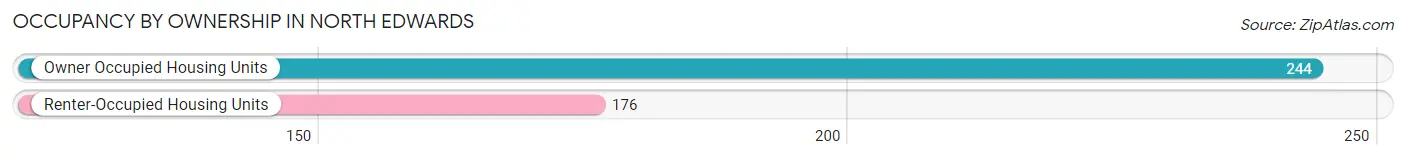
| Occupancy | # Housing Units | % Housing Units |
| Owner Occupied Housing Units | 244 | 58.1% |
| Renter-Occupied Housing Units | 176 | 41.9% |
| Total Occupied Housing Units | 420 | 100.0% |
Occupancy by Household Size in North Edwards
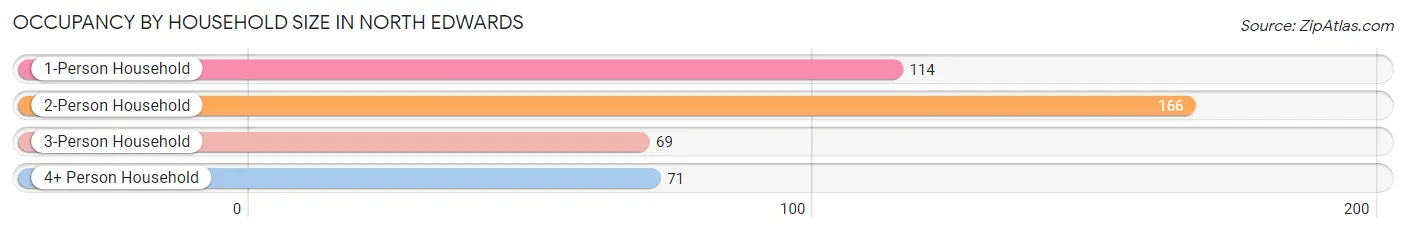
| Household Size | # Housing Units | % Housing Units |
| 1-Person Household | 114 | 27.1% |
| 2-Person Household | 166 | 39.5% |
| 3-Person Household | 69 | 16.4% |
| 4+ Person Household | 71 | 16.9% |
| Total Housing Units | 420 | 100.0% |
Occupancy by Ownership by Household Size in North Edwards
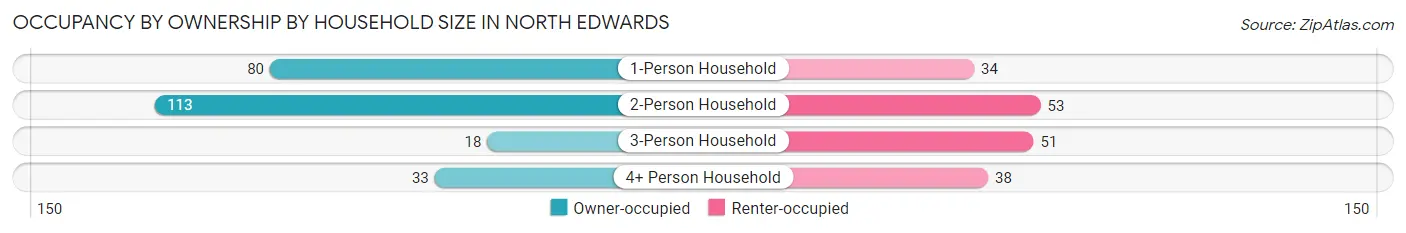
| Household Size | Owner-occupied | Renter-occupied |
| 1-Person Household | 80 (70.2%) | 34 (29.8%) |
| 2-Person Household | 113 (68.1%) | 53 (31.9%) |
| 3-Person Household | 18 (26.1%) | 51 (73.9%) |
| 4+ Person Household | 33 (46.5%) | 38 (53.5%) |
| Total Housing Units | 244 (58.1%) | 176 (41.9%) |
Occupancy by Educational Attainment in North Edwards
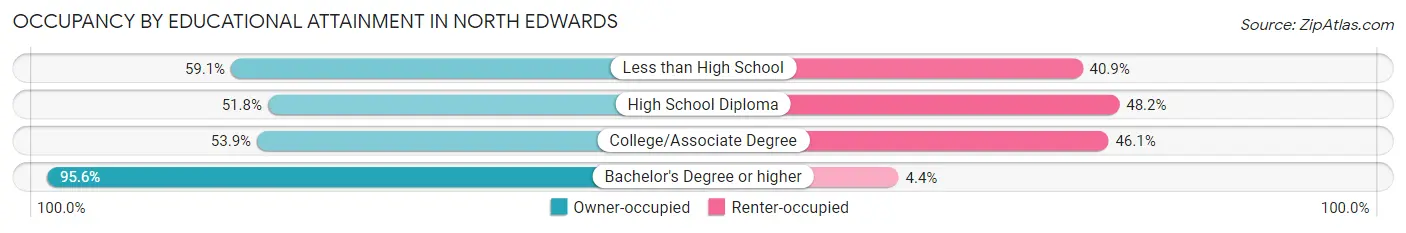
| Household Size | Owner-occupied | Renter-occupied |
| Less than High School | 13 (59.1%) | 9 (40.9%) |
| High School Diploma | 58 (51.8%) | 54 (48.2%) |
| College/Associate Degree | 130 (53.9%) | 111 (46.1%) |
| Bachelor's Degree or higher | 43 (95.6%) | 2 (4.4%) |
Occupancy by Age of Householder in North Edwards
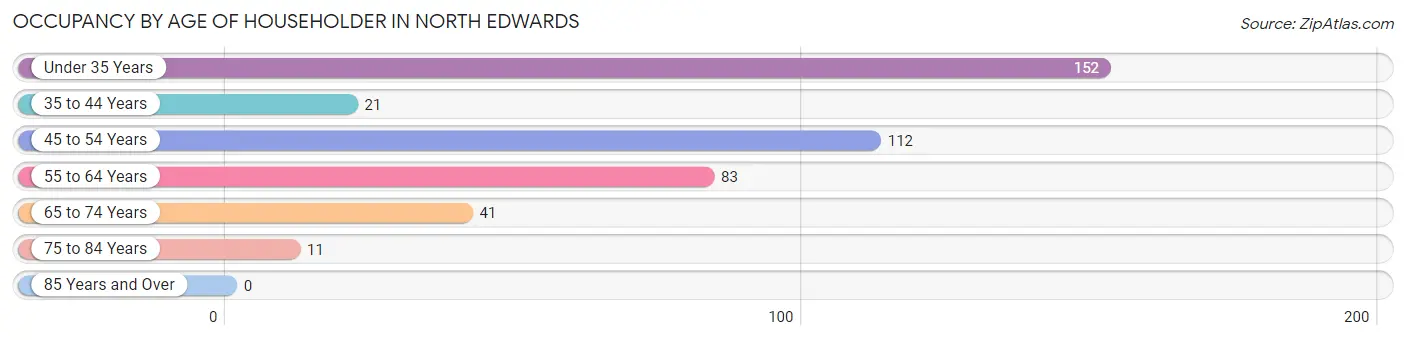
| Age Bracket | # Households | % Households |
| Under 35 Years | 152 | 36.2% |
| 35 to 44 Years | 21 | 5.0% |
| 45 to 54 Years | 112 | 26.7% |
| 55 to 64 Years | 83 | 19.8% |
| 65 to 74 Years | 41 | 9.8% |
| 75 to 84 Years | 11 | 2.6% |
| 85 Years and Over | 0 | 0.0% |
| Total | 420 | 100.0% |
Housing Finances in North Edwards
Median Income by Occupancy in North Edwards
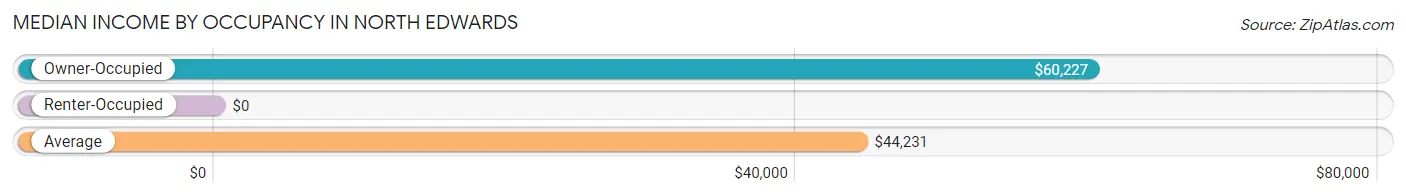
| Occupancy Type | # Households | Median Income |
| Owner-Occupied | 244 (58.1%) | $60,227 |
| Renter-Occupied | 176 (41.9%) | $0 |
| Average | 420 (100.0%) | $44,231 |
Occupancy by Householder Income Bracket in North Edwards
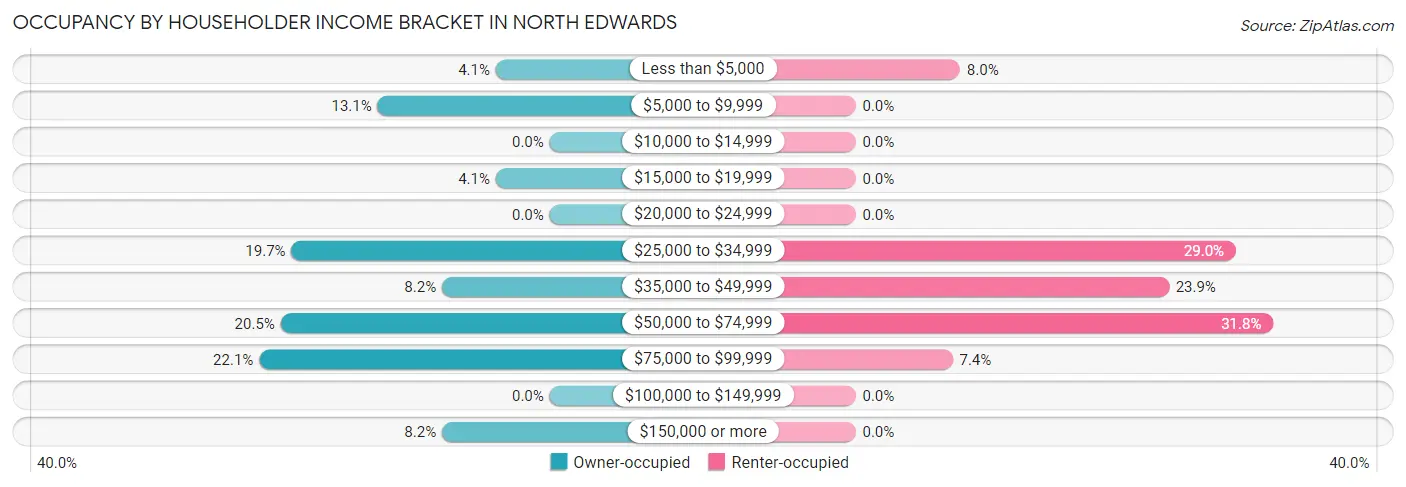
| Income Bracket | Owner-occupied | Renter-occupied |
| Less than $5,000 | 10 (4.1%) | 14 (8.0%) |
| $5,000 to $9,999 | 32 (13.1%) | 0 (0.0%) |
| $10,000 to $14,999 | 0 (0.0%) | 0 (0.0%) |
| $15,000 to $19,999 | 10 (4.1%) | 0 (0.0%) |
| $20,000 to $24,999 | 0 (0.0%) | 0 (0.0%) |
| $25,000 to $34,999 | 48 (19.7%) | 51 (29.0%) |
| $35,000 to $49,999 | 20 (8.2%) | 42 (23.9%) |
| $50,000 to $74,999 | 50 (20.5%) | 56 (31.8%) |
| $75,000 to $99,999 | 54 (22.1%) | 13 (7.4%) |
| $100,000 to $149,999 | 0 (0.0%) | 0 (0.0%) |
| $150,000 or more | 20 (8.2%) | 0 (0.0%) |
| Total | 244 (100.0%) | 176 (100.0%) |
Monthly Housing Cost Tiers in North Edwards
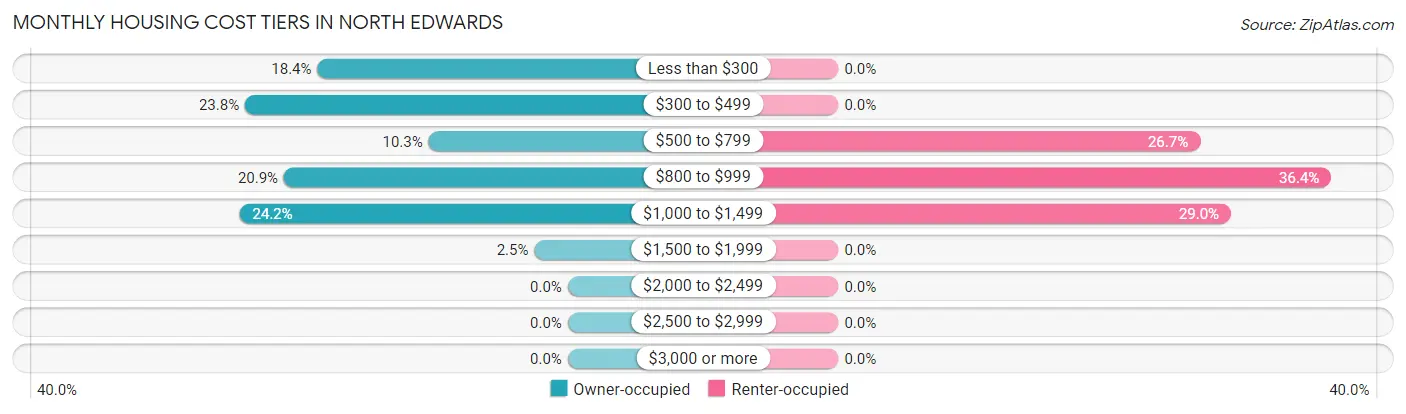
| Monthly Cost | Owner-occupied | Renter-occupied |
| Less than $300 | 45 (18.4%) | 0 (0.0%) |
| $300 to $499 | 58 (23.8%) | 0 (0.0%) |
| $500 to $799 | 25 (10.2%) | 47 (26.7%) |
| $800 to $999 | 51 (20.9%) | 64 (36.4%) |
| $1,000 to $1,499 | 59 (24.2%) | 51 (29.0%) |
| $1,500 to $1,999 | 6 (2.5%) | 0 (0.0%) |
| $2,000 to $2,499 | 0 (0.0%) | 0 (0.0%) |
| $2,500 to $2,999 | 0 (0.0%) | 0 (0.0%) |
| $3,000 or more | 0 (0.0%) | 0 (0.0%) |
| Total | 244 (100.0%) | 176 (100.0%) |
Physical Housing Characteristics in North Edwards
Housing Structures in North Edwards
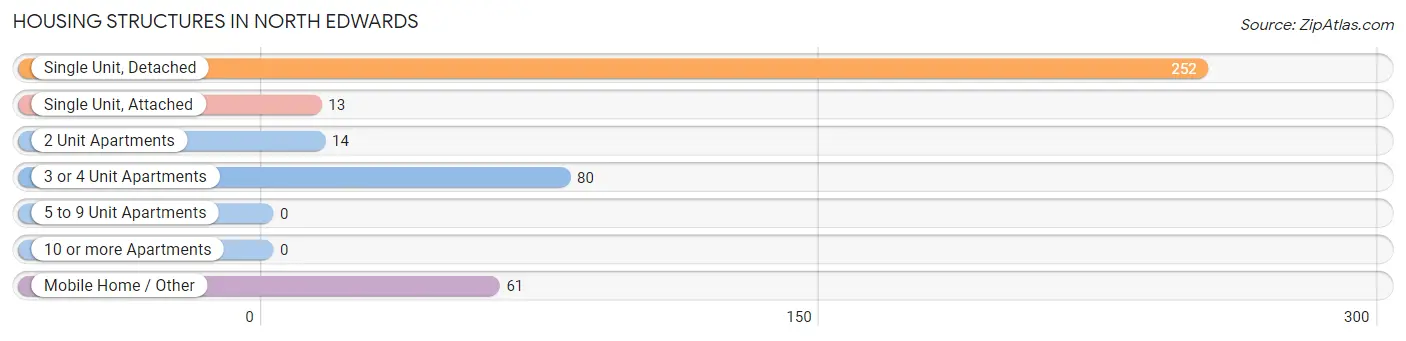
| Structure Type | # Housing Units | % Housing Units |
| Single Unit, Detached | 252 | 60.0% |
| Single Unit, Attached | 13 | 3.1% |
| 2 Unit Apartments | 14 | 3.3% |
| 3 or 4 Unit Apartments | 80 | 19.1% |
| 5 to 9 Unit Apartments | 0 | 0.0% |
| 10 or more Apartments | 0 | 0.0% |
| Mobile Home / Other | 61 | 14.5% |
| Total | 420 | 100.0% |
Housing Structures by Occupancy in North Edwards
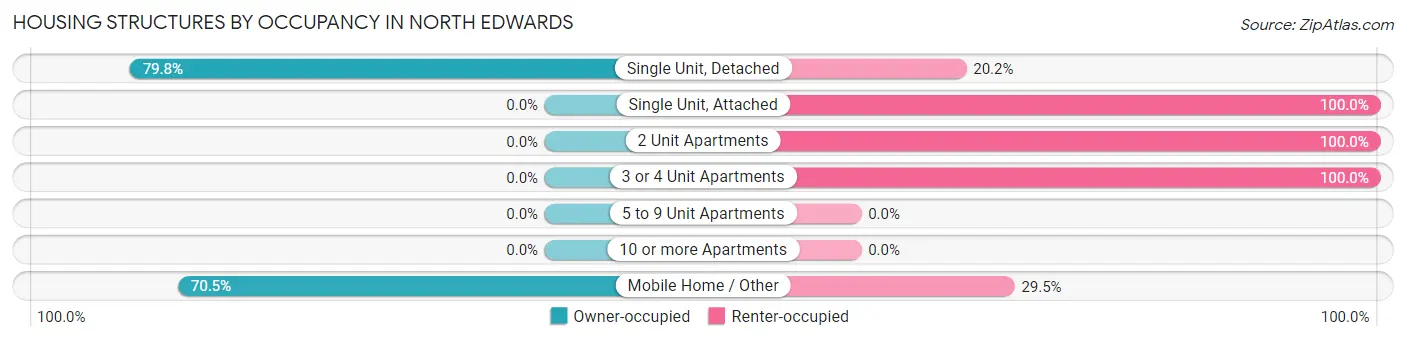
| Structure Type | Owner-occupied | Renter-occupied |
| Single Unit, Detached | 201 (79.8%) | 51 (20.2%) |
| Single Unit, Attached | 0 (0.0%) | 13 (100.0%) |
| 2 Unit Apartments | 0 (0.0%) | 14 (100.0%) |
| 3 or 4 Unit Apartments | 0 (0.0%) | 80 (100.0%) |
| 5 to 9 Unit Apartments | 0 (0.0%) | 0 (0.0%) |
| 10 or more Apartments | 0 (0.0%) | 0 (0.0%) |
| Mobile Home / Other | 43 (70.5%) | 18 (29.5%) |
| Total | 244 (58.1%) | 176 (41.9%) |
Housing Structures by Number of Rooms in North Edwards
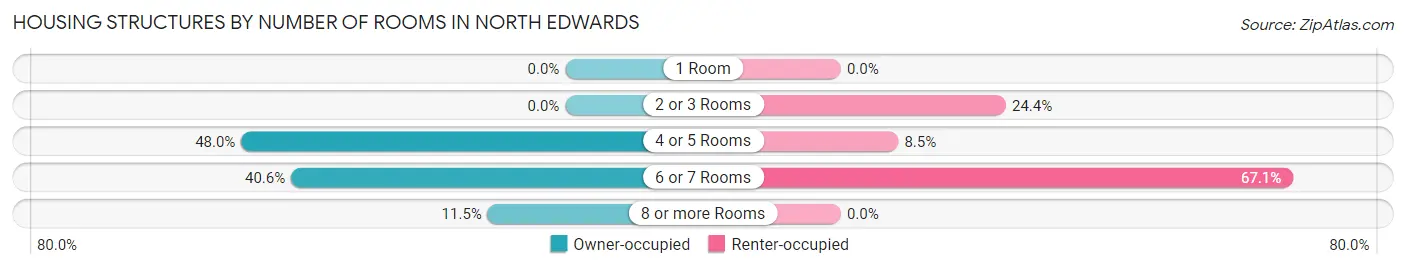
| Number of Rooms | Owner-occupied | Renter-occupied |
| 1 Room | 0 (0.0%) | 0 (0.0%) |
| 2 or 3 Rooms | 0 (0.0%) | 43 (24.4%) |
| 4 or 5 Rooms | 117 (47.9%) | 15 (8.5%) |
| 6 or 7 Rooms | 99 (40.6%) | 118 (67.0%) |
| 8 or more Rooms | 28 (11.5%) | 0 (0.0%) |
| Total | 244 (100.0%) | 176 (100.0%) |
Housing Structure by Heating Type in North Edwards
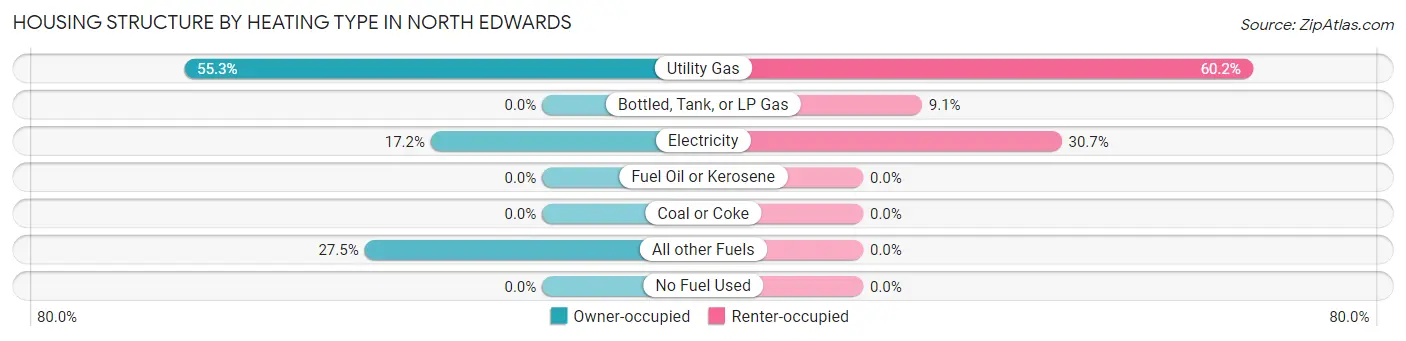
| Heating Type | Owner-occupied | Renter-occupied |
| Utility Gas | 135 (55.3%) | 106 (60.2%) |
| Bottled, Tank, or LP Gas | 0 (0.0%) | 16 (9.1%) |
| Electricity | 42 (17.2%) | 54 (30.7%) |
| Fuel Oil or Kerosene | 0 (0.0%) | 0 (0.0%) |
| Coal or Coke | 0 (0.0%) | 0 (0.0%) |
| All other Fuels | 67 (27.5%) | 0 (0.0%) |
| No Fuel Used | 0 (0.0%) | 0 (0.0%) |
| Total | 244 (100.0%) | 176 (100.0%) |
Household Vehicle Usage in North Edwards
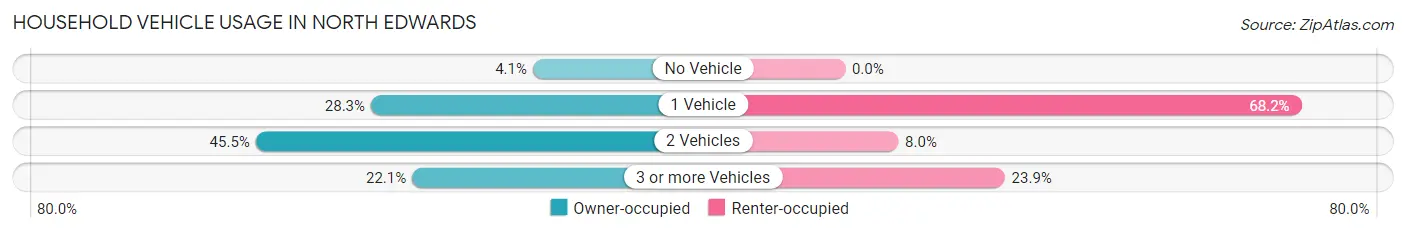
| Vehicles per Household | Owner-occupied | Renter-occupied |
| No Vehicle | 10 (4.1%) | 0 (0.0%) |
| 1 Vehicle | 69 (28.3%) | 120 (68.2%) |
| 2 Vehicles | 111 (45.5%) | 14 (8.0%) |
| 3 or more Vehicles | 54 (22.1%) | 42 (23.9%) |
| Total | 244 (100.0%) | 176 (100.0%) |
Real Estate & Mortgages in North Edwards
Real Estate and Mortgage Overview in North Edwards
| Characteristic | Without Mortgage | With Mortgage |
| Housing Units | 115 | 129 |
| Median Property Value | $58,500 | $138,400 |
| Median Household Income | - | - |
| Monthly Housing Costs | $367 | $0 |
| Real Estate Taxes | $920 | $0 |
Property Value by Mortgage Status in North Edwards
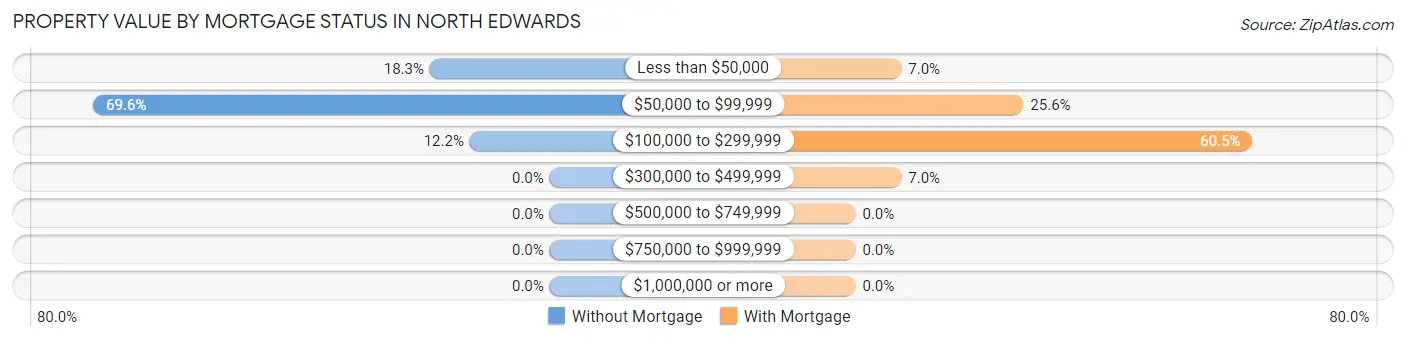
| Property Value | Without Mortgage | With Mortgage |
| Less than $50,000 | 21 (18.3%) | 9 (7.0%) |
| $50,000 to $99,999 | 80 (69.6%) | 33 (25.6%) |
| $100,000 to $299,999 | 14 (12.2%) | 78 (60.5%) |
| $300,000 to $499,999 | 0 (0.0%) | 9 (7.0%) |
| $500,000 to $749,999 | 0 (0.0%) | 0 (0.0%) |
| $750,000 to $999,999 | 0 (0.0%) | 0 (0.0%) |
| $1,000,000 or more | 0 (0.0%) | 0 (0.0%) |
| Total | 115 (100.0%) | 129 (100.0%) |
Household Income by Mortgage Status in North Edwards
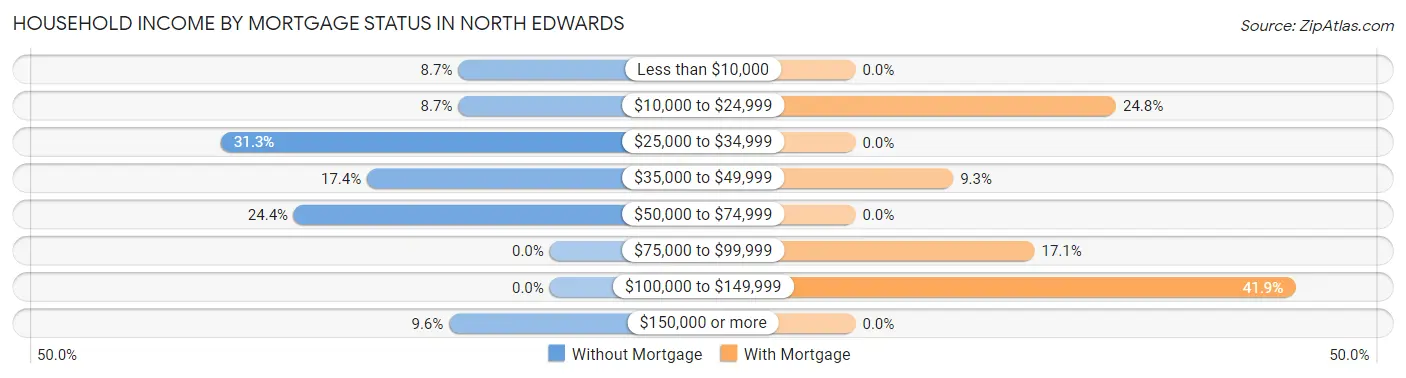
| Household Income | Without Mortgage | With Mortgage |
| Less than $10,000 | 10 (8.7%) | 0 (0.0%) |
| $10,000 to $24,999 | 10 (8.7%) | 32 (24.8%) |
| $25,000 to $34,999 | 36 (31.3%) | 0 (0.0%) |
| $35,000 to $49,999 | 20 (17.4%) | 12 (9.3%) |
| $50,000 to $74,999 | 28 (24.3%) | 0 (0.0%) |
| $75,000 to $99,999 | 0 (0.0%) | 22 (17.1%) |
| $100,000 to $149,999 | 0 (0.0%) | 54 (41.9%) |
| $150,000 or more | 11 (9.6%) | 0 (0.0%) |
| Total | 115 (100.0%) | 129 (100.0%) |
Property Value to Household Income Ratio in North Edwards
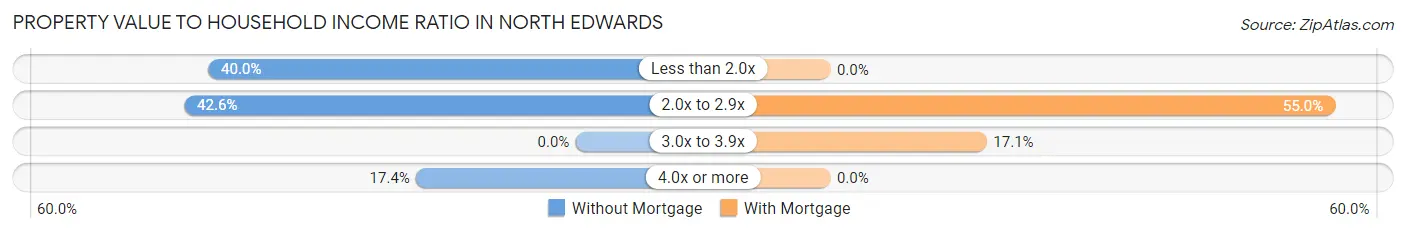
| Value-to-Income Ratio | Without Mortgage | With Mortgage |
| Less than 2.0x | 46 (40.0%) | 0 (0.0%) |
| 2.0x to 2.9x | 49 (42.6%) | 71 (55.0%) |
| 3.0x to 3.9x | 0 (0.0%) | 22 (17.1%) |
| 4.0x or more | 20 (17.4%) | 0 (0.0%) |
| Total | 115 (100.0%) | 129 (100.0%) |
Real Estate Taxes by Mortgage Status in North Edwards
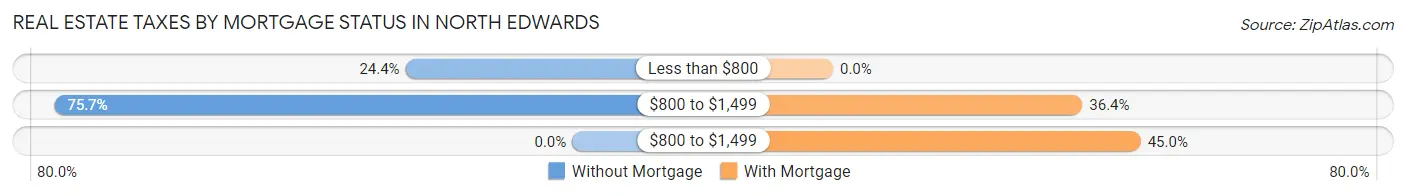
| Property Taxes | Without Mortgage | With Mortgage |
| Less than $800 | 28 (24.3%) | 0 (0.0%) |
| $800 to $1,499 | 87 (75.6%) | 47 (36.4%) |
| $800 to $1,499 | 0 (0.0%) | 58 (45.0%) |
| Total | 115 (100.0%) | 129 (100.0%) |
Health & Disability in North Edwards
Health Insurance Coverage by Age in North Edwards
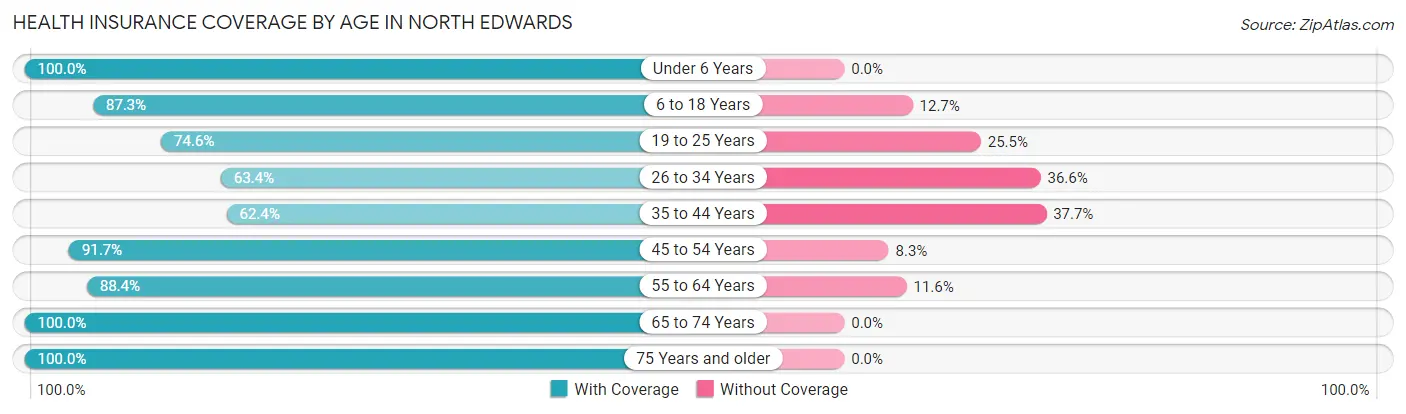
| Age Bracket | With Coverage | Without Coverage |
| Under 6 Years | 14 (100.0%) | 0 (0.0%) |
| 6 to 18 Years | 274 (87.3%) | 40 (12.7%) |
| 19 to 25 Years | 41 (74.6%) | 14 (25.5%) |
| 26 to 34 Years | 168 (63.4%) | 97 (36.6%) |
| 35 to 44 Years | 53 (62.4%) | 32 (37.7%) |
| 45 to 54 Years | 111 (91.7%) | 10 (8.3%) |
| 55 to 64 Years | 137 (88.4%) | 18 (11.6%) |
| 65 to 74 Years | 49 (100.0%) | 0 (0.0%) |
| 75 Years and older | 19 (100.0%) | 0 (0.0%) |
| Total | 866 (80.4%) | 211 (19.6%) |
Health Insurance Coverage by Citizenship Status in North Edwards
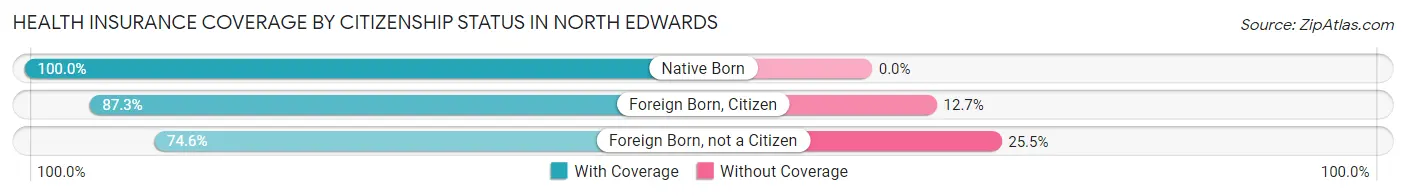
| Citizenship Status | With Coverage | Without Coverage |
| Native Born | 14 (100.0%) | 0 (0.0%) |
| Foreign Born, Citizen | 274 (87.3%) | 40 (12.7%) |
| Foreign Born, not a Citizen | 41 (74.6%) | 14 (25.5%) |
Health Insurance Coverage by Household Income in North Edwards
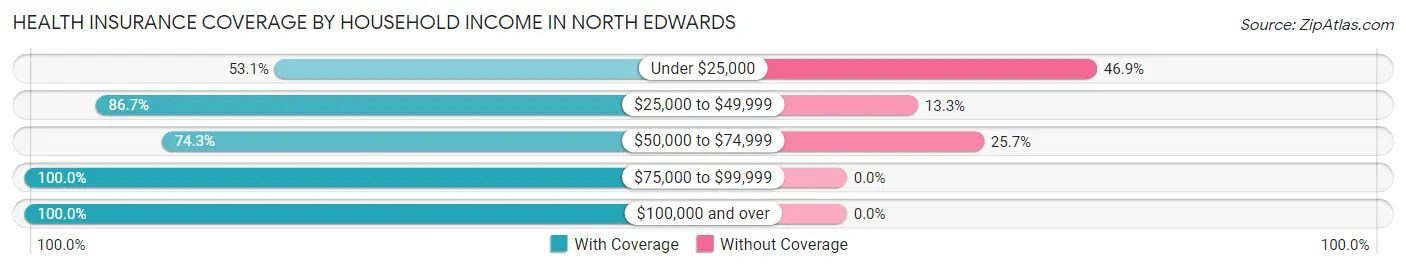
| Household Income | With Coverage | Without Coverage |
| Under $25,000 | 93 (53.1%) | 82 (46.9%) |
| $25,000 to $49,999 | 358 (86.7%) | 55 (13.3%) |
| $50,000 to $74,999 | 214 (74.3%) | 74 (25.7%) |
| $75,000 to $99,999 | 134 (100.0%) | 0 (0.0%) |
| $100,000 and over | 67 (100.0%) | 0 (0.0%) |
Public vs Private Health Insurance Coverage by Age in North Edwards
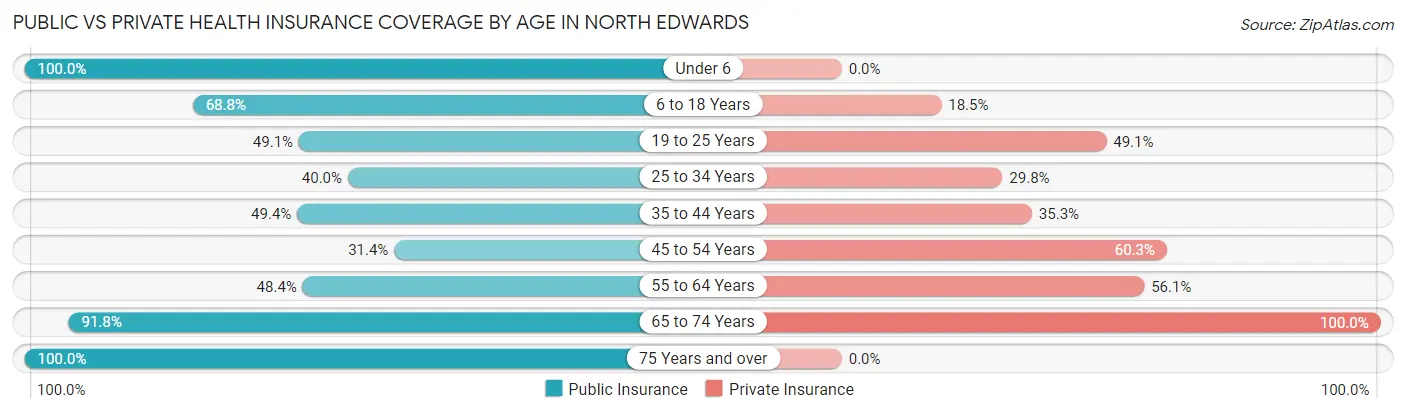
| Age Bracket | Public Insurance | Private Insurance |
| Under 6 | 14 (100.0%) | 0 (0.0%) |
| 6 to 18 Years | 216 (68.8%) | 58 (18.5%) |
| 19 to 25 Years | 27 (49.1%) | 27 (49.1%) |
| 25 to 34 Years | 106 (40.0%) | 79 (29.8%) |
| 35 to 44 Years | 42 (49.4%) | 30 (35.3%) |
| 45 to 54 Years | 38 (31.4%) | 73 (60.3%) |
| 55 to 64 Years | 75 (48.4%) | 87 (56.1%) |
| 65 to 74 Years | 45 (91.8%) | 49 (100.0%) |
| 75 Years and over | 19 (100.0%) | 0 (0.0%) |
| Total | 582 (54.0%) | 403 (37.4%) |
Disability Status by Sex by Age in North Edwards
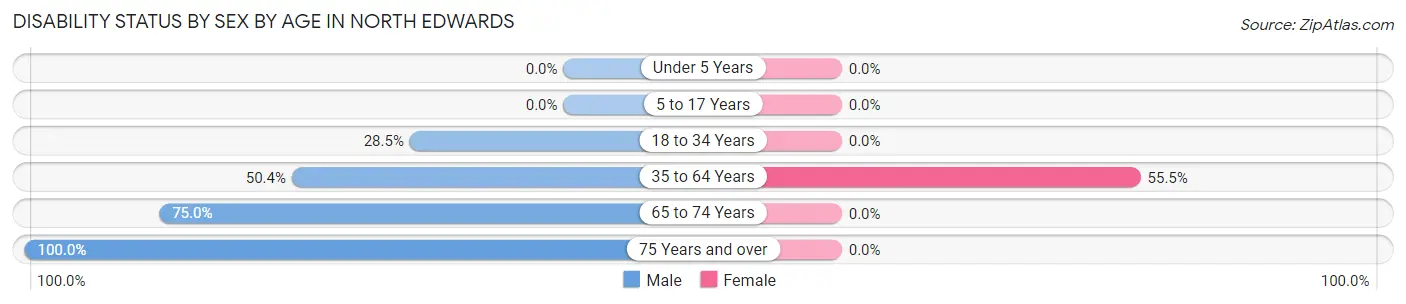
| Age Bracket | Male | Female |
| Under 5 Years | 0 (0.0%) | 0 (0.0%) |
| 5 to 17 Years | 0 (0.0%) | 0 (0.0%) |
| 18 to 34 Years | 65 (28.5%) | 0 (0.0%) |
| 35 to 64 Years | 62 (50.4%) | 132 (55.5%) |
| 65 to 74 Years | 18 (75.0%) | 0 (0.0%) |
| 75 Years and over | 19 (100.0%) | 0 (0.0%) |
Disability Class by Sex by Age in North Edwards
Disability Class: Hearing Difficulty
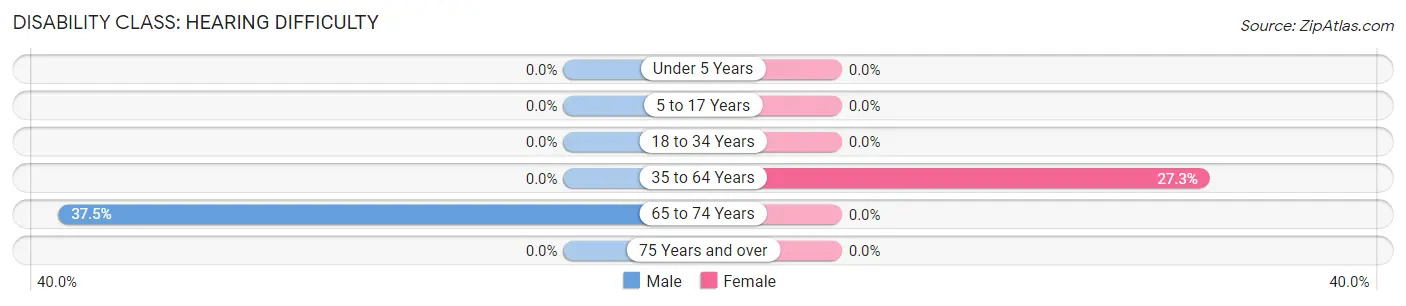
| Age Bracket | Male | Female |
| Under 5 Years | 0 (0.0%) | 0 (0.0%) |
| 5 to 17 Years | 0 (0.0%) | 0 (0.0%) |
| 18 to 34 Years | 0 (0.0%) | 0 (0.0%) |
| 35 to 64 Years | 0 (0.0%) | 65 (27.3%) |
| 65 to 74 Years | 9 (37.5%) | 0 (0.0%) |
| 75 Years and over | 0 (0.0%) | 0 (0.0%) |
Disability Class: Vision Difficulty
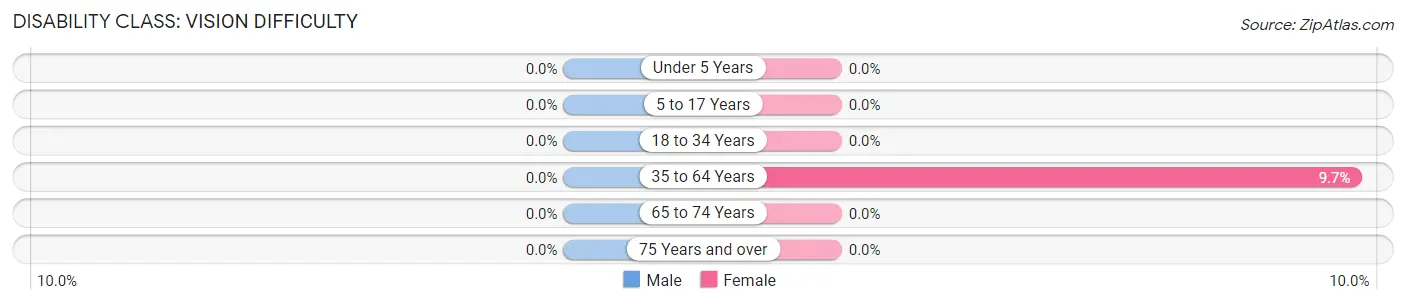
| Age Bracket | Male | Female |
| Under 5 Years | 0 (0.0%) | 0 (0.0%) |
| 5 to 17 Years | 0 (0.0%) | 0 (0.0%) |
| 18 to 34 Years | 0 (0.0%) | 0 (0.0%) |
| 35 to 64 Years | 0 (0.0%) | 23 (9.7%) |
| 65 to 74 Years | 0 (0.0%) | 0 (0.0%) |
| 75 Years and over | 0 (0.0%) | 0 (0.0%) |
Disability Class: Cognitive Difficulty
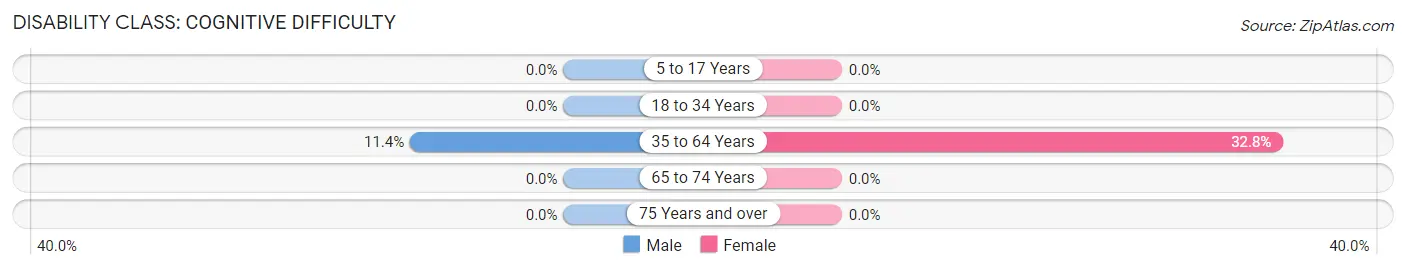
| Age Bracket | Male | Female |
| 5 to 17 Years | 0 (0.0%) | 0 (0.0%) |
| 18 to 34 Years | 0 (0.0%) | 0 (0.0%) |
| 35 to 64 Years | 14 (11.4%) | 78 (32.8%) |
| 65 to 74 Years | 0 (0.0%) | 0 (0.0%) |
| 75 Years and over | 0 (0.0%) | 0 (0.0%) |
Disability Class: Ambulatory Difficulty
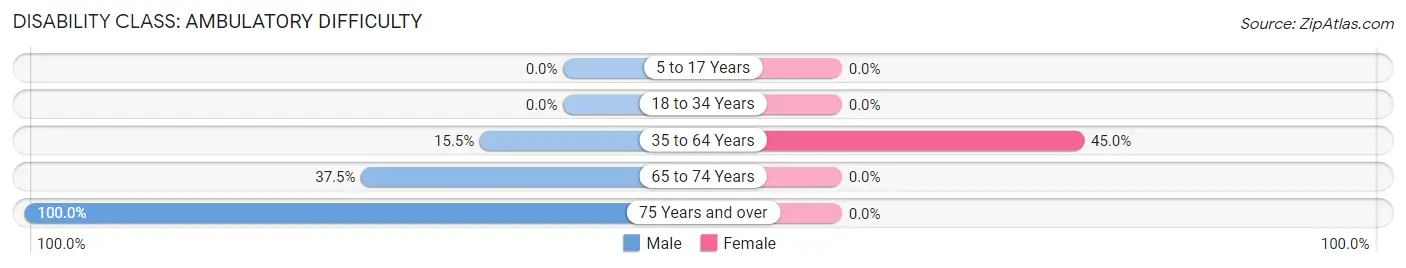
| Age Bracket | Male | Female |
| 5 to 17 Years | 0 (0.0%) | 0 (0.0%) |
| 18 to 34 Years | 0 (0.0%) | 0 (0.0%) |
| 35 to 64 Years | 19 (15.4%) | 107 (45.0%) |
| 65 to 74 Years | 9 (37.5%) | 0 (0.0%) |
| 75 Years and over | 19 (100.0%) | 0 (0.0%) |
Disability Class: Self-Care Difficulty
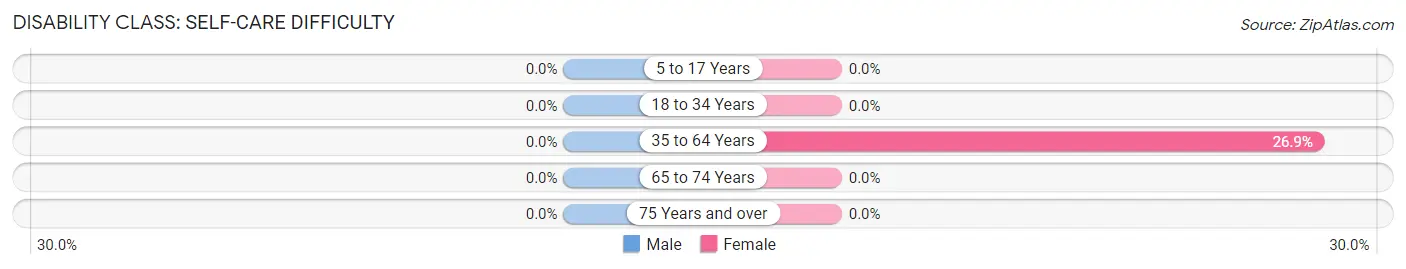
| Age Bracket | Male | Female |
| 5 to 17 Years | 0 (0.0%) | 0 (0.0%) |
| 18 to 34 Years | 0 (0.0%) | 0 (0.0%) |
| 35 to 64 Years | 0 (0.0%) | 64 (26.9%) |
| 65 to 74 Years | 0 (0.0%) | 0 (0.0%) |
| 75 Years and over | 0 (0.0%) | 0 (0.0%) |
Technology Access in North Edwards
Computing Device Access in North Edwards
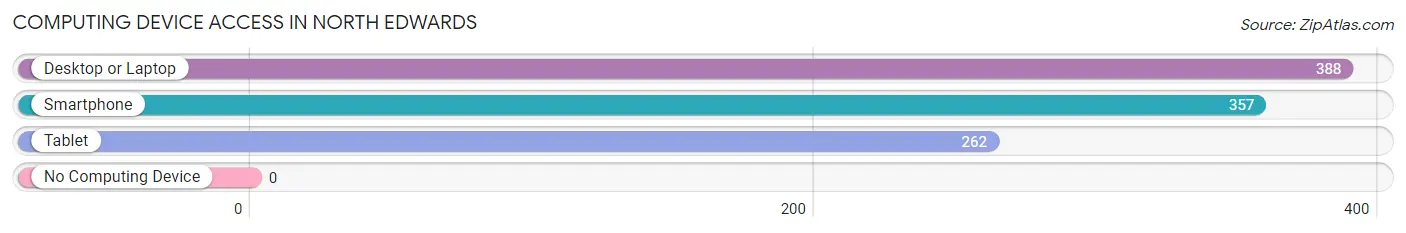
| Device Type | # Households | % Households |
| Desktop or Laptop | 388 | 92.4% |
| Smartphone | 357 | 85.0% |
| Tablet | 262 | 62.4% |
| No Computing Device | 0 | 0.0% |
| Total | 420 | 100.0% |
Internet Access in North Edwards
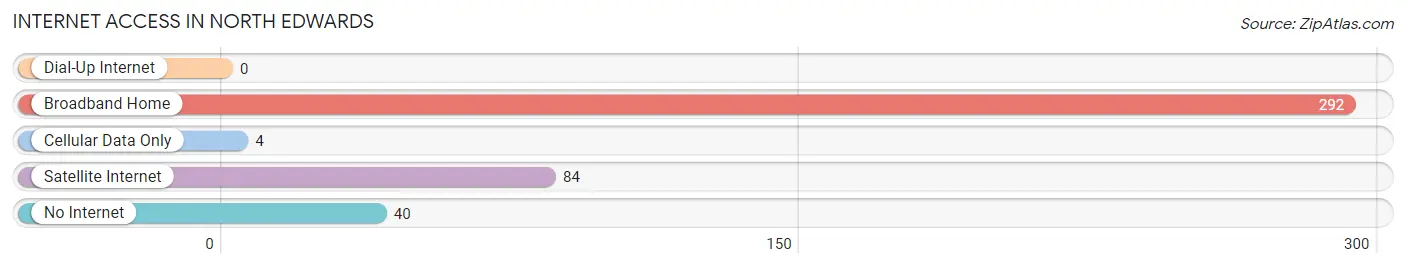
| Internet Type | # Households | % Households |
| Dial-Up Internet | 0 | 0.0% |
| Broadband Home | 292 | 69.5% |
| Cellular Data Only | 4 | 0.9% |
| Satellite Internet | 84 | 20.0% |
| No Internet | 40 | 9.5% |
| Total | 420 | 100.0% |
North Edwards Summary
Edwards Air Force Base, located in North Edwards, California, is a major United States Air Force installation and the home of the Air Force Test Center. It is located in the Mojave Desert, approximately 100 miles northeast of Los Angeles. The base is named after Captain Glen Edwards, a World War II test pilot who died in a crash in 1948.
History
North Edwards was originally part of the El Mirage Dry Lake, which was used by the United States Army Air Corps for bombing and gunnery practice during World War II. In 1947, the Army Air Corps transferred the land to the United States Air Force, and it was renamed Edwards Air Force Base. The base was used for testing and development of aircraft and weapons systems, and was the site of many historic firsts, including the first supersonic flight and the first landing of the Space Shuttle.
Geography
North Edwards is located in the Mojave Desert, approximately 100 miles northeast of Los Angeles. The base is situated on the western edge of the El Mirage Dry Lake, which is a large, flat, dry lake bed. The area is characterized by low hills and mountains, and is home to a variety of wildlife, including coyotes, jackrabbits, and roadrunners.
Economy
North Edwards is home to Edwards Air Force Base, which is the largest employer in the area. The base is responsible for the testing and development of aircraft and weapons systems, and employs thousands of people in a variety of positions. The base also serves as a major economic driver for the region, providing jobs and economic activity to the surrounding communities.
Demographics
As of the 2010 census, the population of North Edwards was 1,945. The racial makeup of the town was 73.3% White, 11.2% African American, 0.7% Native American, 5.2% Asian, 0.2% Pacific Islander, and 9.4% from other races. The median household income was $45,938, and the median family income was $50,938. The per capita income was $20,938.
Conclusion
North Edwards, California is a small town located in the Mojave Desert, approximately 100 miles northeast of Los Angeles. The town is home to Edwards Air Force Base, which is the largest employer in the area and provides jobs and economic activity to the surrounding communities. The population of North Edwards is diverse, with a majority of the population being White, followed by African American, Native American, Asian, and Pacific Islander. The median household income is $45,938, and the median family income is $50,938.
Common Questions
What is Per Capita Income in North Edwards?
Per Capita income in North Edwards is $24,880.
What is the Median Family Income in North Edwards?
Median Family Income in North Edwards is $42,981.
What is the Median Household income in North Edwards?
Median Household Income in North Edwards is $44,231.
What is Income or Wage Gap in North Edwards?
Income or Wage Gap in North Edwards is 43.8%.
Women in North Edwards earn 56.2 cents for every dollar earned by a man.
What is Inequality or Gini Index in North Edwards?
Inequality or Gini Index in North Edwards is 0.47.
What is the Total Population of North Edwards?
Total Population of North Edwards is 1,086.
What is the Total Male Population of North Edwards?
Total Male Population of North Edwards is 670.
What is the Total Female Population of North Edwards?
Total Female Population of North Edwards is 416.
What is the Ratio of Males per 100 Females in North Edwards?
There are 161.06 Males per 100 Females in North Edwards.
What is the Ratio of Females per 100 Males in North Edwards?
There are 62.09 Females per 100 Males in North Edwards.
What is the Median Population Age in North Edwards?
Median Population Age in North Edwards is 28.4 Years.
What is the Average Family Size in North Edwards
Average Family Size in North Edwards is 3.2 People.
What is the Average Household Size in North Edwards
Average Household Size in North Edwards is 2.6 People.
How Large is the Labor Force in North Edwards?
There are 496 People in the Labor Forcein in North Edwards.
What is the Percentage of People in the Labor Force in North Edwards?
60.6% of People are in the Labor Force in North Edwards.
What is the Unemployment Rate in North Edwards?
Unemployment Rate in North Edwards is 12.1%.