Zip Codes with the Highest Percentage of Population with a Degree in Physical and Health Sciences in Danville, CA
RELATED REPORTS & OPTIONS
Physical and Health Sciences
Danville
Compare Zip Codes
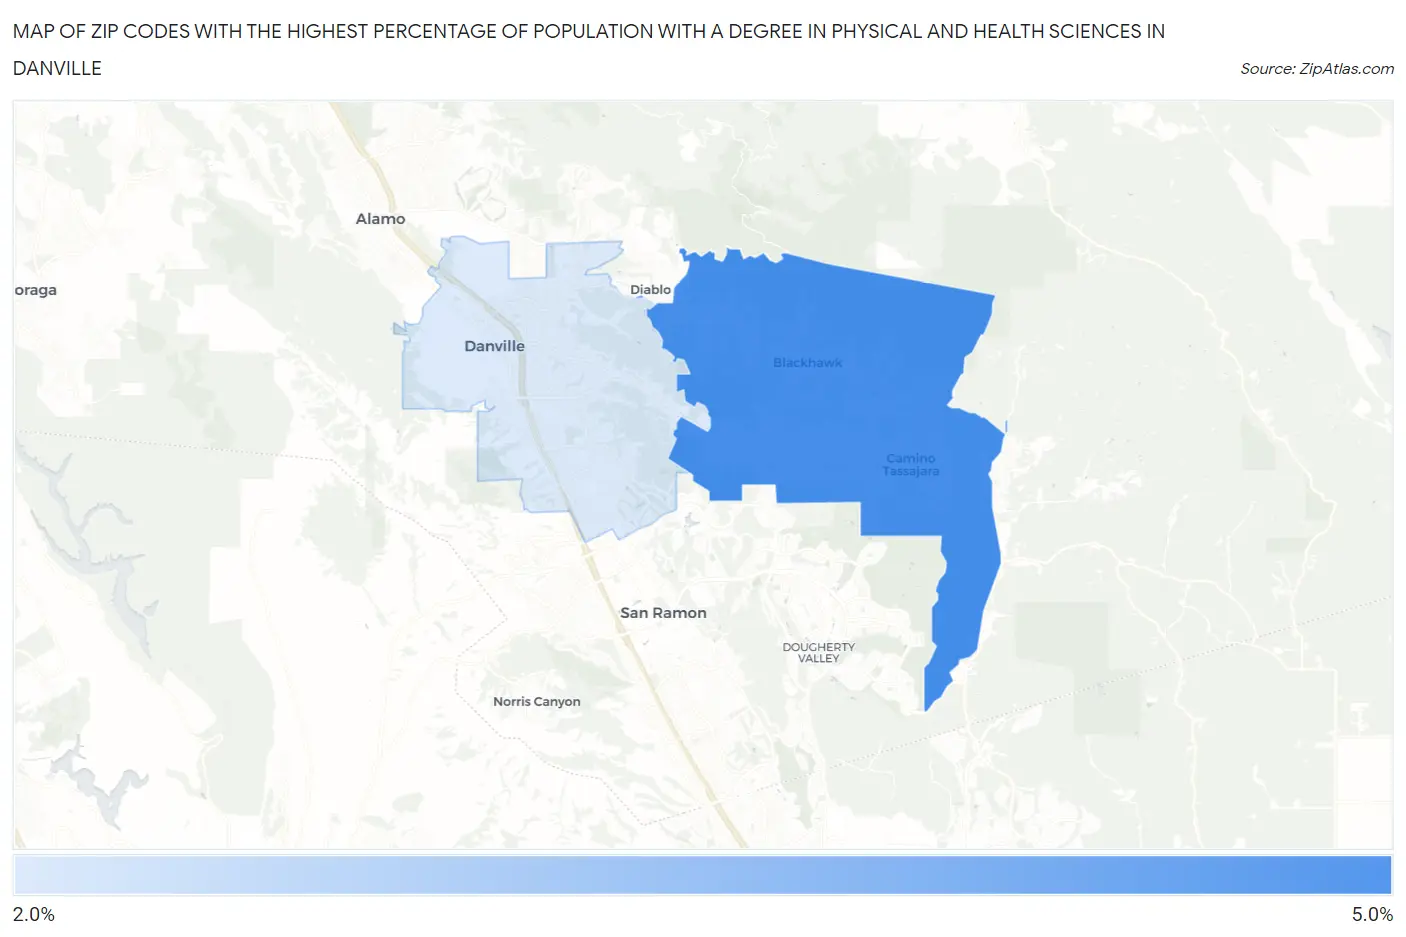
Map of Zip Codes with the Highest Percentage of Population with a Degree in Physical and Health Sciences in Danville
2.6%
4.4%
Zip Codes with the Highest Percentage of Population with a Degree in Physical and Health Sciences in Danville, CA
| Zip Code | % Graduates | vs State | vs National | |
| 1. | 94506 | 4.4% | 3.1%(+1.27)#293 | 3.1%(+1.29)#5,784 |
| 2. | 94526 | 2.6% | 3.1%(-0.469)#763 | 3.1%(-0.454)#12,028 |
1
Common Questions
What are the Top Zip Codes with the Highest Percentage of Population with a Degree in Physical and Health Sciences in Danville, CA?
Top Zip Codes with the Highest Percentage of Population with a Degree in Physical and Health Sciences in Danville, CA are:
What zip code has the Highest Percentage of Population with a Degree in Physical and Health Sciences in Danville, CA?
94506 has the Highest Percentage of Population with a Degree in Physical and Health Sciences in Danville, CA with 4.4%.
What is the Percentage of Population with a Degree in Physical and Health Sciences in Danville, CA?
Percentage of Population with a Degree in Physical and Health Sciences in Danville is 2.6%.
What is the Percentage of Population with a Degree in Physical and Health Sciences in California?
Percentage of Population with a Degree in Physical and Health Sciences in California is 3.1%.
What is the Percentage of Population with a Degree in Physical and Health Sciences in the United States?
Percentage of Population with a Degree in Physical and Health Sciences in the United States is 3.1%.