Matheny, CA Map & Demographics
Matheny Map
Matheny Overview
$24,365
PER CAPITA INCOME
$66,411
AVG FAMILY INCOME
$65,927
AVG HOUSEHOLD INCOME
36.1%
WAGE / INCOME GAP [ % ]
63.9¢/ $1
WAGE / INCOME GAP [ $ ]
0.44
INEQUALITY / GINI INDEX
766
TOTAL POPULATION
414
MALE POPULATION
352
FEMALE POPULATION
117.61
MALES / 100 FEMALES
85.02
FEMALES / 100 MALES
25.0
MEDIAN AGE
4.1
AVG FAMILY SIZE
3.7
AVG HOUSEHOLD SIZE
395
LABOR FORCE [ PEOPLE ]
68.5%
PERCENT IN LABOR FORCE
4.1%
UNEMPLOYMENT RATE
Income in Matheny
Income Overview in Matheny
Per Capita Income in Matheny is $24,365, while median incomes of families and households are $66,411 and $65,927 respectively.
| Characteristic | Number | Measure |
| Per Capita Income | 766 | $24,365 |
| Median Family Income | 181 | $66,411 |
| Mean Family Income | 181 | $88,962 |
| Median Household Income | 207 | $65,927 |
| Mean Household Income | 207 | $83,294 |
| Income Deficit | 181 | $0 |
| Wage / Income Gap (%) | 766 | 36.14% |
| Wage / Income Gap ($) | 766 | 63.86¢ per $1 |
| Gini / Inequality Index | 766 | 0.44 |
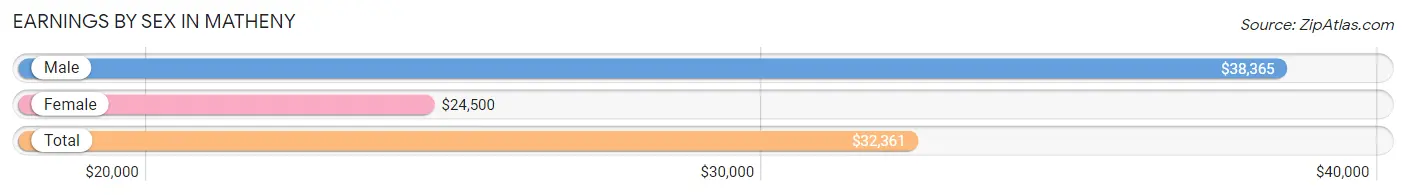
Earnings by Sex in Matheny
Average Earnings in Matheny are $32,361, $38,365 for men and $24,500 for women, a difference of 36.1%.
| Sex | Number | Average Earnings |
| Male | 215 (53.9%) | $38,365 |
| Female | 184 (46.1%) | $24,500 |
| Total | 399 (100.0%) | $32,361 |
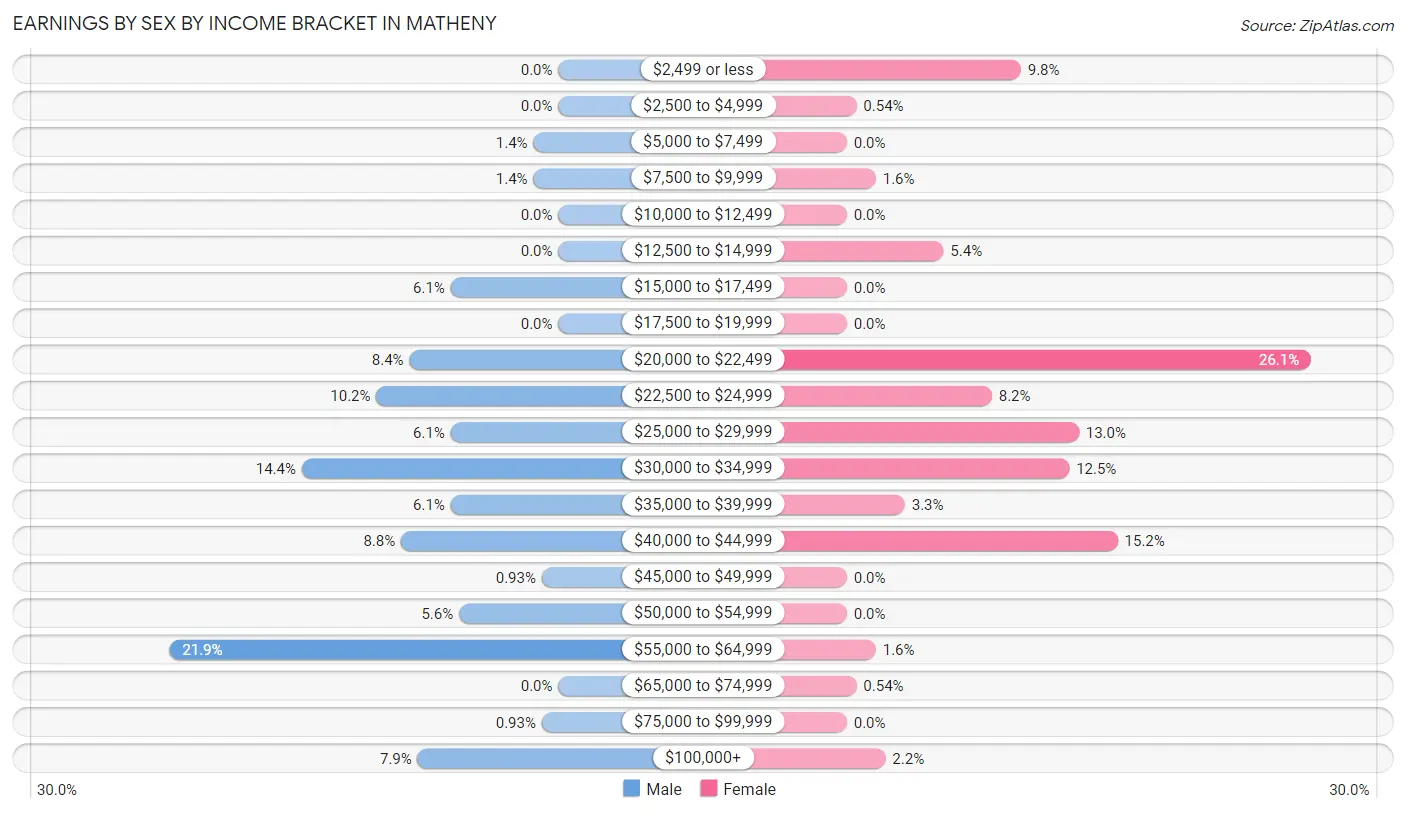
Earnings by Sex by Income Bracket in Matheny
The most common earnings brackets in Matheny are $55,000 to $64,999 for men (47 | 21.9%) and $20,000 to $22,499 for women (48 | 26.1%).
| Income | Male | Female |
| $2,499 or less | 0 (0.0%) | 18 (9.8%) |
| $2,500 to $4,999 | 0 (0.0%) | 1 (0.5%) |
| $5,000 to $7,499 | 3 (1.4%) | 0 (0.0%) |
| $7,500 to $9,999 | 3 (1.4%) | 3 (1.6%) |
| $10,000 to $12,499 | 0 (0.0%) | 0 (0.0%) |
| $12,500 to $14,999 | 0 (0.0%) | 10 (5.4%) |
| $15,000 to $17,499 | 13 (6.0%) | 0 (0.0%) |
| $17,500 to $19,999 | 0 (0.0%) | 0 (0.0%) |
| $20,000 to $22,499 | 18 (8.4%) | 48 (26.1%) |
| $22,500 to $24,999 | 22 (10.2%) | 15 (8.2%) |
| $25,000 to $29,999 | 13 (6.0%) | 24 (13.0%) |
| $30,000 to $34,999 | 31 (14.4%) | 23 (12.5%) |
| $35,000 to $39,999 | 13 (6.0%) | 6 (3.3%) |
| $40,000 to $44,999 | 19 (8.8%) | 28 (15.2%) |
| $45,000 to $49,999 | 2 (0.9%) | 0 (0.0%) |
| $50,000 to $54,999 | 12 (5.6%) | 0 (0.0%) |
| $55,000 to $64,999 | 47 (21.9%) | 3 (1.6%) |
| $65,000 to $74,999 | 0 (0.0%) | 1 (0.5%) |
| $75,000 to $99,999 | 2 (0.9%) | 0 (0.0%) |
| $100,000+ | 17 (7.9%) | 4 (2.2%) |
| Total | 215 (100.0%) | 184 (100.0%) |
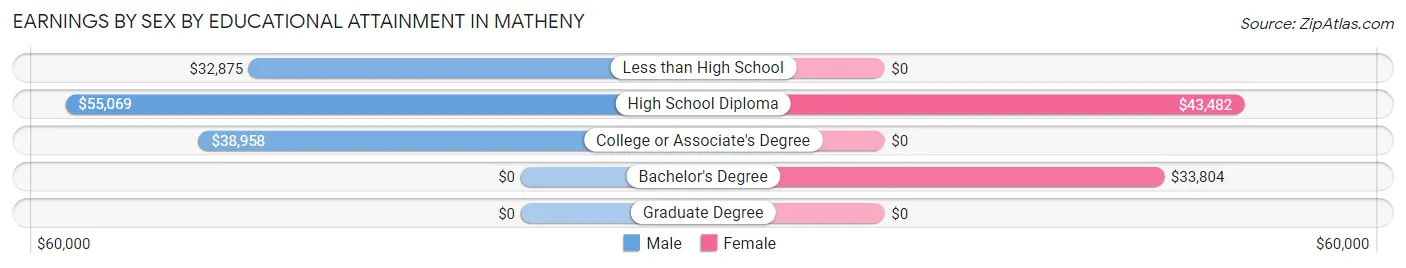
Earnings by Sex by Educational Attainment in Matheny
Average earnings in Matheny are $42,955 for men and $34,783 for women, a difference of 19.0%. Men with an educational attainment of high school diploma enjoy the highest average annual earnings of $55,069, while those with less than high school education earn the least with $32,875. Women with an educational attainment of high school diploma earn the most with the average annual earnings of $43,482, while those with bachelor's degree education have the smallest earnings of $33,804.
| Educational Attainment | Male Income | Female Income |
| Less than High School | $32,875 | $0 |
| High School Diploma | $55,069 | $43,482 |
| College or Associate's Degree | $38,958 | $0 |
| Bachelor's Degree | - | - |
| Graduate Degree | - | - |
| Total | $42,955 | $34,783 |
Family Income in Matheny
Family Income Brackets in Matheny
According to the Matheny family income data, there are 47 families falling into the $50,000 to $74,999 income range, which is the most common income bracket and makes up 26.0% of all families. Conversely, the $10,000 to $14,999 income bracket is the least frequent group with only 2 families (1.1%) belonging to this category.
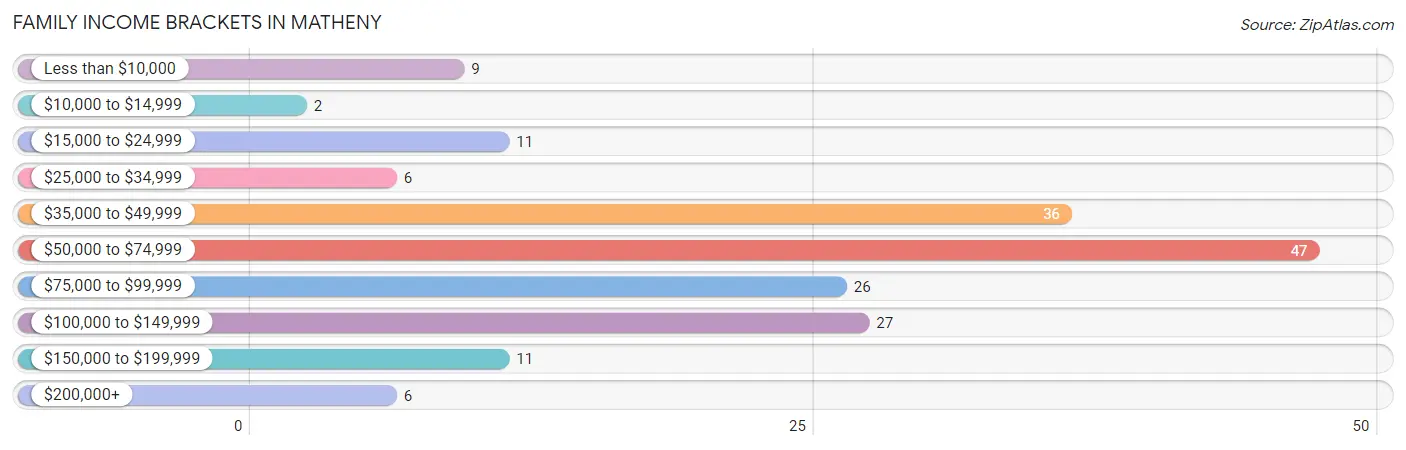
| Income Bracket | # Families | % Families |
| Less than $10,000 | 9 | 5.0% |
| $10,000 to $14,999 | 2 | 1.1% |
| $15,000 to $24,999 | 11 | 6.1% |
| $25,000 to $34,999 | 6 | 3.3% |
| $35,000 to $49,999 | 36 | 19.9% |
| $50,000 to $74,999 | 47 | 26.0% |
| $75,000 to $99,999 | 26 | 14.4% |
| $100,000 to $149,999 | 27 | 14.9% |
| $150,000 to $199,999 | 11 | 6.1% |
| $200,000+ | 6 | 3.3% |
Family Income by Famaliy Size in Matheny
5-person families (42 | 23.2%) account for the highest median family income in Matheny with $132,955 per family, while 2-person families (56 | 30.9%) have the highest median income of $30,625 per family member.
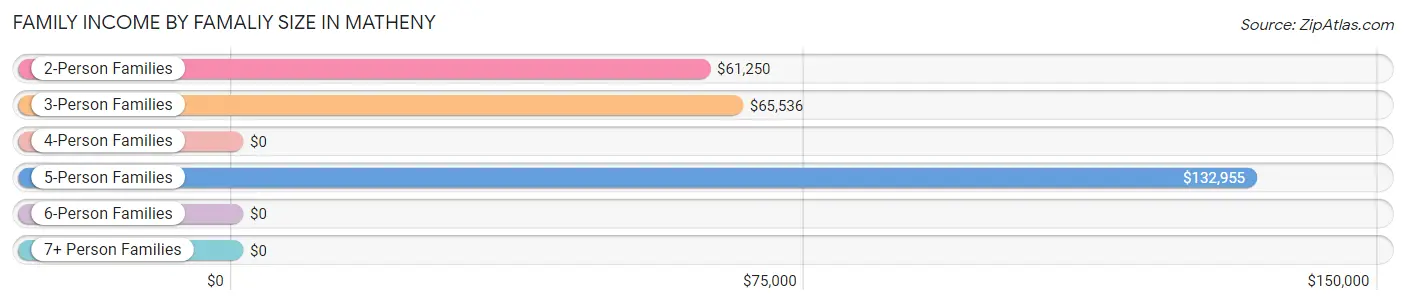
| Income Bracket | # Families | Median Income |
| 2-Person Families | 56 (30.9%) | $61,250 |
| 3-Person Families | 44 (24.3%) | $65,536 |
| 4-Person Families | 17 (9.4%) | $0 |
| 5-Person Families | 42 (23.2%) | $132,955 |
| 6-Person Families | 19 (10.5%) | $0 |
| 7+ Person Families | 3 (1.7%) | $0 |
| Total | 181 (100.0%) | $66,411 |
Family Income by Number of Earners in Matheny
The median family income in Matheny is $66,411, with families comprising 3+ earners (28) having the highest median family income of $147,500, while families with no earners (14) have the lowest median family income of $2,499, accounting for 15.5% and 7.7% of families, respectively.
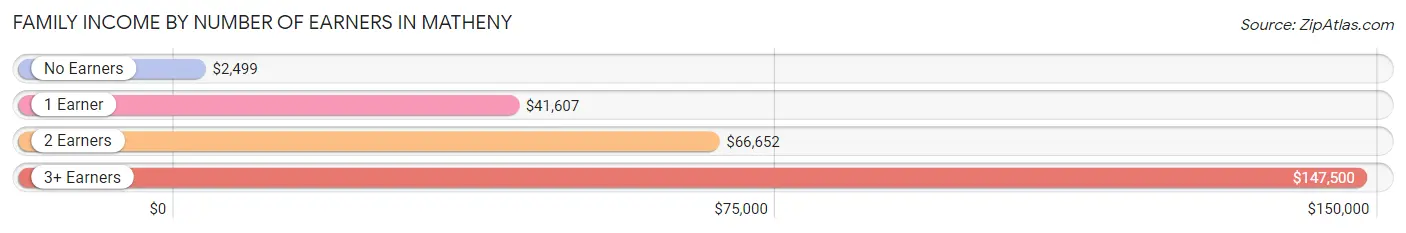
| Number of Earners | # Families | Median Income |
| No Earners | 14 (7.7%) | $2,499 |
| 1 Earner | 46 (25.4%) | $41,607 |
| 2 Earners | 93 (51.4%) | $66,652 |
| 3+ Earners | 28 (15.5%) | $147,500 |
| Total | 181 (100.0%) | $66,411 |
Household Income in Matheny
Household Income Brackets in Matheny
With 49 households falling in the category, the $50,000 to $74,999 income range is the most frequent in Matheny, accounting for 23.7% of all households. In contrast, only 2 households (1.0%) fall into the $10,000 to $14,999 income bracket, making it the least populous group.
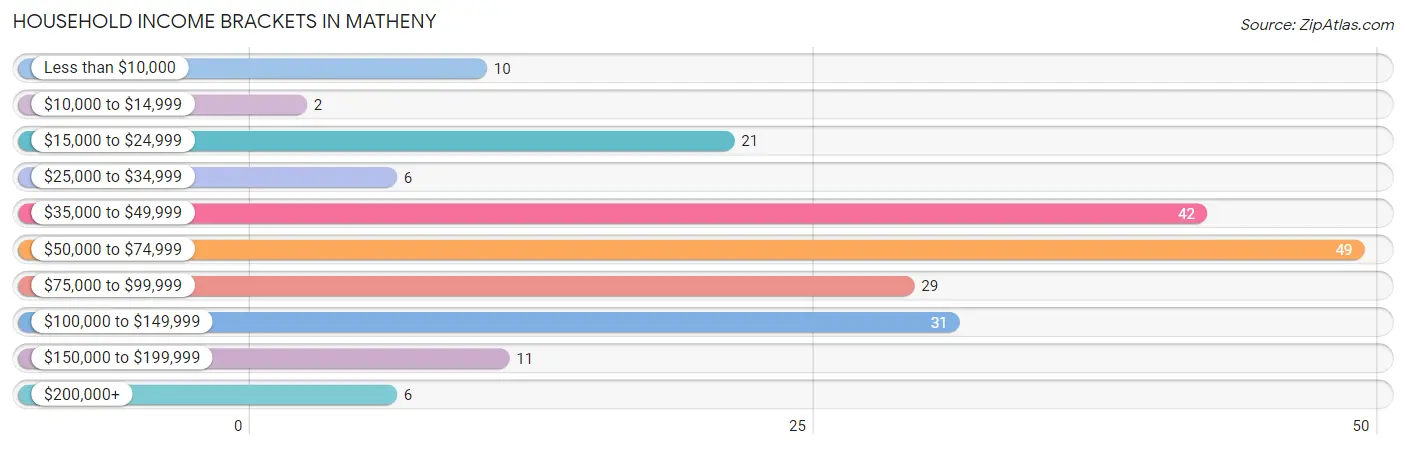
| Income Bracket | # Households | % Households |
| Less than $10,000 | 10 | 4.8% |
| $10,000 to $14,999 | 2 | 1.0% |
| $15,000 to $24,999 | 21 | 10.1% |
| $25,000 to $34,999 | 6 | 2.9% |
| $35,000 to $49,999 | 42 | 20.3% |
| $50,000 to $74,999 | 49 | 23.7% |
| $75,000 to $99,999 | 29 | 14.0% |
| $100,000 to $149,999 | 31 | 15.0% |
| $150,000 to $199,999 | 11 | 5.3% |
| $200,000+ | 6 | 2.9% |
Household Income by Householder Age in Matheny
The median household income in Matheny is $65,927, with the highest median household income of $65,766 found in the 45 to 64 years age bracket for the primary householder. A total of 113 households (54.6%) fall into this category. Meanwhile, the 15 to 24 years age bracket for the primary householder has the lowest median household income of $0, with 21 households (10.1%) in this group.
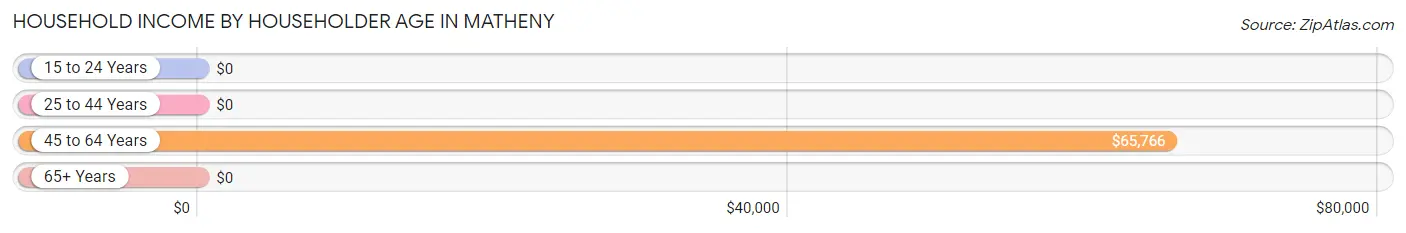
| Income Bracket | # Households | Median Income |
| 15 to 24 Years | 21 (10.1%) | $0 |
| 25 to 44 Years | 46 (22.2%) | $0 |
| 45 to 64 Years | 113 (54.6%) | $65,766 |
| 65+ Years | 27 (13.0%) | $0 |
| Total | 207 (100.0%) | $65,927 |
Poverty in Matheny
Income Below Poverty by Sex and Age in Matheny
With 10.1% poverty level for males and 9.9% for females among the residents of Matheny, 65 to 74 year old males and 12 to 14 year old females are the most vulnerable to poverty, with 5 males (71.4%) and 7 females (36.8%) in their respective age groups living below the poverty level.
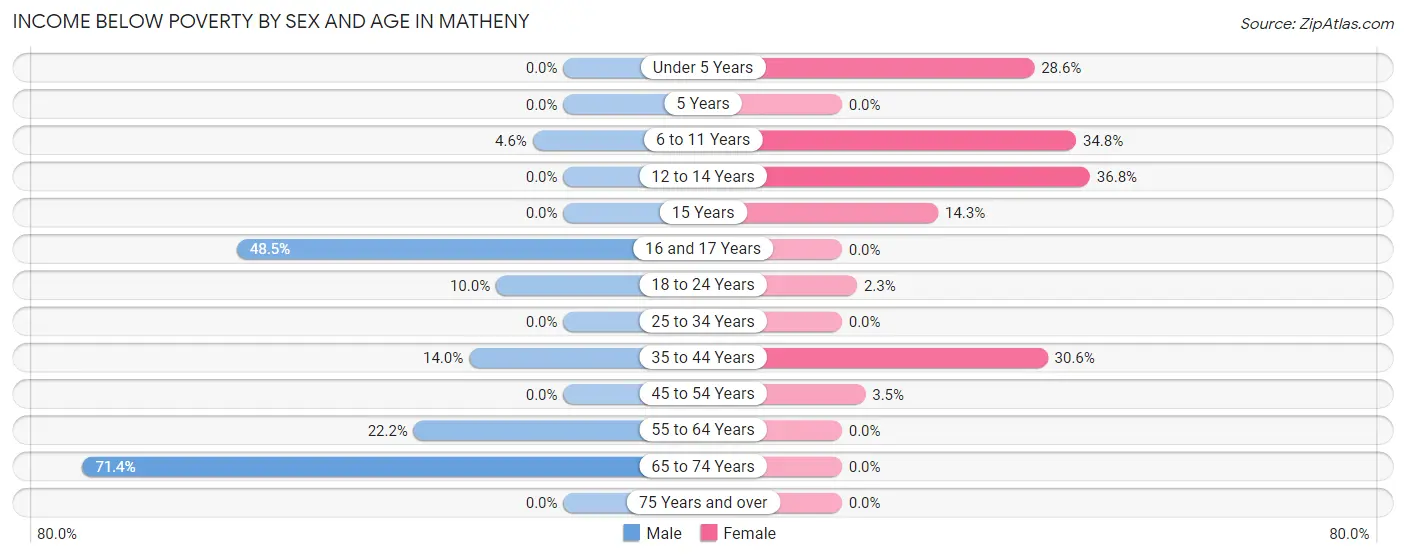
| Age Bracket | Male | Female |
| Under 5 Years | 0 (0.0%) | 2 (28.6%) |
| 5 Years | 0 (0.0%) | 0 (0.0%) |
| 6 to 11 Years | 2 (4.5%) | 8 (34.8%) |
| 12 to 14 Years | 0 (0.0%) | 7 (36.8%) |
| 15 Years | 0 (0.0%) | 2 (14.3%) |
| 16 and 17 Years | 16 (48.5%) | 0 (0.0%) |
| 18 to 24 Years | 6 (10.0%) | 2 (2.2%) |
| 25 to 34 Years | 0 (0.0%) | 0 (0.0%) |
| 35 to 44 Years | 7 (14.0%) | 11 (30.6%) |
| 45 to 54 Years | 0 (0.0%) | 3 (3.5%) |
| 55 to 64 Years | 6 (22.2%) | 0 (0.0%) |
| 65 to 74 Years | 5 (71.4%) | 0 (0.0%) |
| 75 Years and over | 0 (0.0%) | 0 (0.0%) |
| Total | 42 (10.1%) | 35 (9.9%) |
Income Above Poverty by Sex and Age in Matheny
According to the poverty statistics in Matheny, males aged under 5 years and females aged 16 and 17 years are the age groups that are most secure financially, with 100.0% of males and 100.0% of females in these age groups living above the poverty line.
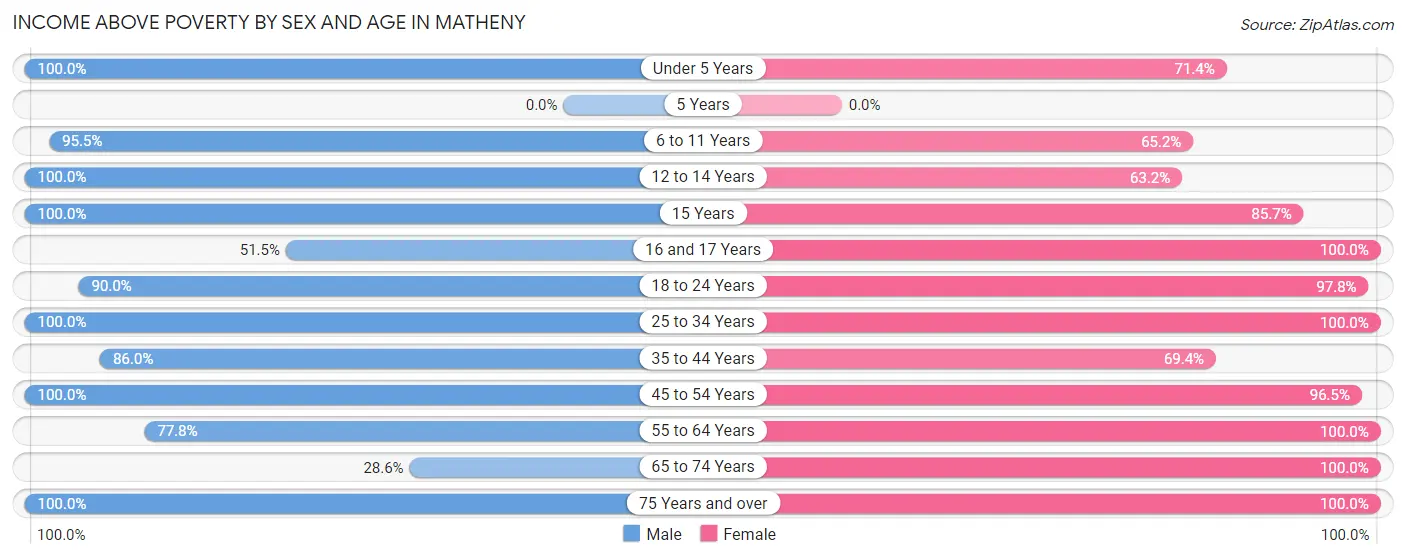
| Age Bracket | Male | Female |
| Under 5 Years | 57 (100.0%) | 5 (71.4%) |
| 5 Years | 0 (0.0%) | 0 (0.0%) |
| 6 to 11 Years | 42 (95.5%) | 15 (65.2%) |
| 12 to 14 Years | 17 (100.0%) | 12 (63.2%) |
| 15 Years | 8 (100.0%) | 12 (85.7%) |
| 16 and 17 Years | 17 (51.5%) | 14 (100.0%) |
| 18 to 24 Years | 54 (90.0%) | 87 (97.8%) |
| 25 to 34 Years | 58 (100.0%) | 22 (100.0%) |
| 35 to 44 Years | 43 (86.0%) | 25 (69.4%) |
| 45 to 54 Years | 37 (100.0%) | 83 (96.5%) |
| 55 to 64 Years | 21 (77.8%) | 19 (100.0%) |
| 65 to 74 Years | 2 (28.6%) | 9 (100.0%) |
| 75 Years and over | 16 (100.0%) | 14 (100.0%) |
| Total | 372 (89.9%) | 317 (90.1%) |
Income Below Poverty Among Married-Couple Families in Matheny
The poverty statistics for married-couple families in Matheny show that 6.9% or 7 of the total 101 families live below the poverty line. Families with 3 or 4 children have the highest poverty rate of 30.4%, comprising of 7 families. On the other hand, families with no children have the lowest poverty rate of 0.0%, which includes 0 families.
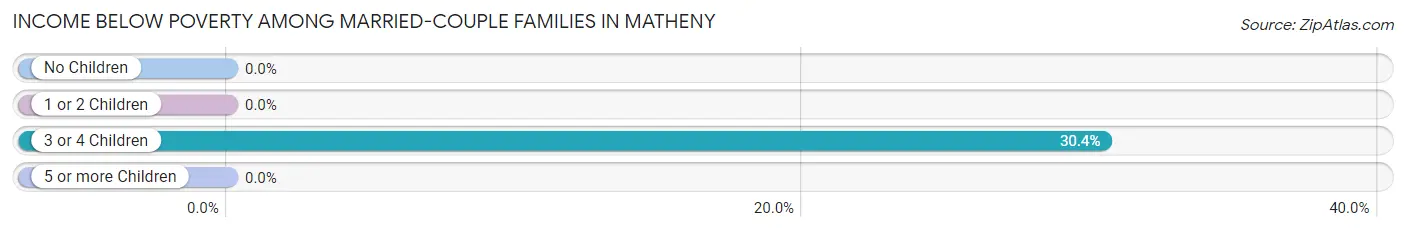
| Children | Above Poverty | Below Poverty |
| No Children | 30 (100.0%) | 0 (0.0%) |
| 1 or 2 Children | 48 (100.0%) | 0 (0.0%) |
| 3 or 4 Children | 16 (69.6%) | 7 (30.4%) |
| 5 or more Children | 0 (0.0%) | 0 (0.0%) |
| Total | 94 (93.1%) | 7 (6.9%) |
Income Below Poverty Among Single-Parent Households in Matheny
According to the poverty data in Matheny, 33.3% or 5 single-father households and 3.1% or 2 single-mother households are living below the poverty line. Among single-father households, those with no children have the highest poverty rate, with 5 households (33.3%) experiencing poverty. Likewise, among single-mother households, those with 3 or 4 children have the highest poverty rate, with 2 households (100.0%) falling below the poverty line.
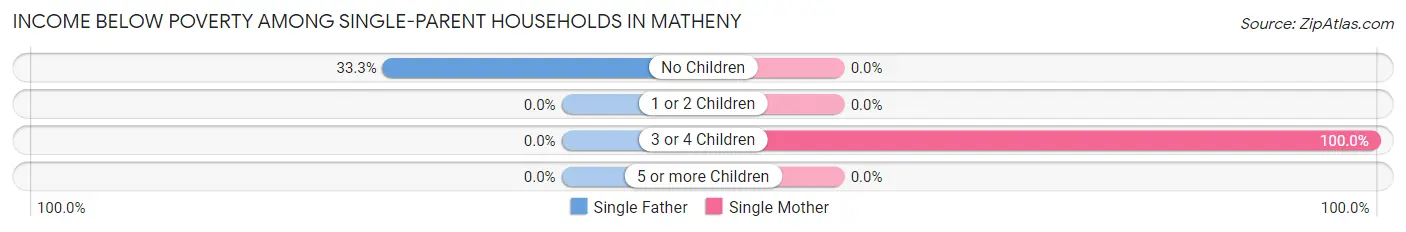
| Children | Single Father | Single Mother |
| No Children | 5 (33.3%) | 0 (0.0%) |
| 1 or 2 Children | 0 (0.0%) | 0 (0.0%) |
| 3 or 4 Children | 0 (0.0%) | 2 (100.0%) |
| 5 or more Children | 0 (0.0%) | 0 (0.0%) |
| Total | 5 (33.3%) | 2 (3.1%) |
Income Below Poverty Among Married-Couple vs Single-Parent Households in Matheny
The poverty data for Matheny shows that 7 of the married-couple family households (6.9%) and 7 of the single-parent households (8.7%) are living below the poverty level. Within the married-couple family households, those with 3 or 4 children have the highest poverty rate, with 7 households (30.4%) falling below the poverty line. Among the single-parent households, those with 3 or 4 children have the highest poverty rate, with 2 household (100.0%) living below poverty.
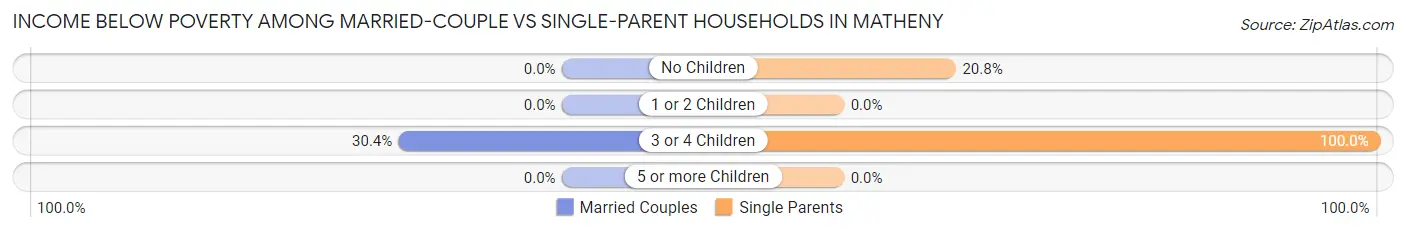
| Children | Married-Couple Families | Single-Parent Households |
| No Children | 0 (0.0%) | 5 (20.8%) |
| 1 or 2 Children | 0 (0.0%) | 0 (0.0%) |
| 3 or 4 Children | 7 (30.4%) | 2 (100.0%) |
| 5 or more Children | 0 (0.0%) | 0 (0.0%) |
| Total | 7 (6.9%) | 7 (8.7%) |
Race in Matheny
The most populous races in Matheny are Hispanic or Latino (689 | 89.9%), Some other Race (366 | 47.8%), and White / Caucasian (268 | 35.0%).
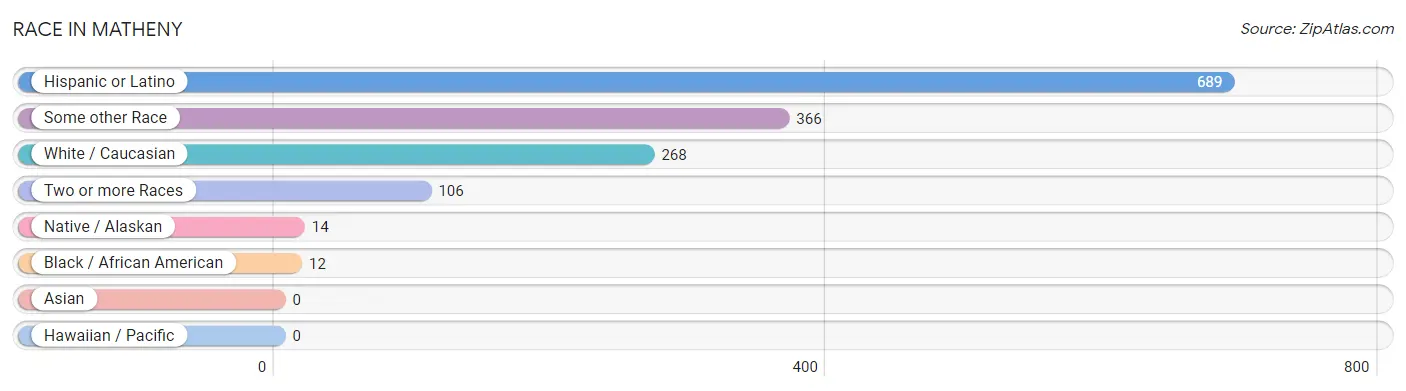
| Race | # Population | % Population |
| Asian | 0 | 0.0% |
| Black / African American | 12 | 1.6% |
| Hawaiian / Pacific | 0 | 0.0% |
| Hispanic or Latino | 689 | 89.9% |
| Native / Alaskan | 14 | 1.8% |
| White / Caucasian | 268 | 35.0% |
| Two or more Races | 106 | 13.8% |
| Some other Race | 366 | 47.8% |
| Total | 766 | 100.0% |
Ancestry in Matheny
The most populous ancestries reported in Matheny are Mexican (674 | 88.0%), Irish (9 | 1.2%), German (8 | 1.0%), Italian (8 | 1.0%), and Portuguese (5 | 0.6%), together accounting for 91.9% of all Matheny residents.
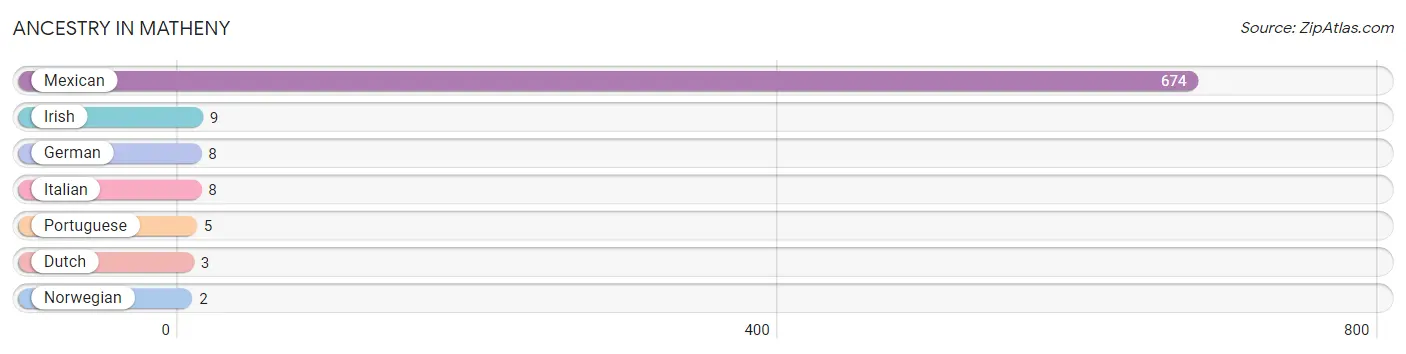
| Ancestry | # Population | % Population |
| Dutch | 3 | 0.4% |
| German | 8 | 1.0% |
| Irish | 9 | 1.2% |
| Italian | 8 | 1.0% |
| Mexican | 674 | 88.0% |
| Norwegian | 2 | 0.3% |
| Portuguese | 5 | 0.6% | View All 7 Rows |
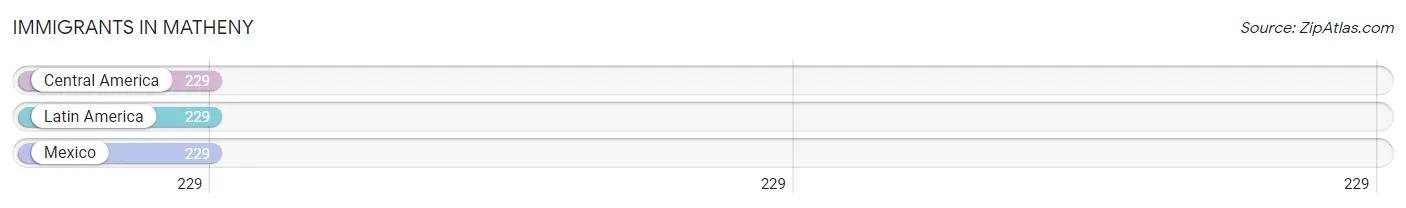
Immigrants in Matheny
The most numerous immigrant groups reported in Matheny came from Central America (229 | 29.9%), Latin America (229 | 29.9%), and Mexico (229 | 29.9%), together accounting for 89.7% of all Matheny residents.
| Immigration Origin | # Population | % Population |
| Central America | 229 | 29.9% |
| Latin America | 229 | 29.9% |
| Mexico | 229 | 29.9% | View All 3 Rows |
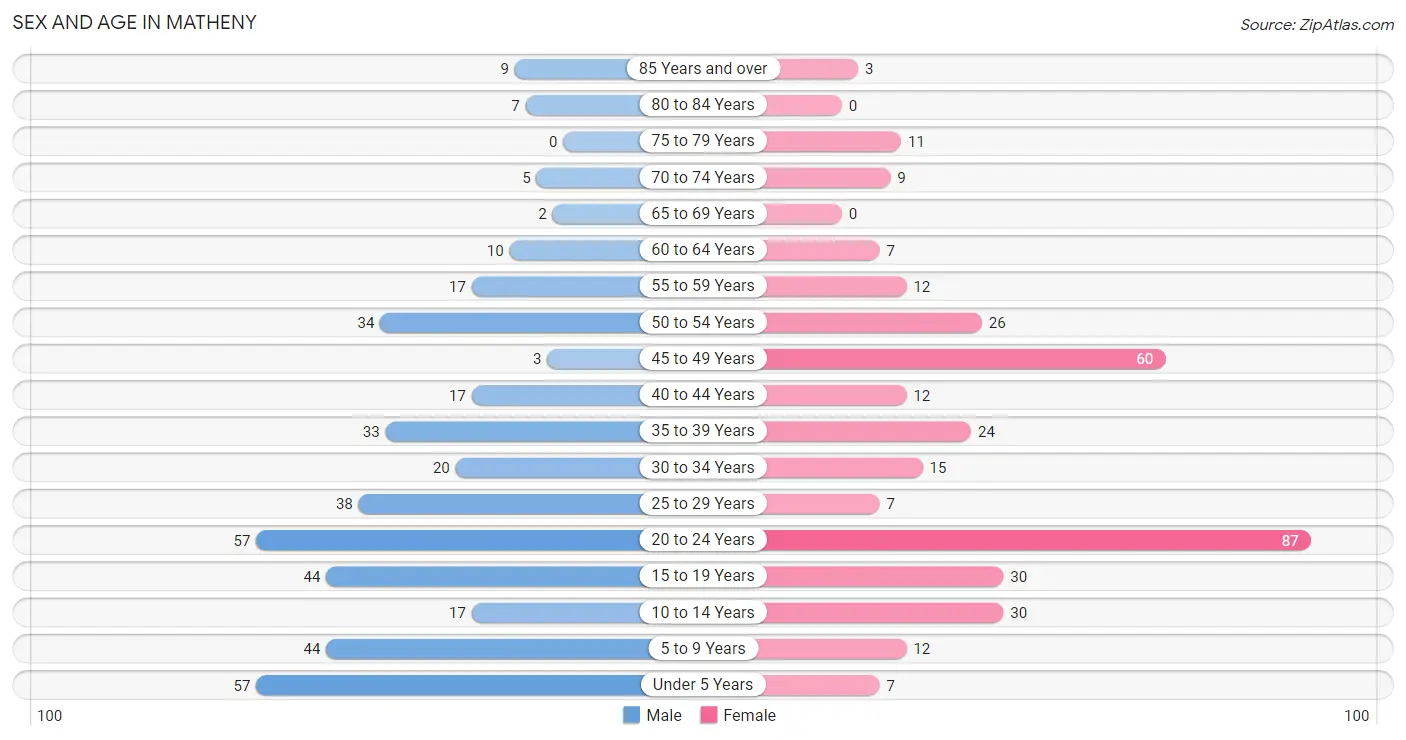
Sex and Age in Matheny
Sex and Age in Matheny
The most populous age groups in Matheny are Under 5 Years (57 | 13.8%) for men and 20 to 24 Years (87 | 24.7%) for women.
| Age Bracket | Male | Female |
| Under 5 Years | 57 (13.8%) | 7 (2.0%) |
| 5 to 9 Years | 44 (10.6%) | 12 (3.4%) |
| 10 to 14 Years | 17 (4.1%) | 30 (8.5%) |
| 15 to 19 Years | 44 (10.6%) | 30 (8.5%) |
| 20 to 24 Years | 57 (13.8%) | 87 (24.7%) |
| 25 to 29 Years | 38 (9.2%) | 7 (2.0%) |
| 30 to 34 Years | 20 (4.8%) | 15 (4.3%) |
| 35 to 39 Years | 33 (8.0%) | 24 (6.8%) |
| 40 to 44 Years | 17 (4.1%) | 12 (3.4%) |
| 45 to 49 Years | 3 (0.7%) | 60 (17.1%) |
| 50 to 54 Years | 34 (8.2%) | 26 (7.4%) |
| 55 to 59 Years | 17 (4.1%) | 12 (3.4%) |
| 60 to 64 Years | 10 (2.4%) | 7 (2.0%) |
| 65 to 69 Years | 2 (0.5%) | 0 (0.0%) |
| 70 to 74 Years | 5 (1.2%) | 9 (2.6%) |
| 75 to 79 Years | 0 (0.0%) | 11 (3.1%) |
| 80 to 84 Years | 7 (1.7%) | 0 (0.0%) |
| 85 Years and over | 9 (2.2%) | 3 (0.9%) |
| Total | 414 (100.0%) | 352 (100.0%) |
Families and Households in Matheny
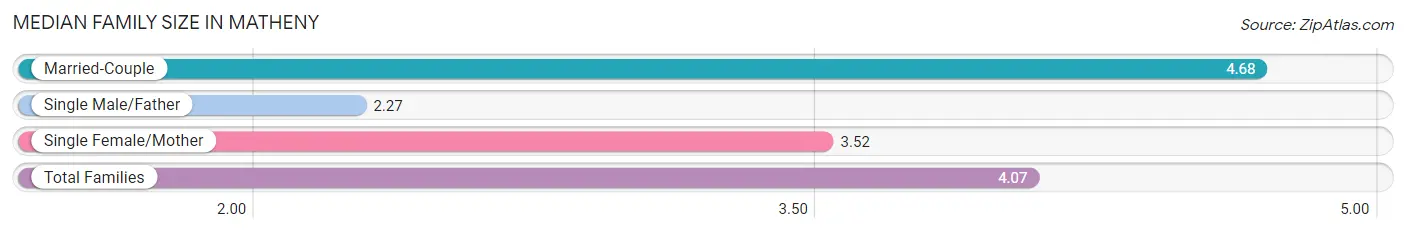
Median Family Size in Matheny
The median family size in Matheny is 4.07 persons per family, with married-couple families (101 | 55.8%) accounting for the largest median family size of 4.68 persons per family. On the other hand, single male/father families (15 | 8.3%) represent the smallest median family size with 2.27 persons per family.
| Family Type | # Families | Family Size |
| Married-Couple | 101 (55.8%) | 4.68 |
| Single Male/Father | 15 (8.3%) | 2.27 |
| Single Female/Mother | 65 (35.9%) | 3.52 |
| Total Families | 181 (100.0%) | 4.07 |
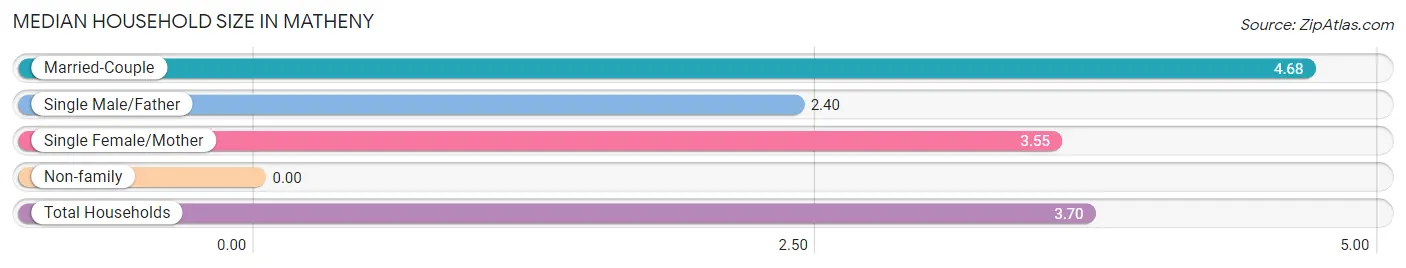
Median Household Size in Matheny
| Household Type | # Households | Household Size |
| Married-Couple | 101 (48.8%) | 4.68 |
| Single Male/Father | 15 (7.2%) | 2.40 |
| Single Female/Mother | 65 (31.4%) | 3.55 |
| Non-family | 26 (12.6%) | - |
| Total Households | 207 (100.0%) | 3.70 |
Household Size by Marriage Status in Matheny
Out of a total of 207 households in Matheny, 181 (87.4%) are family households, while 26 (12.6%) are nonfamily households. The most numerous type of family households are 2-person households, comprising 56, and the most common type of nonfamily households are 1-person households, comprising 26.
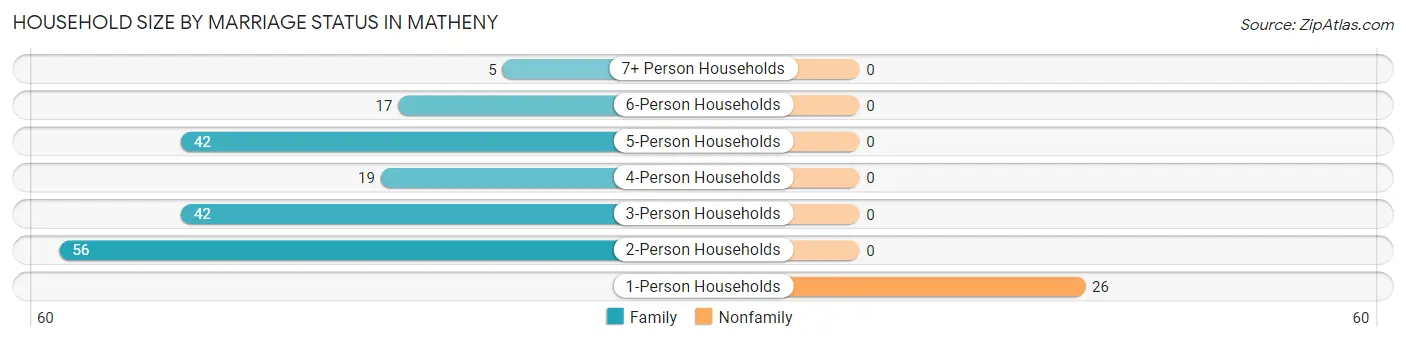
| Household Size | Family Households | Nonfamily Households |
| 1-Person Households | - | 26 (12.6%) |
| 2-Person Households | 56 (27.1%) | 0 (0.0%) |
| 3-Person Households | 42 (20.3%) | 0 (0.0%) |
| 4-Person Households | 19 (9.2%) | 0 (0.0%) |
| 5-Person Households | 42 (20.3%) | 0 (0.0%) |
| 6-Person Households | 17 (8.2%) | 0 (0.0%) |
| 7+ Person Households | 5 (2.4%) | 0 (0.0%) |
| Total | 181 (87.4%) | 26 (12.6%) |
Female Fertility in Matheny
Fertility by Age in Matheny
Average fertility rate in Matheny is 217.0 births per 1,000 women. Women in the age bracket of 20 to 34 years have the highest fertility rate with 367.0 births per 1,000 women. Women in the age bracket of 20 to 34 years acount for 78.4% of all women with births.
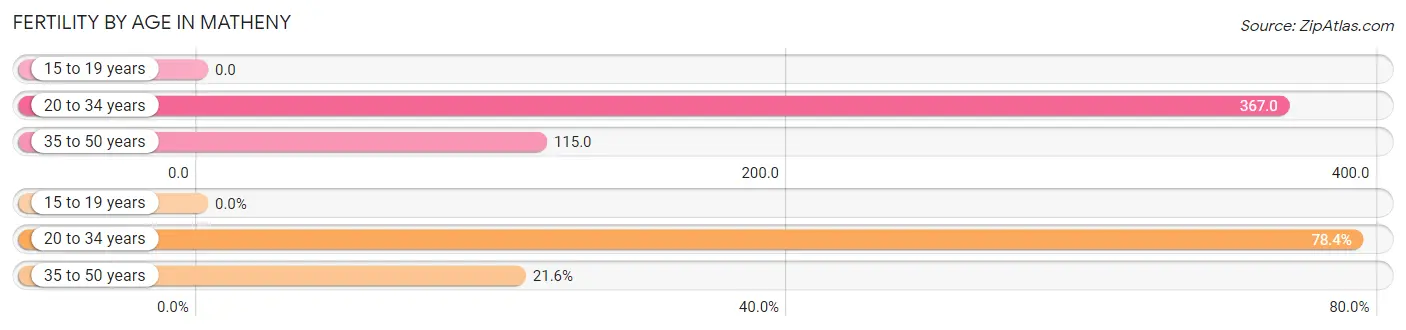
| Age Bracket | Women with Births | Births / 1,000 Women |
| 15 to 19 years | 0 (0.0%) | 0.0 |
| 20 to 34 years | 40 (78.4%) | 367.0 |
| 35 to 50 years | 11 (21.6%) | 115.0 |
| Total | 51 (100.0%) | 217.0 |
Fertility by Age by Marriage Status in Matheny
21.6% of women with births (51) in Matheny are married. The highest percentage of unmarried women with births falls into 20 to 34 years age bracket with 100.0% of them unmarried at the time of birth, while the lowest percentage of unmarried women with births belong to 35 to 50 years age bracket with 0.0% of them unmarried.
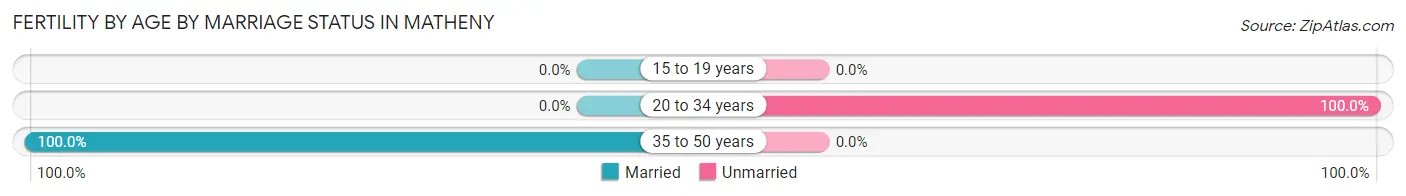
| Age Bracket | Married | Unmarried |
| 15 to 19 years | 0 (0.0%) | 0 (0.0%) |
| 20 to 34 years | 0 (0.0%) | 40 (100.0%) |
| 35 to 50 years | 11 (100.0%) | 0 (0.0%) |
| Total | 11 (21.6%) | 40 (78.4%) |
Fertility by Education in Matheny
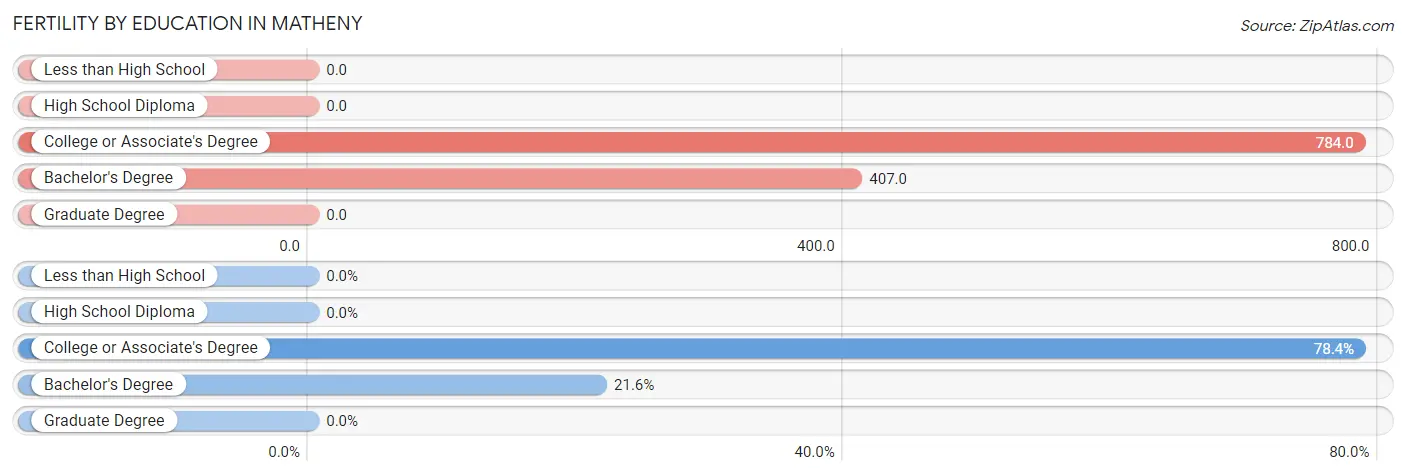
| Educational Attainment | Women with Births | Births / 1,000 Women |
| Less than High School | 0 (0.0%) | 0.0 |
| High School Diploma | 0 (0.0%) | 0.0 |
| College or Associate's Degree | 40 (78.4%) | 784.0 |
| Bachelor's Degree | 11 (21.6%) | 407.0 |
| Graduate Degree | 0 (0.0%) | 0.0 |
| Total | 51 (100.0%) | 217.0 |
Fertility by Education by Marriage Status in Matheny
78.4% of women with births in Matheny are unmarried. Women with the educational attainment of bachelor's degree are most likely to be married with 100.0% of them married at childbirth, while women with the educational attainment of college or associate's degree are least likely to be married with 100.0% of them unmarried at childbirth.
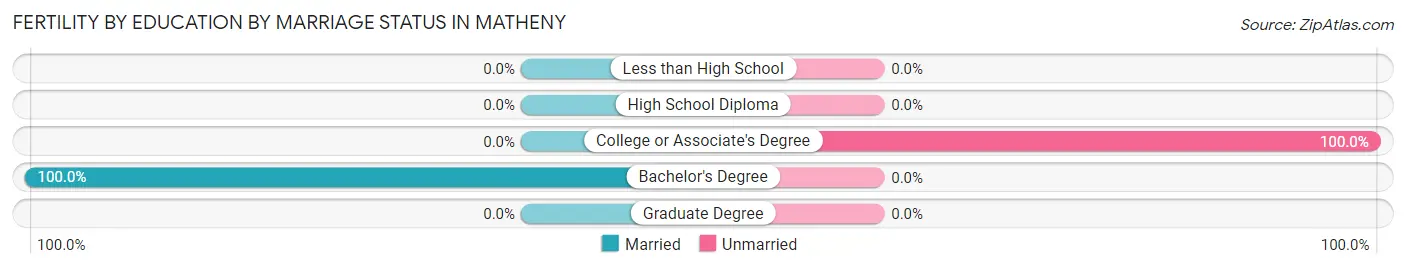
| Educational Attainment | Married | Unmarried |
| Less than High School | 0 (0.0%) | 0 (0.0%) |
| High School Diploma | 0 (0.0%) | 0 (0.0%) |
| College or Associate's Degree | 0 (0.0%) | 40 (100.0%) |
| Bachelor's Degree | 11 (100.0%) | 0 (0.0%) |
| Graduate Degree | 0 (0.0%) | 0 (0.0%) |
| Total | 11 (21.6%) | 40 (78.4%) |
Employment Characteristics in Matheny
Employment by Class of Employer in Matheny
Among the 331 employed individuals in Matheny, private company employees (265 | 80.1%), local government employees (38 | 11.5%), and self-employed (not incorporated) (14 | 4.2%) make up the most common classes of employment.
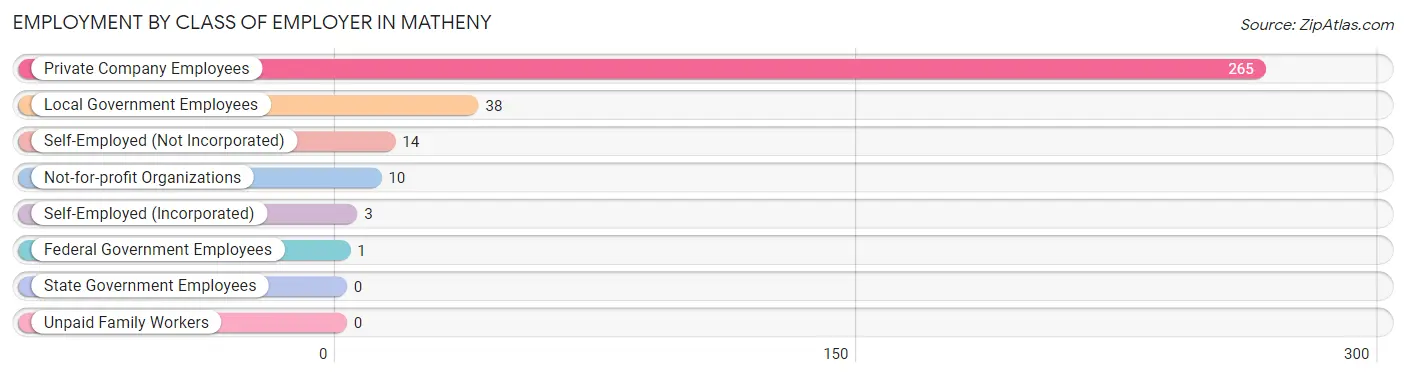
| Employer Class | # Employees | % Employees |
| Private Company Employees | 265 | 80.1% |
| Self-Employed (Incorporated) | 3 | 0.9% |
| Self-Employed (Not Incorporated) | 14 | 4.2% |
| Not-for-profit Organizations | 10 | 3.0% |
| Local Government Employees | 38 | 11.5% |
| State Government Employees | 0 | 0.0% |
| Federal Government Employees | 1 | 0.3% |
| Unpaid Family Workers | 0 | 0.0% |
| Total | 331 | 100.0% |
Employment Status by Age in Matheny
According to the labor force statistics for Matheny, out of the total population over 16 years of age (577), 68.5% or 395 individuals are in the labor force, with 4.1% or 16 of them unemployed. The age group with the highest labor force participation rate is 30 to 34 years, with 100.0% or 35 individuals in the labor force. Within the labor force, the 55 to 59 years age range has the highest percentage of unemployed individuals, with 15.0% or 3 of them being unemployed.
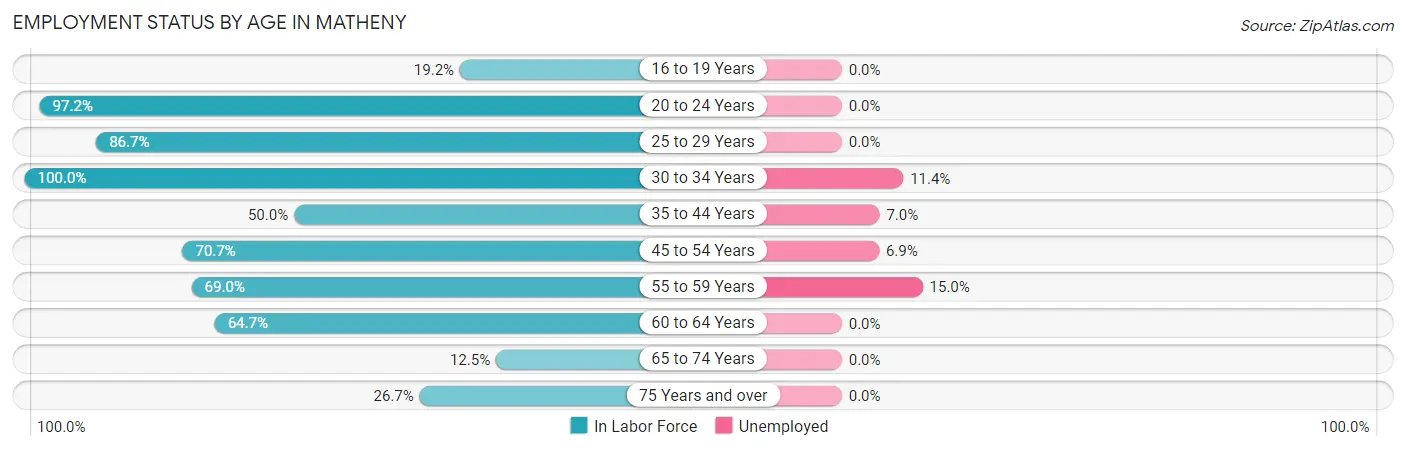
| Age Bracket | In Labor Force | Unemployed |
| 16 to 19 Years | 10 (19.2%) | 0 (0.0%) |
| 20 to 24 Years | 140 (97.2%) | 0 (0.0%) |
| 25 to 29 Years | 39 (86.7%) | 0 (0.0%) |
| 30 to 34 Years | 35 (100.0%) | 4 (11.4%) |
| 35 to 44 Years | 43 (50.0%) | 3 (7.0%) |
| 45 to 54 Years | 87 (70.7%) | 6 (6.9%) |
| 55 to 59 Years | 20 (69.0%) | 3 (15.0%) |
| 60 to 64 Years | 11 (64.7%) | 0 (0.0%) |
| 65 to 74 Years | 2 (12.5%) | 0 (0.0%) |
| 75 Years and over | 8 (26.7%) | 0 (0.0%) |
| Total | 395 (68.5%) | 16 (4.1%) |
Employment Status by Educational Attainment in Matheny
According to labor force statistics for Matheny, 70.1% of individuals (235) out of the total population between 25 and 64 years of age (335) are in the labor force, with 6.8% or 16 of them being unemployed. The group with the highest labor force participation rate are those with the educational attainment of college / associate degree, with 100.0% or 59 individuals in the labor force. Within the labor force, individuals with high school diploma education have the highest percentage of unemployment, with 11.9% or 10 of them being unemployed.
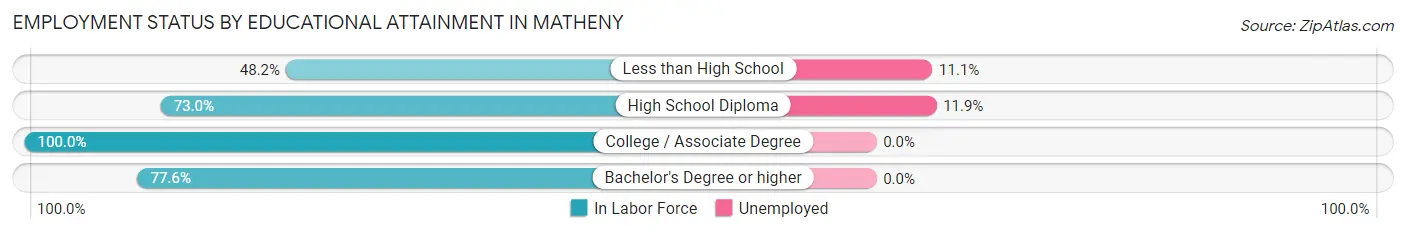
| Educational Attainment | In Labor Force | Unemployed |
| Less than High School | 54 (48.2%) | 12 (11.1%) |
| High School Diploma | 84 (73.0%) | 14 (11.9%) |
| College / Associate Degree | 59 (100.0%) | 0 (0.0%) |
| Bachelor's Degree or higher | 38 (77.6%) | 0 (0.0%) |
| Total | 235 (70.1%) | 23 (6.8%) |
Employment Occupations by Sex in Matheny
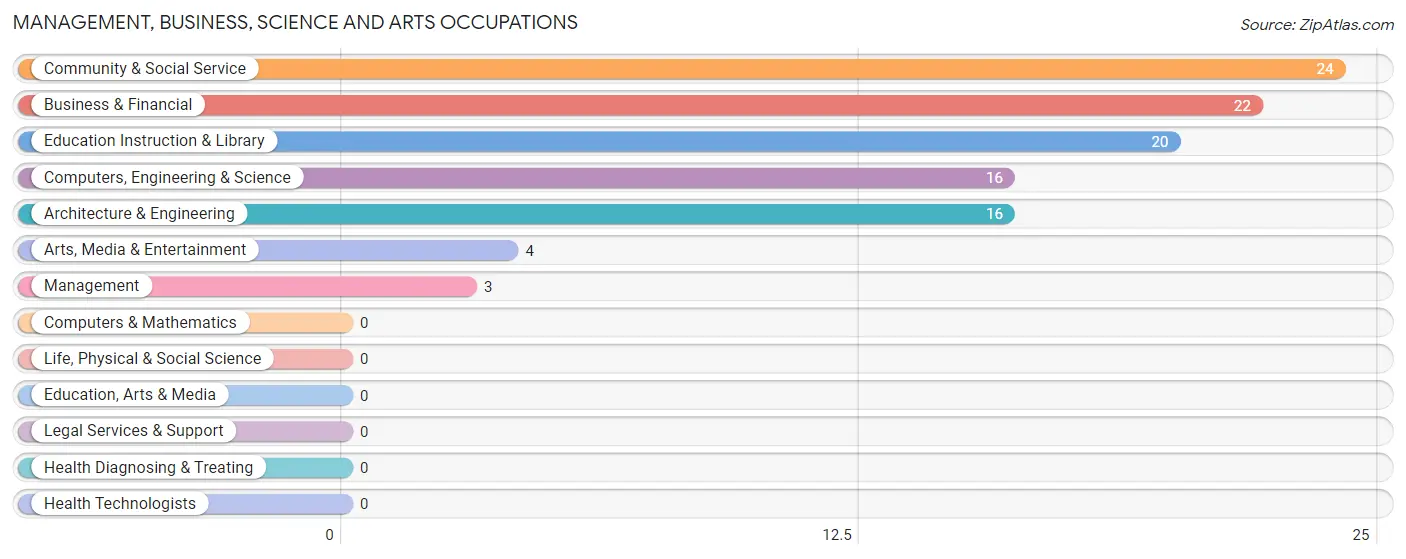
Management, Business, Science and Arts Occupations
The most common Management, Business, Science and Arts occupations in Matheny are Community & Social Service (24 | 6.3%), Business & Financial (22 | 5.8%), Education Instruction & Library (20 | 5.3%), Computers, Engineering & Science (16 | 4.2%), and Architecture & Engineering (16 | 4.2%).
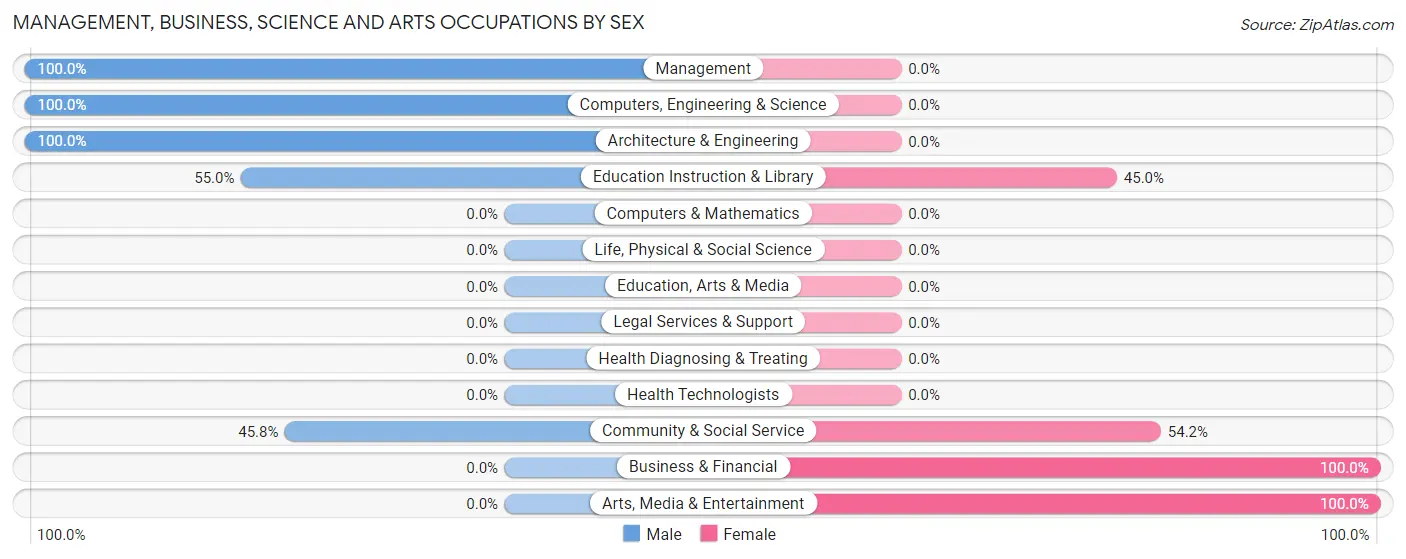
Management, Business, Science and Arts Occupations by Sex
Within the Management, Business, Science and Arts occupations in Matheny, the most male-oriented occupations are Management (100.0%), Computers, Engineering & Science (100.0%), and Architecture & Engineering (100.0%), while the most female-oriented occupations are Business & Financial (100.0%), Arts, Media & Entertainment (100.0%), and Community & Social Service (54.2%).
| Occupation | Male | Female |
| Management | 3 (100.0%) | 0 (0.0%) |
| Business & Financial | 0 (0.0%) | 22 (100.0%) |
| Computers, Engineering & Science | 16 (100.0%) | 0 (0.0%) |
| Computers & Mathematics | 0 (0.0%) | 0 (0.0%) |
| Architecture & Engineering | 16 (100.0%) | 0 (0.0%) |
| Life, Physical & Social Science | 0 (0.0%) | 0 (0.0%) |
| Community & Social Service | 11 (45.8%) | 13 (54.2%) |
| Education, Arts & Media | 0 (0.0%) | 0 (0.0%) |
| Legal Services & Support | 0 (0.0%) | 0 (0.0%) |
| Education Instruction & Library | 11 (55.0%) | 9 (45.0%) |
| Arts, Media & Entertainment | 0 (0.0%) | 4 (100.0%) |
| Health Diagnosing & Treating | 0 (0.0%) | 0 (0.0%) |
| Health Technologists | 0 (0.0%) | 0 (0.0%) |
| Total (Category) | 30 (46.2%) | 35 (53.8%) |
| Total (Overall) | 199 (52.5%) | 180 (47.5%) |
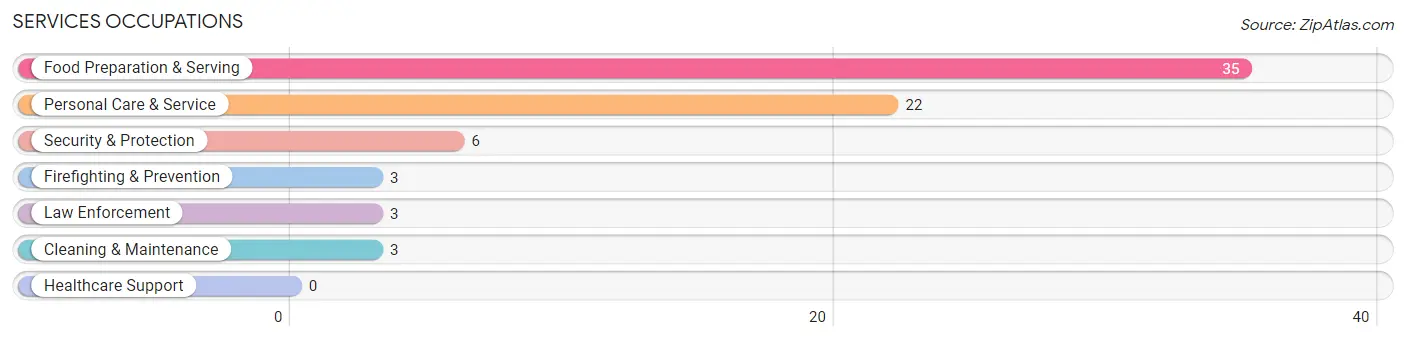
Services Occupations
The most common Services occupations in Matheny are Food Preparation & Serving (35 | 9.2%), Personal Care & Service (22 | 5.8%), Security & Protection (6 | 1.6%), Firefighting & Prevention (3 | 0.8%), and Law Enforcement (3 | 0.8%).
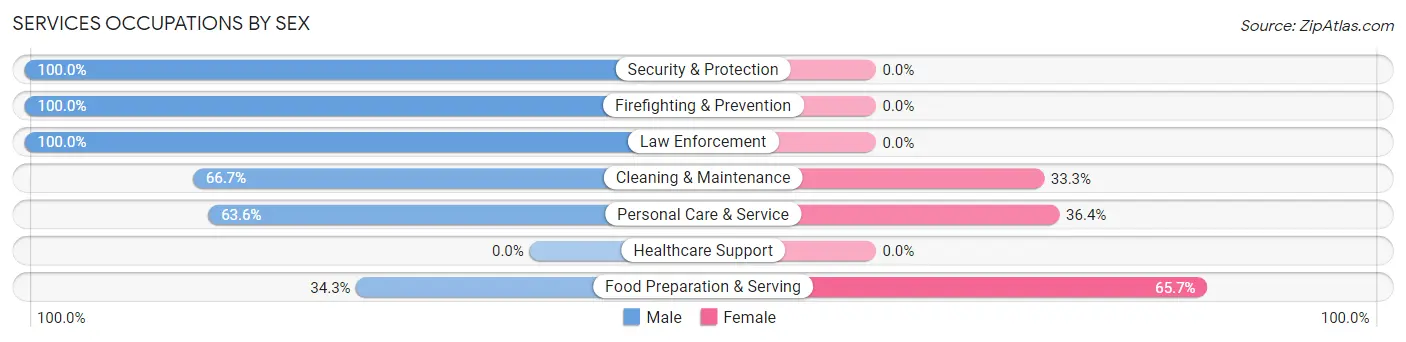
Services Occupations by Sex
Within the Services occupations in Matheny, the most male-oriented occupations are Security & Protection (100.0%), Firefighting & Prevention (100.0%), and Law Enforcement (100.0%), while the most female-oriented occupations are Food Preparation & Serving (65.7%), Personal Care & Service (36.4%), and Cleaning & Maintenance (33.3%).
| Occupation | Male | Female |
| Healthcare Support | 0 (0.0%) | 0 (0.0%) |
| Security & Protection | 6 (100.0%) | 0 (0.0%) |
| Firefighting & Prevention | 3 (100.0%) | 0 (0.0%) |
| Law Enforcement | 3 (100.0%) | 0 (0.0%) |
| Food Preparation & Serving | 12 (34.3%) | 23 (65.7%) |
| Cleaning & Maintenance | 2 (66.7%) | 1 (33.3%) |
| Personal Care & Service | 14 (63.6%) | 8 (36.4%) |
| Total (Category) | 34 (51.5%) | 32 (48.5%) |
| Total (Overall) | 199 (52.5%) | 180 (47.5%) |
Sales and Office Occupations
The most common Sales and Office occupations in Matheny are Office & Administration (63 | 16.6%), and Sales & Related (28 | 7.4%).
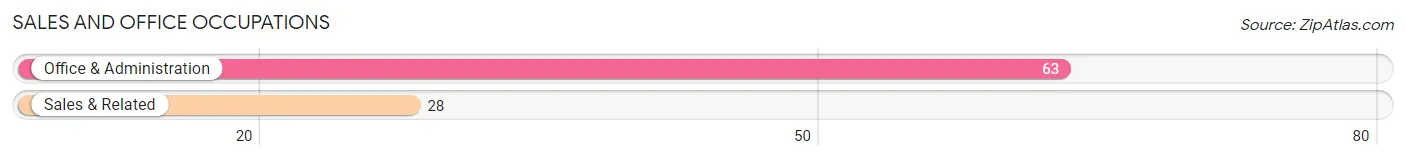
Sales and Office Occupations by Sex
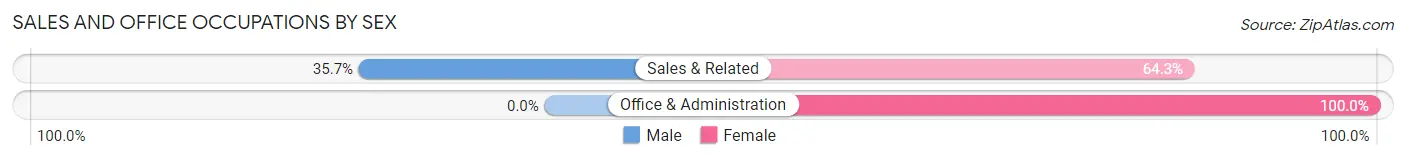
| Occupation | Male | Female |
| Sales & Related | 10 (35.7%) | 18 (64.3%) |
| Office & Administration | 0 (0.0%) | 63 (100.0%) |
| Total (Category) | 10 (11.0%) | 81 (89.0%) |
| Total (Overall) | 199 (52.5%) | 180 (47.5%) |
Natural Resources, Construction and Maintenance Occupations
The most common Natural Resources, Construction and Maintenance occupations in Matheny are Farming, Fishing & Forestry (58 | 15.3%), Installation, Maintenance & Repair (12 | 3.2%), and Construction & Extraction (10 | 2.6%).
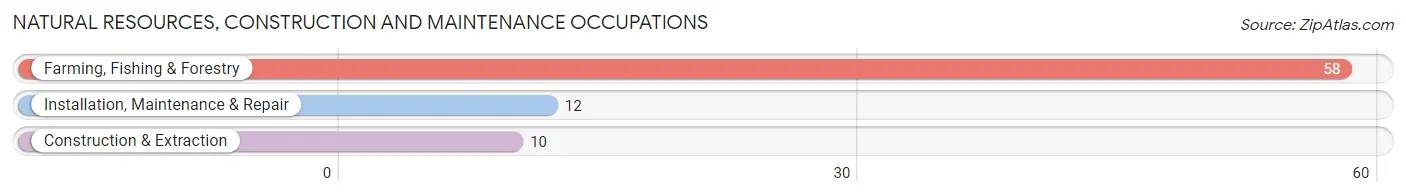
Natural Resources, Construction and Maintenance Occupations by Sex
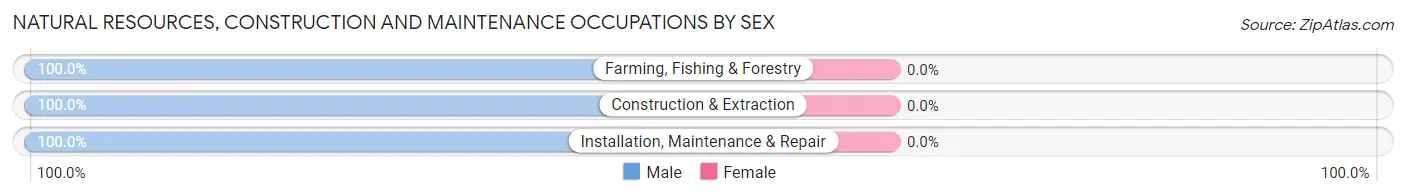
| Occupation | Male | Female |
| Farming, Fishing & Forestry | 58 (100.0%) | 0 (0.0%) |
| Construction & Extraction | 10 (100.0%) | 0 (0.0%) |
| Installation, Maintenance & Repair | 12 (100.0%) | 0 (0.0%) |
| Total (Category) | 80 (100.0%) | 0 (0.0%) |
| Total (Overall) | 199 (52.5%) | 180 (47.5%) |
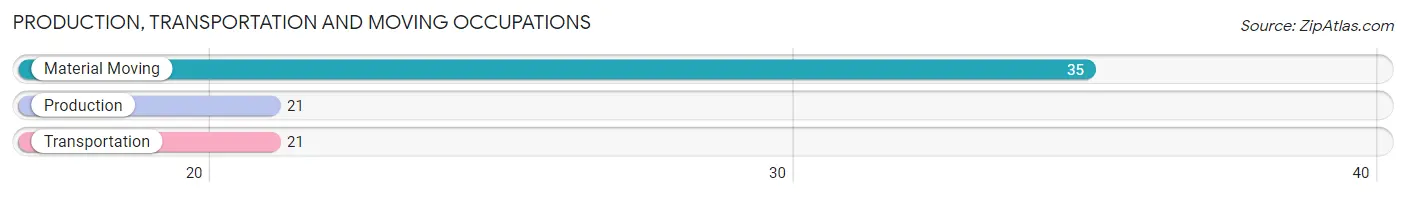
Production, Transportation and Moving Occupations
The most common Production, Transportation and Moving occupations in Matheny are Material Moving (35 | 9.2%), Production (21 | 5.5%), and Transportation (21 | 5.5%).
Production, Transportation and Moving Occupations by Sex
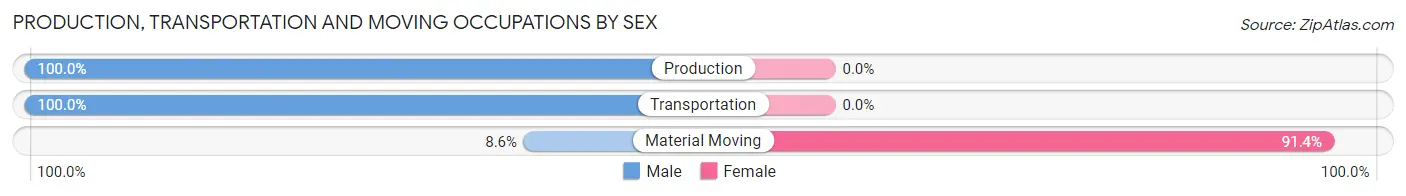
| Occupation | Male | Female |
| Production | 21 (100.0%) | 0 (0.0%) |
| Transportation | 21 (100.0%) | 0 (0.0%) |
| Material Moving | 3 (8.6%) | 32 (91.4%) |
| Total (Category) | 45 (58.4%) | 32 (41.6%) |
| Total (Overall) | 199 (52.5%) | 180 (47.5%) |
Employment Industries by Sex in Matheny
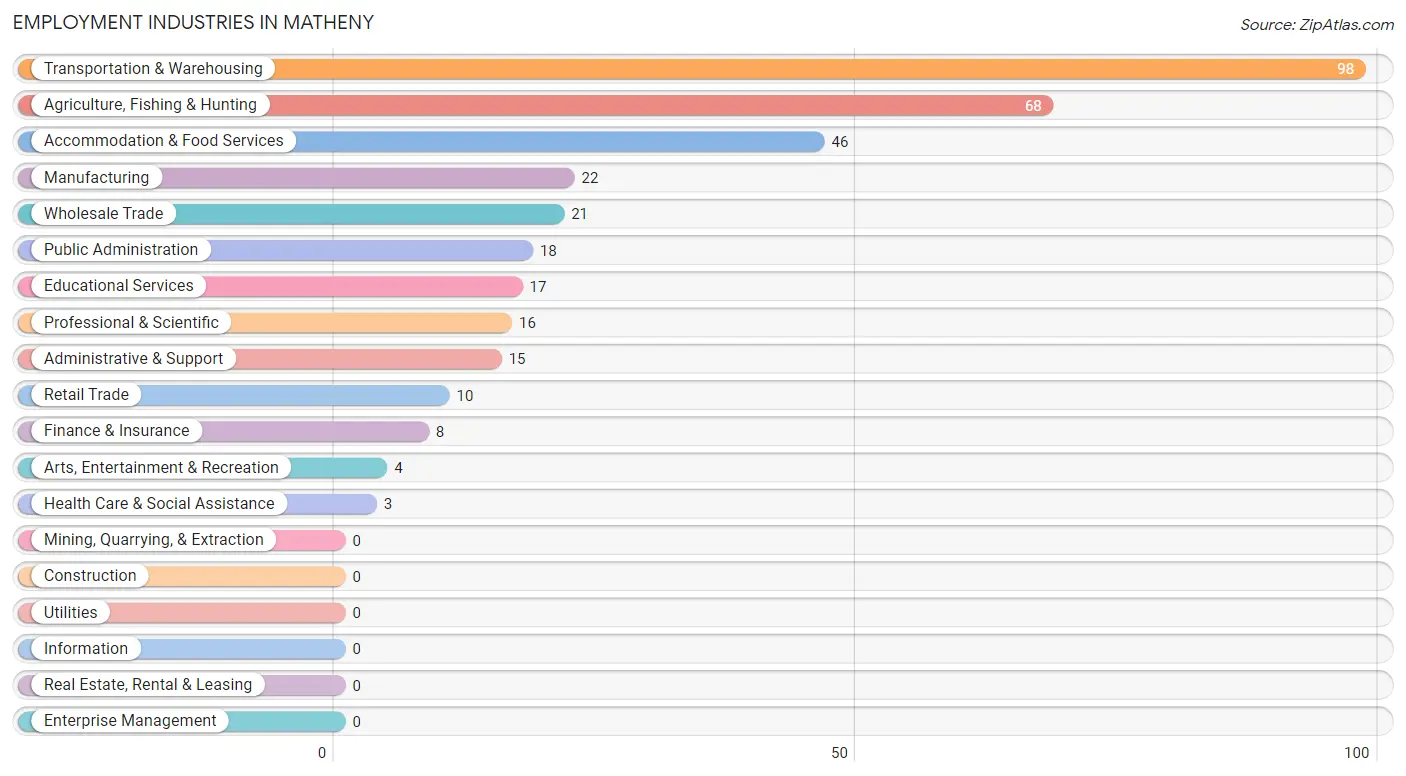
Employment Industries in Matheny
The major employment industries in Matheny include Transportation & Warehousing (98 | 25.9%), Agriculture, Fishing & Hunting (68 | 17.9%), Accommodation & Food Services (46 | 12.1%), Manufacturing (22 | 5.8%), and Wholesale Trade (21 | 5.5%).
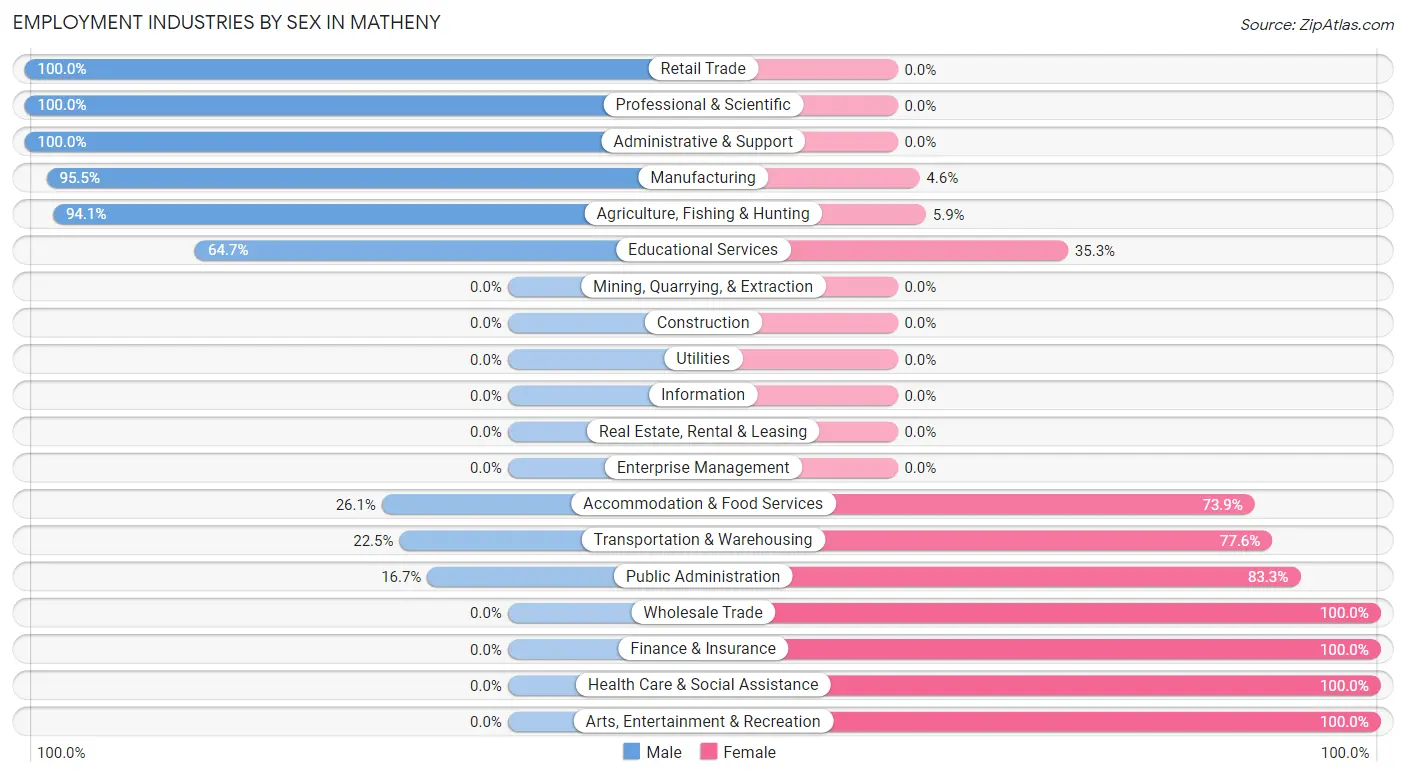
Employment Industries by Sex in Matheny
The Matheny industries that see more men than women are Retail Trade (100.0%), Professional & Scientific (100.0%), and Administrative & Support (100.0%), whereas the industries that tend to have a higher number of women are Wholesale Trade (100.0%), Finance & Insurance (100.0%), and Health Care & Social Assistance (100.0%).
| Industry | Male | Female |
| Agriculture, Fishing & Hunting | 64 (94.1%) | 4 (5.9%) |
| Mining, Quarrying, & Extraction | 0 (0.0%) | 0 (0.0%) |
| Construction | 0 (0.0%) | 0 (0.0%) |
| Manufacturing | 21 (95.5%) | 1 (4.5%) |
| Wholesale Trade | 0 (0.0%) | 21 (100.0%) |
| Retail Trade | 10 (100.0%) | 0 (0.0%) |
| Transportation & Warehousing | 22 (22.5%) | 76 (77.5%) |
| Utilities | 0 (0.0%) | 0 (0.0%) |
| Information | 0 (0.0%) | 0 (0.0%) |
| Finance & Insurance | 0 (0.0%) | 8 (100.0%) |
| Real Estate, Rental & Leasing | 0 (0.0%) | 0 (0.0%) |
| Professional & Scientific | 16 (100.0%) | 0 (0.0%) |
| Enterprise Management | 0 (0.0%) | 0 (0.0%) |
| Administrative & Support | 15 (100.0%) | 0 (0.0%) |
| Educational Services | 11 (64.7%) | 6 (35.3%) |
| Health Care & Social Assistance | 0 (0.0%) | 3 (100.0%) |
| Arts, Entertainment & Recreation | 0 (0.0%) | 4 (100.0%) |
| Accommodation & Food Services | 12 (26.1%) | 34 (73.9%) |
| Public Administration | 3 (16.7%) | 15 (83.3%) |
| Total | 199 (52.5%) | 180 (47.5%) |
Education in Matheny
School Enrollment in Matheny
The most common levels of schooling among the 176 students in Matheny are high school (73 | 41.5%), elementary school (50 | 28.4%), and middle school (38 | 21.6%).
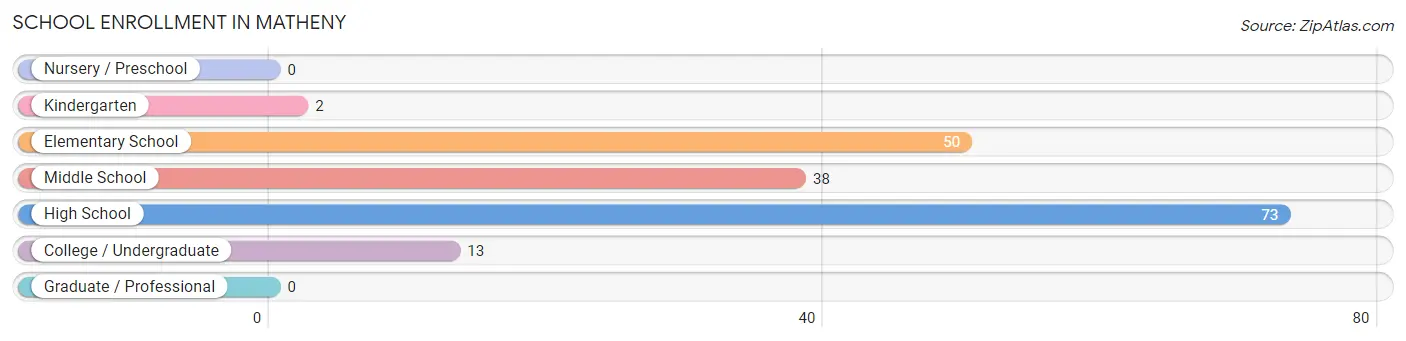
| School Level | # Students | % Students |
| Nursery / Preschool | 0 | 0.0% |
| Kindergarten | 2 | 1.1% |
| Elementary School | 50 | 28.4% |
| Middle School | 38 | 21.6% |
| High School | 73 | 41.5% |
| College / Undergraduate | 13 | 7.4% |
| Graduate / Professional | 0 | 0.0% |
| Total | 176 | 100.0% |
School Enrollment by Age by Funding Source in Matheny
Out of a total of 176 students who are enrolled in schools in Matheny, 10 (5.7%) attend a private institution, while the remaining 166 (94.3%) are enrolled in public schools. The age group of 15 to 17 year olds has the highest likelihood of being enrolled in private schools, with 10 (16.4% in the age bracket) enrolled. Conversely, the age group of 5 to 9 year old has the lowest likelihood of being enrolled in a private school, with 52 (100.0% in the age bracket) attending a public institution.
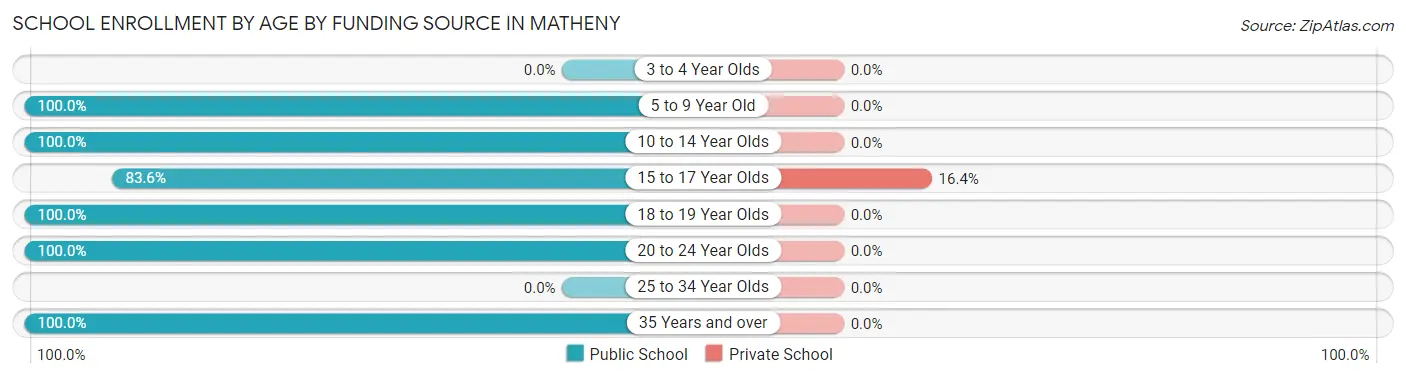
| Age Bracket | Public School | Private School |
| 3 to 4 Year Olds | 0 (0.0%) | 0 (0.0%) |
| 5 to 9 Year Old | 52 (100.0%) | 0 (0.0%) |
| 10 to 14 Year Olds | 47 (100.0%) | 0 (0.0%) |
| 15 to 17 Year Olds | 51 (83.6%) | 10 (16.4%) |
| 18 to 19 Year Olds | 5 (100.0%) | 0 (0.0%) |
| 20 to 24 Year Olds | 9 (100.0%) | 0 (0.0%) |
| 25 to 34 Year Olds | 0 (0.0%) | 0 (0.0%) |
| 35 Years and over | 2 (100.0%) | 0 (0.0%) |
| Total | 166 (94.3%) | 10 (5.7%) |
Educational Attainment by Field of Study in Matheny
Business (22 | 38.6%), social sciences (15 | 26.3%), education (11 | 19.3%), physical & health sciences (8 | 14.0%), and arts & humanities (1 | 1.8%) are the most common fields of study among 57 individuals in Matheny who have obtained a bachelor's degree or higher.
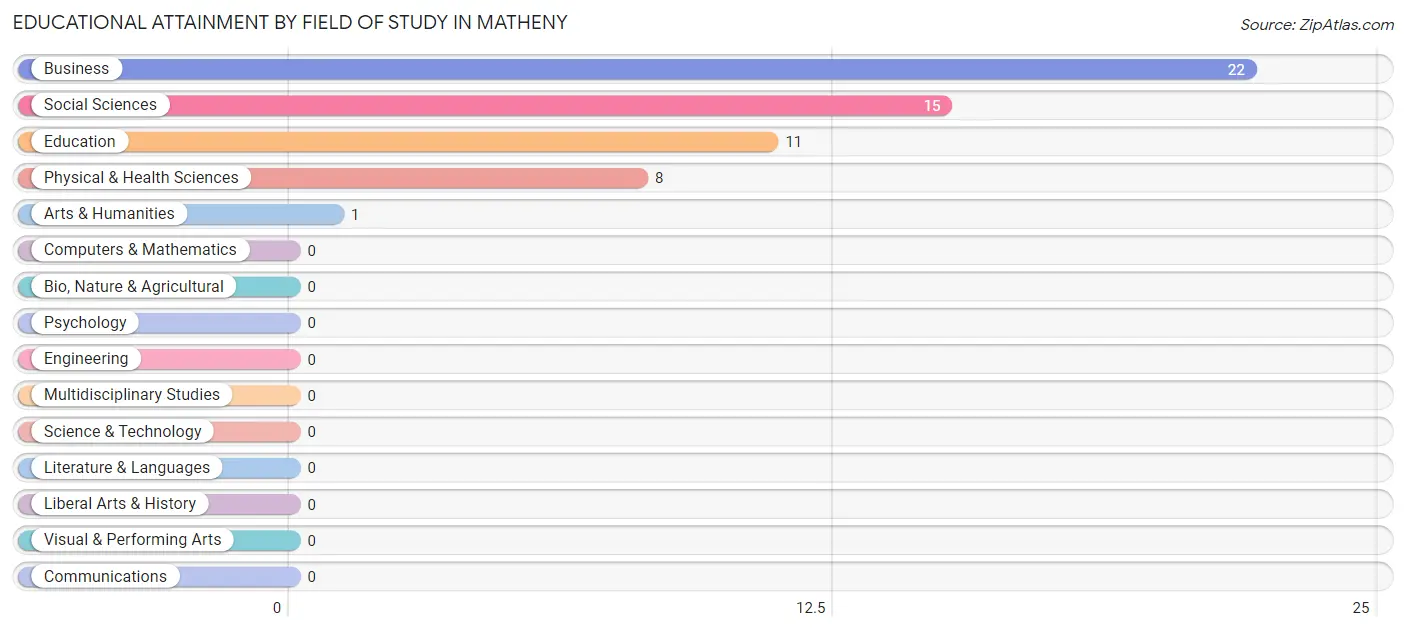
| Field of Study | # Graduates | % Graduates |
| Computers & Mathematics | 0 | 0.0% |
| Bio, Nature & Agricultural | 0 | 0.0% |
| Physical & Health Sciences | 8 | 14.0% |
| Psychology | 0 | 0.0% |
| Social Sciences | 15 | 26.3% |
| Engineering | 0 | 0.0% |
| Multidisciplinary Studies | 0 | 0.0% |
| Science & Technology | 0 | 0.0% |
| Business | 22 | 38.6% |
| Education | 11 | 19.3% |
| Literature & Languages | 0 | 0.0% |
| Liberal Arts & History | 0 | 0.0% |
| Visual & Performing Arts | 0 | 0.0% |
| Communications | 0 | 0.0% |
| Arts & Humanities | 1 | 1.8% |
| Total | 57 | 100.0% |
Transportation & Commute in Matheny
Vehicle Availability by Sex in Matheny
The most prevalent vehicle ownership categories in Matheny are males with 4 vehicles (62, accounting for 35.2%) and females with 4 vehicles (5, making up 40.0%).
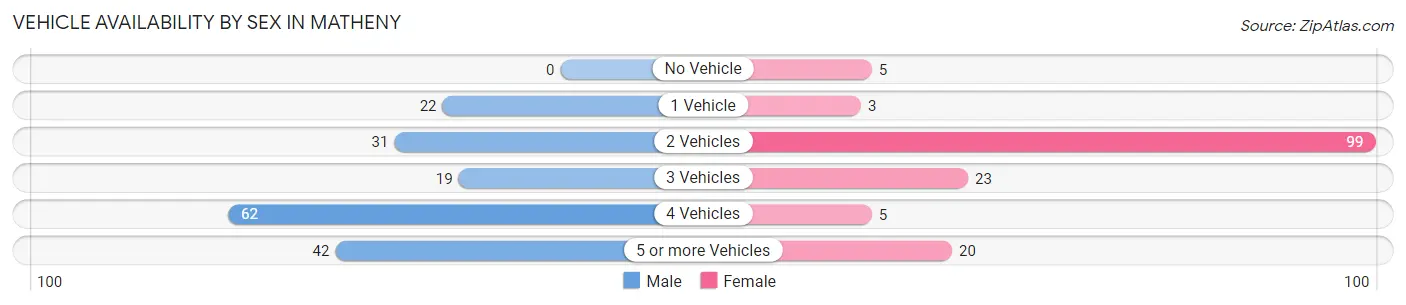
| Vehicles Available | Male | Female |
| No Vehicle | 0 (0.0%) | 5 (3.2%) |
| 1 Vehicle | 22 (12.5%) | 3 (1.9%) |
| 2 Vehicles | 31 (17.6%) | 99 (63.9%) |
| 3 Vehicles | 19 (10.8%) | 23 (14.8%) |
| 4 Vehicles | 62 (35.2%) | 5 (3.2%) |
| 5 or more Vehicles | 42 (23.9%) | 20 (12.9%) |
| Total | 176 (100.0%) | 155 (100.0%) |
Commute Time in Matheny
The most frequently occuring commute durations in Matheny are 15 to 19 minutes (145 commuters, 43.8%), 10 to 14 minutes (70 commuters, 21.1%), and 25 to 29 minutes (42 commuters, 12.7%).
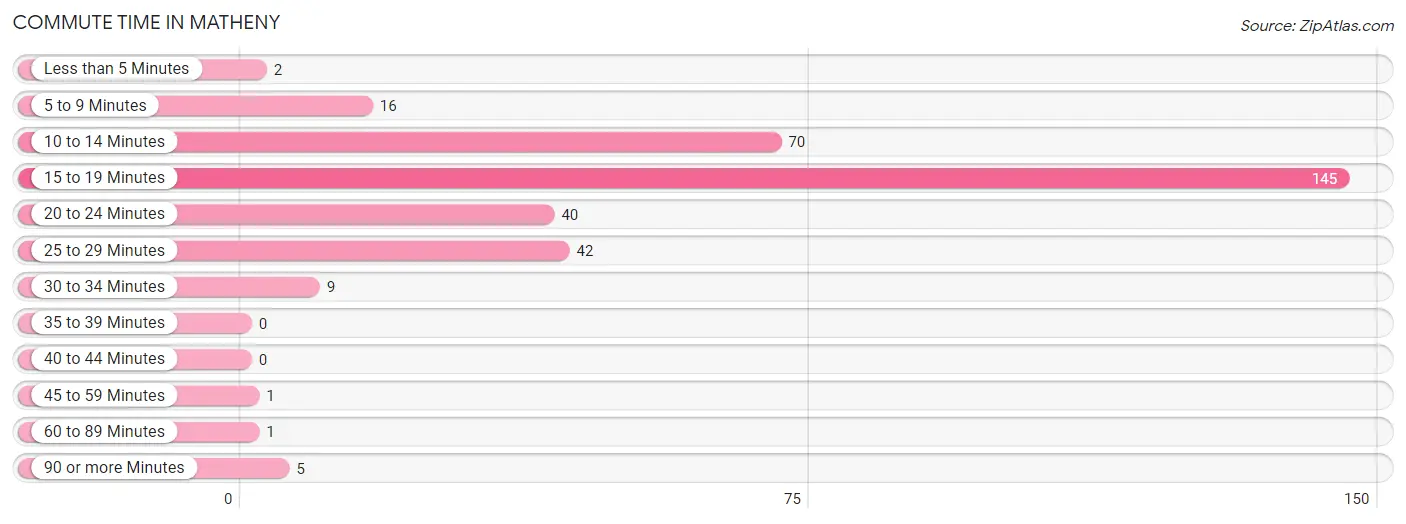
| Commute Time | # Commuters | % Commuters |
| Less than 5 Minutes | 2 | 0.6% |
| 5 to 9 Minutes | 16 | 4.8% |
| 10 to 14 Minutes | 70 | 21.1% |
| 15 to 19 Minutes | 145 | 43.8% |
| 20 to 24 Minutes | 40 | 12.1% |
| 25 to 29 Minutes | 42 | 12.7% |
| 30 to 34 Minutes | 9 | 2.7% |
| 35 to 39 Minutes | 0 | 0.0% |
| 40 to 44 Minutes | 0 | 0.0% |
| 45 to 59 Minutes | 1 | 0.3% |
| 60 to 89 Minutes | 1 | 0.3% |
| 90 or more Minutes | 5 | 1.5% |
Commute Time by Sex in Matheny
The most common commute times in Matheny are 10 to 14 minutes (55 commuters, 31.2%) for males and 15 to 19 minutes (109 commuters, 70.3%) for females.
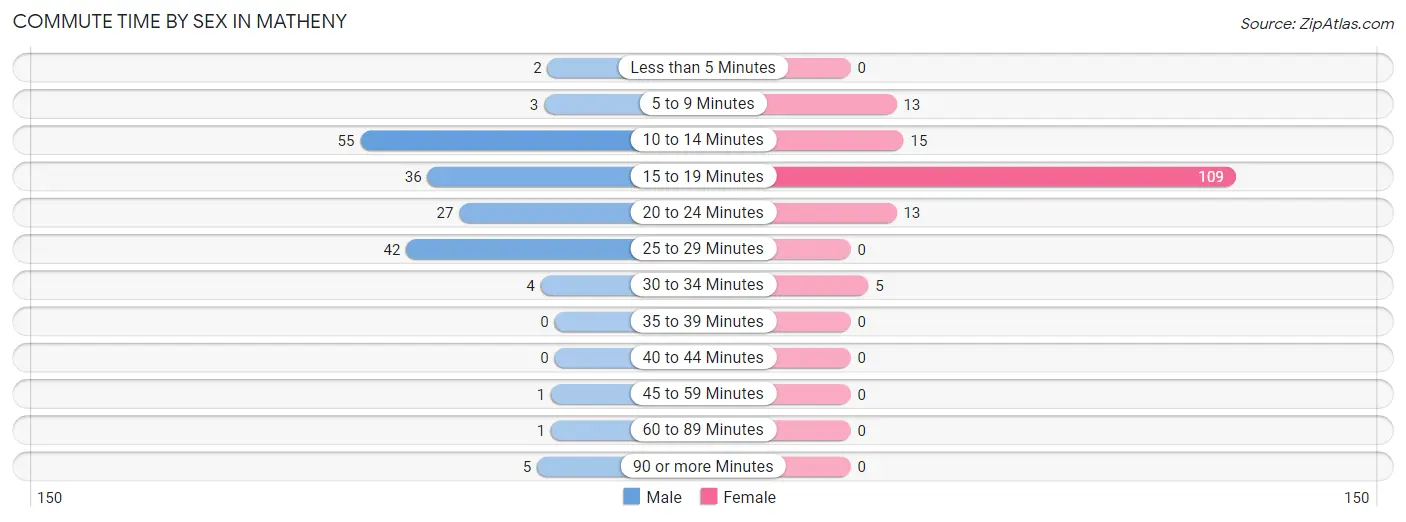
| Commute Time | Male | Female |
| Less than 5 Minutes | 2 (1.1%) | 0 (0.0%) |
| 5 to 9 Minutes | 3 (1.7%) | 13 (8.4%) |
| 10 to 14 Minutes | 55 (31.2%) | 15 (9.7%) |
| 15 to 19 Minutes | 36 (20.4%) | 109 (70.3%) |
| 20 to 24 Minutes | 27 (15.3%) | 13 (8.4%) |
| 25 to 29 Minutes | 42 (23.9%) | 0 (0.0%) |
| 30 to 34 Minutes | 4 (2.3%) | 5 (3.2%) |
| 35 to 39 Minutes | 0 (0.0%) | 0 (0.0%) |
| 40 to 44 Minutes | 0 (0.0%) | 0 (0.0%) |
| 45 to 59 Minutes | 1 (0.6%) | 0 (0.0%) |
| 60 to 89 Minutes | 1 (0.6%) | 0 (0.0%) |
| 90 or more Minutes | 5 (2.8%) | 0 (0.0%) |
Time of Departure to Work by Sex in Matheny
The most frequent times of departure to work in Matheny are 7:00 AM to 7:29 AM (36, 20.4%) for males and 12:00 AM to 4:59 AM (73, 47.1%) for females.
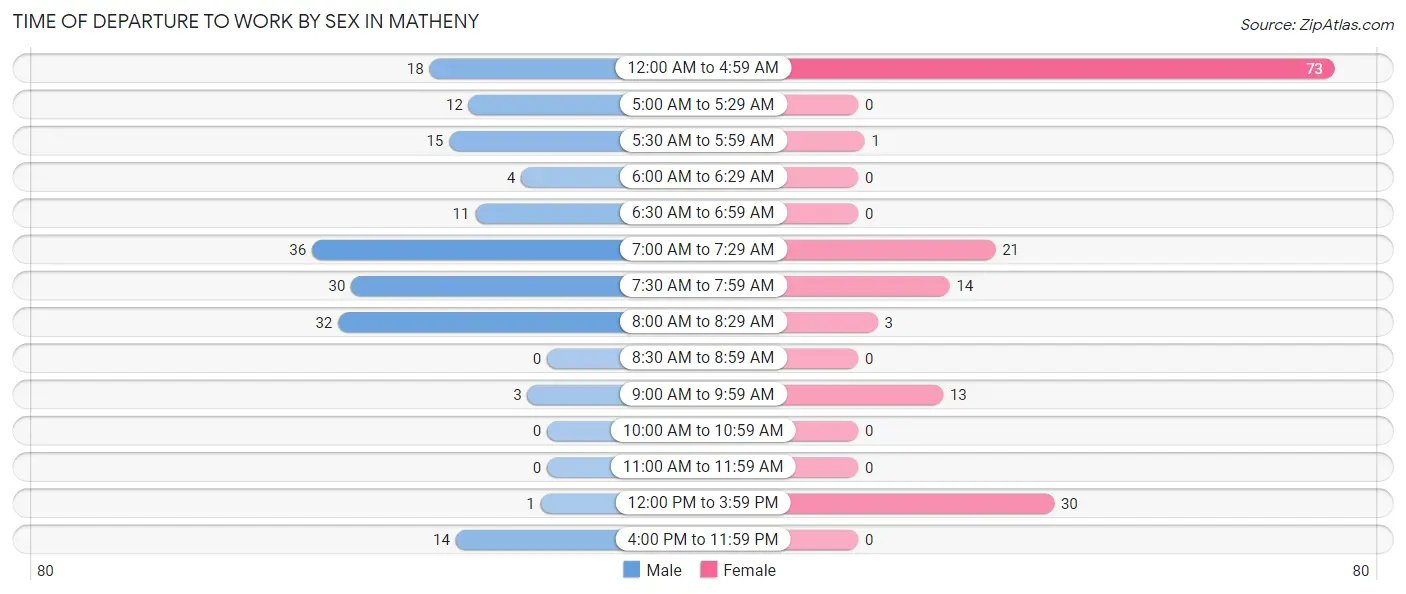
| Time of Departure | Male | Female |
| 12:00 AM to 4:59 AM | 18 (10.2%) | 73 (47.1%) |
| 5:00 AM to 5:29 AM | 12 (6.8%) | 0 (0.0%) |
| 5:30 AM to 5:59 AM | 15 (8.5%) | 1 (0.6%) |
| 6:00 AM to 6:29 AM | 4 (2.3%) | 0 (0.0%) |
| 6:30 AM to 6:59 AM | 11 (6.2%) | 0 (0.0%) |
| 7:00 AM to 7:29 AM | 36 (20.4%) | 21 (13.6%) |
| 7:30 AM to 7:59 AM | 30 (17.1%) | 14 (9.0%) |
| 8:00 AM to 8:29 AM | 32 (18.2%) | 3 (1.9%) |
| 8:30 AM to 8:59 AM | 0 (0.0%) | 0 (0.0%) |
| 9:00 AM to 9:59 AM | 3 (1.7%) | 13 (8.4%) |
| 10:00 AM to 10:59 AM | 0 (0.0%) | 0 (0.0%) |
| 11:00 AM to 11:59 AM | 0 (0.0%) | 0 (0.0%) |
| 12:00 PM to 3:59 PM | 1 (0.6%) | 30 (19.4%) |
| 4:00 PM to 11:59 PM | 14 (8.0%) | 0 (0.0%) |
| Total | 176 (100.0%) | 155 (100.0%) |
Housing Occupancy in Matheny
Occupancy by Ownership in Matheny
Of the total 207 dwellings in Matheny, owner-occupied units account for 92 (44.4%), while renter-occupied units make up 115 (55.6%).
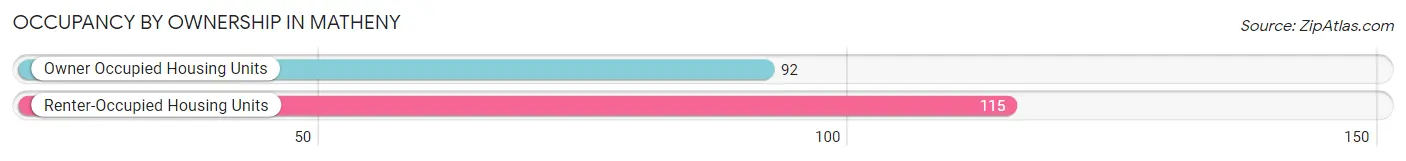
| Occupancy | # Housing Units | % Housing Units |
| Owner Occupied Housing Units | 92 | 44.4% |
| Renter-Occupied Housing Units | 115 | 55.6% |
| Total Occupied Housing Units | 207 | 100.0% |
Occupancy by Household Size in Matheny
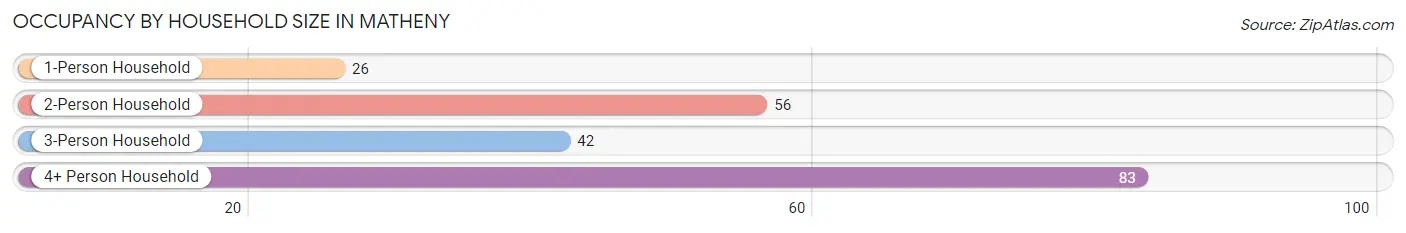
| Household Size | # Housing Units | % Housing Units |
| 1-Person Household | 26 | 12.6% |
| 2-Person Household | 56 | 27.1% |
| 3-Person Household | 42 | 20.3% |
| 4+ Person Household | 83 | 40.1% |
| Total Housing Units | 207 | 100.0% |
Occupancy by Ownership by Household Size in Matheny
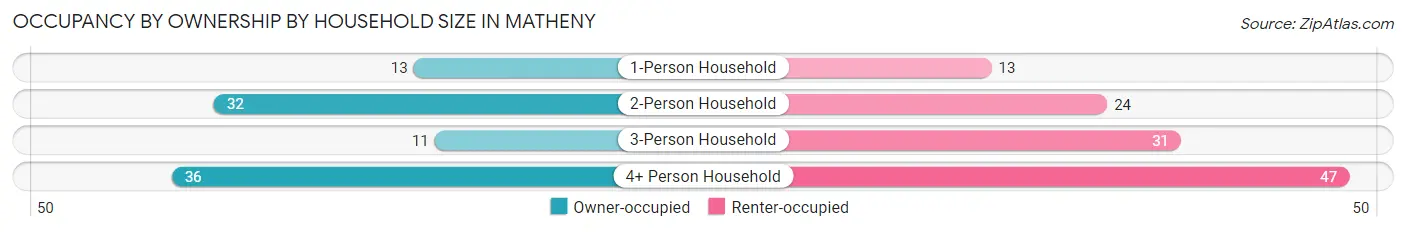
| Household Size | Owner-occupied | Renter-occupied |
| 1-Person Household | 13 (50.0%) | 13 (50.0%) |
| 2-Person Household | 32 (57.1%) | 24 (42.9%) |
| 3-Person Household | 11 (26.2%) | 31 (73.8%) |
| 4+ Person Household | 36 (43.4%) | 47 (56.6%) |
| Total Housing Units | 92 (44.4%) | 115 (55.6%) |
Occupancy by Educational Attainment in Matheny
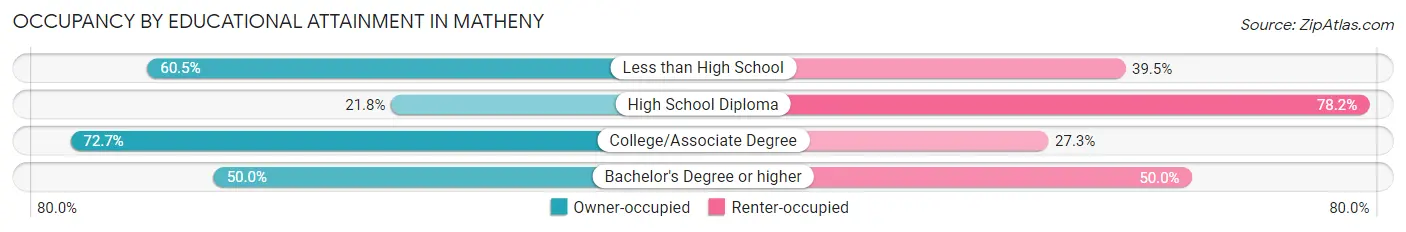
| Household Size | Owner-occupied | Renter-occupied |
| Less than High School | 46 (60.5%) | 30 (39.5%) |
| High School Diploma | 19 (21.8%) | 68 (78.2%) |
| College/Associate Degree | 16 (72.7%) | 6 (27.3%) |
| Bachelor's Degree or higher | 11 (50.0%) | 11 (50.0%) |
Occupancy by Age of Householder in Matheny
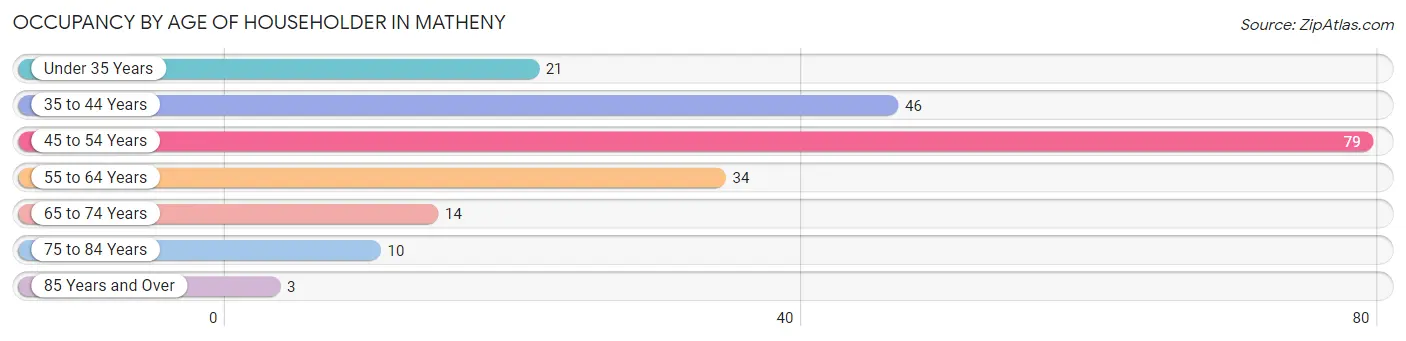
| Age Bracket | # Households | % Households |
| Under 35 Years | 21 | 10.1% |
| 35 to 44 Years | 46 | 22.2% |
| 45 to 54 Years | 79 | 38.2% |
| 55 to 64 Years | 34 | 16.4% |
| 65 to 74 Years | 14 | 6.8% |
| 75 to 84 Years | 10 | 4.8% |
| 85 Years and Over | 3 | 1.5% |
| Total | 207 | 100.0% |
Housing Finances in Matheny
Median Income by Occupancy in Matheny
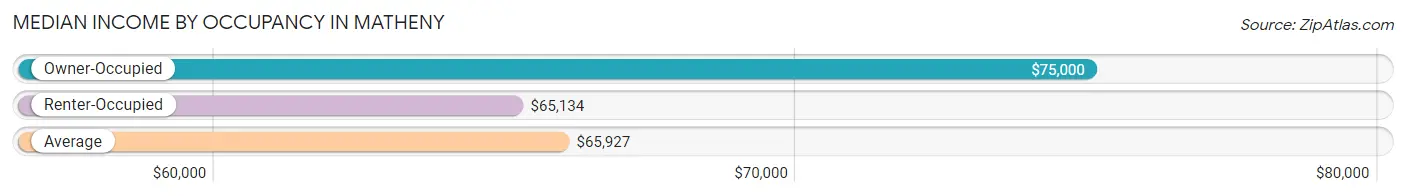
| Occupancy Type | # Households | Median Income |
| Owner-Occupied | 92 (44.4%) | $75,000 |
| Renter-Occupied | 115 (55.6%) | $65,134 |
| Average | 207 (100.0%) | $65,927 |
Occupancy by Householder Income Bracket in Matheny
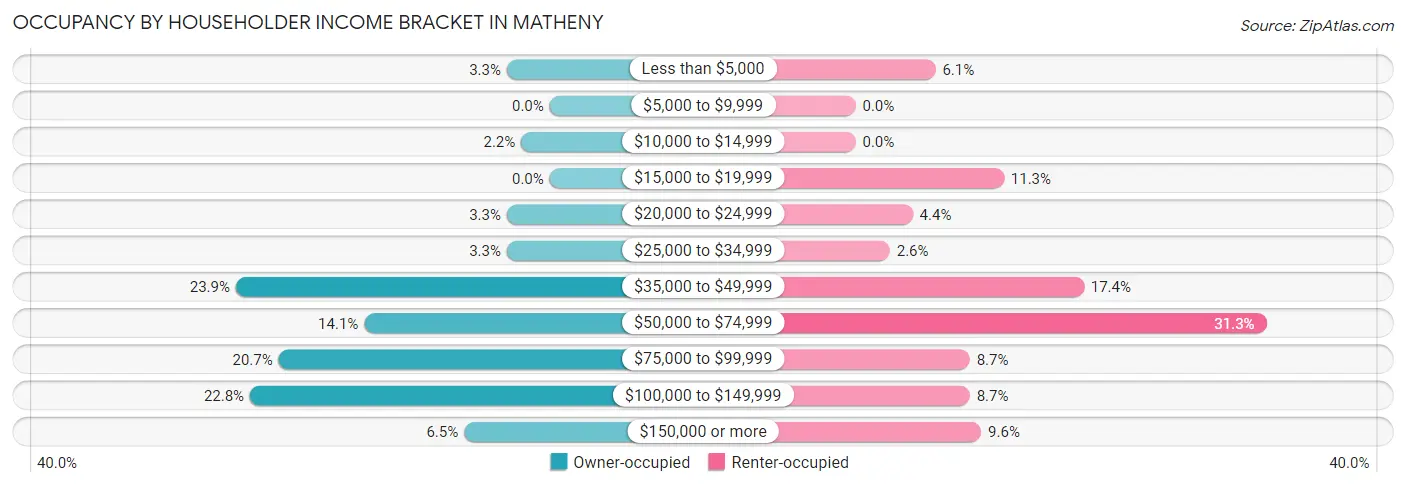
| Income Bracket | Owner-occupied | Renter-occupied |
| Less than $5,000 | 3 (3.3%) | 7 (6.1%) |
| $5,000 to $9,999 | 0 (0.0%) | 0 (0.0%) |
| $10,000 to $14,999 | 2 (2.2%) | 0 (0.0%) |
| $15,000 to $19,999 | 0 (0.0%) | 13 (11.3%) |
| $20,000 to $24,999 | 3 (3.3%) | 5 (4.3%) |
| $25,000 to $34,999 | 3 (3.3%) | 3 (2.6%) |
| $35,000 to $49,999 | 22 (23.9%) | 20 (17.4%) |
| $50,000 to $74,999 | 13 (14.1%) | 36 (31.3%) |
| $75,000 to $99,999 | 19 (20.6%) | 10 (8.7%) |
| $100,000 to $149,999 | 21 (22.8%) | 10 (8.7%) |
| $150,000 or more | 6 (6.5%) | 11 (9.6%) |
| Total | 92 (100.0%) | 115 (100.0%) |
Monthly Housing Cost Tiers in Matheny
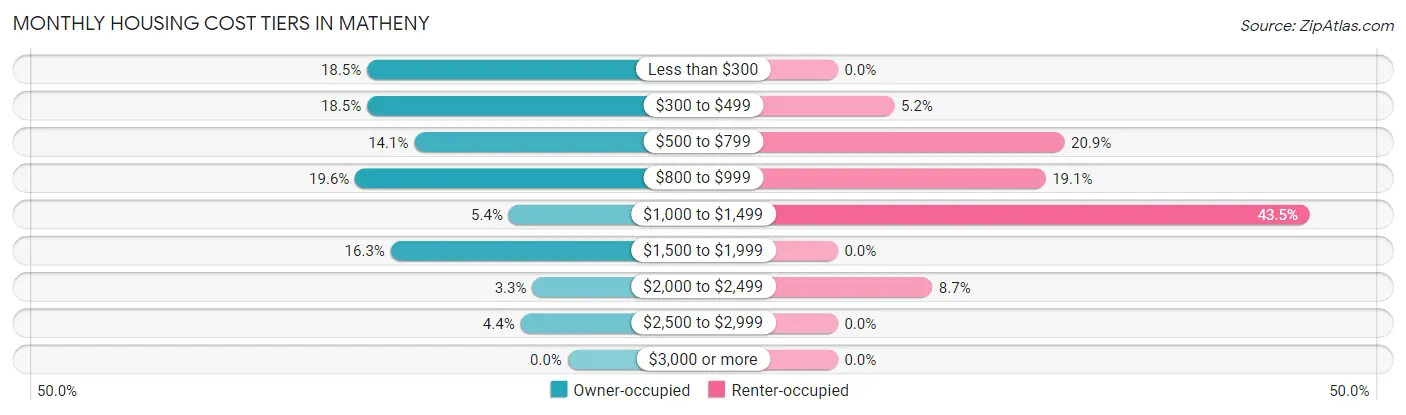
| Monthly Cost | Owner-occupied | Renter-occupied |
| Less than $300 | 17 (18.5%) | 0 (0.0%) |
| $300 to $499 | 17 (18.5%) | 6 (5.2%) |
| $500 to $799 | 13 (14.1%) | 24 (20.9%) |
| $800 to $999 | 18 (19.6%) | 22 (19.1%) |
| $1,000 to $1,499 | 5 (5.4%) | 50 (43.5%) |
| $1,500 to $1,999 | 15 (16.3%) | 0 (0.0%) |
| $2,000 to $2,499 | 3 (3.3%) | 10 (8.7%) |
| $2,500 to $2,999 | 4 (4.3%) | 0 (0.0%) |
| $3,000 or more | 0 (0.0%) | 0 (0.0%) |
| Total | 92 (100.0%) | 115 (100.0%) |
Physical Housing Characteristics in Matheny
Housing Structures in Matheny
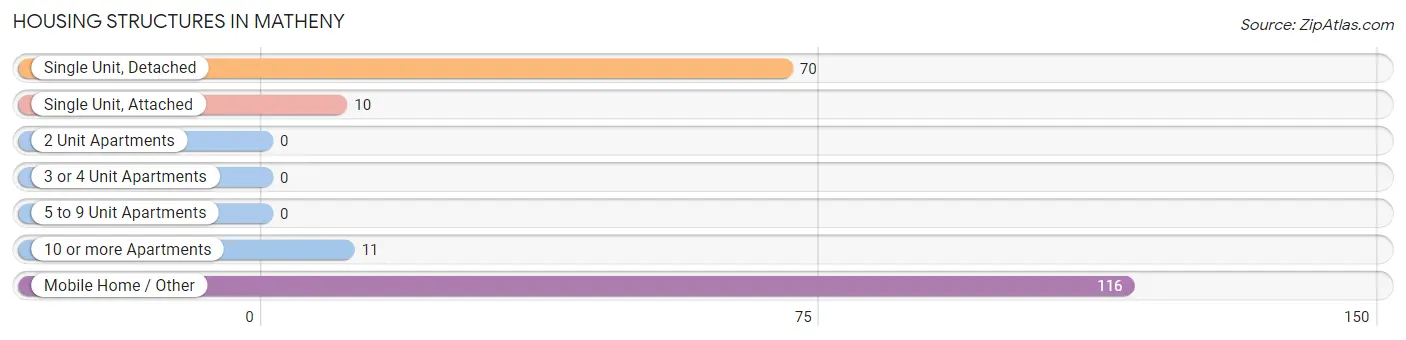
| Structure Type | # Housing Units | % Housing Units |
| Single Unit, Detached | 70 | 33.8% |
| Single Unit, Attached | 10 | 4.8% |
| 2 Unit Apartments | 0 | 0.0% |
| 3 or 4 Unit Apartments | 0 | 0.0% |
| 5 to 9 Unit Apartments | 0 | 0.0% |
| 10 or more Apartments | 11 | 5.3% |
| Mobile Home / Other | 116 | 56.0% |
| Total | 207 | 100.0% |
Housing Structures by Occupancy in Matheny
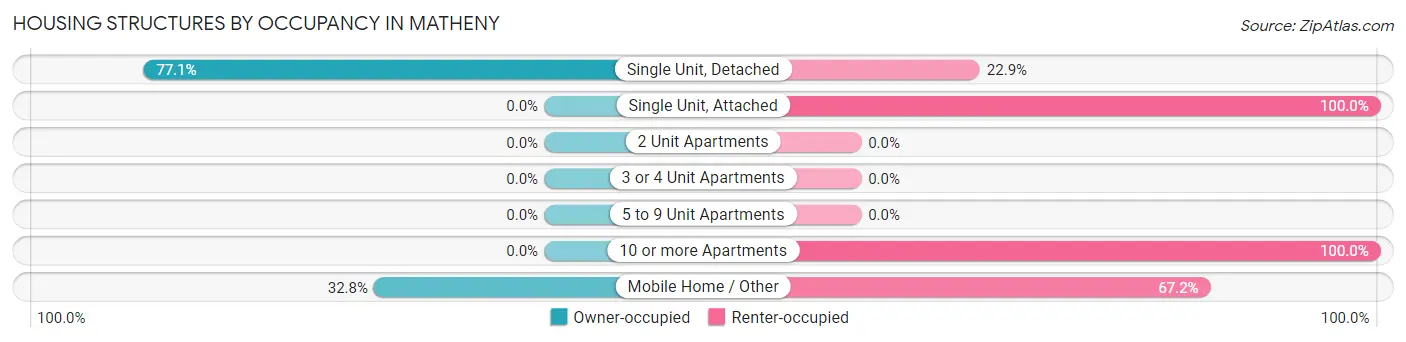
| Structure Type | Owner-occupied | Renter-occupied |
| Single Unit, Detached | 54 (77.1%) | 16 (22.9%) |
| Single Unit, Attached | 0 (0.0%) | 10 (100.0%) |
| 2 Unit Apartments | 0 (0.0%) | 0 (0.0%) |
| 3 or 4 Unit Apartments | 0 (0.0%) | 0 (0.0%) |
| 5 to 9 Unit Apartments | 0 (0.0%) | 0 (0.0%) |
| 10 or more Apartments | 0 (0.0%) | 11 (100.0%) |
| Mobile Home / Other | 38 (32.8%) | 78 (67.2%) |
| Total | 92 (44.4%) | 115 (55.6%) |
Housing Structures by Number of Rooms in Matheny
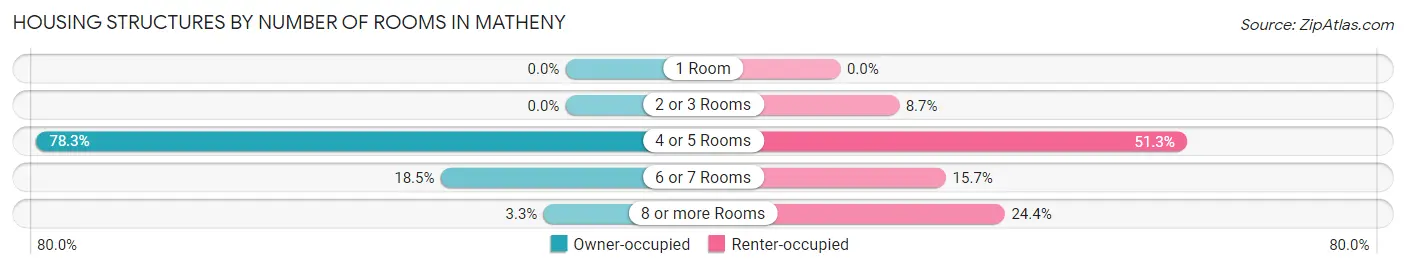
| Number of Rooms | Owner-occupied | Renter-occupied |
| 1 Room | 0 (0.0%) | 0 (0.0%) |
| 2 or 3 Rooms | 0 (0.0%) | 10 (8.7%) |
| 4 or 5 Rooms | 72 (78.3%) | 59 (51.3%) |
| 6 or 7 Rooms | 17 (18.5%) | 18 (15.7%) |
| 8 or more Rooms | 3 (3.3%) | 28 (24.3%) |
| Total | 92 (100.0%) | 115 (100.0%) |
Housing Structure by Heating Type in Matheny
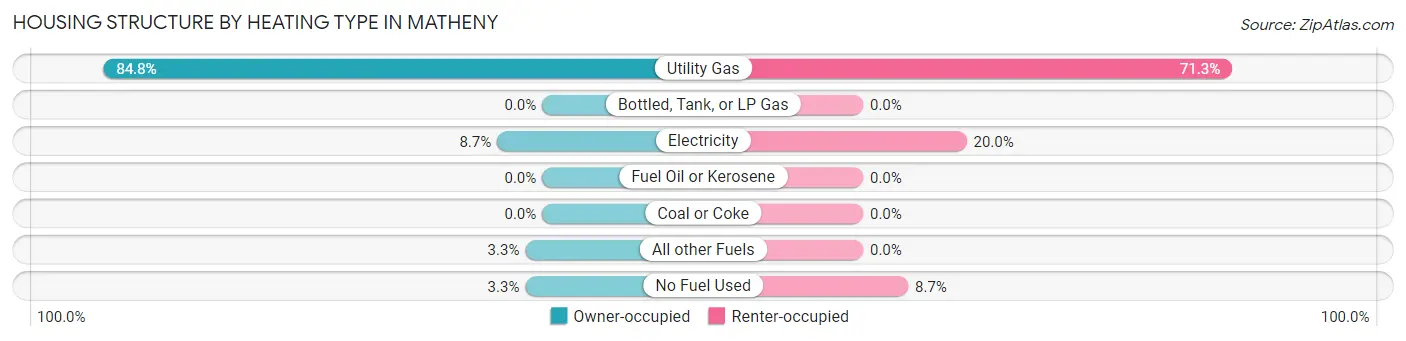
| Heating Type | Owner-occupied | Renter-occupied |
| Utility Gas | 78 (84.8%) | 82 (71.3%) |
| Bottled, Tank, or LP Gas | 0 (0.0%) | 0 (0.0%) |
| Electricity | 8 (8.7%) | 23 (20.0%) |
| Fuel Oil or Kerosene | 0 (0.0%) | 0 (0.0%) |
| Coal or Coke | 0 (0.0%) | 0 (0.0%) |
| All other Fuels | 3 (3.3%) | 0 (0.0%) |
| No Fuel Used | 3 (3.3%) | 10 (8.7%) |
| Total | 92 (100.0%) | 115 (100.0%) |
Household Vehicle Usage in Matheny
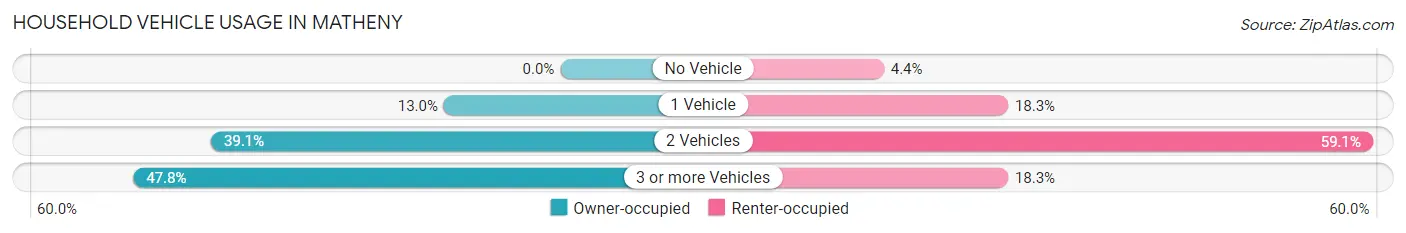
| Vehicles per Household | Owner-occupied | Renter-occupied |
| No Vehicle | 0 (0.0%) | 5 (4.3%) |
| 1 Vehicle | 12 (13.0%) | 21 (18.3%) |
| 2 Vehicles | 36 (39.1%) | 68 (59.1%) |
| 3 or more Vehicles | 44 (47.8%) | 21 (18.3%) |
| Total | 92 (100.0%) | 115 (100.0%) |
Real Estate & Mortgages in Matheny
Real Estate and Mortgage Overview in Matheny
| Characteristic | Without Mortgage | With Mortgage |
| Housing Units | 44 | 48 |
| Median Property Value | - | - |
| Median Household Income | $104,375 | $0 |
| Monthly Housing Costs | $364 | $0 |
| Real Estate Taxes | - | - |
Property Value by Mortgage Status in Matheny
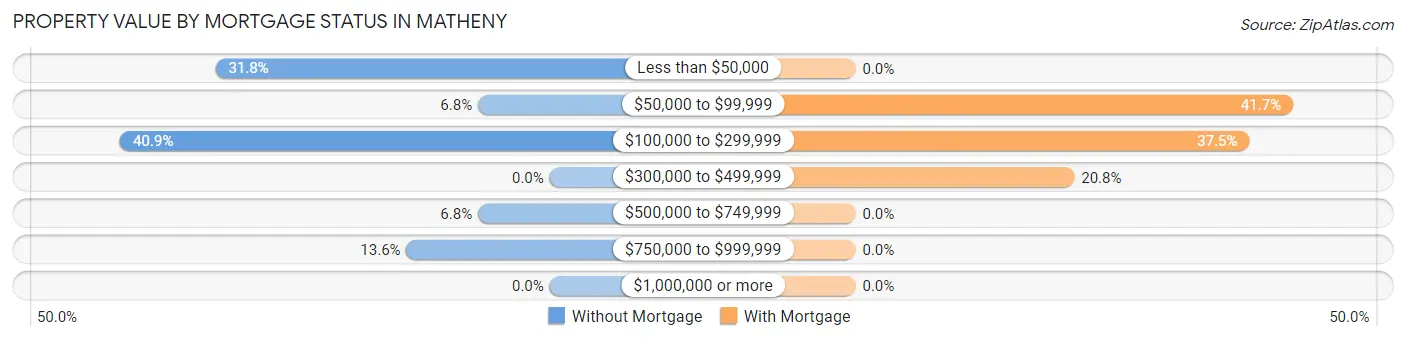
| Property Value | Without Mortgage | With Mortgage |
| Less than $50,000 | 14 (31.8%) | 0 (0.0%) |
| $50,000 to $99,999 | 3 (6.8%) | 20 (41.7%) |
| $100,000 to $299,999 | 18 (40.9%) | 18 (37.5%) |
| $300,000 to $499,999 | 0 (0.0%) | 10 (20.8%) |
| $500,000 to $749,999 | 3 (6.8%) | 0 (0.0%) |
| $750,000 to $999,999 | 6 (13.6%) | 0 (0.0%) |
| $1,000,000 or more | 0 (0.0%) | 0 (0.0%) |
| Total | 44 (100.0%) | 48 (100.0%) |
Household Income by Mortgage Status in Matheny
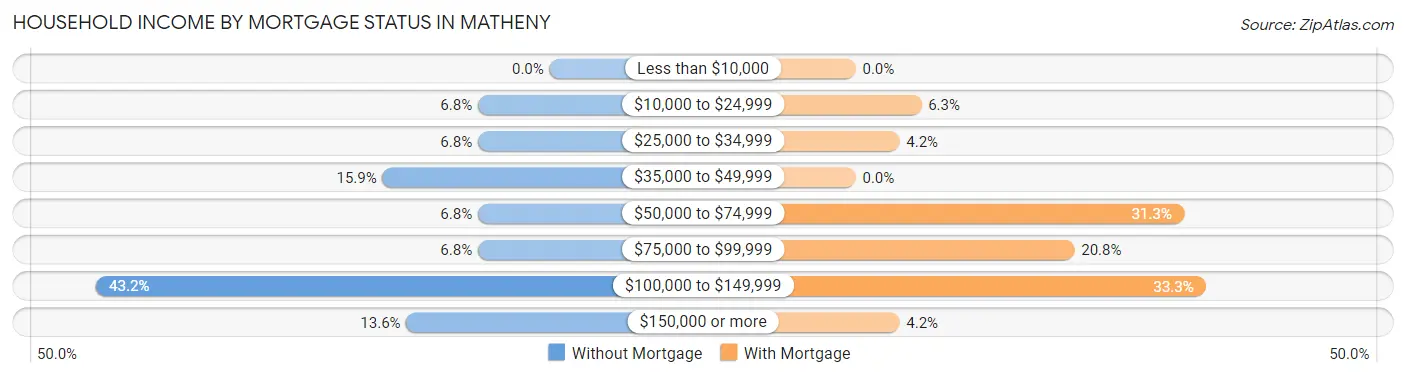
| Household Income | Without Mortgage | With Mortgage |
| Less than $10,000 | 0 (0.0%) | 0 (0.0%) |
| $10,000 to $24,999 | 3 (6.8%) | 3 (6.2%) |
| $25,000 to $34,999 | 3 (6.8%) | 2 (4.2%) |
| $35,000 to $49,999 | 7 (15.9%) | 0 (0.0%) |
| $50,000 to $74,999 | 3 (6.8%) | 15 (31.2%) |
| $75,000 to $99,999 | 3 (6.8%) | 10 (20.8%) |
| $100,000 to $149,999 | 19 (43.2%) | 16 (33.3%) |
| $150,000 or more | 6 (13.6%) | 2 (4.2%) |
| Total | 44 (100.0%) | 48 (100.0%) |
Property Value to Household Income Ratio in Matheny
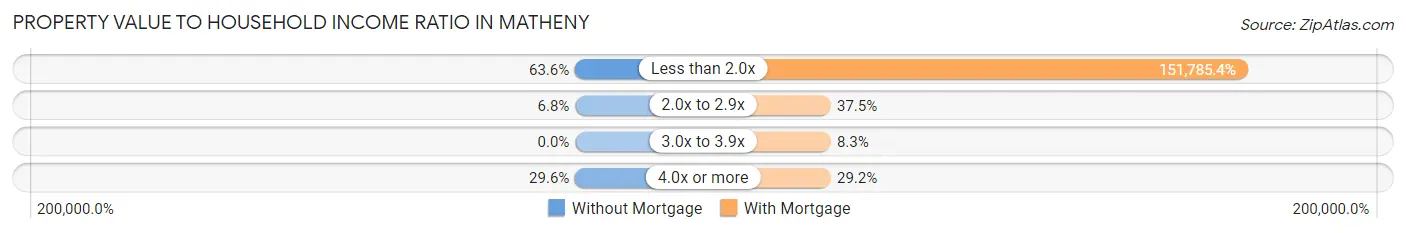
| Value-to-Income Ratio | Without Mortgage | With Mortgage |
| Less than 2.0x | 28 (63.6%) | 72,857 (151,785.4%) |
| 2.0x to 2.9x | 3 (6.8%) | 18 (37.5%) |
| 3.0x to 3.9x | 0 (0.0%) | 4 (8.3%) |
| 4.0x or more | 13 (29.5%) | 14 (29.2%) |
| Total | 44 (100.0%) | 48 (100.0%) |
Real Estate Taxes by Mortgage Status in Matheny
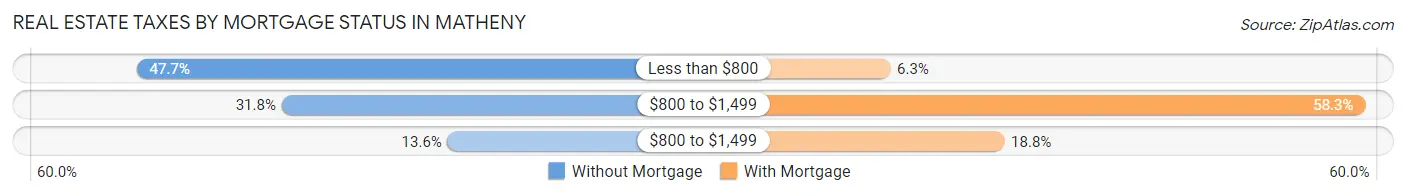
| Property Taxes | Without Mortgage | With Mortgage |
| Less than $800 | 21 (47.7%) | 3 (6.2%) |
| $800 to $1,499 | 14 (31.8%) | 28 (58.3%) |
| $800 to $1,499 | 6 (13.6%) | 9 (18.8%) |
| Total | 44 (100.0%) | 48 (100.0%) |
Health & Disability in Matheny
Health Insurance Coverage by Age in Matheny
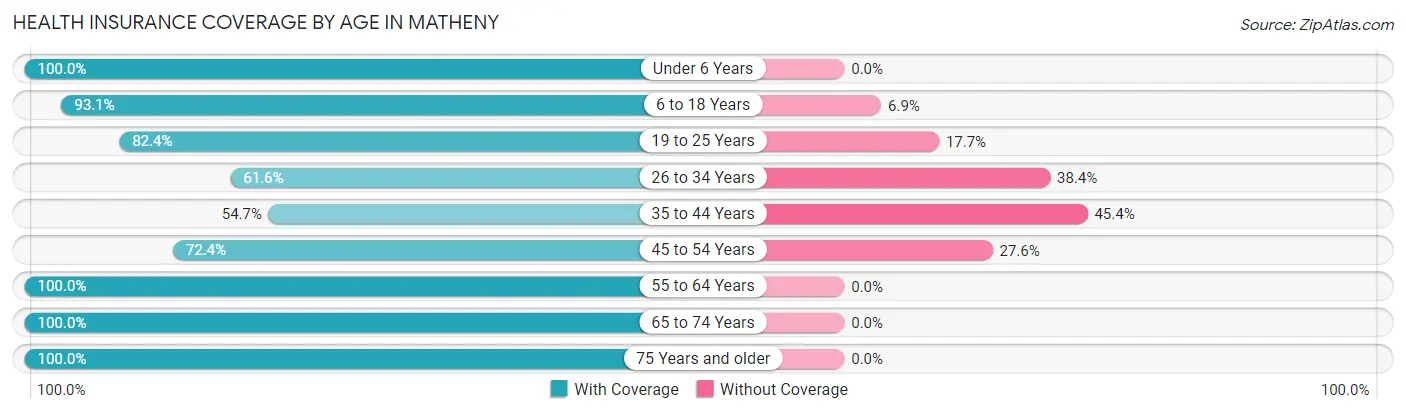
| Age Bracket | With Coverage | Without Coverage |
| Under 6 Years | 64 (100.0%) | 0 (0.0%) |
| 6 to 18 Years | 163 (93.1%) | 12 (6.9%) |
| 19 to 25 Years | 126 (82.4%) | 27 (17.6%) |
| 26 to 34 Years | 45 (61.6%) | 28 (38.4%) |
| 35 to 44 Years | 47 (54.6%) | 39 (45.4%) |
| 45 to 54 Years | 89 (72.4%) | 34 (27.6%) |
| 55 to 64 Years | 46 (100.0%) | 0 (0.0%) |
| 65 to 74 Years | 16 (100.0%) | 0 (0.0%) |
| 75 Years and older | 30 (100.0%) | 0 (0.0%) |
| Total | 626 (81.7%) | 140 (18.3%) |
Health Insurance Coverage by Citizenship Status in Matheny
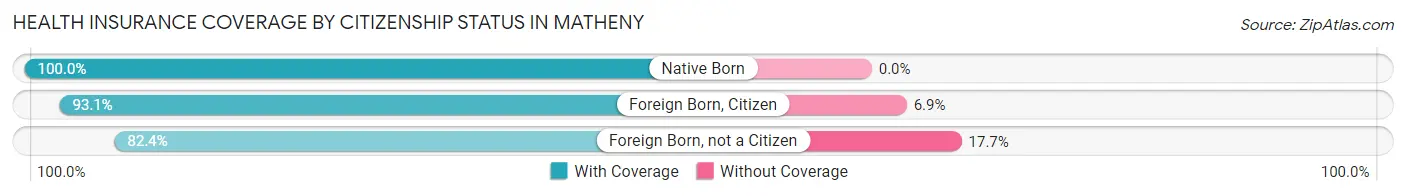
| Citizenship Status | With Coverage | Without Coverage |
| Native Born | 64 (100.0%) | 0 (0.0%) |
| Foreign Born, Citizen | 163 (93.1%) | 12 (6.9%) |
| Foreign Born, not a Citizen | 126 (82.4%) | 27 (17.6%) |
Health Insurance Coverage by Household Income in Matheny
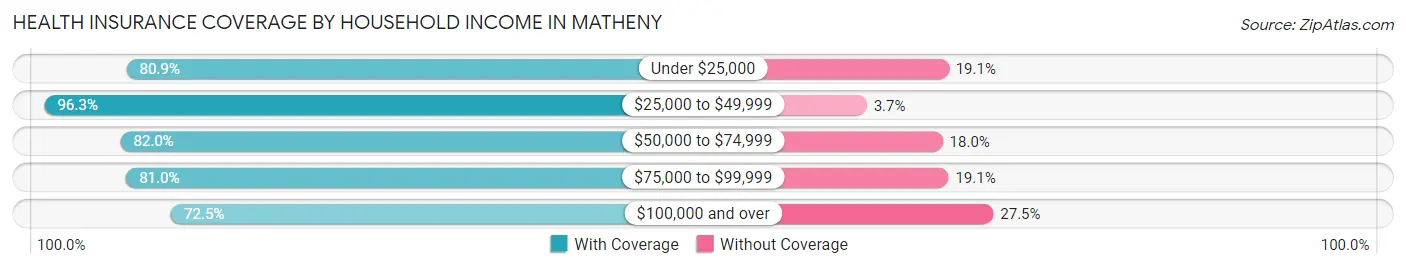
| Household Income | With Coverage | Without Coverage |
| Under $25,000 | 72 (80.9%) | 17 (19.1%) |
| $25,000 to $49,999 | 155 (96.3%) | 6 (3.7%) |
| $50,000 to $74,999 | 137 (82.0%) | 30 (18.0%) |
| $75,000 to $99,999 | 85 (80.9%) | 20 (19.1%) |
| $100,000 and over | 177 (72.5%) | 67 (27.5%) |
Public vs Private Health Insurance Coverage by Age in Matheny
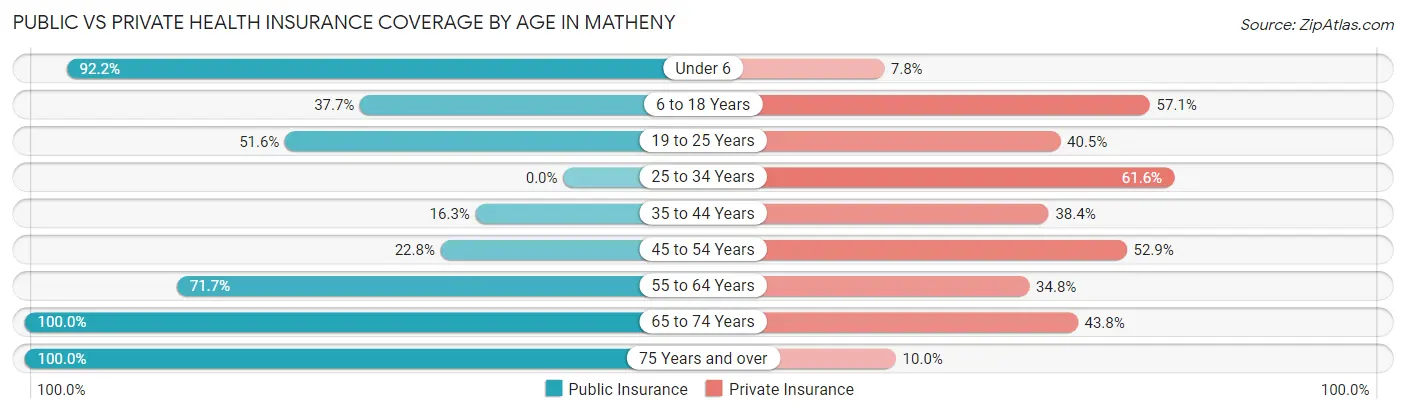
| Age Bracket | Public Insurance | Private Insurance |
| Under 6 | 59 (92.2%) | 5 (7.8%) |
| 6 to 18 Years | 66 (37.7%) | 100 (57.1%) |
| 19 to 25 Years | 79 (51.6%) | 62 (40.5%) |
| 25 to 34 Years | 0 (0.0%) | 45 (61.6%) |
| 35 to 44 Years | 14 (16.3%) | 33 (38.4%) |
| 45 to 54 Years | 28 (22.8%) | 65 (52.8%) |
| 55 to 64 Years | 33 (71.7%) | 16 (34.8%) |
| 65 to 74 Years | 16 (100.0%) | 7 (43.8%) |
| 75 Years and over | 30 (100.0%) | 3 (10.0%) |
| Total | 325 (42.4%) | 336 (43.9%) |
Disability Status by Sex by Age in Matheny
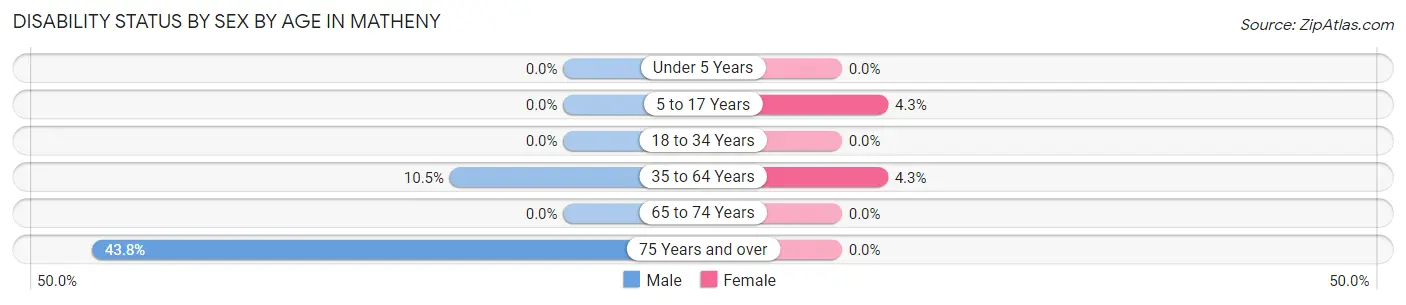
| Age Bracket | Male | Female |
| Under 5 Years | 0 (0.0%) | 0 (0.0%) |
| 5 to 17 Years | 0 (0.0%) | 3 (4.3%) |
| 18 to 34 Years | 0 (0.0%) | 0 (0.0%) |
| 35 to 64 Years | 12 (10.5%) | 6 (4.3%) |
| 65 to 74 Years | 0 (0.0%) | 0 (0.0%) |
| 75 Years and over | 7 (43.8%) | 0 (0.0%) |
Disability Class by Sex by Age in Matheny
Disability Class: Hearing Difficulty
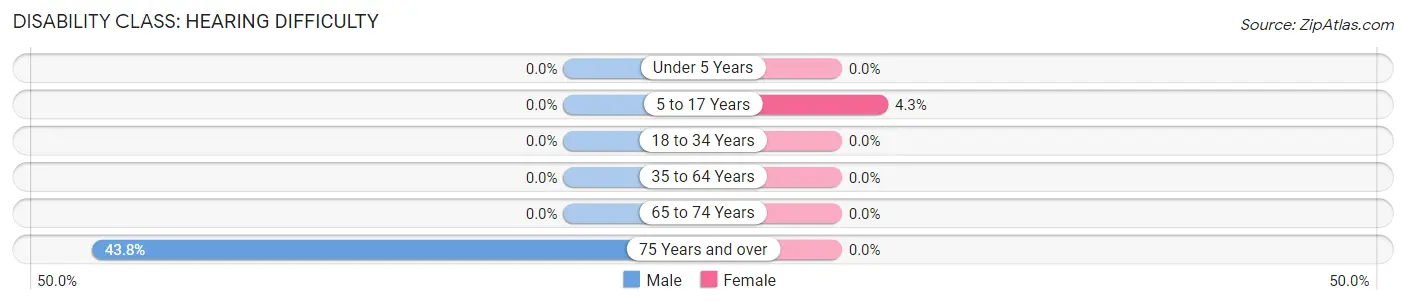
| Age Bracket | Male | Female |
| Under 5 Years | 0 (0.0%) | 0 (0.0%) |
| 5 to 17 Years | 0 (0.0%) | 3 (4.3%) |
| 18 to 34 Years | 0 (0.0%) | 0 (0.0%) |
| 35 to 64 Years | 0 (0.0%) | 0 (0.0%) |
| 65 to 74 Years | 0 (0.0%) | 0 (0.0%) |
| 75 Years and over | 7 (43.8%) | 0 (0.0%) |
Disability Class: Vision Difficulty
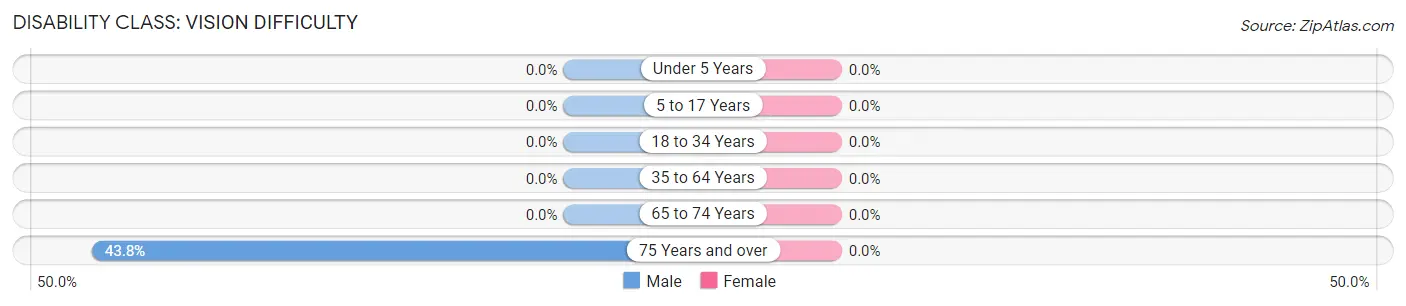
| Age Bracket | Male | Female |
| Under 5 Years | 0 (0.0%) | 0 (0.0%) |
| 5 to 17 Years | 0 (0.0%) | 0 (0.0%) |
| 18 to 34 Years | 0 (0.0%) | 0 (0.0%) |
| 35 to 64 Years | 0 (0.0%) | 0 (0.0%) |
| 65 to 74 Years | 0 (0.0%) | 0 (0.0%) |
| 75 Years and over | 7 (43.8%) | 0 (0.0%) |
Disability Class: Cognitive Difficulty
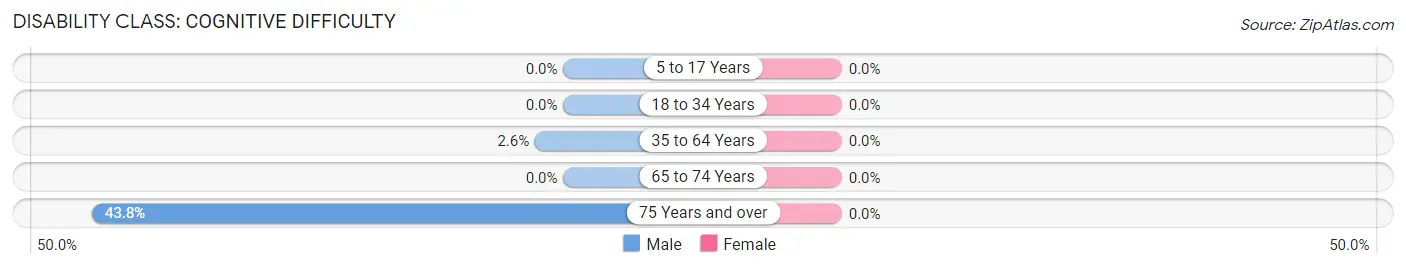
| Age Bracket | Male | Female |
| 5 to 17 Years | 0 (0.0%) | 0 (0.0%) |
| 18 to 34 Years | 0 (0.0%) | 0 (0.0%) |
| 35 to 64 Years | 3 (2.6%) | 0 (0.0%) |
| 65 to 74 Years | 0 (0.0%) | 0 (0.0%) |
| 75 Years and over | 7 (43.8%) | 0 (0.0%) |
Disability Class: Ambulatory Difficulty
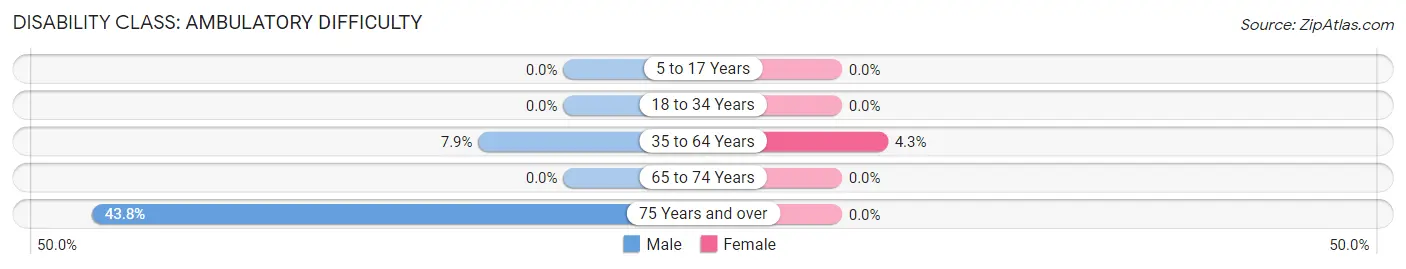
| Age Bracket | Male | Female |
| 5 to 17 Years | 0 (0.0%) | 0 (0.0%) |
| 18 to 34 Years | 0 (0.0%) | 0 (0.0%) |
| 35 to 64 Years | 9 (7.9%) | 6 (4.3%) |
| 65 to 74 Years | 0 (0.0%) | 0 (0.0%) |
| 75 Years and over | 7 (43.8%) | 0 (0.0%) |
Disability Class: Self-Care Difficulty
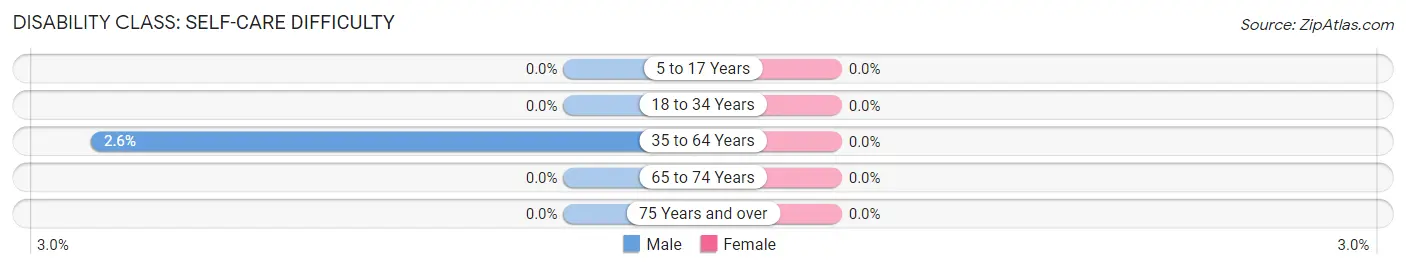
| Age Bracket | Male | Female |
| 5 to 17 Years | 0 (0.0%) | 0 (0.0%) |
| 18 to 34 Years | 0 (0.0%) | 0 (0.0%) |
| 35 to 64 Years | 3 (2.6%) | 0 (0.0%) |
| 65 to 74 Years | 0 (0.0%) | 0 (0.0%) |
| 75 Years and over | 0 (0.0%) | 0 (0.0%) |
Technology Access in Matheny
Computing Device Access in Matheny
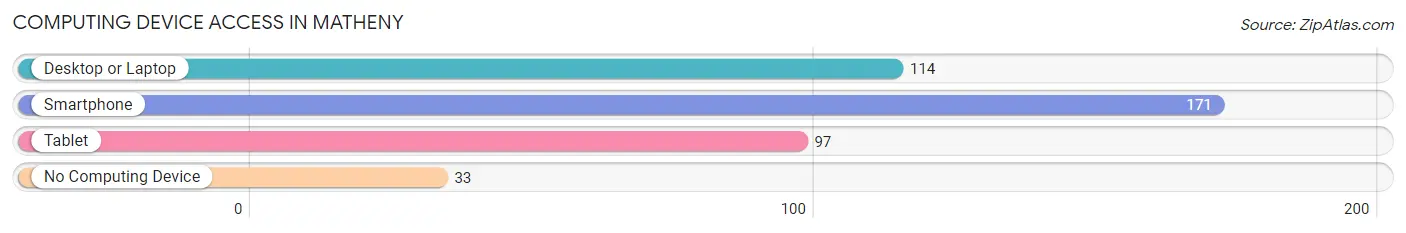
| Device Type | # Households | % Households |
| Desktop or Laptop | 114 | 55.1% |
| Smartphone | 171 | 82.6% |
| Tablet | 97 | 46.9% |
| No Computing Device | 33 | 15.9% |
| Total | 207 | 100.0% |
Internet Access in Matheny
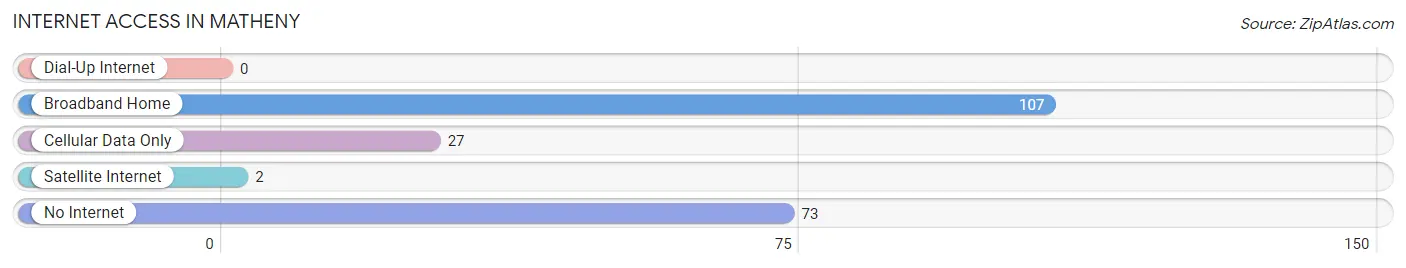
| Internet Type | # Households | % Households |
| Dial-Up Internet | 0 | 0.0% |
| Broadband Home | 107 | 51.7% |
| Cellular Data Only | 27 | 13.0% |
| Satellite Internet | 2 | 1.0% |
| No Internet | 73 | 35.3% |
| Total | 207 | 100.0% |
Matheny Summary
History
Matheny is a small unincorporated community located in the foothills of the Sierra Nevada Mountains in El Dorado County, California. It is situated in the Sierra Nevada foothills, approximately 8 miles east of Placerville and about 40 miles east of Sacramento. The area was first settled in the late 1800s by miners and ranchers, and the town was officially established in 1891.
The town was named after the Matheny family, who were among the first settlers in the area. The Mathenys were originally from Missouri and had moved to California in search of gold. They eventually settled in the area and established a ranch, which became the center of the town.
The town grew slowly over the years, and by the early 1900s it had a population of around 200 people. The town was home to a post office, a general store, a blacksmith shop, a school, and several churches.
Geography
Matheny is located in the Sierra Nevada foothills, approximately 8 miles east of Placerville and about 40 miles east of Sacramento. The town is situated at an elevation of 2,400 feet, and the surrounding area is characterized by rolling hills and oak woodlands. The climate is mild, with hot summers and cool winters.
The town is located in the El Dorado National Forest, and the surrounding area is home to a variety of wildlife, including deer, bear, and mountain lions. The area is also popular with hikers, campers, and other outdoor enthusiasts.
Economy
The economy of Matheny is largely based on agriculture and tourism. The town is home to several small farms, which produce a variety of fruits and vegetables, as well as hay and other crops. The town is also home to several wineries, which produce a variety of wines.
The town is also a popular tourist destination, and the surrounding area is home to several popular attractions, including the El Dorado National Forest, the Apple Hill Growers Association, and the historic town of Placerville.
Demographics
As of the 2010 census, the population of Matheny was 545. The racial makeup of the town was 94.3% White, 0.7% African American, 0.7% Native American, 0.7% Asian, 0.7% Pacific Islander, and 2.7% from other races. The median household income was $50,000, and the median age was 44.
Conclusion
Matheny is a small unincorporated community located in the Sierra Nevada foothills of El Dorado County, California. It was first settled in the late 1800s by miners and ranchers, and the town was officially established in 1891. The economy of Matheny is largely based on agriculture and tourism, and the town is home to several small farms, wineries, and popular attractions. As of the 2010 census, the population of Matheny was 545.
Common Questions
What is Per Capita Income in Matheny?
Per Capita income in Matheny is $24,365.
What is the Median Family Income in Matheny?
Median Family Income in Matheny is $66,411.
What is the Median Household income in Matheny?
Median Household Income in Matheny is $65,927.
What is Income or Wage Gap in Matheny?
Income or Wage Gap in Matheny is 36.1%.
Women in Matheny earn 63.9 cents for every dollar earned by a man.
What is Inequality or Gini Index in Matheny?
Inequality or Gini Index in Matheny is 0.44.
What is the Total Population of Matheny?
Total Population of Matheny is 766.
What is the Total Male Population of Matheny?
Total Male Population of Matheny is 414.
What is the Total Female Population of Matheny?
Total Female Population of Matheny is 352.
What is the Ratio of Males per 100 Females in Matheny?
There are 117.61 Males per 100 Females in Matheny.
What is the Ratio of Females per 100 Males in Matheny?
There are 85.02 Females per 100 Males in Matheny.
What is the Median Population Age in Matheny?
Median Population Age in Matheny is 25.0 Years.
What is the Average Family Size in Matheny
Average Family Size in Matheny is 4.1 People.
What is the Average Household Size in Matheny
Average Household Size in Matheny is 3.7 People.
How Large is the Labor Force in Matheny?
There are 395 People in the Labor Forcein in Matheny.
What is the Percentage of People in the Labor Force in Matheny?
68.5% of People are in the Labor Force in Matheny.
What is the Unemployment Rate in Matheny?
Unemployment Rate in Matheny is 4.1%.