Cities with the Highest Percentage of Population with a Degree in Physical and Health Sciences in Ohio
RELATED REPORTS & OPTIONS
Physical and Health Sciences
Ohio
Compare Cities
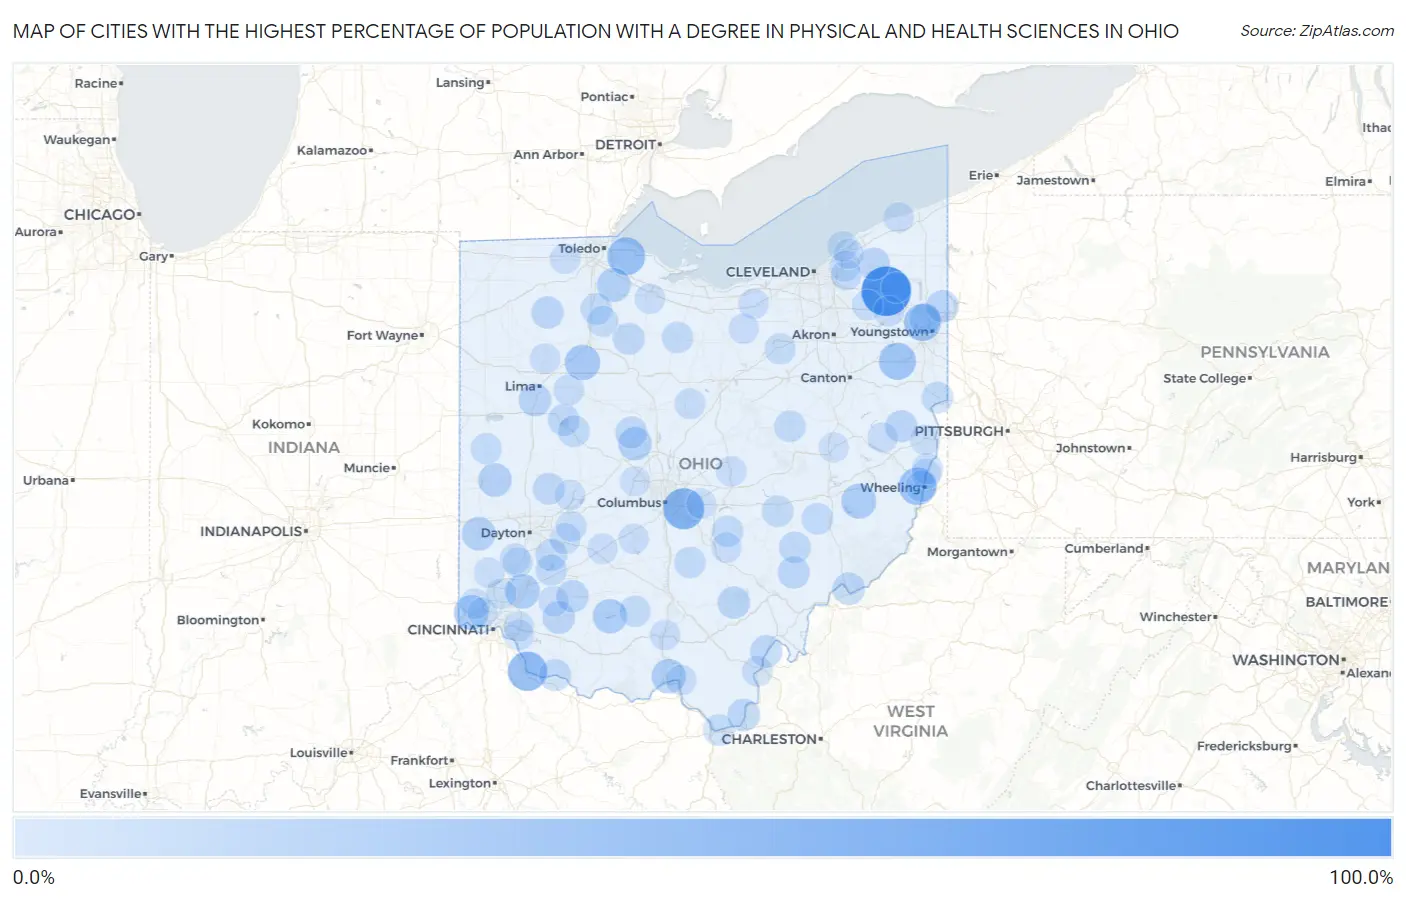
Map of Cities with the Highest Percentage of Population with a Degree in Physical and Health Sciences in Ohio
0.0%
100.0%
Cities with the Highest Percentage of Population with a Degree in Physical and Health Sciences in Ohio
| City | % Graduates | vs State | vs National | |
| 1. | Parkman | 100.0% | 3.0%(+97.0)#1 | 3.1%(+96.9)#20 |
| 2. | Brice | 58.0% | 3.0%(+55.0)#2 | 3.1%(+54.9)#53 |
| 3. | Neville | 50.0% | 3.0%(+47.0)#3 | 3.1%(+46.9)#94 |
| 4. | Williston | 43.3% | 3.0%(+40.4)#4 | 3.1%(+40.2)#125 |
| 5. | Wolfhurst | 41.0% | 3.0%(+38.0)#5 | 3.1%(+37.9)#130 |
| 6. | Hilltop | 39.3% | 3.0%(+36.3)#6 | 3.1%(+36.2)#147 |
| 7. | Damascus | 38.8% | 3.0%(+35.8)#7 | 3.1%(+35.7)#155 |
| 8. | Jenera | 31.6% | 3.0%(+28.6)#8 | 3.1%(+28.5)#231 |
| 9. | Quaker City | 29.2% | 3.0%(+26.2)#9 | 3.1%(+26.1)#275 |
| 10. | Miamitown | 28.7% | 3.0%(+25.7)#10 | 3.1%(+25.6)#283 |
| 11. | Guilford Lake | 28.3% | 3.0%(+25.3)#11 | 3.1%(+25.2)#297 |
| 12. | Kings Mills | 27.8% | 3.0%(+24.8)#12 | 3.1%(+24.7)#305 |
| 13. | Rosemount | 27.2% | 3.0%(+24.2)#13 | 3.1%(+24.1)#318 |
| 14. | Rocky Fork Point | 26.7% | 3.0%(+23.7)#14 | 3.1%(+23.6)#328 |
| 15. | Pemberville | 24.8% | 3.0%(+21.8)#15 | 3.1%(+21.7)#396 |
| 16. | Eaton | 23.5% | 3.0%(+20.5)#16 | 3.1%(+20.4)#426 |
| 17. | Gettysburg | 23.3% | 3.0%(+20.3)#17 | 3.1%(+20.2)#435 |
| 18. | Magnetic Springs | 22.6% | 3.0%(+19.6)#18 | 3.1%(+19.5)#452 |
| 19. | Newport Cdp Washington County | 20.5% | 3.0%(+17.5)#19 | 3.1%(+17.4)#522 |
| 20. | Cridersville | 19.3% | 3.0%(+16.4)#20 | 3.1%(+16.2)#577 |
| 21. | Fayetteville | 18.2% | 3.0%(+15.2)#21 | 3.1%(+15.1)#632 |
| 22. | Reno | 18.0% | 3.0%(+15.0)#22 | 3.1%(+14.9)#642 |
| 23. | Zaleski | 17.9% | 3.0%(+14.9)#23 | 3.1%(+14.8)#650 |
| 24. | Athalia | 17.5% | 3.0%(+14.5)#24 | 3.1%(+14.4)#669 |
| 25. | Yankee Lake | 17.4% | 3.0%(+14.4)#25 | 3.1%(+14.3)#682 |
| 26. | Hamler | 17.3% | 3.0%(+14.3)#26 | 3.1%(+14.2)#683 |
| 27. | Martinsville | 17.1% | 3.0%(+14.1)#27 | 3.1%(+14.0)#693 |
| 28. | Aquilla | 16.7% | 3.0%(+13.7)#28 | 3.1%(+13.6)#726 |
| 29. | Cheshire | 16.7% | 3.0%(+13.7)#29 | 3.1%(+13.6)#741 |
| 30. | Amsterdam | 16.2% | 3.0%(+13.3)#30 | 3.1%(+13.1)#771 |
| 31. | Chesterhill | 16.1% | 3.0%(+13.2)#31 | 3.1%(+13.0)#778 |
| 32. | Spring Valley | 15.6% | 3.0%(+12.7)#32 | 3.1%(+12.5)#813 |
| 33. | New Riegel | 15.6% | 3.0%(+12.7)#33 | 3.1%(+12.5)#814 |
| 34. | Christiansburg | 15.4% | 3.0%(+12.4)#34 | 3.1%(+12.3)#825 |
| 35. | Higginsport | 15.4% | 3.0%(+12.4)#35 | 3.1%(+12.3)#829 |
| 36. | Richwood | 14.9% | 3.0%(+12.0)#36 | 3.1%(+11.8)#877 |
| 37. | Mckinley Heights | 14.9% | 3.0%(+12.0)#37 | 3.1%(+11.8)#882 |
| 38. | Malta | 14.9% | 3.0%(+11.9)#38 | 3.1%(+11.8)#888 |
| 39. | Chippewa Park | 14.6% | 3.0%(+11.7)#39 | 3.1%(+11.5)#913 |
| 40. | Lake Buckhorn | 14.1% | 3.0%(+11.1)#40 | 3.1%(+11.0)#986 |
| 41. | South Zanesville | 14.1% | 3.0%(+11.1)#41 | 3.1%(+11.0)#987 |
| 42. | North Industry | 14.0% | 3.0%(+11.1)#42 | 3.1%(+10.9)#990 |
| 43. | Glenmoor | 14.0% | 3.0%(+11.0)#43 | 3.1%(+10.9)#994 |
| 44. | Huntsville | 14.0% | 3.0%(+11.0)#44 | 3.1%(+10.9)#996 |
| 45. | Cumberland | 13.8% | 3.0%(+10.8)#45 | 3.1%(+10.7)#1,009 |
| 46. | West Rushville | 13.6% | 3.0%(+10.7)#46 | 3.1%(+10.5)#1,025 |
| 47. | Jerry City | 13.5% | 3.0%(+10.6)#47 | 3.1%(+10.4)#1,036 |
| 48. | Burlington | 13.3% | 3.0%(+10.3)#48 | 3.1%(+10.2)#1,064 |
| 49. | Attica | 13.2% | 3.0%(+10.3)#49 | 3.1%(+10.1)#1,071 |
| 50. | Tarlton | 12.9% | 3.0%(+9.94)#50 | 3.1%(+9.80)#1,116 |
| 51. | Harveysburg | 12.7% | 3.0%(+9.75)#51 | 3.1%(+9.61)#1,133 |
| 52. | Bainbridge | 12.3% | 3.0%(+9.35)#52 | 3.1%(+9.21)#1,184 |
| 53. | Bridgeport | 12.0% | 3.0%(+9.02)#53 | 3.1%(+8.88)#1,222 |
| 54. | Rayland | 11.8% | 3.0%(+8.81)#54 | 3.1%(+8.66)#1,252 |
| 55. | Burbank | 11.8% | 3.0%(+8.81)#55 | 3.1%(+8.66)#1,255 |
| 56. | North Star | 11.8% | 3.0%(+8.81)#56 | 3.1%(+8.66)#1,259 |
| 57. | Bloomdale | 11.4% | 3.0%(+8.41)#57 | 3.1%(+8.26)#1,319 |
| 58. | Candlewood Lake | 10.9% | 3.0%(+7.94)#58 | 3.1%(+7.80)#1,389 |
| 59. | West Logan | 10.8% | 3.0%(+7.85)#59 | 3.1%(+7.71)#1,412 |
| 60. | Wilberforce | 10.8% | 3.0%(+7.84)#60 | 3.1%(+7.70)#1,414 |
| 61. | Mantua | 10.5% | 3.0%(+7.57)#61 | 3.1%(+7.43)#1,463 |
| 62. | Gallipolis | 10.5% | 3.0%(+7.54)#62 | 3.1%(+7.40)#1,479 |
| 63. | Gates Mills | 10.3% | 3.0%(+7.31)#63 | 3.1%(+7.17)#1,539 |
| 64. | Windham | 10.2% | 3.0%(+7.27)#64 | 3.1%(+7.13)#1,554 |
| 65. | Clifton | 10.2% | 3.0%(+7.25)#65 | 3.1%(+7.10)#1,562 |
| 66. | Hunting Valley | 9.9% | 3.0%(+6.98)#66 | 3.1%(+6.84)#1,632 |
| 67. | Alger | 9.7% | 3.0%(+6.72)#67 | 3.1%(+6.58)#1,677 |
| 68. | Carlisle | 9.6% | 3.0%(+6.68)#68 | 3.1%(+6.54)#1,693 |
| 69. | Columbus Grove | 9.5% | 3.0%(+6.57)#69 | 3.1%(+6.42)#1,715 |
| 70. | St Louisville | 9.5% | 3.0%(+6.57)#70 | 3.1%(+6.42)#1,721 |
| 71. | New Baltimore | 9.4% | 3.0%(+6.44)#71 | 3.1%(+6.30)#1,752 |
| 72. | Withamsville | 9.4% | 3.0%(+6.42)#72 | 3.1%(+6.28)#1,758 |
| 73. | Mount Sterling | 9.4% | 3.0%(+6.42)#73 | 3.1%(+6.28)#1,760 |
| 74. | Tremont City | 9.4% | 3.0%(+6.42)#74 | 3.1%(+6.28)#1,761 |
| 75. | Oberlin | 9.3% | 3.0%(+6.37)#75 | 3.1%(+6.23)#1,774 |
| 76. | Swanton | 9.2% | 3.0%(+6.26)#76 | 3.1%(+6.12)#1,813 |
| 77. | Hide A Way Hills | 9.2% | 3.0%(+6.24)#77 | 3.1%(+6.10)#1,816 |
| 78. | Blanchester | 9.0% | 3.0%(+6.07)#78 | 3.1%(+5.93)#1,881 |
| 79. | Jeffersonville | 8.9% | 3.0%(+5.93)#79 | 3.1%(+5.79)#1,927 |
| 80. | West Farmington | 8.9% | 3.0%(+5.93)#80 | 3.1%(+5.79)#1,929 |
| 81. | Piketon | 8.9% | 3.0%(+5.90)#81 | 3.1%(+5.76)#1,934 |
| 82. | Scio | 8.7% | 3.0%(+5.74)#82 | 3.1%(+5.60)#1,979 |
| 83. | Rochester | 8.7% | 3.0%(+5.74)#83 | 3.1%(+5.60)#1,992 |
| 84. | Sciotodale | 8.5% | 3.0%(+5.57)#84 | 3.1%(+5.43)#2,045 |
| 85. | Geneva On The Lake | 8.5% | 3.0%(+5.55)#85 | 3.1%(+5.41)#2,048 |
| 86. | Ballville | 8.4% | 3.0%(+5.47)#86 | 3.1%(+5.33)#2,077 |
| 87. | Summerside | 8.3% | 3.0%(+5.31)#87 | 3.1%(+5.17)#2,136 |
| 88. | Timberlake | 8.2% | 3.0%(+5.23)#88 | 3.1%(+5.09)#2,155 |
| 89. | Beckett Ridge | 8.1% | 3.0%(+5.17)#89 | 3.1%(+5.03)#2,176 |
| 90. | Seven Mile | 8.1% | 3.0%(+5.12)#90 | 3.1%(+4.98)#2,199 |
| 91. | Bidwell | 8.0% | 3.0%(+5.04)#91 | 3.1%(+4.90)#2,236 |
| 92. | Etna | 8.0% | 3.0%(+5.04)#92 | 3.1%(+4.90)#2,237 |
| 93. | Port Washington | 8.0% | 3.0%(+5.04)#93 | 3.1%(+4.90)#2,239 |
| 94. | Plain City | 7.9% | 3.0%(+4.94)#94 | 3.1%(+4.80)#2,271 |
| 95. | Franklin | 7.8% | 3.0%(+4.83)#95 | 3.1%(+4.69)#2,329 |
| 96. | Waite Hill | 7.7% | 3.0%(+4.73)#96 | 3.1%(+4.59)#2,374 |
| 97. | Wintersville | 7.6% | 3.0%(+4.60)#97 | 3.1%(+4.46)#2,449 |
| 98. | Suffield | 7.4% | 3.0%(+4.47)#98 | 3.1%(+4.33)#2,511 |
| 99. | Yorkville | 7.3% | 3.0%(+4.36)#99 | 3.1%(+4.22)#2,568 |
| 100. | White Oak | 7.3% | 3.0%(+4.36)#100 | 3.1%(+4.21)#2,577 |
Common Questions
What are the Top 10 Cities with the Highest Percentage of Population with a Degree in Physical and Health Sciences in Ohio?
Top 10 Cities with the Highest Percentage of Population with a Degree in Physical and Health Sciences in Ohio are:
What city has the Highest Percentage of Population with a Degree in Physical and Health Sciences in Ohio?
Parkman has the Highest Percentage of Population with a Degree in Physical and Health Sciences in Ohio with 100.0%.
What is the Percentage of Population with a Degree in Physical and Health Sciences in the State of Ohio?
Percentage of Population with a Degree in Physical and Health Sciences in Ohio is 3.0%.
What is the Percentage of Population with a Degree in Physical and Health Sciences in the United States?
Percentage of Population with a Degree in Physical and Health Sciences in the United States is 3.1%.