Zip Codes with the Highest Percentage of Population with a Degree in Physical and Health Sciences in La Puente, CA
RELATED REPORTS & OPTIONS
Physical and Health Sciences
La Puente
Compare Zip Codes
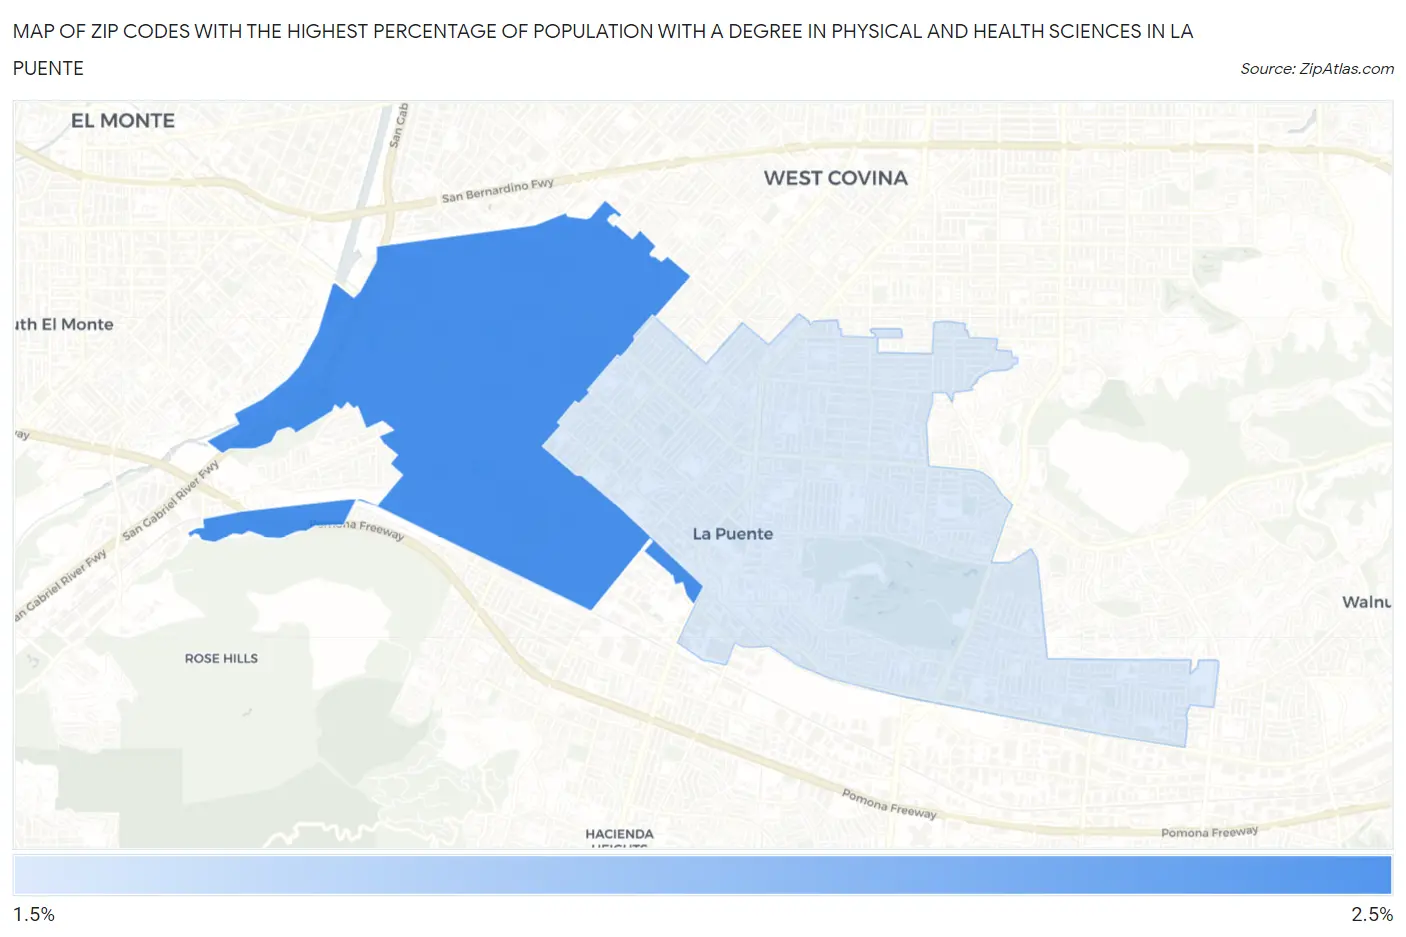
Map of Zip Codes with the Highest Percentage of Population with a Degree in Physical and Health Sciences in La Puente
1.6%
2.4%
Zip Codes with the Highest Percentage of Population with a Degree in Physical and Health Sciences in La Puente, CA
| Zip Code | % Graduates | vs State | vs National | |
| 1. | 91746 | 2.4% | 3.1%(-0.697)#840 | 3.1%(-0.682)#13,097 |
| 2. | 91744 | 1.6% | 3.1%(-1.56)#1,144 | 3.1%(-1.54)#17,063 |
1
Common Questions
What are the Top Zip Codes with the Highest Percentage of Population with a Degree in Physical and Health Sciences in La Puente, CA?
Top Zip Codes with the Highest Percentage of Population with a Degree in Physical and Health Sciences in La Puente, CA are:
What zip code has the Highest Percentage of Population with a Degree in Physical and Health Sciences in La Puente, CA?
91746 has the Highest Percentage of Population with a Degree in Physical and Health Sciences in La Puente, CA with 2.4%.
What is the Percentage of Population with a Degree in Physical and Health Sciences in La Puente, CA?
Percentage of Population with a Degree in Physical and Health Sciences in La Puente is 1.6%.
What is the Percentage of Population with a Degree in Physical and Health Sciences in California?
Percentage of Population with a Degree in Physical and Health Sciences in California is 3.1%.
What is the Percentage of Population with a Degree in Physical and Health Sciences in the United States?
Percentage of Population with a Degree in Physical and Health Sciences in the United States is 3.1%.