Zip Codes with the Highest Percentage of Population with a Degree in Physical and Health Sciences in Manteca, CA
RELATED REPORTS & OPTIONS
Physical and Health Sciences
Manteca
Compare Zip Codes
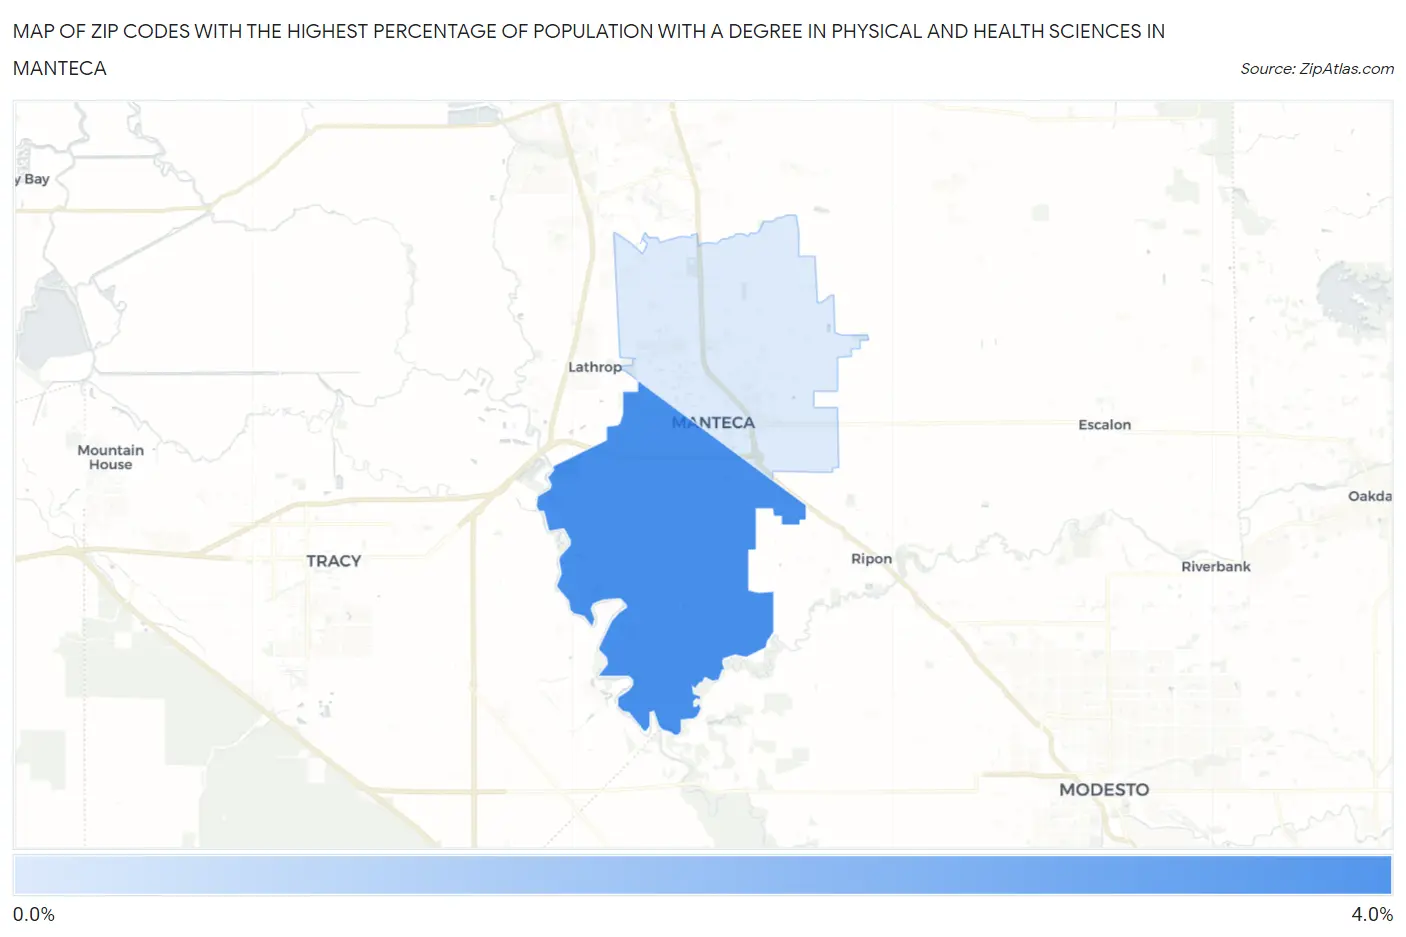
Map of Zip Codes with the Highest Percentage of Population with a Degree in Physical and Health Sciences in Manteca
0.74%
3.6%
Zip Codes with the Highest Percentage of Population with a Degree in Physical and Health Sciences in Manteca, CA
| Zip Code | % Graduates | vs State | vs National | |
| 1. | 95337 | 3.6% | 3.1%(+0.509)#443 | 3.1%(+0.525)#7,973 |
| 2. | 95336 | 0.74% | 3.1%(-2.38)#1,306 | 3.1%(-2.36)#20,034 |
1
Common Questions
What are the Top Zip Codes with the Highest Percentage of Population with a Degree in Physical and Health Sciences in Manteca, CA?
Top Zip Codes with the Highest Percentage of Population with a Degree in Physical and Health Sciences in Manteca, CA are:
What zip code has the Highest Percentage of Population with a Degree in Physical and Health Sciences in Manteca, CA?
95337 has the Highest Percentage of Population with a Degree in Physical and Health Sciences in Manteca, CA with 3.6%.
What is the Percentage of Population with a Degree in Physical and Health Sciences in Manteca, CA?
Percentage of Population with a Degree in Physical and Health Sciences in Manteca is 1.7%.
What is the Percentage of Population with a Degree in Physical and Health Sciences in California?
Percentage of Population with a Degree in Physical and Health Sciences in California is 3.1%.
What is the Percentage of Population with a Degree in Physical and Health Sciences in the United States?
Percentage of Population with a Degree in Physical and Health Sciences in the United States is 3.1%.