Cities with the Highest Percentage of Population with a Degree in Physical and Health Sciences in Vermont
RELATED REPORTS & OPTIONS
Physical and Health Sciences
Vermont
Compare Cities
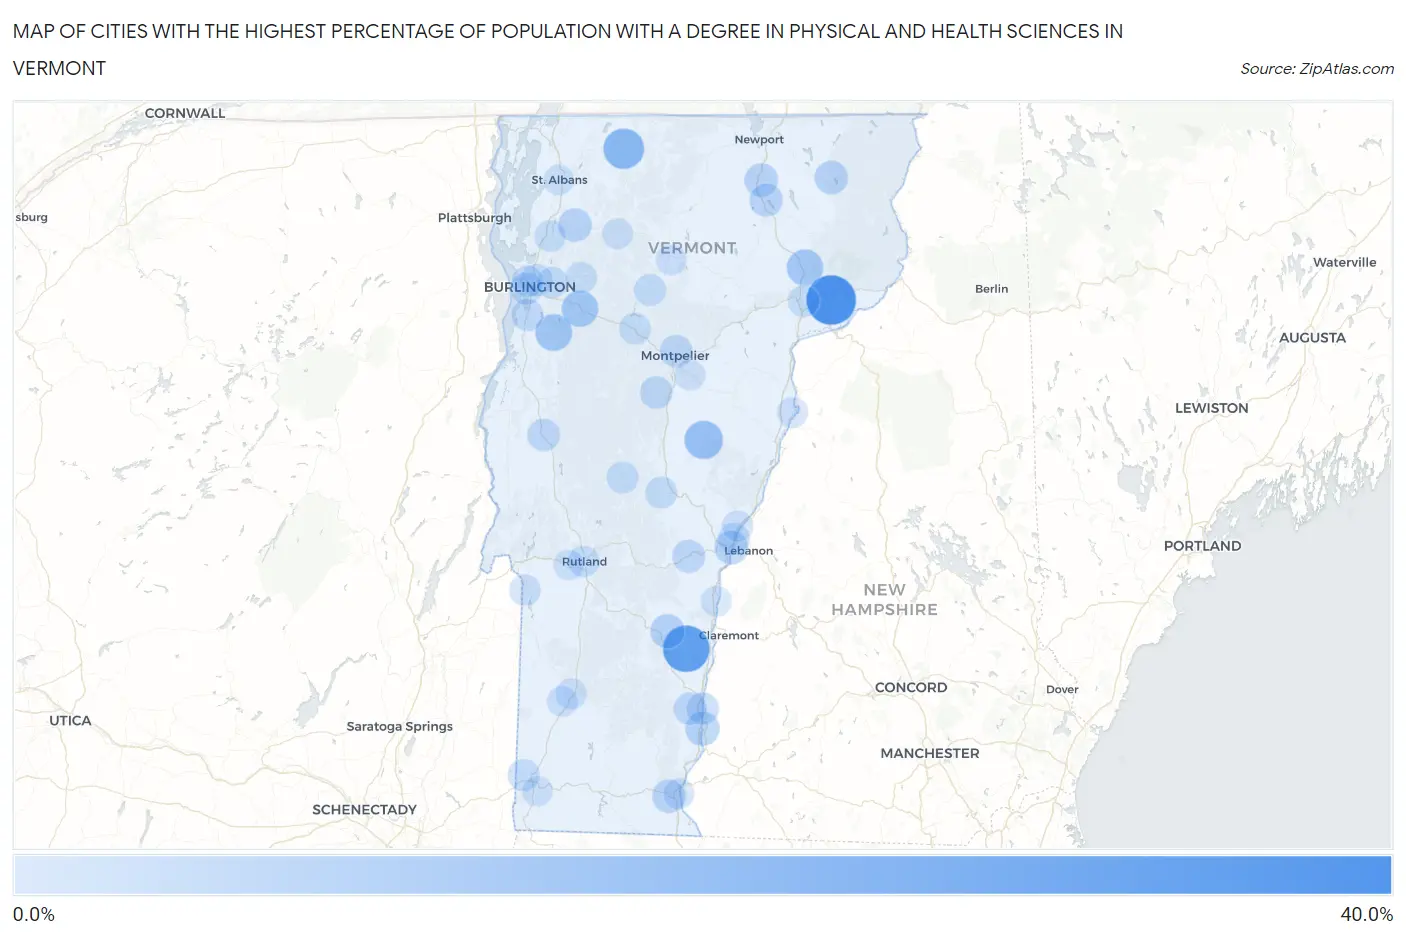
Map of Cities with the Highest Percentage of Population with a Degree in Physical and Health Sciences in Vermont
0.0%
40.0%
Cities with the Highest Percentage of Population with a Degree in Physical and Health Sciences in Vermont
| City | % Graduates | vs State | vs National | |
| 1. | Concord | 30.2% | 2.9%(+27.3)#1 | 3.1%(+27.1)#255 |
| 2. | North Springfield | 25.5% | 2.9%(+22.6)#2 | 3.1%(+22.4)#357 |
| 3. | Hanksville | 21.1% | 2.9%(+18.2)#3 | 3.1%(+18.0)#505 |
| 4. | Wardsboro | 18.4% | 2.9%(+15.5)#4 | 3.1%(+15.3)#625 |
| 5. | Weston | 17.6% | 2.9%(+14.8)#5 | 3.1%(+14.5)#663 |
| 6. | Enosburg Falls | 16.0% | 2.9%(+13.1)#6 | 3.1%(+12.9)#785 |
| 7. | Chelsea | 12.6% | 2.9%(+9.76)#7 | 3.1%(+9.54)#1,138 |
| 8. | East Poultney | 11.4% | 2.9%(+8.51)#8 | 3.1%(+8.29)#1,312 |
| 9. | North Clarendon | 10.6% | 2.9%(+7.75)#9 | 3.1%(+7.54)#1,439 |
| 10. | Hinesburg | 10.3% | 2.9%(+7.37)#10 | 3.1%(+7.16)#1,543 |
| 11. | Richmond | 9.6% | 2.9%(+6.70)#11 | 3.1%(+6.49)#1,700 |
| 12. | Lyndonville | 9.5% | 2.9%(+6.59)#12 | 3.1%(+6.38)#1,733 |
| 13. | Cavendish | 6.2% | 2.9%(+3.36)#13 | 3.1%(+3.15)#3,269 |
| 14. | Westminster | 6.1% | 2.9%(+3.22)#14 | 3.1%(+3.01)#3,375 |
| 15. | Peacham | 5.6% | 2.9%(+2.75)#15 | 3.1%(+2.53)#3,774 |
| 16. | White River Junction | 5.4% | 2.9%(+2.50)#16 | 3.1%(+2.28)#4,016 |
| 17. | Fairfax | 5.2% | 2.9%(+2.28)#17 | 3.1%(+2.07)#4,258 |
| 18. | Orleans | 5.1% | 2.9%(+2.18)#18 | 3.1%(+1.96)#4,383 |
| 19. | Island Pond | 5.1% | 2.9%(+2.17)#19 | 3.1%(+1.96)#4,393 |
| 20. | West Brattleboro | 4.9% | 2.9%(+2.02)#20 | 3.1%(+1.81)#4,574 |
| 21. | Barton | 4.8% | 2.9%(+1.87)#21 | 3.1%(+1.66)#4,756 |
| 22. | Danby | 4.4% | 2.9%(+1.56)#22 | 3.1%(+1.34)#5,244 |
| 23. | Woodstock | 4.4% | 2.9%(+1.48)#23 | 3.1%(+1.26)#5,366 |
| 24. | Townshend | 4.1% | 2.9%(+1.17)#24 | 3.1%(+0.954)#5,879 |
| 25. | Montpelier | 4.0% | 2.9%(+1.10)#25 | 3.1%(+0.887)#6,006 |
| 26. | Northfield | 3.8% | 2.9%(+0.935)#26 | 3.1%(+0.722)#6,331 |
| 27. | Bolton Valley | 3.7% | 2.9%(+0.863)#27 | 3.1%(+0.650)#6,481 |
| 28. | Middlebury | 3.7% | 2.9%(+0.812)#28 | 3.1%(+0.599)#6,587 |
| 29. | Saxtons River | 3.7% | 2.9%(+0.783)#29 | 3.1%(+0.570)#6,643 |
| 30. | Bellows Falls | 3.6% | 2.9%(+0.708)#30 | 3.1%(+0.495)#6,803 |
| 31. | Underhill Flats | 3.5% | 2.9%(+0.601)#31 | 3.1%(+0.389)#7,061 |
| 32. | St. George | 3.3% | 2.9%(+0.446)#32 | 3.1%(+0.234)#7,438 |
| 33. | Westford | 3.3% | 2.9%(+0.374)#33 | 3.1%(+0.161)#7,619 |
| 34. | Shelburne | 3.1% | 2.9%(+0.224)#34 | 3.1%(+0.011)#7,987 |
| 35. | Winooski | 3.0% | 2.9%(+0.155)#35 | 3.1%(-0.058)#8,175 |
| 36. | South Burlington | 3.0% | 2.9%(+0.144)#36 | 3.1%(-0.069)#8,192 |
| 37. | Stowe | 2.9% | 2.9%(+0.038)#37 | 3.1%(-0.175)#8,522 |
| 38. | Bethel | 2.9% | 2.9%(+0.012)#38 | 3.1%(-0.201)#8,590 |
| 39. | North Bennington | 2.8% | 2.9%(-0.054)#39 | 3.1%(-0.267)#8,778 |
| 40. | Stamford | 2.8% | 2.9%(-0.090)#40 | 3.1%(-0.303)#8,897 |
| 41. | Rochester | 2.6% | 2.9%(-0.278)#41 | 3.1%(-0.491)#9,492 |
| 42. | Wilder | 2.5% | 2.9%(-0.367)#42 | 3.1%(-0.580)#9,755 |
| 43. | St Johnsbury | 2.5% | 2.9%(-0.372)#43 | 3.1%(-0.585)#9,765 |
| 44. | Waterbury | 2.5% | 2.9%(-0.380)#44 | 3.1%(-0.593)#9,788 |
| 45. | Rutland | 2.4% | 2.9%(-0.497)#45 | 3.1%(-0.710)#10,116 |
| 46. | Burlington | 2.4% | 2.9%(-0.500)#46 | 3.1%(-0.713)#10,126 |
| 47. | Essex Junction | 2.3% | 2.9%(-0.607)#47 | 3.1%(-0.819)#10,449 |
| 48. | Killington | 2.2% | 2.9%(-0.697)#48 | 3.1%(-0.910)#10,720 |
| 49. | Milton | 2.1% | 2.9%(-0.740)#49 | 3.1%(-0.952)#10,850 |
| 50. | Huntington Center | 2.1% | 2.9%(-0.804)#50 | 3.1%(-1.02)#11,031 |
| 51. | Huntington | 2.0% | 2.9%(-0.907)#51 | 3.1%(-1.12)#11,360 |
| 52. | Jericho | 1.8% | 2.9%(-1.13)#52 | 3.1%(-1.34)#12,012 |
| 53. | Poultney | 1.7% | 2.9%(-1.16)#53 | 3.1%(-1.38)#12,121 |
| 54. | Norwich | 1.6% | 2.9%(-1.28)#54 | 3.1%(-1.49)#12,432 |
| 55. | Jeffersonville | 1.5% | 2.9%(-1.43)#55 | 3.1%(-1.64)#12,850 |
| 56. | Newbury | 1.4% | 2.9%(-1.52)#56 | 3.1%(-1.73)#13,079 |
| 57. | Brattleboro | 1.3% | 2.9%(-1.56)#57 | 3.1%(-1.77)#13,165 |
| 58. | Morrisville | 1.3% | 2.9%(-1.62)#58 | 3.1%(-1.83)#13,329 |
| 59. | Proctor | 1.3% | 2.9%(-1.63)#59 | 3.1%(-1.85)#13,357 |
| 60. | Manchester Center | 1.2% | 2.9%(-1.64)#60 | 3.1%(-1.86)#13,385 |
| 61. | Manchester | 1.2% | 2.9%(-1.64)#61 | 3.1%(-1.86)#13,388 |
| 62. | Barre | 1.1% | 2.9%(-1.75)#62 | 3.1%(-1.96)#13,638 |
| 63. | St Albans | 1.1% | 2.9%(-1.76)#63 | 3.1%(-1.97)#13,663 |
| 64. | West Rutland | 1.1% | 2.9%(-1.81)#64 | 3.1%(-2.02)#13,779 |
| 65. | Bennington | 0.91% | 2.9%(-1.98)#65 | 3.1%(-2.19)#14,173 |
| 66. | Windsor | 0.90% | 2.9%(-1.99)#66 | 3.1%(-2.20)#14,189 |
1
2Common Questions
What are the Top 10 Cities with the Highest Percentage of Population with a Degree in Physical and Health Sciences in Vermont?
Top 10 Cities with the Highest Percentage of Population with a Degree in Physical and Health Sciences in Vermont are:
#1
30.2%
#2
25.5%
#3
16.0%
#4
12.6%
#5
10.3%
#6
9.6%
#7
9.5%
#8
6.2%
#9
6.1%
#10
5.4%
What city has the Highest Percentage of Population with a Degree in Physical and Health Sciences in Vermont?
Concord has the Highest Percentage of Population with a Degree in Physical and Health Sciences in Vermont with 30.2%.
What is the Percentage of Population with a Degree in Physical and Health Sciences in the State of Vermont?
Percentage of Population with a Degree in Physical and Health Sciences in Vermont is 2.9%.
What is the Percentage of Population with a Degree in Physical and Health Sciences in the United States?
Percentage of Population with a Degree in Physical and Health Sciences in the United States is 3.1%.