Hornbrook, CA Map & Demographics
Hornbrook Map
Hornbrook Overview
$21,811
PER CAPITA INCOME
$32,404
AVG FAMILY INCOME
$46,607
AVG HOUSEHOLD INCOME
17.6%
WAGE / INCOME GAP [ % ]
82.4¢/ $1
WAGE / INCOME GAP [ $ ]
0.37
INEQUALITY / GINI INDEX
381
TOTAL POPULATION
135
MALE POPULATION
246
FEMALE POPULATION
54.88
MALES / 100 FEMALES
182.22
FEMALES / 100 MALES
34.2
MEDIAN AGE
3.5
AVG FAMILY SIZE
2.6
AVG HOUSEHOLD SIZE
150
LABOR FORCE [ PEOPLE ]
60.2%
PERCENT IN LABOR FORCE
19.3%
UNEMPLOYMENT RATE
Hornbrook Zip Codes
Hornbrook Area Codes
Income in Hornbrook
Income Overview in Hornbrook
Per Capita Income in Hornbrook is $21,811, while median incomes of families and households are $32,404 and $46,607 respectively.
| Characteristic | Number | Measure |
| Per Capita Income | 381 | $21,811 |
| Median Family Income | 76 | $32,404 |
| Mean Family Income | 76 | $53,799 |
| Median Household Income | 145 | $46,607 |
| Mean Household Income | 145 | $54,090 |
| Income Deficit | 76 | $0 |
| Wage / Income Gap (%) | 381 | 17.59% |
| Wage / Income Gap ($) | 381 | 82.41¢ per $1 |
| Gini / Inequality Index | 381 | 0.37 |
Earnings by Sex in Hornbrook
Average Earnings in Hornbrook are $32,008, $36,681 for men and $30,227 for women, a difference of 17.6%.
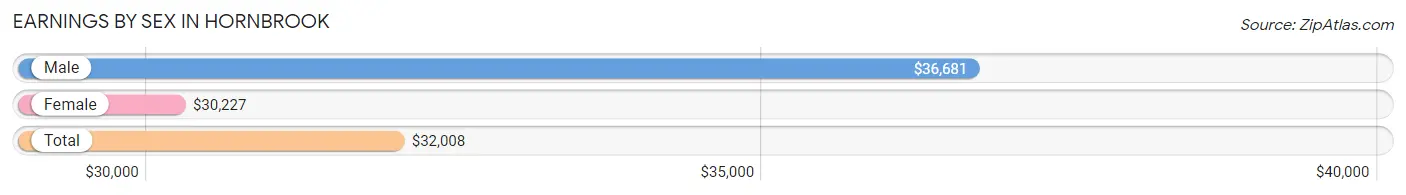
| Sex | Number | Average Earnings |
| Male | 53 (34.2%) | $36,681 |
| Female | 102 (65.8%) | $30,227 |
| Total | 155 (100.0%) | $32,008 |
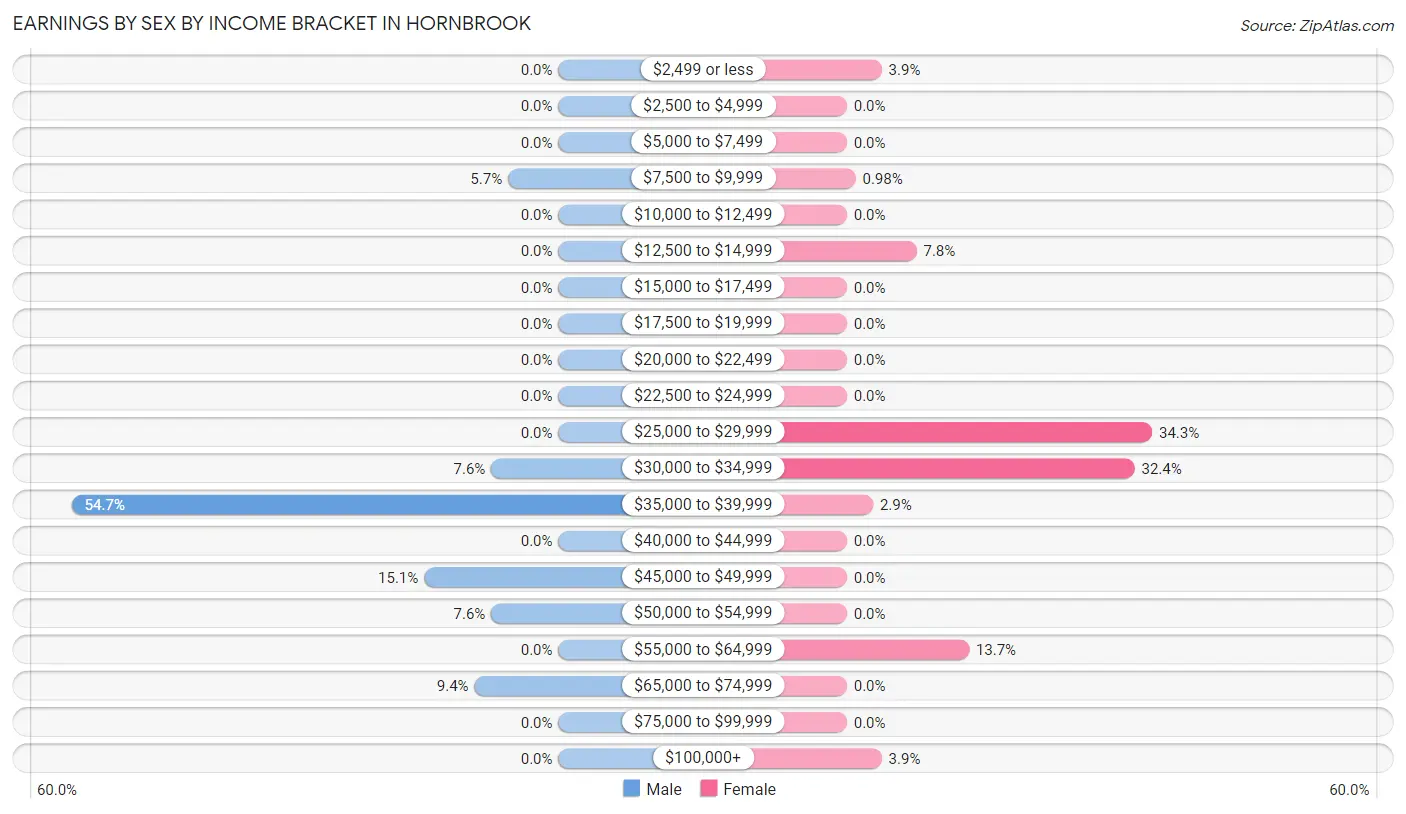
Earnings by Sex by Income Bracket in Hornbrook
The most common earnings brackets in Hornbrook are $35,000 to $39,999 for men (29 | 54.7%) and $25,000 to $29,999 for women (35 | 34.3%).
| Income | Male | Female |
| $2,499 or less | 0 (0.0%) | 4 (3.9%) |
| $2,500 to $4,999 | 0 (0.0%) | 0 (0.0%) |
| $5,000 to $7,499 | 0 (0.0%) | 0 (0.0%) |
| $7,500 to $9,999 | 3 (5.7%) | 1 (1.0%) |
| $10,000 to $12,499 | 0 (0.0%) | 0 (0.0%) |
| $12,500 to $14,999 | 0 (0.0%) | 8 (7.8%) |
| $15,000 to $17,499 | 0 (0.0%) | 0 (0.0%) |
| $17,500 to $19,999 | 0 (0.0%) | 0 (0.0%) |
| $20,000 to $22,499 | 0 (0.0%) | 0 (0.0%) |
| $22,500 to $24,999 | 0 (0.0%) | 0 (0.0%) |
| $25,000 to $29,999 | 0 (0.0%) | 35 (34.3%) |
| $30,000 to $34,999 | 4 (7.5%) | 33 (32.4%) |
| $35,000 to $39,999 | 29 (54.7%) | 3 (2.9%) |
| $40,000 to $44,999 | 0 (0.0%) | 0 (0.0%) |
| $45,000 to $49,999 | 8 (15.1%) | 0 (0.0%) |
| $50,000 to $54,999 | 4 (7.5%) | 0 (0.0%) |
| $55,000 to $64,999 | 0 (0.0%) | 14 (13.7%) |
| $65,000 to $74,999 | 5 (9.4%) | 0 (0.0%) |
| $75,000 to $99,999 | 0 (0.0%) | 0 (0.0%) |
| $100,000+ | 0 (0.0%) | 4 (3.9%) |
| Total | 53 (100.0%) | 102 (100.0%) |
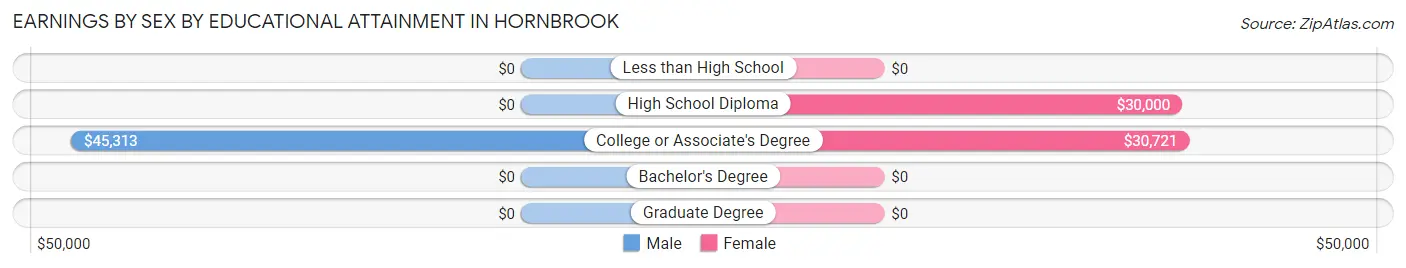
Earnings by Sex by Educational Attainment in Hornbrook
Average earnings in Hornbrook are $45,313 for men and $30,530 for women, a difference of 32.6%. Men with an educational attainment of college or associate's degree enjoy the highest average annual earnings of $45,313, while those with college or associate's degree education earn the least with $45,313. Women with an educational attainment of college or associate's degree earn the most with the average annual earnings of $30,721, while those with high school diploma education have the smallest earnings of $30,000.
| Educational Attainment | Male Income | Female Income |
| Less than High School | - | - |
| High School Diploma | - | - |
| College or Associate's Degree | $45,313 | $30,721 |
| Bachelor's Degree | - | - |
| Graduate Degree | - | - |
| Total | $45,313 | $30,530 |
Family Income in Hornbrook
Family Income Brackets in Hornbrook
According to the Hornbrook family income data, there are 31 families falling into the $25,000 to $34,999 income range, which is the most common income bracket and makes up 40.8% of all families.
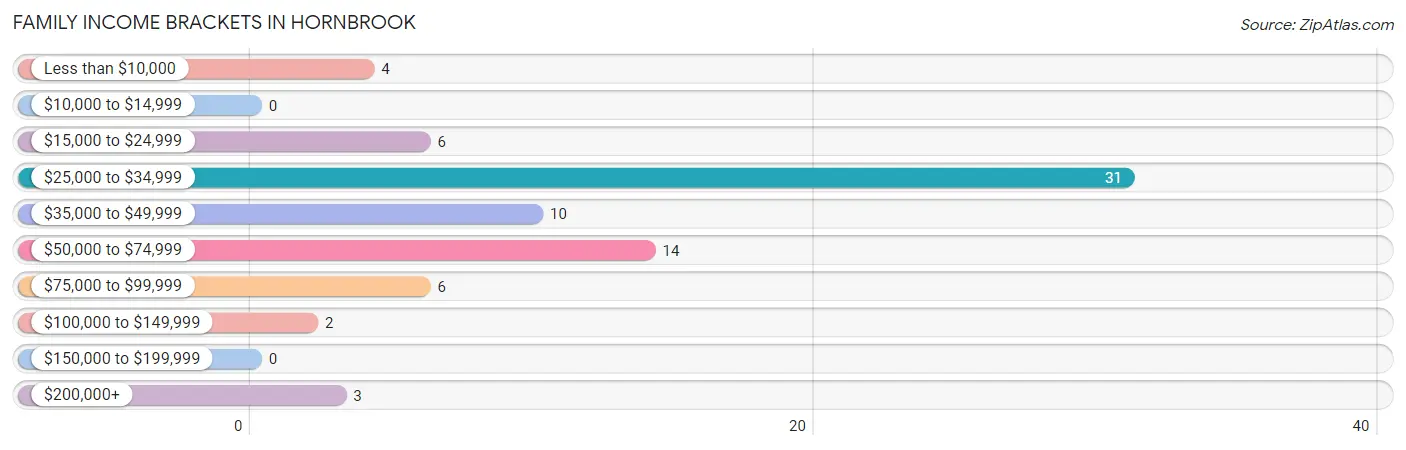
| Income Bracket | # Families | % Families |
| Less than $10,000 | 4 | 5.3% |
| $10,000 to $14,999 | 0 | 0.0% |
| $15,000 to $24,999 | 6 | 7.9% |
| $25,000 to $34,999 | 31 | 40.8% |
| $35,000 to $49,999 | 10 | 13.2% |
| $50,000 to $74,999 | 14 | 18.4% |
| $75,000 to $99,999 | 6 | 7.9% |
| $100,000 to $149,999 | 2 | 2.6% |
| $150,000 to $199,999 | 0 | 0.0% |
| $200,000+ | 3 | 3.9% |
Family Income by Famaliy Size in Hornbrook
2-person families (34 | 44.7%) account for the highest median family income in Hornbrook with $63,393 per family, while 2-person families (34 | 44.7%) have the highest median income of $31,696 per family member.
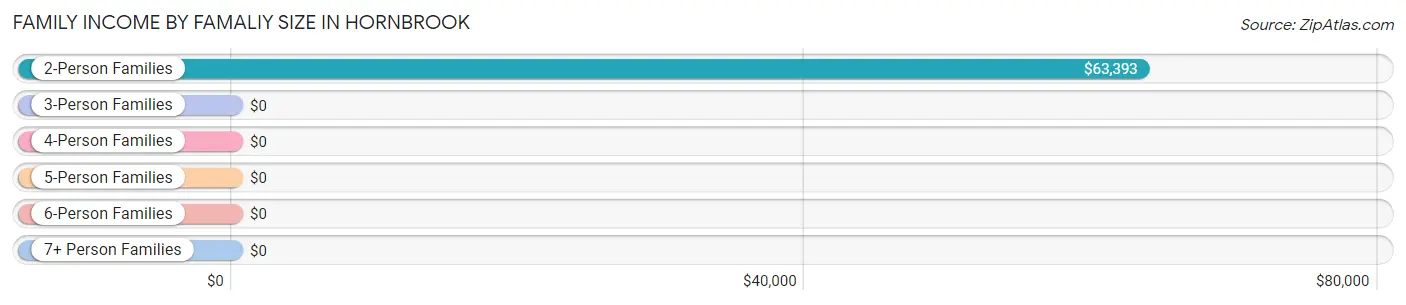
| Income Bracket | # Families | Median Income |
| 2-Person Families | 34 (44.7%) | $63,393 |
| 3-Person Families | 7 (9.2%) | $0 |
| 4-Person Families | 6 (7.9%) | $0 |
| 5-Person Families | 26 (34.2%) | $0 |
| 6-Person Families | 0 (0.0%) | $0 |
| 7+ Person Families | 3 (4.0%) | $0 |
| Total | 76 (100.0%) | $32,404 |
Family Income by Number of Earners in Hornbrook
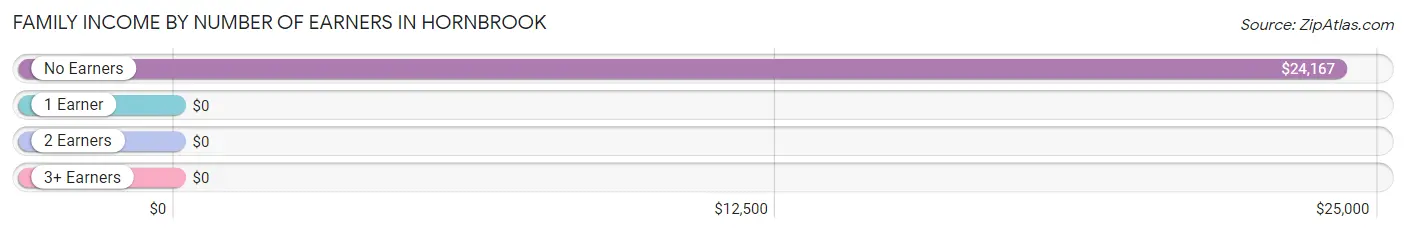
| Number of Earners | # Families | Median Income |
| No Earners | 16 (21.0%) | $24,167 |
| 1 Earner | 50 (65.8%) | $0 |
| 2 Earners | 7 (9.2%) | $0 |
| 3+ Earners | 3 (4.0%) | $0 |
| Total | 76 (100.0%) | $32,404 |
Household Income in Hornbrook
Household Income Brackets in Hornbrook
With 53 households falling in the category, the $50,000 to $74,999 income range is the most frequent in Hornbrook, accounting for 36.5% of all households.
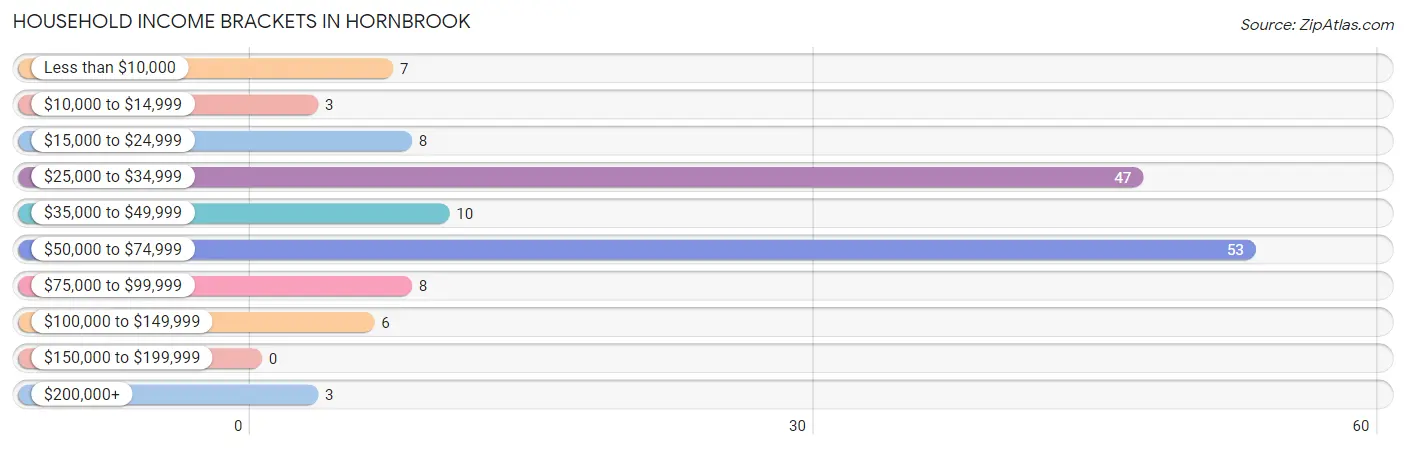
| Income Bracket | # Households | % Households |
| Less than $10,000 | 7 | 4.8% |
| $10,000 to $14,999 | 3 | 2.1% |
| $15,000 to $24,999 | 8 | 5.5% |
| $25,000 to $34,999 | 47 | 32.4% |
| $35,000 to $49,999 | 10 | 6.9% |
| $50,000 to $74,999 | 53 | 36.6% |
| $75,000 to $99,999 | 8 | 5.5% |
| $100,000 to $149,999 | 6 | 4.1% |
| $150,000 to $199,999 | 0 | 0.0% |
| $200,000+ | 3 | 2.1% |
Household Income by Householder Age in Hornbrook
The median household income in Hornbrook is $46,607, with the highest median household income of $66,298 found in the 25 to 44 years age bracket for the primary householder. A total of 33 households (22.8%) fall into this category.
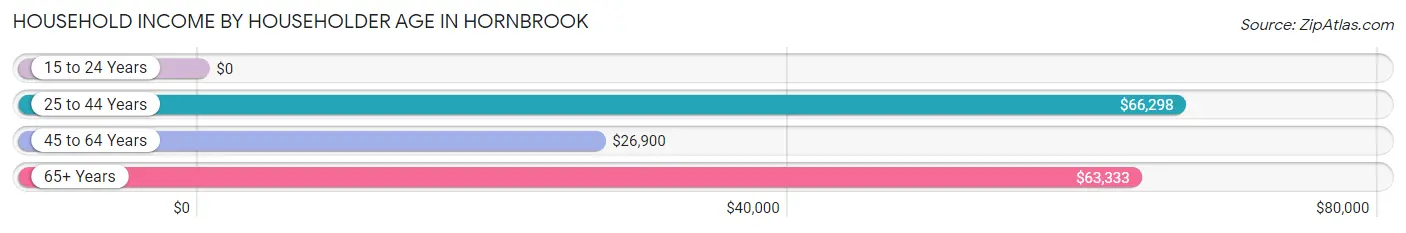
| Income Bracket | # Households | Median Income |
| 15 to 24 Years | 0 (0.0%) | $0 |
| 25 to 44 Years | 33 (22.8%) | $66,298 |
| 45 to 64 Years | 70 (48.3%) | $26,900 |
| 65+ Years | 42 (29.0%) | $63,333 |
| Total | 145 (100.0%) | $46,607 |
Poverty in Hornbrook
Income Below Poverty by Sex and Age in Hornbrook
With 31.9% poverty level for males and 52.4% for females among the residents of Hornbrook, under 5 year old males and under 5 year old females are the most vulnerable to poverty, with 5 males (100.0%) and 63 females (100.0%) in their respective age groups living below the poverty level.
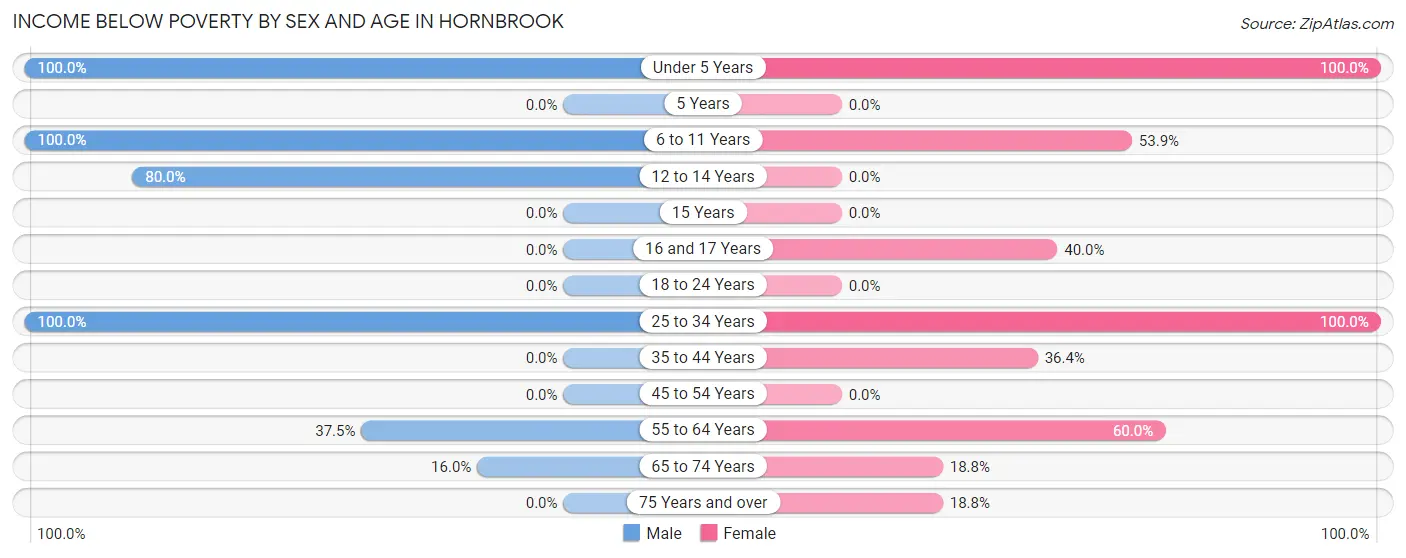
| Age Bracket | Male | Female |
| Under 5 Years | 5 (100.0%) | 63 (100.0%) |
| 5 Years | 0 (0.0%) | 0 (0.0%) |
| 6 to 11 Years | 14 (100.0%) | 14 (53.8%) |
| 12 to 14 Years | 12 (80.0%) | 0 (0.0%) |
| 15 Years | 0 (0.0%) | 0 (0.0%) |
| 16 and 17 Years | 0 (0.0%) | 4 (40.0%) |
| 18 to 24 Years | 0 (0.0%) | 0 (0.0%) |
| 25 to 34 Years | 5 (100.0%) | 26 (100.0%) |
| 35 to 44 Years | 0 (0.0%) | 4 (36.4%) |
| 45 to 54 Years | 0 (0.0%) | 0 (0.0%) |
| 55 to 64 Years | 3 (37.5%) | 12 (60.0%) |
| 65 to 74 Years | 4 (16.0%) | 3 (18.8%) |
| 75 Years and over | 0 (0.0%) | 3 (18.8%) |
| Total | 43 (31.9%) | 129 (52.4%) |
Income Above Poverty by Sex and Age in Hornbrook
According to the poverty statistics in Hornbrook, males aged 15 years and females aged 12 to 14 years are the age groups that are most secure financially, with 100.0% of males and 100.0% of females in these age groups living above the poverty line.
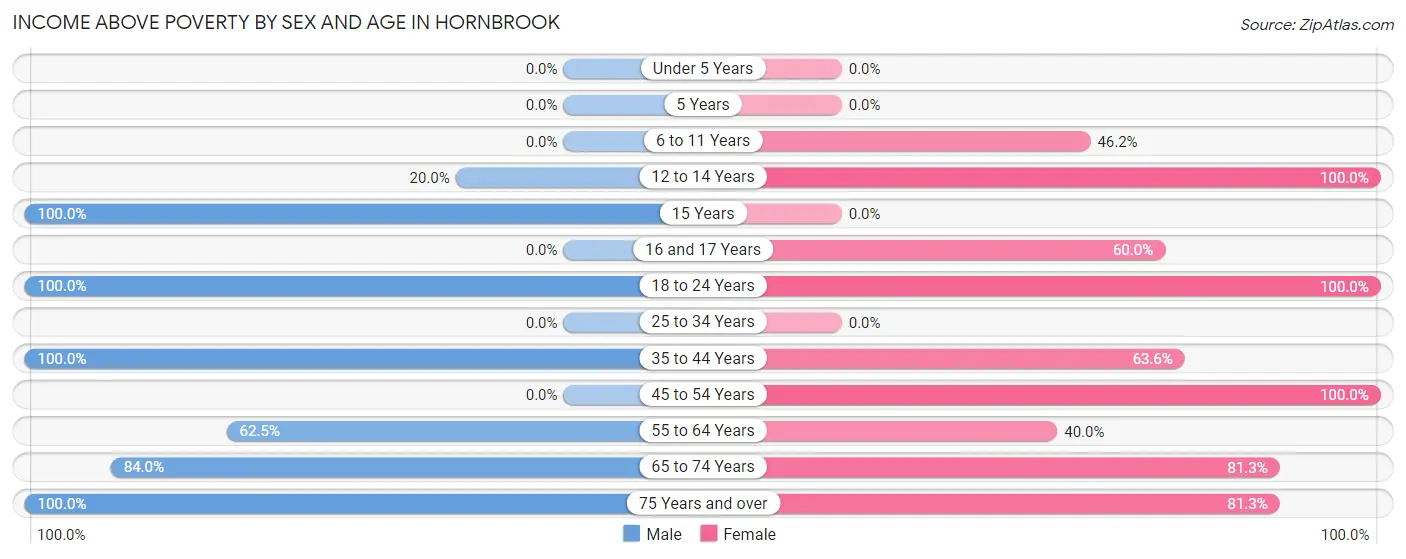
| Age Bracket | Male | Female |
| Under 5 Years | 0 (0.0%) | 0 (0.0%) |
| 5 Years | 0 (0.0%) | 0 (0.0%) |
| 6 to 11 Years | 0 (0.0%) | 12 (46.2%) |
| 12 to 14 Years | 3 (20.0%) | 4 (100.0%) |
| 15 Years | 5 (100.0%) | 0 (0.0%) |
| 16 and 17 Years | 0 (0.0%) | 6 (60.0%) |
| 18 to 24 Years | 31 (100.0%) | 8 (100.0%) |
| 25 to 34 Years | 0 (0.0%) | 0 (0.0%) |
| 35 to 44 Years | 18 (100.0%) | 7 (63.6%) |
| 45 to 54 Years | 0 (0.0%) | 46 (100.0%) |
| 55 to 64 Years | 5 (62.5%) | 8 (40.0%) |
| 65 to 74 Years | 21 (84.0%) | 13 (81.2%) |
| 75 Years and over | 9 (100.0%) | 13 (81.2%) |
| Total | 92 (68.1%) | 117 (47.6%) |
Income Below Poverty Among Married-Couple Families in Hornbrook
The poverty statistics for married-couple families in Hornbrook show that 10.5% or 2 of the total 19 families live below the poverty line. Families with no children have the highest poverty rate of 12.5%, comprising of 2 families. On the other hand, families with 3 or 4 children have the lowest poverty rate of 0.0%, which includes 0 families.
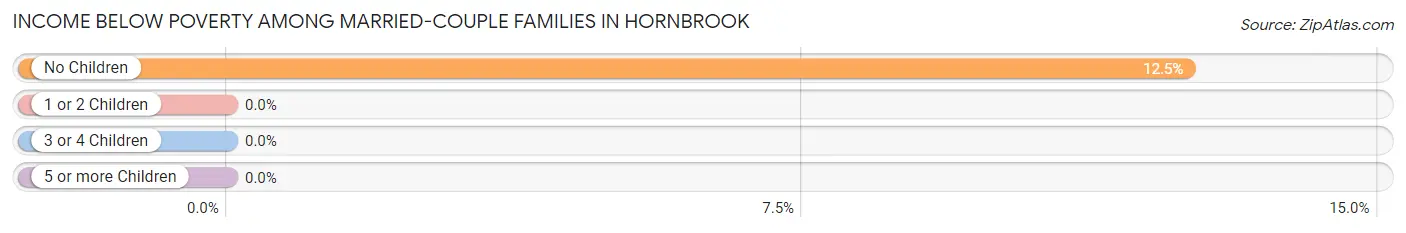
| Children | Above Poverty | Below Poverty |
| No Children | 14 (87.5%) | 2 (12.5%) |
| 1 or 2 Children | 0 (0.0%) | 0 (0.0%) |
| 3 or 4 Children | 3 (100.0%) | 0 (0.0%) |
| 5 or more Children | 0 (0.0%) | 0 (0.0%) |
| Total | 17 (89.5%) | 2 (10.5%) |
Income Below Poverty Among Single-Parent Households in Hornbrook
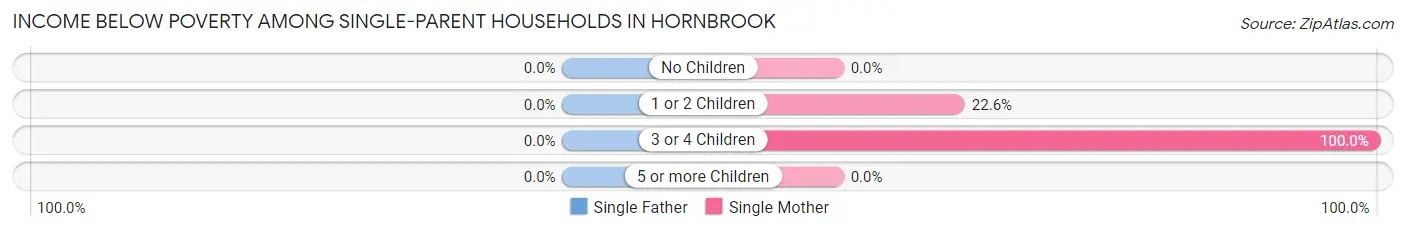
| Children | Single Father | Single Mother |
| No Children | 0 (0.0%) | 0 (0.0%) |
| 1 or 2 Children | 0 (0.0%) | 7 (22.6%) |
| 3 or 4 Children | 0 (0.0%) | 26 (100.0%) |
| 5 or more Children | 0 (0.0%) | 0 (0.0%) |
| Total | 0 (0.0%) | 33 (57.9%) |
Income Below Poverty Among Married-Couple vs Single-Parent Households in Hornbrook
The poverty data for Hornbrook shows that 2 of the married-couple family households (10.5%) and 33 of the single-parent households (57.9%) are living below the poverty level. Within the married-couple family households, those with no children have the highest poverty rate, with 2 households (12.5%) falling below the poverty line. Among the single-parent households, those with 3 or 4 children have the highest poverty rate, with 26 household (100.0%) living below poverty.
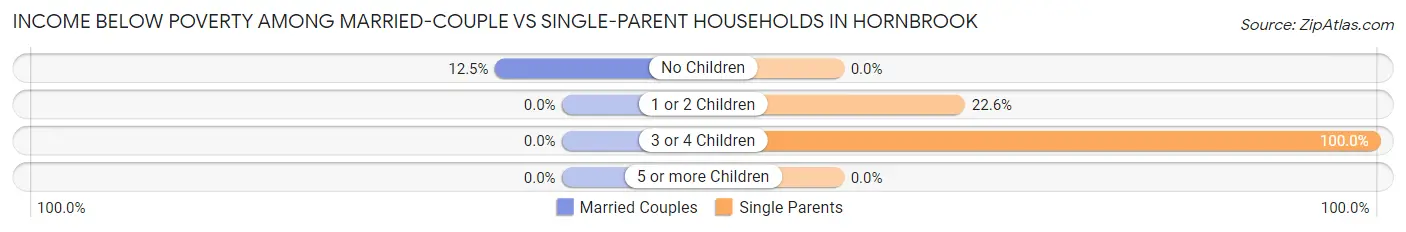
| Children | Married-Couple Families | Single-Parent Households |
| No Children | 2 (12.5%) | 0 (0.0%) |
| 1 or 2 Children | 0 (0.0%) | 7 (22.6%) |
| 3 or 4 Children | 0 (0.0%) | 26 (100.0%) |
| 5 or more Children | 0 (0.0%) | 0 (0.0%) |
| Total | 2 (10.5%) | 33 (57.9%) |
Race in Hornbrook
The most populous races in Hornbrook are White / Caucasian (226 | 59.3%), Two or more Races (155 | 40.7%), and Hispanic or Latino (63 | 16.5%).
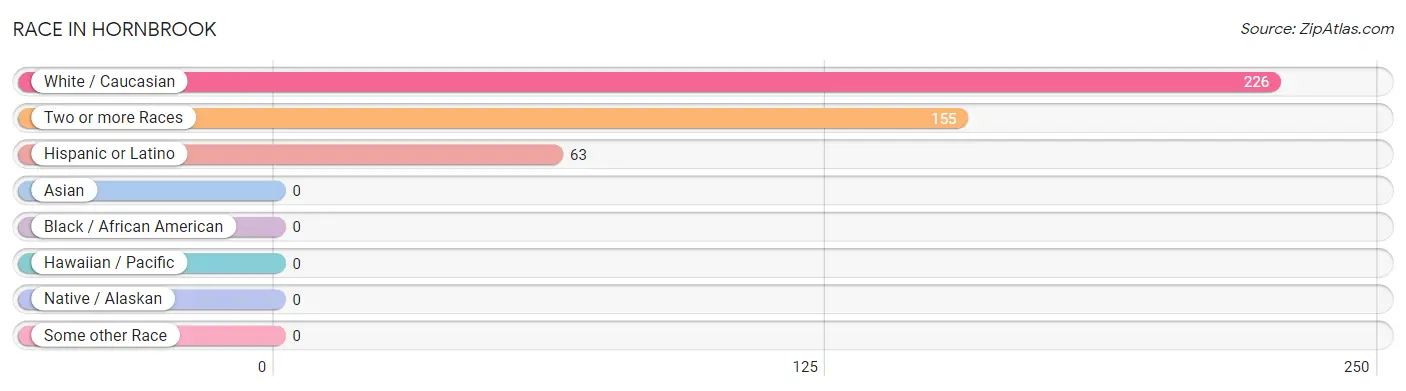
| Race | # Population | % Population |
| Asian | 0 | 0.0% |
| Black / African American | 0 | 0.0% |
| Hawaiian / Pacific | 0 | 0.0% |
| Hispanic or Latino | 63 | 16.5% |
| Native / Alaskan | 0 | 0.0% |
| White / Caucasian | 226 | 59.3% |
| Two or more Races | 155 | 40.7% |
| Some other Race | 0 | 0.0% |
| Total | 381 | 100.0% |
Ancestry in Hornbrook
The most populous ancestries reported in Hornbrook are Choctaw (124 | 32.6%), Puerto Rican (63 | 16.5%), English (37 | 9.7%), Irish (28 | 7.3%), and German (25 | 6.6%), together accounting for 72.7% of all Hornbrook residents.
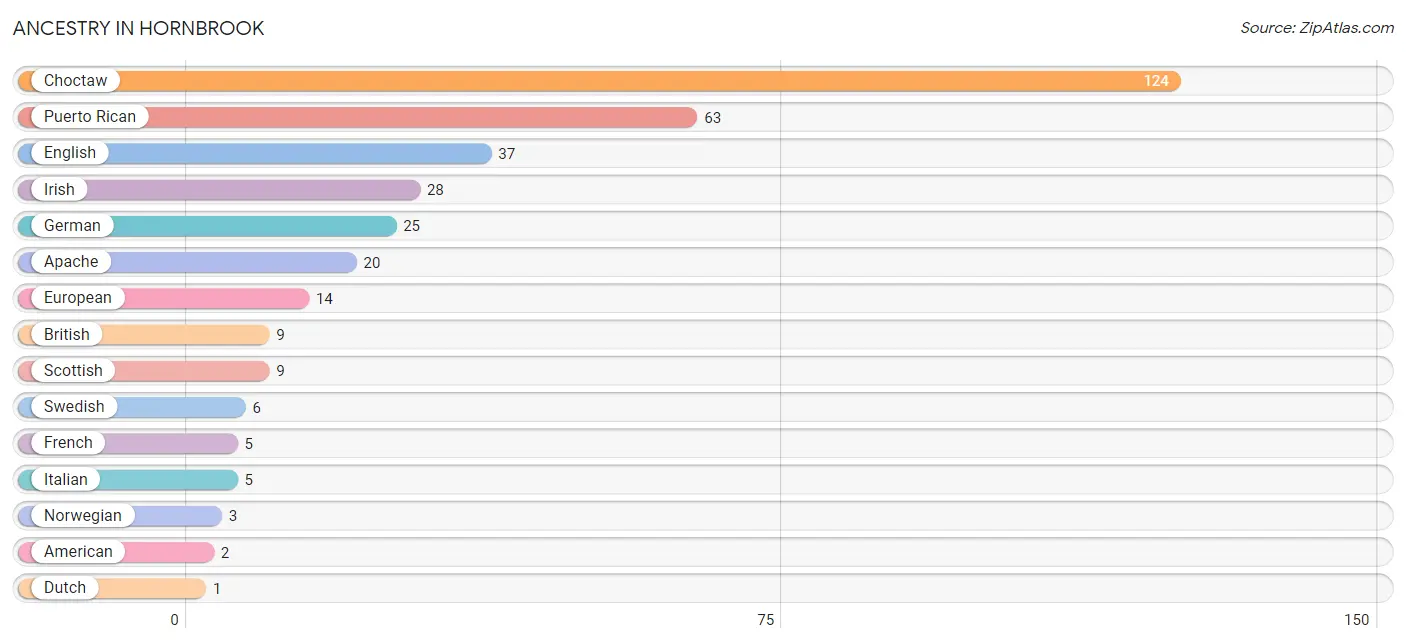
| Ancestry | # Population | % Population |
| American | 2 | 0.5% |
| Apache | 20 | 5.2% |
| British | 9 | 2.4% |
| Choctaw | 124 | 32.6% |
| Dutch | 1 | 0.3% |
| English | 37 | 9.7% |
| European | 14 | 3.7% |
| French | 5 | 1.3% |
| German | 25 | 6.6% |
| Irish | 28 | 7.3% |
| Italian | 5 | 1.3% |
| Norwegian | 3 | 0.8% |
| Puerto Rican | 63 | 16.5% |
| Scottish | 9 | 2.4% |
| Swedish | 6 | 1.6% | View All 15 Rows |
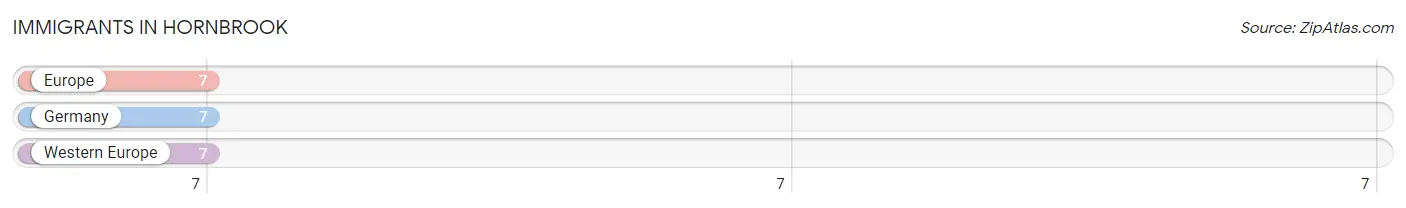
Immigrants in Hornbrook
The most numerous immigrant groups reported in Hornbrook came from Europe (7 | 1.8%), Germany (7 | 1.8%), and Western Europe (7 | 1.8%), together accounting for 5.5% of all Hornbrook residents.
| Immigration Origin | # Population | % Population |
| Europe | 7 | 1.8% |
| Germany | 7 | 1.8% |
| Western Europe | 7 | 1.8% | View All 3 Rows |
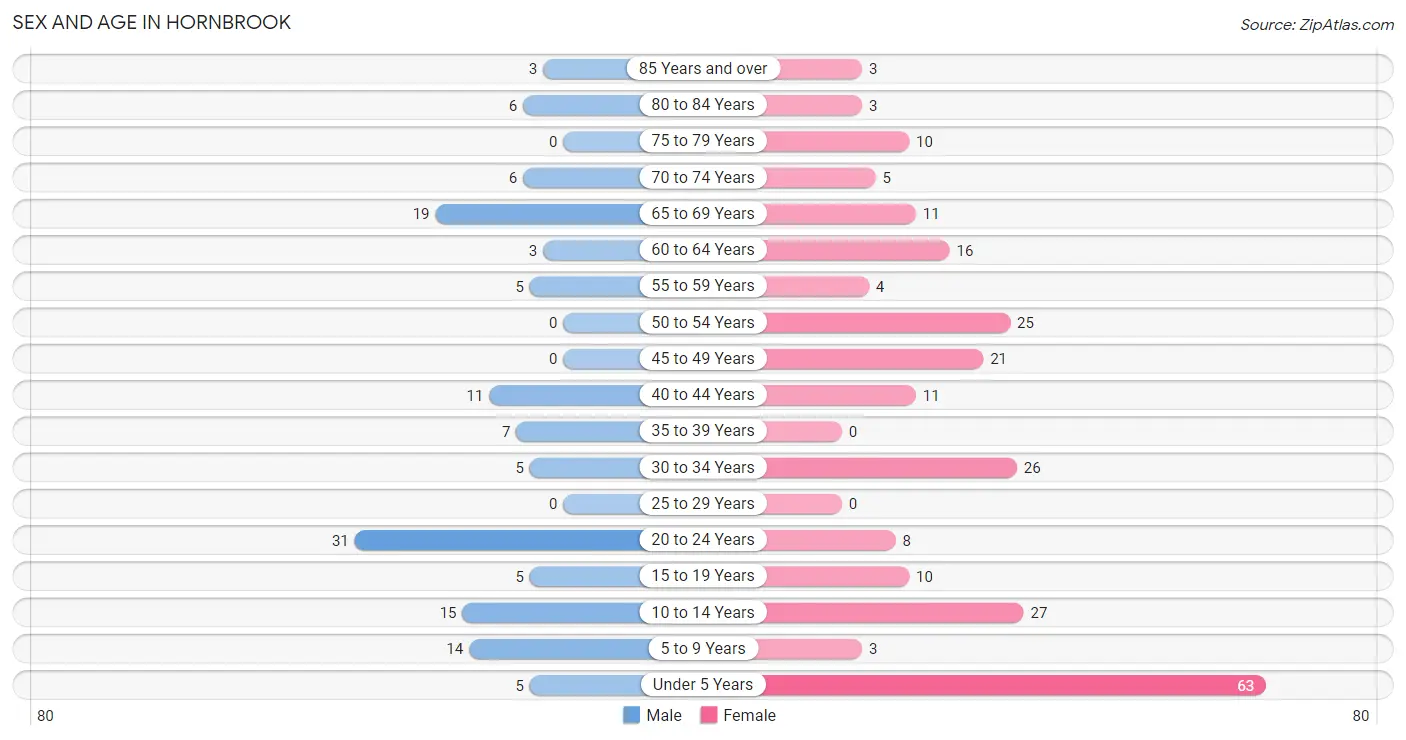
Sex and Age in Hornbrook
Sex and Age in Hornbrook
The most populous age groups in Hornbrook are 20 to 24 Years (31 | 23.0%) for men and Under 5 Years (63 | 25.6%) for women.
| Age Bracket | Male | Female |
| Under 5 Years | 5 (3.7%) | 63 (25.6%) |
| 5 to 9 Years | 14 (10.4%) | 3 (1.2%) |
| 10 to 14 Years | 15 (11.1%) | 27 (11.0%) |
| 15 to 19 Years | 5 (3.7%) | 10 (4.1%) |
| 20 to 24 Years | 31 (23.0%) | 8 (3.3%) |
| 25 to 29 Years | 0 (0.0%) | 0 (0.0%) |
| 30 to 34 Years | 5 (3.7%) | 26 (10.6%) |
| 35 to 39 Years | 7 (5.2%) | 0 (0.0%) |
| 40 to 44 Years | 11 (8.2%) | 11 (4.5%) |
| 45 to 49 Years | 0 (0.0%) | 21 (8.5%) |
| 50 to 54 Years | 0 (0.0%) | 25 (10.2%) |
| 55 to 59 Years | 5 (3.7%) | 4 (1.6%) |
| 60 to 64 Years | 3 (2.2%) | 16 (6.5%) |
| 65 to 69 Years | 19 (14.1%) | 11 (4.5%) |
| 70 to 74 Years | 6 (4.4%) | 5 (2.0%) |
| 75 to 79 Years | 0 (0.0%) | 10 (4.1%) |
| 80 to 84 Years | 6 (4.4%) | 3 (1.2%) |
| 85 Years and over | 3 (2.2%) | 3 (1.2%) |
| Total | 135 (100.0%) | 246 (100.0%) |
Families and Households in Hornbrook
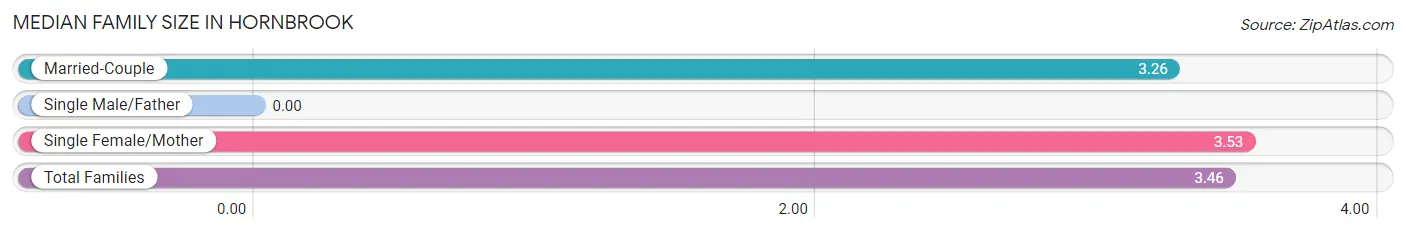
Median Family Size in Hornbrook
| Family Type | # Families | Family Size |
| Married-Couple | 19 (25.0%) | 3.26 |
| Single Male/Father | 0 (0.0%) | - |
| Single Female/Mother | 57 (75.0%) | 3.53 |
| Total Families | 76 (100.0%) | 3.46 |
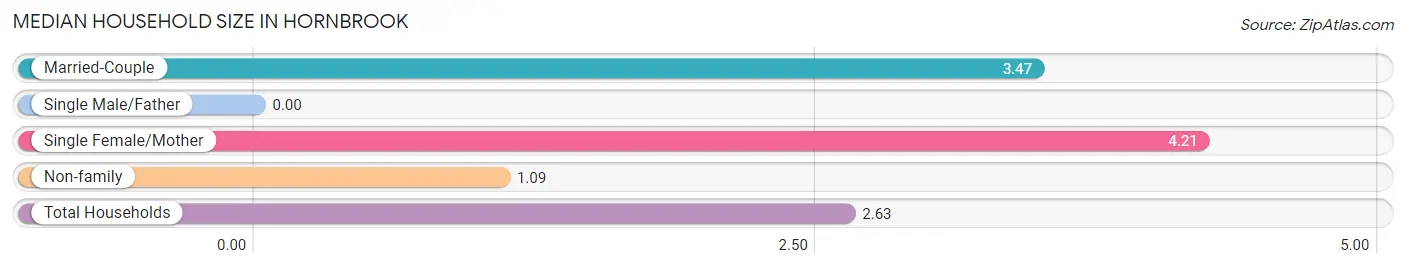
Median Household Size in Hornbrook
| Household Type | # Households | Household Size |
| Married-Couple | 19 (13.1%) | 3.47 |
| Single Male/Father | 0 (0.0%) | - |
| Single Female/Mother | 57 (39.3%) | 4.21 |
| Non-family | 69 (47.6%) | 1.09 |
| Total Households | 145 (100.0%) | 2.63 |
Household Size by Marriage Status in Hornbrook
Out of a total of 145 households in Hornbrook, 76 (52.4%) are family households, while 69 (47.6%) are nonfamily households. The most numerous type of family households are 2-person households, comprising 30, and the most common type of nonfamily households are 1-person households, comprising 64.
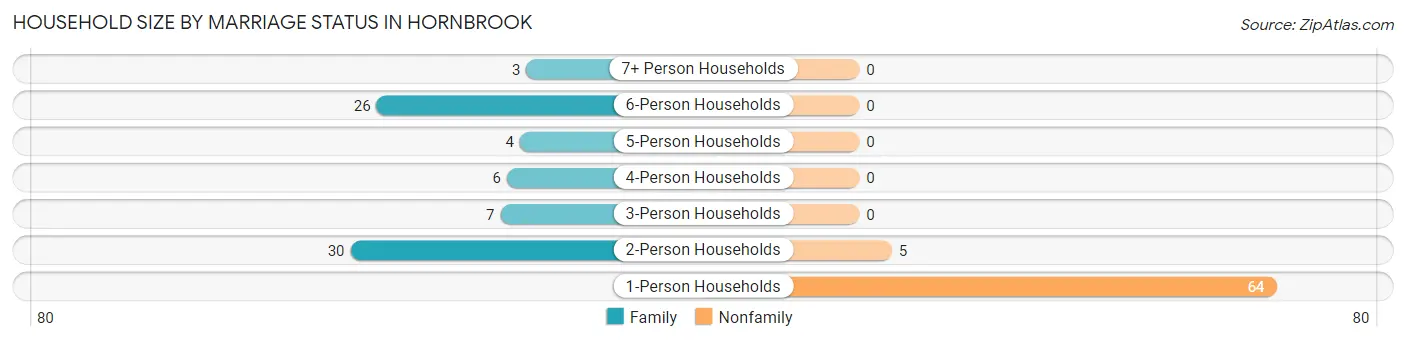
| Household Size | Family Households | Nonfamily Households |
| 1-Person Households | - | 64 (44.1%) |
| 2-Person Households | 30 (20.7%) | 5 (3.5%) |
| 3-Person Households | 7 (4.8%) | 0 (0.0%) |
| 4-Person Households | 6 (4.1%) | 0 (0.0%) |
| 5-Person Households | 4 (2.8%) | 0 (0.0%) |
| 6-Person Households | 26 (17.9%) | 0 (0.0%) |
| 7+ Person Households | 3 (2.1%) | 0 (0.0%) |
| Total | 76 (52.4%) | 69 (47.6%) |
Female Fertility in Hornbrook
Fertility by Age in Hornbrook
| Age Bracket | Women with Births | Births / 1,000 Women |
| 15 to 19 years | 0 (0.0%) | 0.0 |
| 20 to 34 years | 0 (0.0%) | 0.0 |
| 35 to 50 years | 0 (0.0%) | 0.0 |
| Total | 0 (0.0%) | 0.0 |
Fertility by Age by Marriage Status in Hornbrook
| Age Bracket | Married | Unmarried |
| 15 to 19 years | 0 (0.0%) | 0 (0.0%) |
| 20 to 34 years | 0 (0.0%) | 0 (0.0%) |
| 35 to 50 years | 0 (0.0%) | 0 (0.0%) |
| Total | 0 (0.0%) | 0 (0.0%) |
Fertility by Education in Hornbrook
| Educational Attainment | Women with Births | Births / 1,000 Women |
| Less than High School | 0 (0.0%) | 0.0 |
| High School Diploma | 0 (0.0%) | 0.0 |
| College or Associate's Degree | 0 (0.0%) | 0.0 |
| Bachelor's Degree | 0 (0.0%) | 0.0 |
| Graduate Degree | 0 (0.0%) | 0.0 |
| Total | 0 (0.0%) | 0.0 |
Fertility by Education by Marriage Status in Hornbrook
| Educational Attainment | Married | Unmarried |
| Less than High School | 0 (0.0%) | 0 (0.0%) |
| High School Diploma | 0 (0.0%) | 0 (0.0%) |
| College or Associate's Degree | 0 (0.0%) | 0 (0.0%) |
| Bachelor's Degree | 0 (0.0%) | 0 (0.0%) |
| Graduate Degree | 0 (0.0%) | 0 (0.0%) |
| Total | 0 (0.0%) | 0 (0.0%) |
Employment Characteristics in Hornbrook
Employment by Class of Employer in Hornbrook
Among the 121 employed individuals in Hornbrook, private company employees (96 | 79.3%), local government employees (17 | 14.1%), and self-employed (not incorporated) (8 | 6.6%) make up the most common classes of employment.
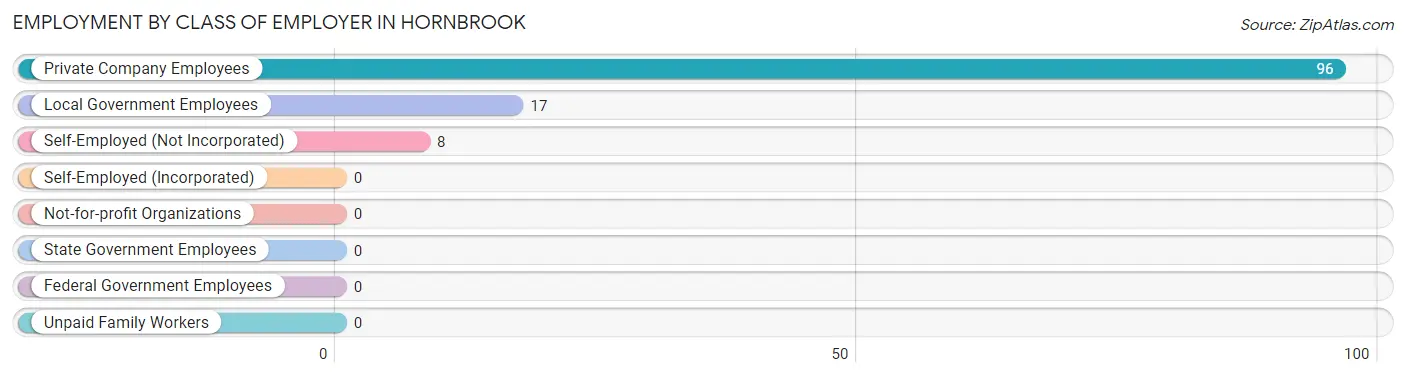
| Employer Class | # Employees | % Employees |
| Private Company Employees | 96 | 79.3% |
| Self-Employed (Incorporated) | 0 | 0.0% |
| Self-Employed (Not Incorporated) | 8 | 6.6% |
| Not-for-profit Organizations | 0 | 0.0% |
| Local Government Employees | 17 | 14.1% |
| State Government Employees | 0 | 0.0% |
| Federal Government Employees | 0 | 0.0% |
| Unpaid Family Workers | 0 | 0.0% |
| Total | 121 | 100.0% |
Employment Status by Age in Hornbrook
According to the labor force statistics for Hornbrook, out of the total population over 16 years of age (249), 60.2% or 150 individuals are in the labor force, with 19.3% or 29 of them unemployed. The age group with the highest labor force participation rate is 20 to 24 years, with 100.0% or 39 individuals in the labor force. Within the labor force, the 45 to 54 years age range has the highest percentage of unemployed individuals, with 54.3% or 25 of them being unemployed.
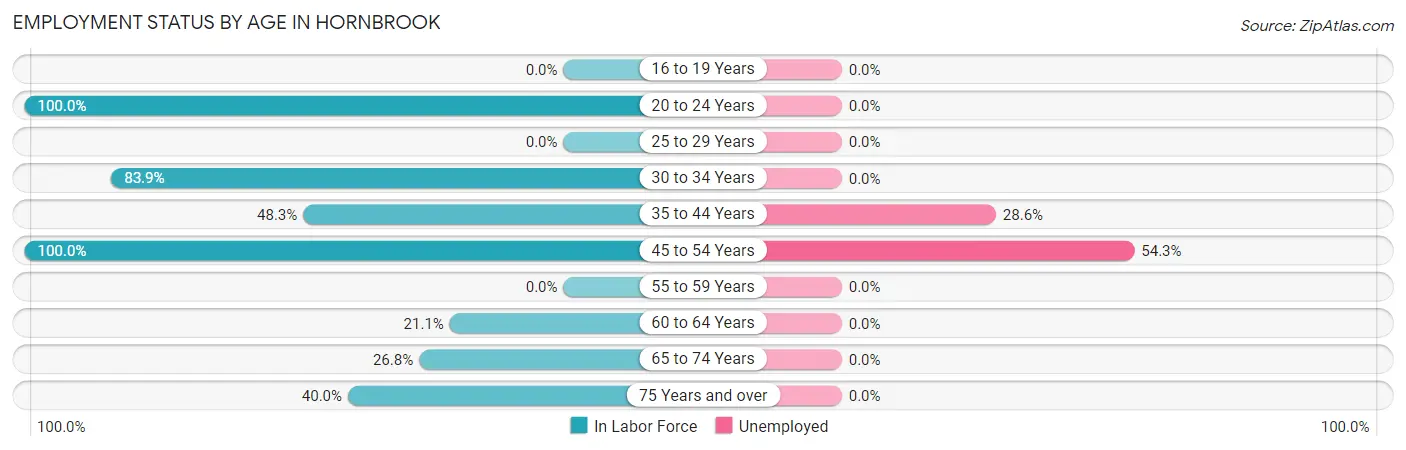
| Age Bracket | In Labor Force | Unemployed |
| 16 to 19 Years | 0 (0.0%) | 0 (0.0%) |
| 20 to 24 Years | 39 (100.0%) | 0 (0.0%) |
| 25 to 29 Years | 0 (0.0%) | 0 (0.0%) |
| 30 to 34 Years | 26 (83.9%) | 0 (0.0%) |
| 35 to 44 Years | 14 (48.3%) | 4 (28.6%) |
| 45 to 54 Years | 46 (100.0%) | 25 (54.3%) |
| 55 to 59 Years | 0 (0.0%) | 0 (0.0%) |
| 60 to 64 Years | 4 (21.1%) | 0 (0.0%) |
| 65 to 74 Years | 11 (26.8%) | 0 (0.0%) |
| 75 Years and over | 10 (40.0%) | 0 (0.0%) |
| Total | 150 (60.2%) | 29 (19.3%) |
Employment Status by Educational Attainment in Hornbrook
According to labor force statistics for Hornbrook, 67.2% of individuals (90) out of the total population between 25 and 64 years of age (134) are in the labor force, with 32.2% or 29 of them being unemployed. The group with the highest labor force participation rate are those with the educational attainment of college / associate degree, with 75.2% or 76 individuals in the labor force. Within the labor force, individuals with college / associate degree education have the highest percentage of unemployment, with 32.9% or 25 of them being unemployed.
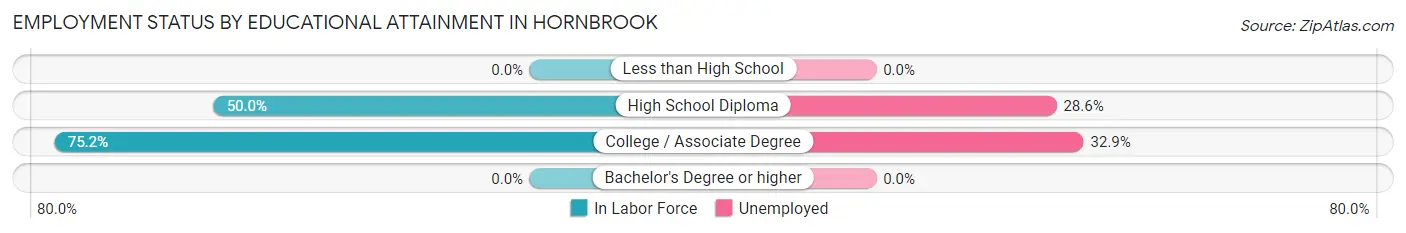
| Educational Attainment | In Labor Force | Unemployed |
| Less than High School | 0 (0.0%) | 0 (0.0%) |
| High School Diploma | 14 (50.0%) | 8 (28.6%) |
| College / Associate Degree | 76 (75.2%) | 33 (32.9%) |
| Bachelor's Degree or higher | 0 (0.0%) | 0 (0.0%) |
| Total | 90 (67.2%) | 43 (32.2%) |
Employment Occupations by Sex in Hornbrook
Management, Business, Science and Arts Occupations
The most common Management, Business, Science and Arts occupations in Hornbrook are Health Diagnosing & Treating (4 | 3.3%), and Health Technologists (4 | 3.3%).
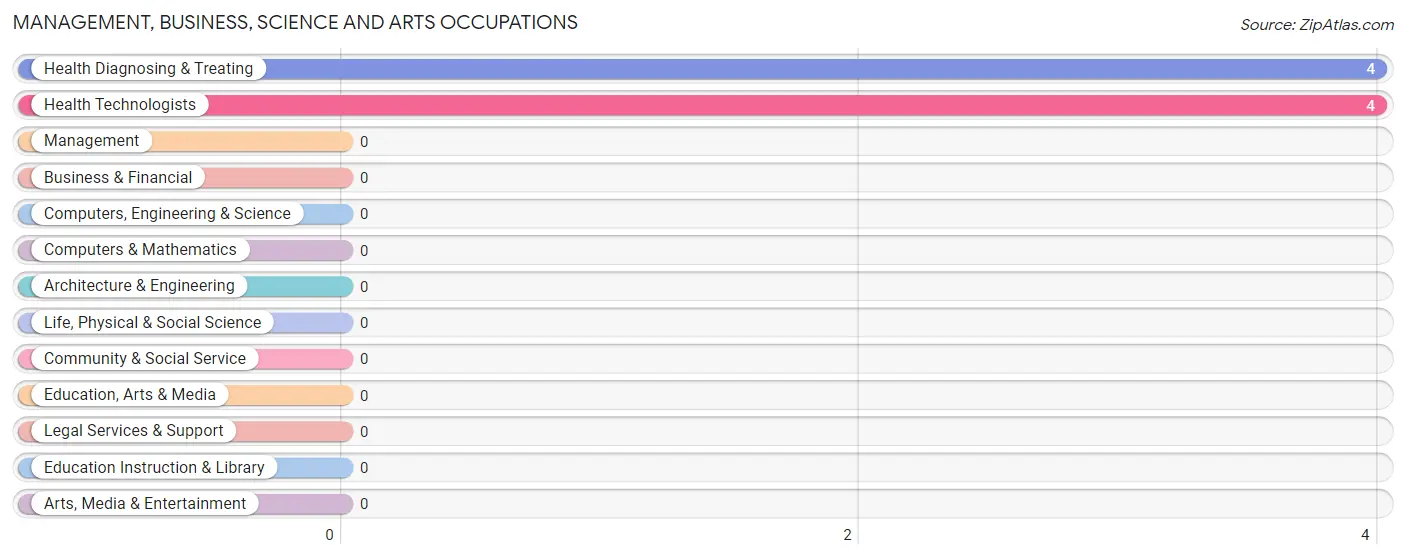
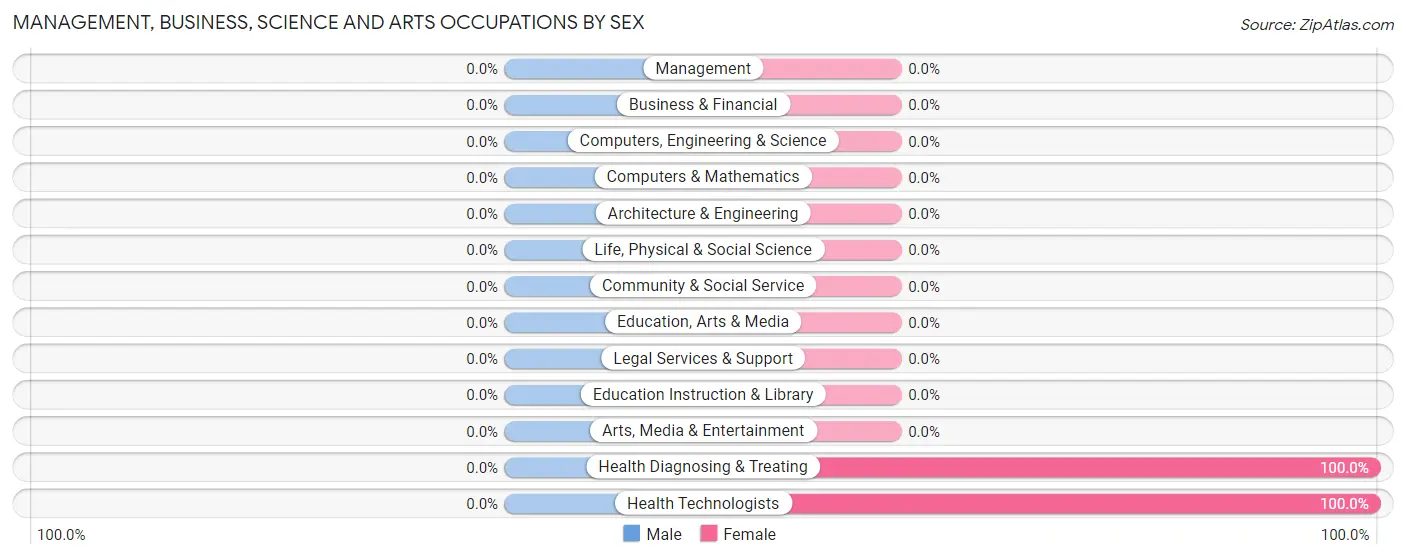
Management, Business, Science and Arts Occupations by Sex
| Occupation | Male | Female |
| Management | 0 (0.0%) | 0 (0.0%) |
| Business & Financial | 0 (0.0%) | 0 (0.0%) |
| Computers, Engineering & Science | 0 (0.0%) | 0 (0.0%) |
| Computers & Mathematics | 0 (0.0%) | 0 (0.0%) |
| Architecture & Engineering | 0 (0.0%) | 0 (0.0%) |
| Life, Physical & Social Science | 0 (0.0%) | 0 (0.0%) |
| Community & Social Service | 0 (0.0%) | 0 (0.0%) |
| Education, Arts & Media | 0 (0.0%) | 0 (0.0%) |
| Legal Services & Support | 0 (0.0%) | 0 (0.0%) |
| Education Instruction & Library | 0 (0.0%) | 0 (0.0%) |
| Arts, Media & Entertainment | 0 (0.0%) | 0 (0.0%) |
| Health Diagnosing & Treating | 0 (0.0%) | 4 (100.0%) |
| Health Technologists | 0 (0.0%) | 4 (100.0%) |
| Total (Category) | 0 (0.0%) | 4 (100.0%) |
| Total (Overall) | 49 (40.5%) | 72 (59.5%) |
Services Occupations
The most common Services occupations in Hornbrook are , and Healthcare Support (11 | 9.1%).
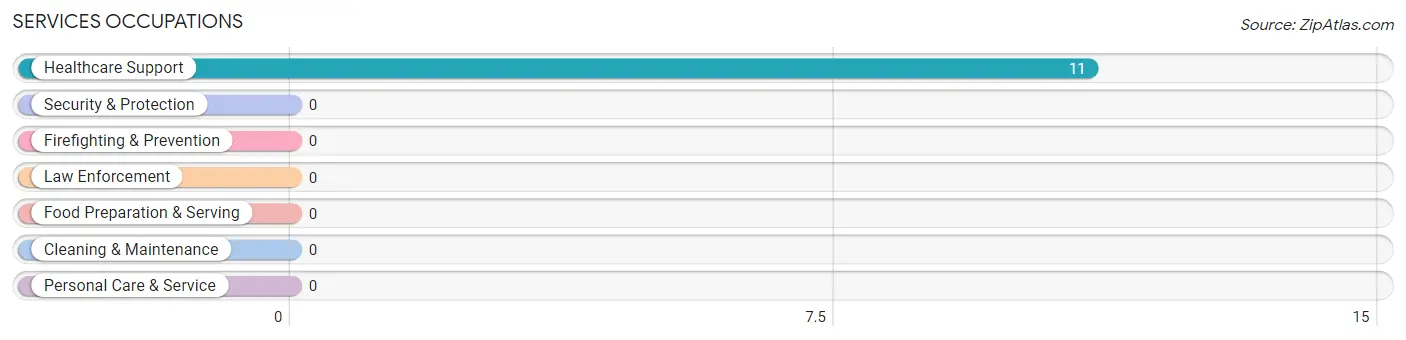
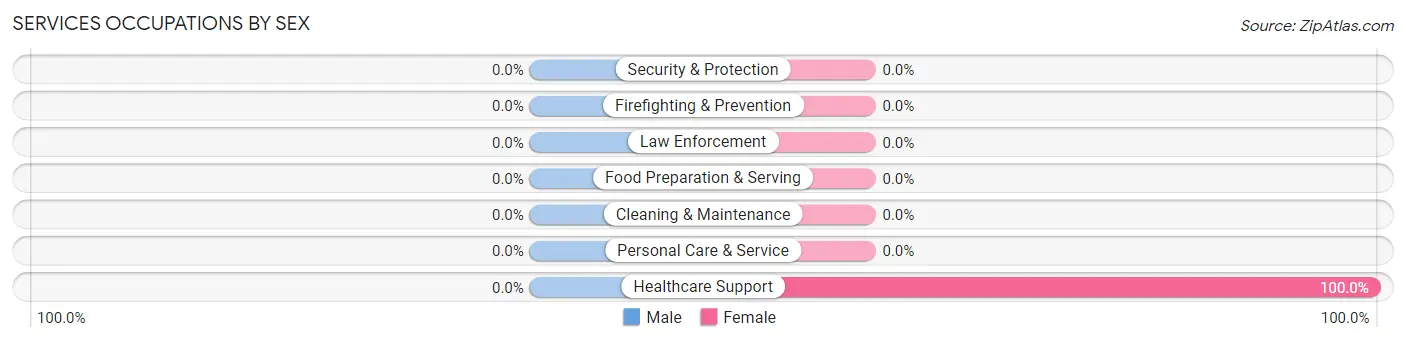
Services Occupations by Sex
| Occupation | Male | Female |
| Healthcare Support | 0 (0.0%) | 11 (100.0%) |
| Security & Protection | 0 (0.0%) | 0 (0.0%) |
| Firefighting & Prevention | 0 (0.0%) | 0 (0.0%) |
| Law Enforcement | 0 (0.0%) | 0 (0.0%) |
| Food Preparation & Serving | 0 (0.0%) | 0 (0.0%) |
| Cleaning & Maintenance | 0 (0.0%) | 0 (0.0%) |
| Personal Care & Service | 0 (0.0%) | 0 (0.0%) |
| Total (Category) | 0 (0.0%) | 11 (100.0%) |
| Total (Overall) | 49 (40.5%) | 72 (59.5%) |
Sales and Office Occupations
The most common Sales and Office occupations in Hornbrook are Sales & Related (40 | 33.1%), and Office & Administration (21 | 17.4%).
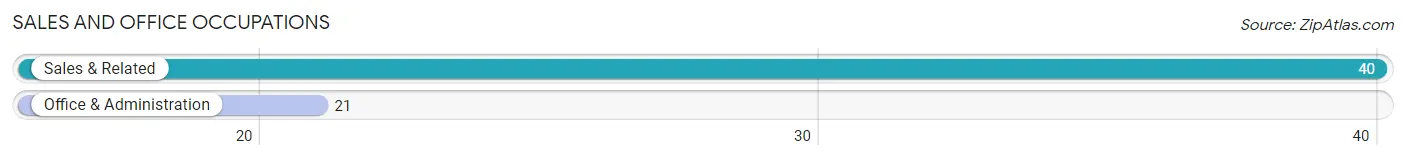
Sales and Office Occupations by Sex
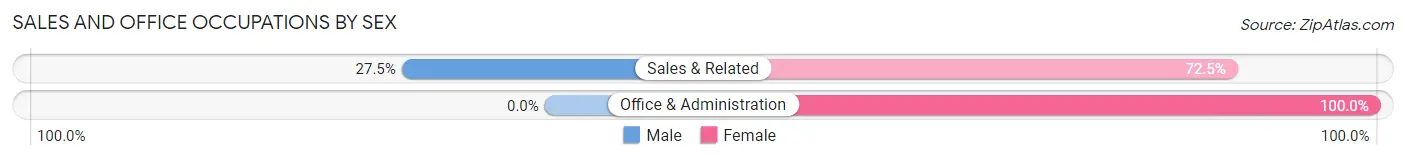
| Occupation | Male | Female |
| Sales & Related | 11 (27.5%) | 29 (72.5%) |
| Office & Administration | 0 (0.0%) | 21 (100.0%) |
| Total (Category) | 11 (18.0%) | 50 (82.0%) |
| Total (Overall) | 49 (40.5%) | 72 (59.5%) |
Natural Resources, Construction and Maintenance Occupations
The most common Natural Resources, Construction and Maintenance occupations in Hornbrook are , and Construction & Extraction (4 | 3.3%).
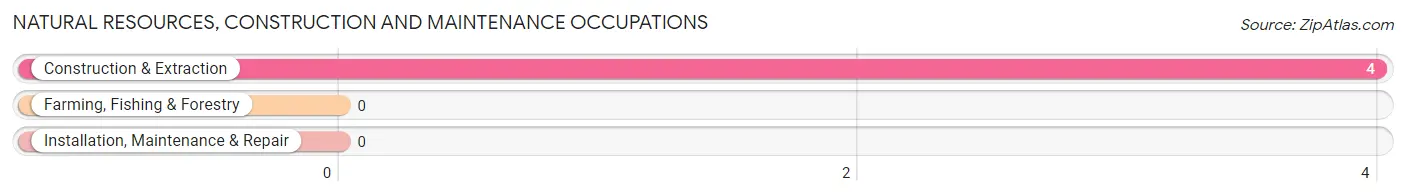
Natural Resources, Construction and Maintenance Occupations by Sex
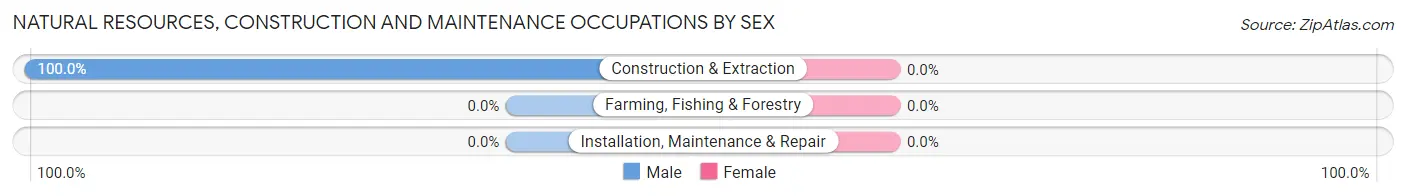
| Occupation | Male | Female |
| Farming, Fishing & Forestry | 0 (0.0%) | 0 (0.0%) |
| Construction & Extraction | 4 (100.0%) | 0 (0.0%) |
| Installation, Maintenance & Repair | 0 (0.0%) | 0 (0.0%) |
| Total (Category) | 4 (100.0%) | 0 (0.0%) |
| Total (Overall) | 49 (40.5%) | 72 (59.5%) |
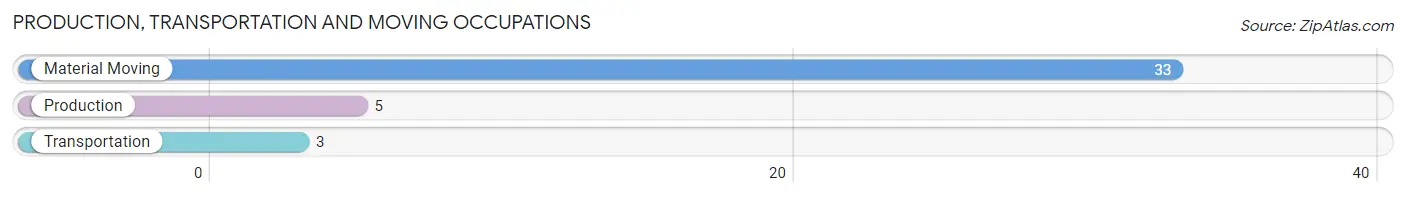
Production, Transportation and Moving Occupations
The most common Production, Transportation and Moving occupations in Hornbrook are Material Moving (33 | 27.3%), Production (5 | 4.1%), and Transportation (3 | 2.5%).
Production, Transportation and Moving Occupations by Sex
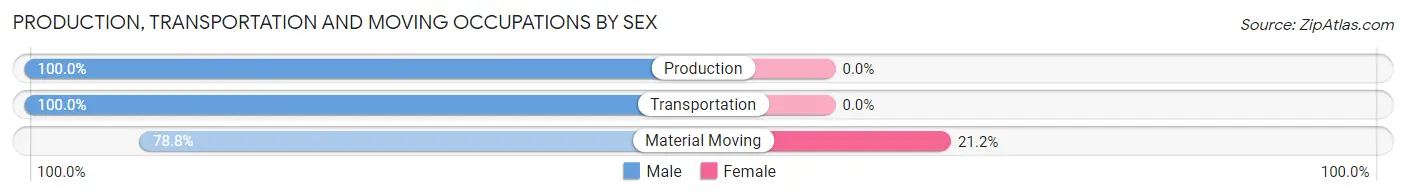
| Occupation | Male | Female |
| Production | 5 (100.0%) | 0 (0.0%) |
| Transportation | 3 (100.0%) | 0 (0.0%) |
| Material Moving | 26 (78.8%) | 7 (21.2%) |
| Total (Category) | 34 (82.9%) | 7 (17.1%) |
| Total (Overall) | 49 (40.5%) | 72 (59.5%) |
Employment Industries by Sex in Hornbrook
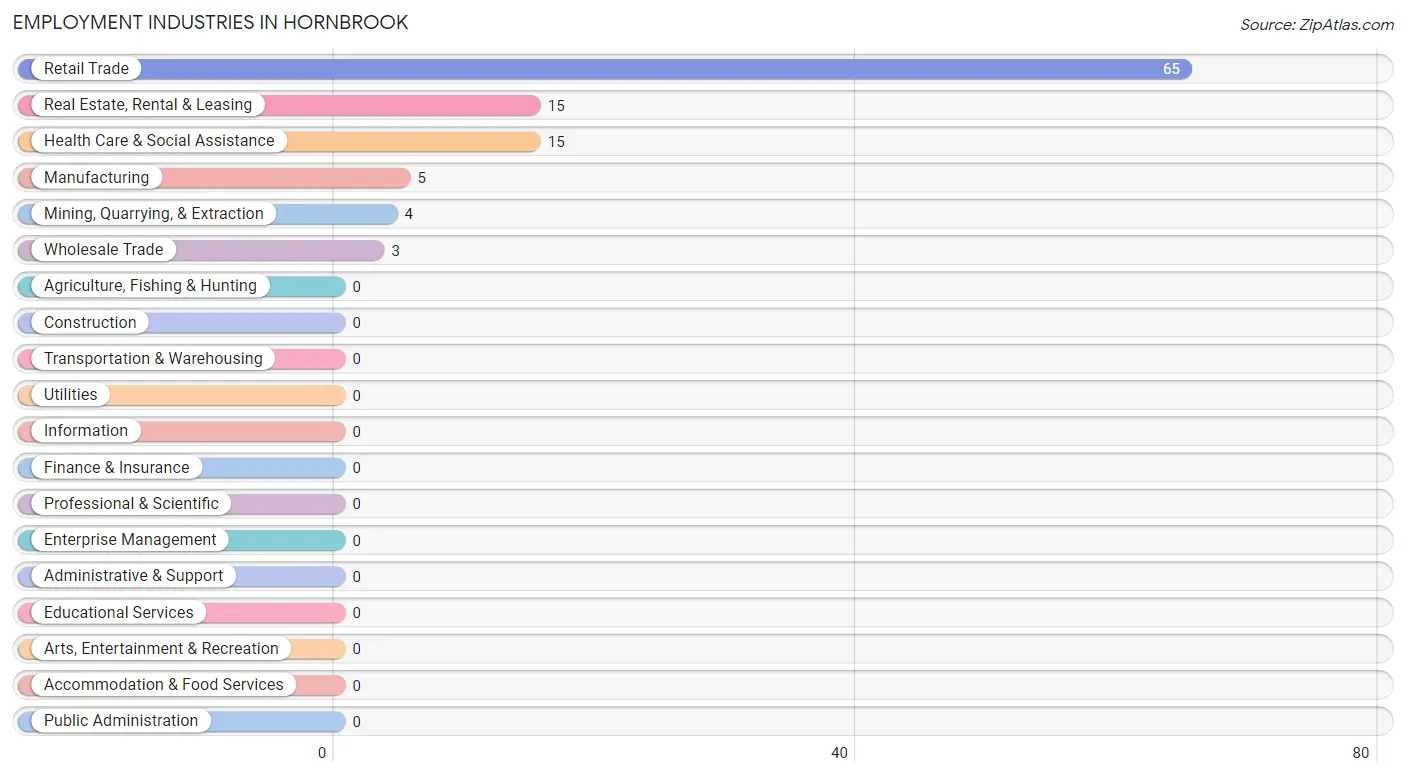
Employment Industries in Hornbrook
The major employment industries in Hornbrook include Retail Trade (65 | 53.7%), Real Estate, Rental & Leasing (15 | 12.4%), Health Care & Social Assistance (15 | 12.4%), Manufacturing (5 | 4.1%), and Mining, Quarrying, & Extraction (4 | 3.3%).
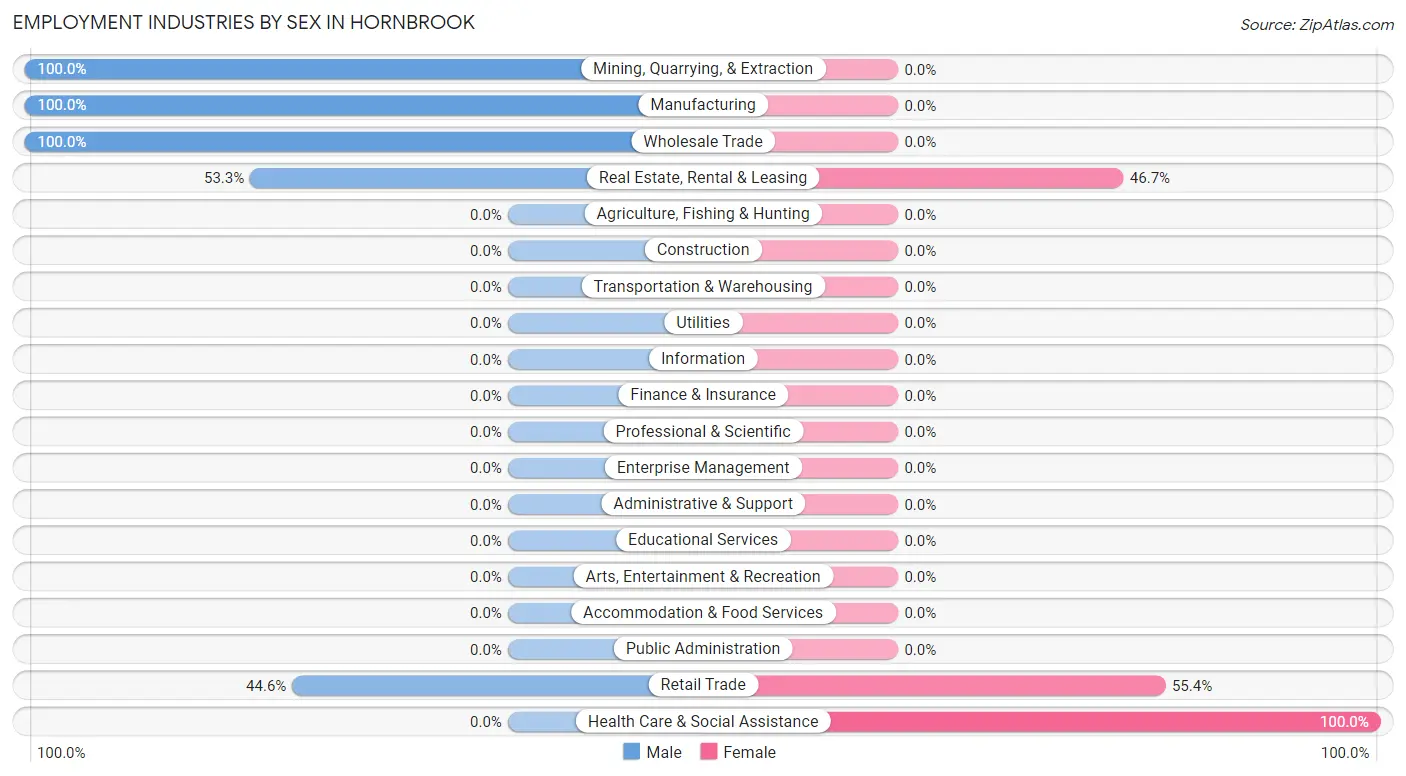
Employment Industries by Sex in Hornbrook
The Hornbrook industries that see more men than women are Mining, Quarrying, & Extraction (100.0%), Manufacturing (100.0%), and Wholesale Trade (100.0%), whereas the industries that tend to have a higher number of women are Health Care & Social Assistance (100.0%), Retail Trade (55.4%), and Real Estate, Rental & Leasing (46.7%).
| Industry | Male | Female |
| Agriculture, Fishing & Hunting | 0 (0.0%) | 0 (0.0%) |
| Mining, Quarrying, & Extraction | 4 (100.0%) | 0 (0.0%) |
| Construction | 0 (0.0%) | 0 (0.0%) |
| Manufacturing | 5 (100.0%) | 0 (0.0%) |
| Wholesale Trade | 3 (100.0%) | 0 (0.0%) |
| Retail Trade | 29 (44.6%) | 36 (55.4%) |
| Transportation & Warehousing | 0 (0.0%) | 0 (0.0%) |
| Utilities | 0 (0.0%) | 0 (0.0%) |
| Information | 0 (0.0%) | 0 (0.0%) |
| Finance & Insurance | 0 (0.0%) | 0 (0.0%) |
| Real Estate, Rental & Leasing | 8 (53.3%) | 7 (46.7%) |
| Professional & Scientific | 0 (0.0%) | 0 (0.0%) |
| Enterprise Management | 0 (0.0%) | 0 (0.0%) |
| Administrative & Support | 0 (0.0%) | 0 (0.0%) |
| Educational Services | 0 (0.0%) | 0 (0.0%) |
| Health Care & Social Assistance | 0 (0.0%) | 15 (100.0%) |
| Arts, Entertainment & Recreation | 0 (0.0%) | 0 (0.0%) |
| Accommodation & Food Services | 0 (0.0%) | 0 (0.0%) |
| Public Administration | 0 (0.0%) | 0 (0.0%) |
| Total | 49 (40.5%) | 72 (59.5%) |
Education in Hornbrook
School Enrollment in Hornbrook
The most common levels of schooling among the 74 students in Hornbrook are elementary school (28 | 37.8%), middle school (28 | 37.8%), and high school (15 | 20.3%).
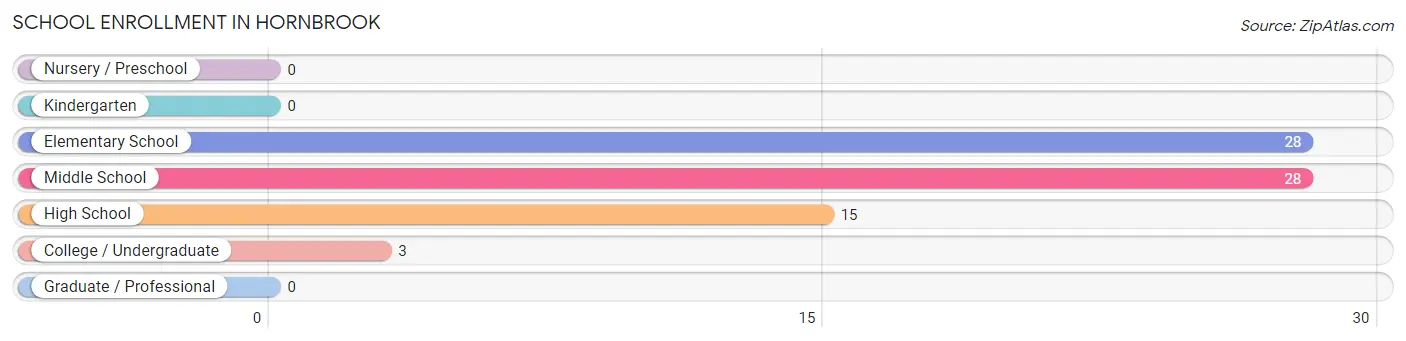
| School Level | # Students | % Students |
| Nursery / Preschool | 0 | 0.0% |
| Kindergarten | 0 | 0.0% |
| Elementary School | 28 | 37.8% |
| Middle School | 28 | 37.8% |
| High School | 15 | 20.3% |
| College / Undergraduate | 3 | 4.1% |
| Graduate / Professional | 0 | 0.0% |
| Total | 74 | 100.0% |
School Enrollment by Age by Funding Source in Hornbrook
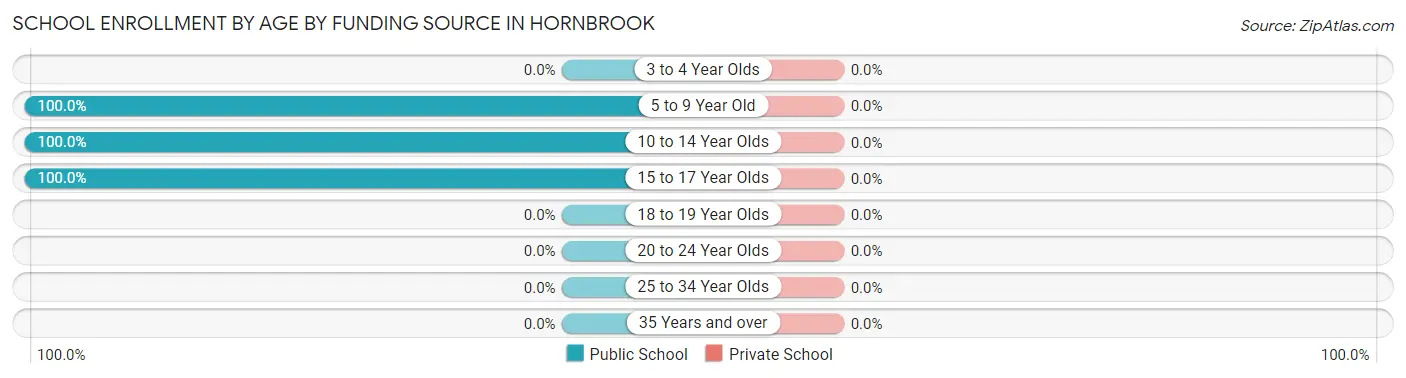
| Age Bracket | Public School | Private School |
| 3 to 4 Year Olds | 0 (0.0%) | 0 (0.0%) |
| 5 to 9 Year Old | 17 (100.0%) | 0 (0.0%) |
| 10 to 14 Year Olds | 42 (100.0%) | 0 (0.0%) |
| 15 to 17 Year Olds | 15 (100.0%) | 0 (0.0%) |
| 18 to 19 Year Olds | 0 (0.0%) | 0 (0.0%) |
| 20 to 24 Year Olds | 0 (0.0%) | 0 (0.0%) |
| 25 to 34 Year Olds | 0 (0.0%) | 0 (0.0%) |
| 35 Years and over | 0 (0.0%) | 0 (0.0%) |
| Total | 74 (100.0%) | 0 (0.0%) |
Educational Attainment by Field of Study in Hornbrook
Bio, nature & agricultural (2 | 40.0%), physical & health sciences (2 | 40.0%), and communications (1 | 20.0%) are the most common fields of study among 5 individuals in Hornbrook who have obtained a bachelor's degree or higher.
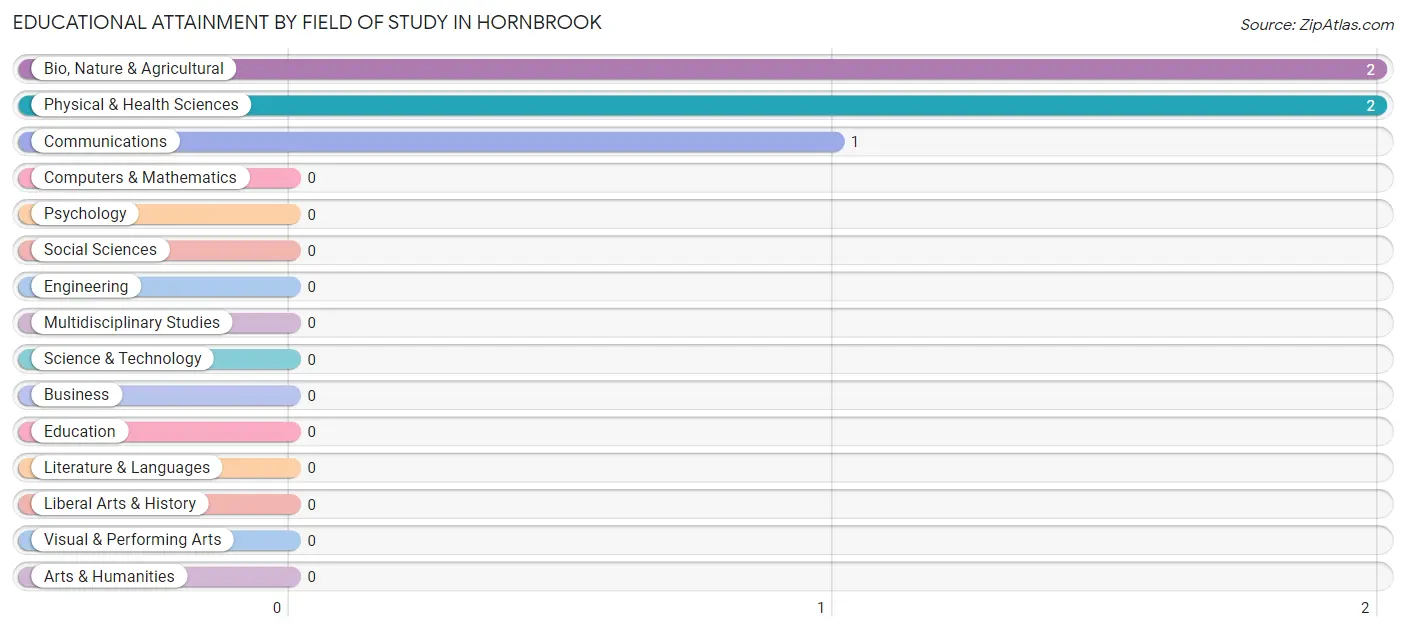
| Field of Study | # Graduates | % Graduates |
| Computers & Mathematics | 0 | 0.0% |
| Bio, Nature & Agricultural | 2 | 40.0% |
| Physical & Health Sciences | 2 | 40.0% |
| Psychology | 0 | 0.0% |
| Social Sciences | 0 | 0.0% |
| Engineering | 0 | 0.0% |
| Multidisciplinary Studies | 0 | 0.0% |
| Science & Technology | 0 | 0.0% |
| Business | 0 | 0.0% |
| Education | 0 | 0.0% |
| Literature & Languages | 0 | 0.0% |
| Liberal Arts & History | 0 | 0.0% |
| Visual & Performing Arts | 0 | 0.0% |
| Communications | 1 | 20.0% |
| Arts & Humanities | 0 | 0.0% |
| Total | 5 | 100.0% |
Transportation & Commute in Hornbrook
Vehicle Availability by Sex in Hornbrook
The most prevalent vehicle ownership categories in Hornbrook are males with 2 vehicles (46, accounting for 93.9%) and females with 2 vehicles (62, making up 63.9%).
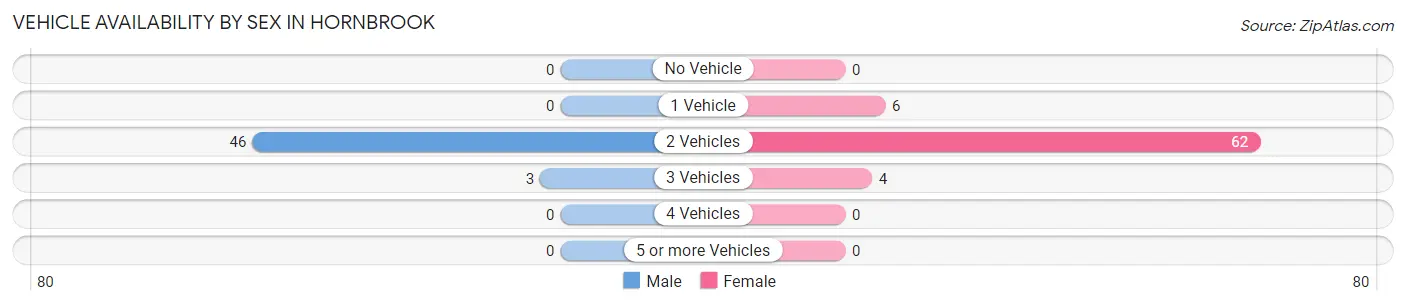
| Vehicles Available | Male | Female |
| No Vehicle | 0 (0.0%) | 0 (0.0%) |
| 1 Vehicle | 0 (0.0%) | 6 (8.3%) |
| 2 Vehicles | 46 (93.9%) | 62 (86.1%) |
| 3 Vehicles | 3 (6.1%) | 4 (5.6%) |
| 4 Vehicles | 0 (0.0%) | 0 (0.0%) |
| 5 or more Vehicles | 0 (0.0%) | 0 (0.0%) |
| Total | 49 (100.0%) | 72 (100.0%) |
Commute Time in Hornbrook
The most frequently occuring commute durations in Hornbrook are 5 to 9 minutes (55 commuters, 46.6%), 15 to 19 minutes (24 commuters, 20.3%), and less than 5 minutes (14 commuters, 11.9%).
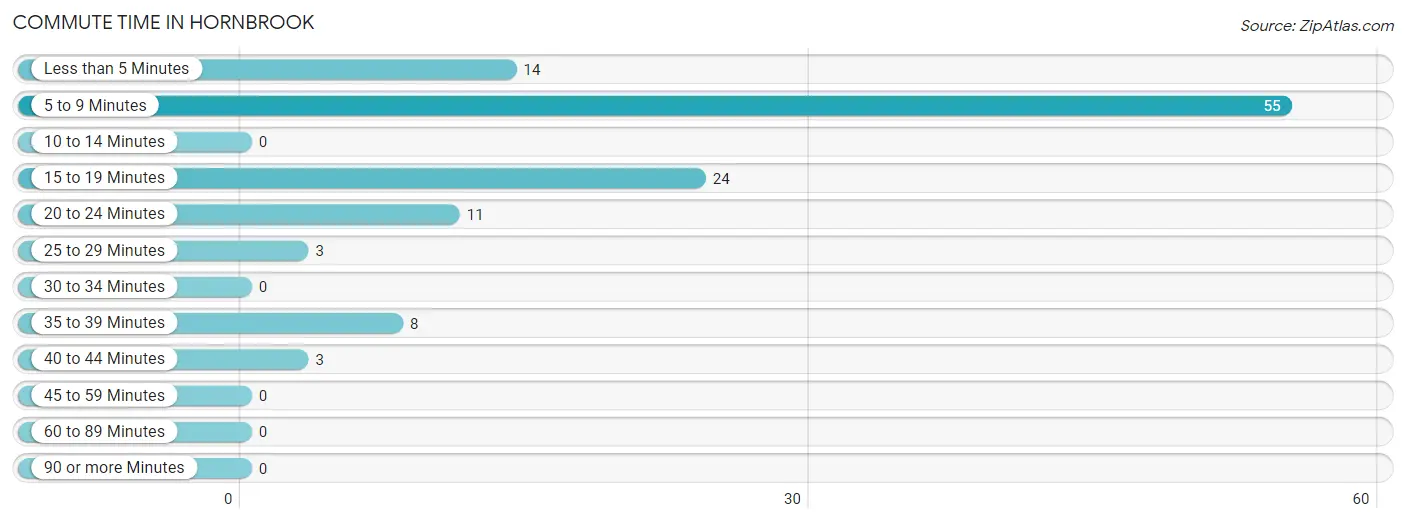
| Commute Time | # Commuters | % Commuters |
| Less than 5 Minutes | 14 | 11.9% |
| 5 to 9 Minutes | 55 | 46.6% |
| 10 to 14 Minutes | 0 | 0.0% |
| 15 to 19 Minutes | 24 | 20.3% |
| 20 to 24 Minutes | 11 | 9.3% |
| 25 to 29 Minutes | 3 | 2.5% |
| 30 to 34 Minutes | 0 | 0.0% |
| 35 to 39 Minutes | 8 | 6.8% |
| 40 to 44 Minutes | 3 | 2.5% |
| 45 to 59 Minutes | 0 | 0.0% |
| 60 to 89 Minutes | 0 | 0.0% |
| 90 or more Minutes | 0 | 0.0% |
Commute Time by Sex in Hornbrook
The most common commute times in Hornbrook are 5 to 9 minutes (29 commuters, 59.2%) for males and 5 to 9 minutes (26 commuters, 37.7%) for females.
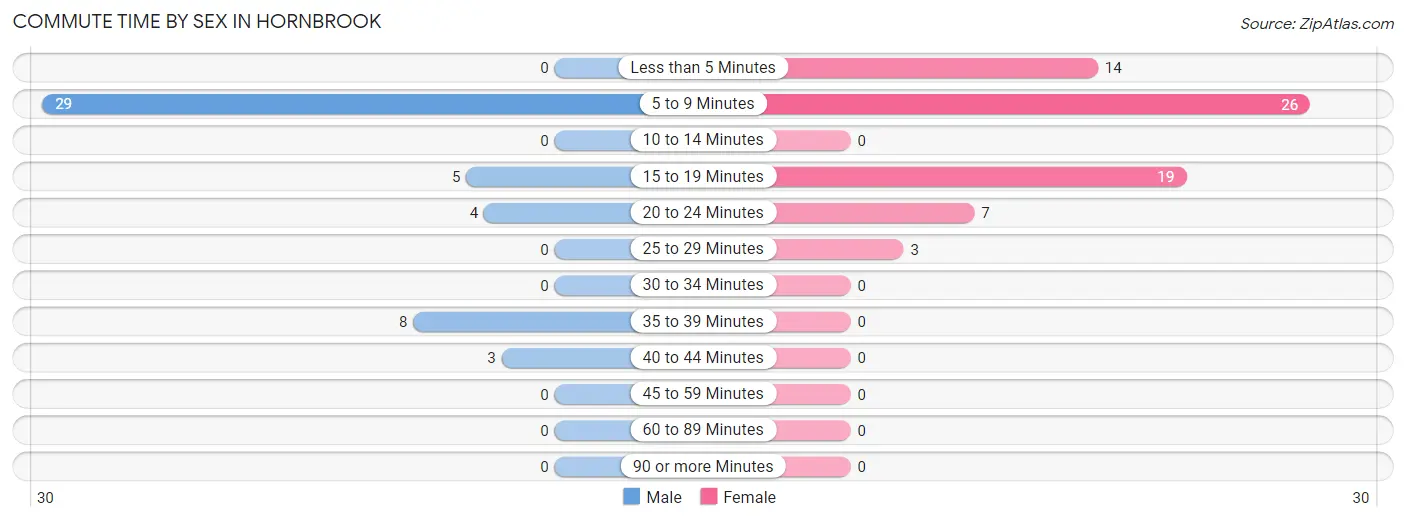
| Commute Time | Male | Female |
| Less than 5 Minutes | 0 (0.0%) | 14 (20.3%) |
| 5 to 9 Minutes | 29 (59.2%) | 26 (37.7%) |
| 10 to 14 Minutes | 0 (0.0%) | 0 (0.0%) |
| 15 to 19 Minutes | 5 (10.2%) | 19 (27.5%) |
| 20 to 24 Minutes | 4 (8.2%) | 7 (10.1%) |
| 25 to 29 Minutes | 0 (0.0%) | 3 (4.3%) |
| 30 to 34 Minutes | 0 (0.0%) | 0 (0.0%) |
| 35 to 39 Minutes | 8 (16.3%) | 0 (0.0%) |
| 40 to 44 Minutes | 3 (6.1%) | 0 (0.0%) |
| 45 to 59 Minutes | 0 (0.0%) | 0 (0.0%) |
| 60 to 89 Minutes | 0 (0.0%) | 0 (0.0%) |
| 90 or more Minutes | 0 (0.0%) | 0 (0.0%) |
Time of Departure to Work by Sex in Hornbrook
The most frequent times of departure to work in Hornbrook are 8:00 AM to 8:29 AM (26, 53.1%) for males and 8:00 AM to 8:29 AM (26, 37.7%) for females.
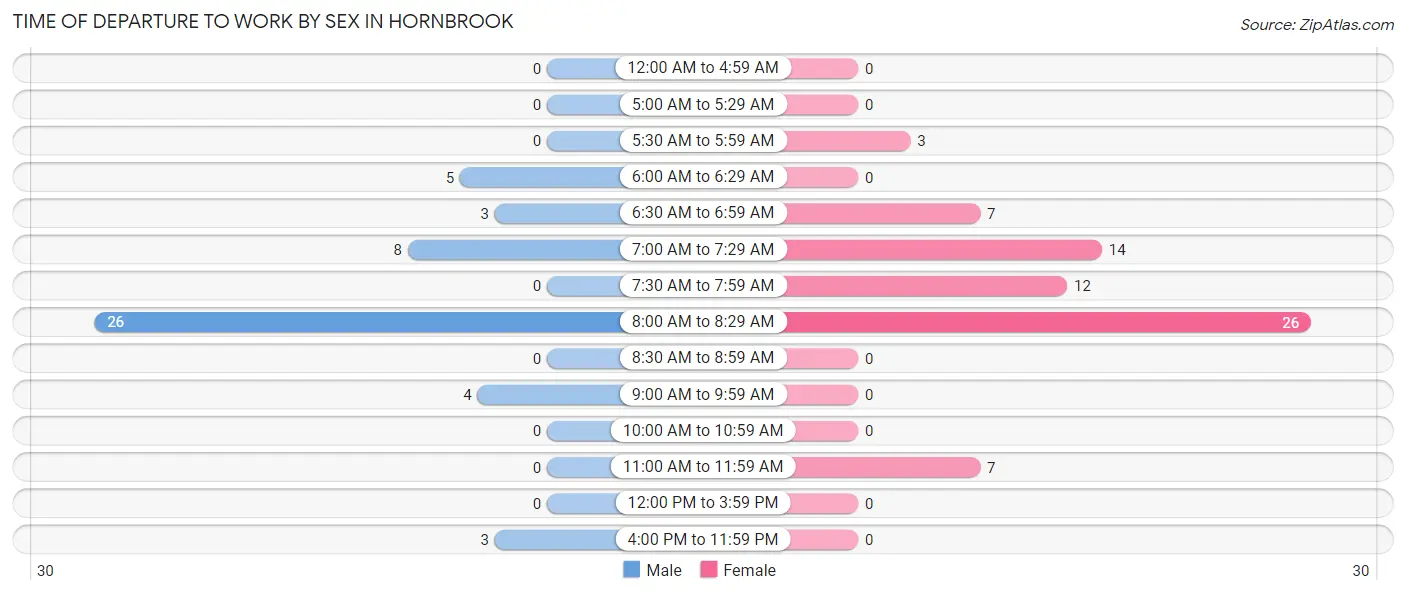
| Time of Departure | Male | Female |
| 12:00 AM to 4:59 AM | 0 (0.0%) | 0 (0.0%) |
| 5:00 AM to 5:29 AM | 0 (0.0%) | 0 (0.0%) |
| 5:30 AM to 5:59 AM | 0 (0.0%) | 3 (4.3%) |
| 6:00 AM to 6:29 AM | 5 (10.2%) | 0 (0.0%) |
| 6:30 AM to 6:59 AM | 3 (6.1%) | 7 (10.1%) |
| 7:00 AM to 7:29 AM | 8 (16.3%) | 14 (20.3%) |
| 7:30 AM to 7:59 AM | 0 (0.0%) | 12 (17.4%) |
| 8:00 AM to 8:29 AM | 26 (53.1%) | 26 (37.7%) |
| 8:30 AM to 8:59 AM | 0 (0.0%) | 0 (0.0%) |
| 9:00 AM to 9:59 AM | 4 (8.2%) | 0 (0.0%) |
| 10:00 AM to 10:59 AM | 0 (0.0%) | 0 (0.0%) |
| 11:00 AM to 11:59 AM | 0 (0.0%) | 7 (10.1%) |
| 12:00 PM to 3:59 PM | 0 (0.0%) | 0 (0.0%) |
| 4:00 PM to 11:59 PM | 3 (6.1%) | 0 (0.0%) |
| Total | 49 (100.0%) | 69 (100.0%) |
Housing Occupancy in Hornbrook
Occupancy by Ownership in Hornbrook
Of the total 145 dwellings in Hornbrook, owner-occupied units account for 77 (53.1%), while renter-occupied units make up 68 (46.9%).
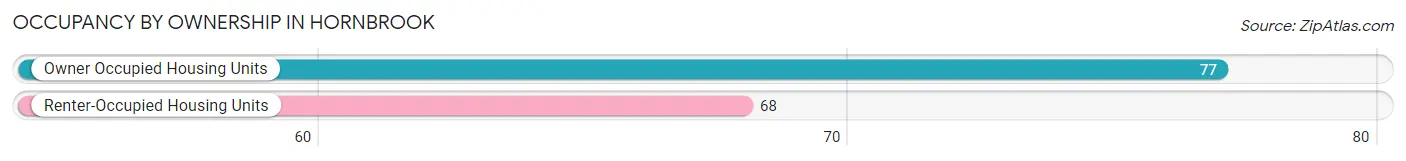
| Occupancy | # Housing Units | % Housing Units |
| Owner Occupied Housing Units | 77 | 53.1% |
| Renter-Occupied Housing Units | 68 | 46.9% |
| Total Occupied Housing Units | 145 | 100.0% |
Occupancy by Household Size in Hornbrook
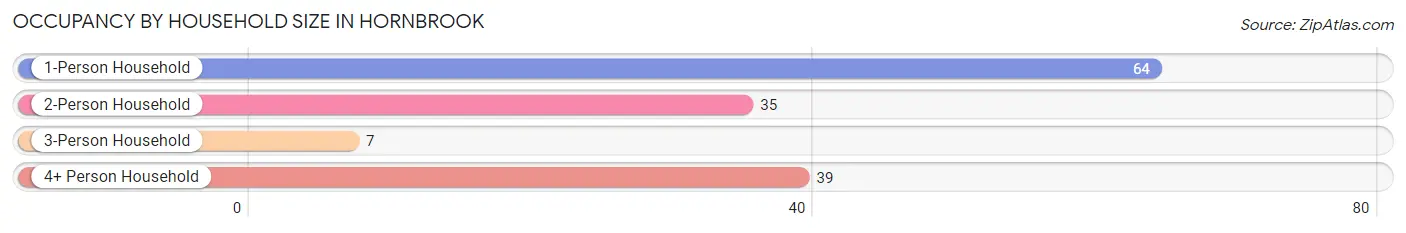
| Household Size | # Housing Units | % Housing Units |
| 1-Person Household | 64 | 44.1% |
| 2-Person Household | 35 | 24.1% |
| 3-Person Household | 7 | 4.8% |
| 4+ Person Household | 39 | 26.9% |
| Total Housing Units | 145 | 100.0% |
Occupancy by Ownership by Household Size in Hornbrook
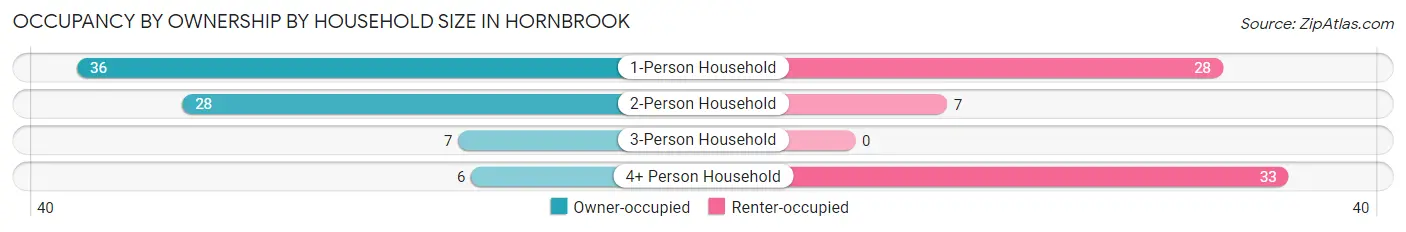
| Household Size | Owner-occupied | Renter-occupied |
| 1-Person Household | 36 (56.2%) | 28 (43.8%) |
| 2-Person Household | 28 (80.0%) | 7 (20.0%) |
| 3-Person Household | 7 (100.0%) | 0 (0.0%) |
| 4+ Person Household | 6 (15.4%) | 33 (84.6%) |
| Total Housing Units | 77 (53.1%) | 68 (46.9%) |
Occupancy by Educational Attainment in Hornbrook
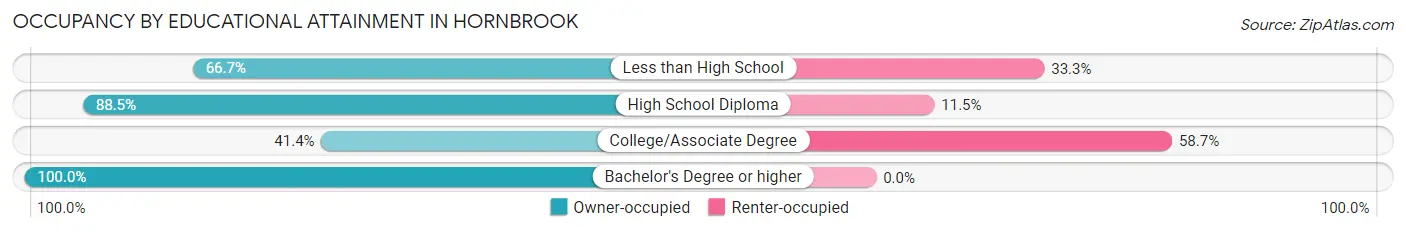
| Household Size | Owner-occupied | Renter-occupied |
| Less than High School | 8 (66.7%) | 4 (33.3%) |
| High School Diploma | 23 (88.5%) | 3 (11.5%) |
| College/Associate Degree | 43 (41.3%) | 61 (58.7%) |
| Bachelor's Degree or higher | 3 (100.0%) | 0 (0.0%) |
Occupancy by Age of Householder in Hornbrook
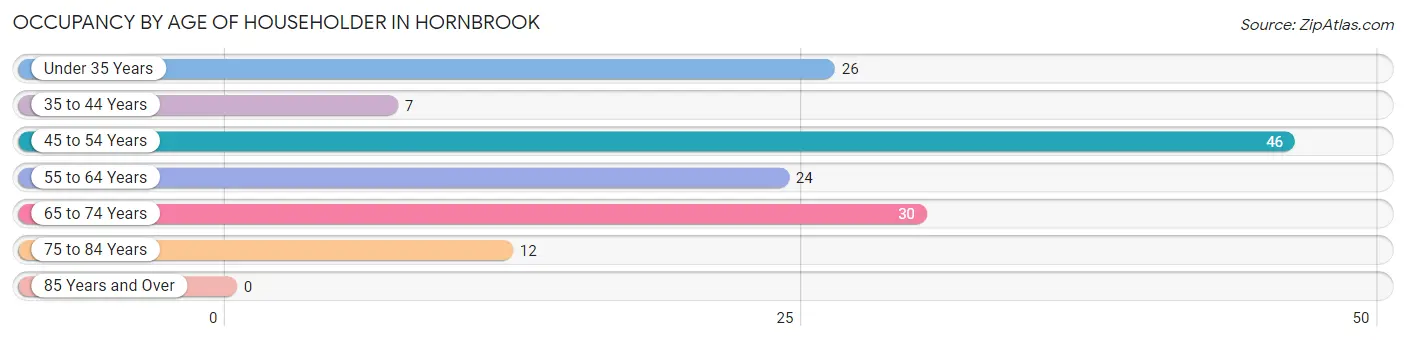
| Age Bracket | # Households | % Households |
| Under 35 Years | 26 | 17.9% |
| 35 to 44 Years | 7 | 4.8% |
| 45 to 54 Years | 46 | 31.7% |
| 55 to 64 Years | 24 | 16.6% |
| 65 to 74 Years | 30 | 20.7% |
| 75 to 84 Years | 12 | 8.3% |
| 85 Years and Over | 0 | 0.0% |
| Total | 145 | 100.0% |
Housing Finances in Hornbrook
Median Income by Occupancy in Hornbrook
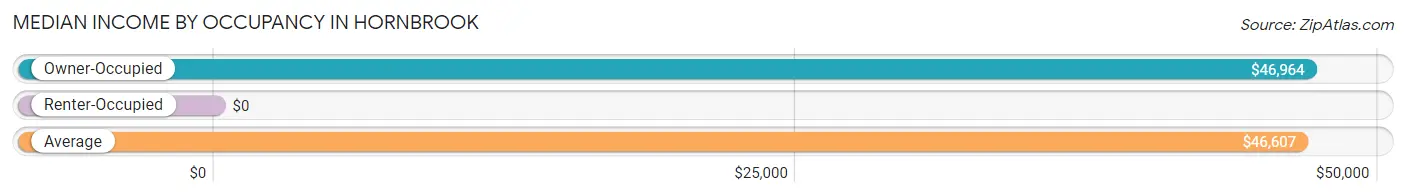
| Occupancy Type | # Households | Median Income |
| Owner-Occupied | 77 (53.1%) | $46,964 |
| Renter-Occupied | 68 (46.9%) | $0 |
| Average | 145 (100.0%) | $46,607 |
Occupancy by Householder Income Bracket in Hornbrook
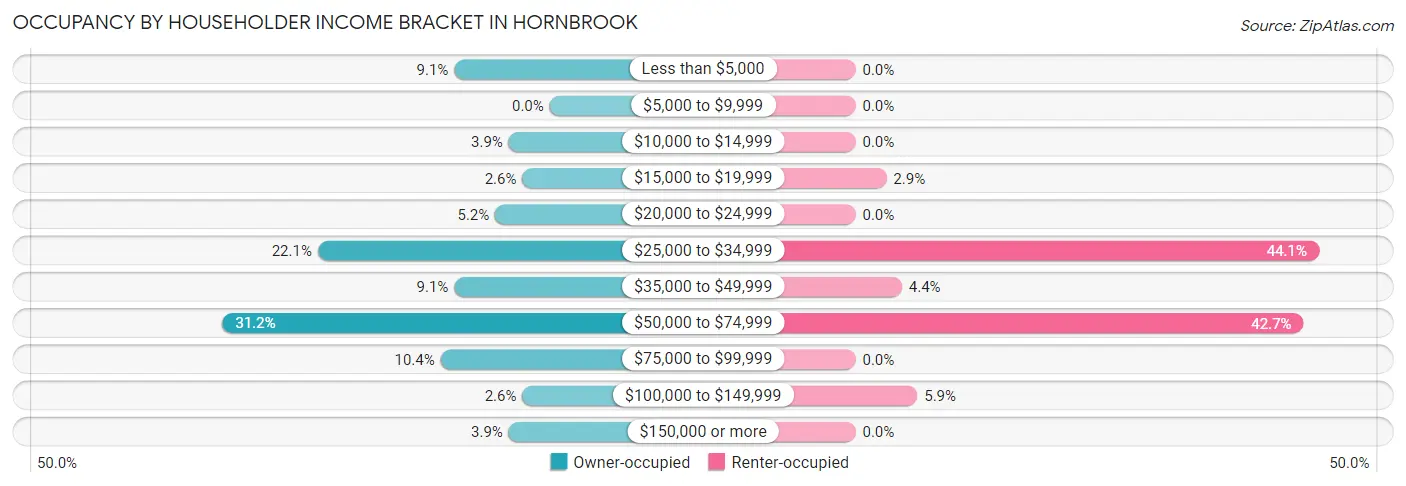
| Income Bracket | Owner-occupied | Renter-occupied |
| Less than $5,000 | 7 (9.1%) | 0 (0.0%) |
| $5,000 to $9,999 | 0 (0.0%) | 0 (0.0%) |
| $10,000 to $14,999 | 3 (3.9%) | 0 (0.0%) |
| $15,000 to $19,999 | 2 (2.6%) | 2 (2.9%) |
| $20,000 to $24,999 | 4 (5.2%) | 0 (0.0%) |
| $25,000 to $34,999 | 17 (22.1%) | 30 (44.1%) |
| $35,000 to $49,999 | 7 (9.1%) | 3 (4.4%) |
| $50,000 to $74,999 | 24 (31.2%) | 29 (42.6%) |
| $75,000 to $99,999 | 8 (10.4%) | 0 (0.0%) |
| $100,000 to $149,999 | 2 (2.6%) | 4 (5.9%) |
| $150,000 or more | 3 (3.9%) | 0 (0.0%) |
| Total | 77 (100.0%) | 68 (100.0%) |
Monthly Housing Cost Tiers in Hornbrook
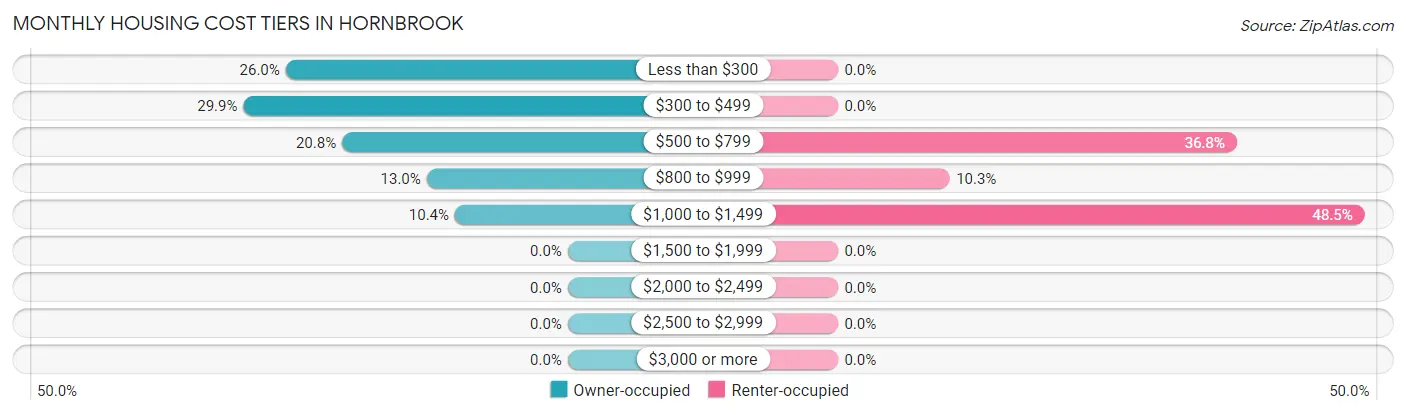
| Monthly Cost | Owner-occupied | Renter-occupied |
| Less than $300 | 20 (26.0%) | 0 (0.0%) |
| $300 to $499 | 23 (29.9%) | 0 (0.0%) |
| $500 to $799 | 16 (20.8%) | 25 (36.8%) |
| $800 to $999 | 10 (13.0%) | 7 (10.3%) |
| $1,000 to $1,499 | 8 (10.4%) | 33 (48.5%) |
| $1,500 to $1,999 | 0 (0.0%) | 0 (0.0%) |
| $2,000 to $2,499 | 0 (0.0%) | 0 (0.0%) |
| $2,500 to $2,999 | 0 (0.0%) | 0 (0.0%) |
| $3,000 or more | 0 (0.0%) | 0 (0.0%) |
| Total | 77 (100.0%) | 68 (100.0%) |
Physical Housing Characteristics in Hornbrook
Housing Structures in Hornbrook
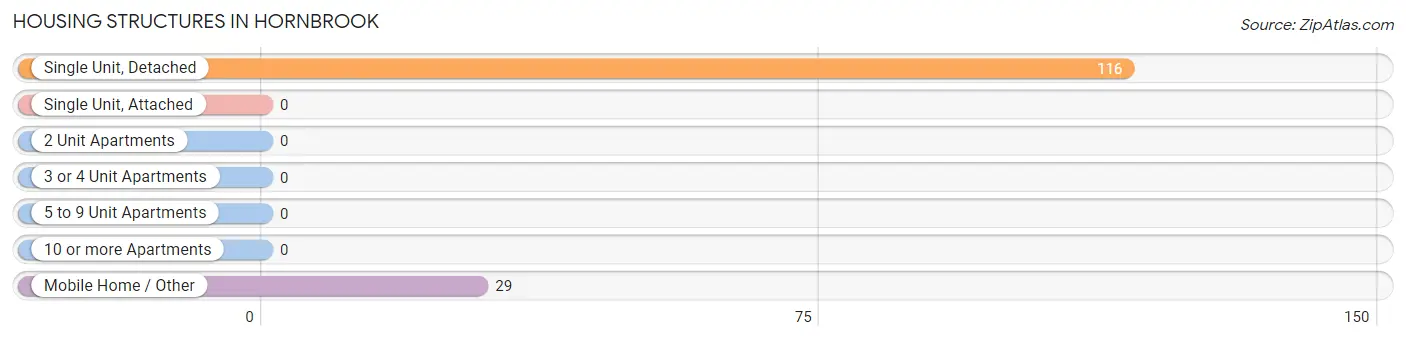
| Structure Type | # Housing Units | % Housing Units |
| Single Unit, Detached | 116 | 80.0% |
| Single Unit, Attached | 0 | 0.0% |
| 2 Unit Apartments | 0 | 0.0% |
| 3 or 4 Unit Apartments | 0 | 0.0% |
| 5 to 9 Unit Apartments | 0 | 0.0% |
| 10 or more Apartments | 0 | 0.0% |
| Mobile Home / Other | 29 | 20.0% |
| Total | 145 | 100.0% |
Housing Structures by Occupancy in Hornbrook
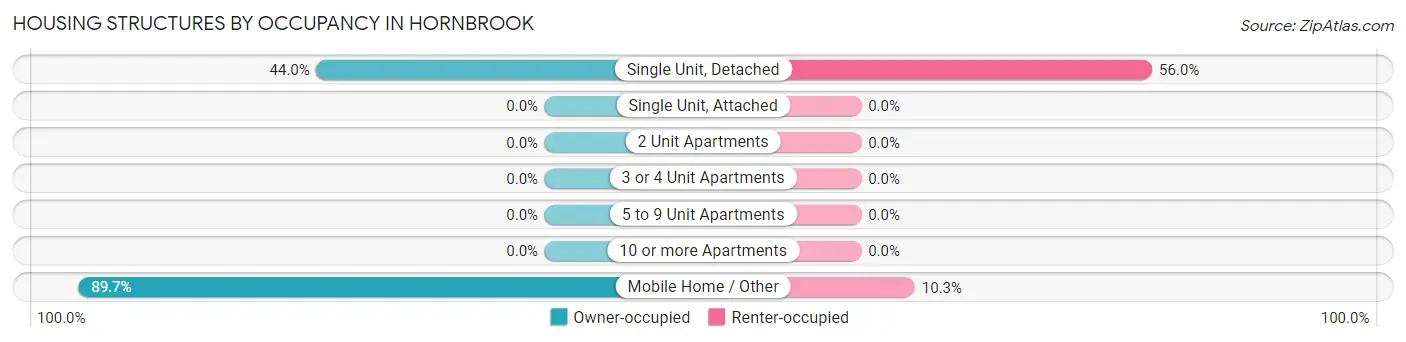
| Structure Type | Owner-occupied | Renter-occupied |
| Single Unit, Detached | 51 (44.0%) | 65 (56.0%) |
| Single Unit, Attached | 0 (0.0%) | 0 (0.0%) |
| 2 Unit Apartments | 0 (0.0%) | 0 (0.0%) |
| 3 or 4 Unit Apartments | 0 (0.0%) | 0 (0.0%) |
| 5 to 9 Unit Apartments | 0 (0.0%) | 0 (0.0%) |
| 10 or more Apartments | 0 (0.0%) | 0 (0.0%) |
| Mobile Home / Other | 26 (89.7%) | 3 (10.3%) |
| Total | 77 (53.1%) | 68 (46.9%) |
Housing Structures by Number of Rooms in Hornbrook
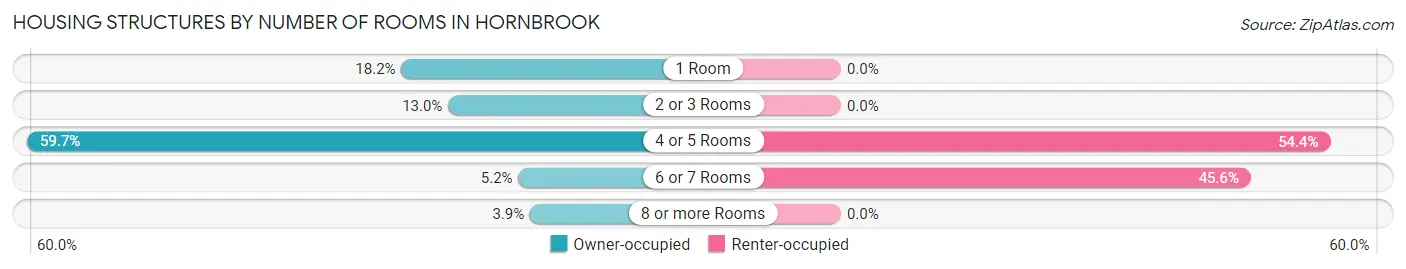
| Number of Rooms | Owner-occupied | Renter-occupied |
| 1 Room | 14 (18.2%) | 0 (0.0%) |
| 2 or 3 Rooms | 10 (13.0%) | 0 (0.0%) |
| 4 or 5 Rooms | 46 (59.7%) | 37 (54.4%) |
| 6 or 7 Rooms | 4 (5.2%) | 31 (45.6%) |
| 8 or more Rooms | 3 (3.9%) | 0 (0.0%) |
| Total | 77 (100.0%) | 68 (100.0%) |
Housing Structure by Heating Type in Hornbrook
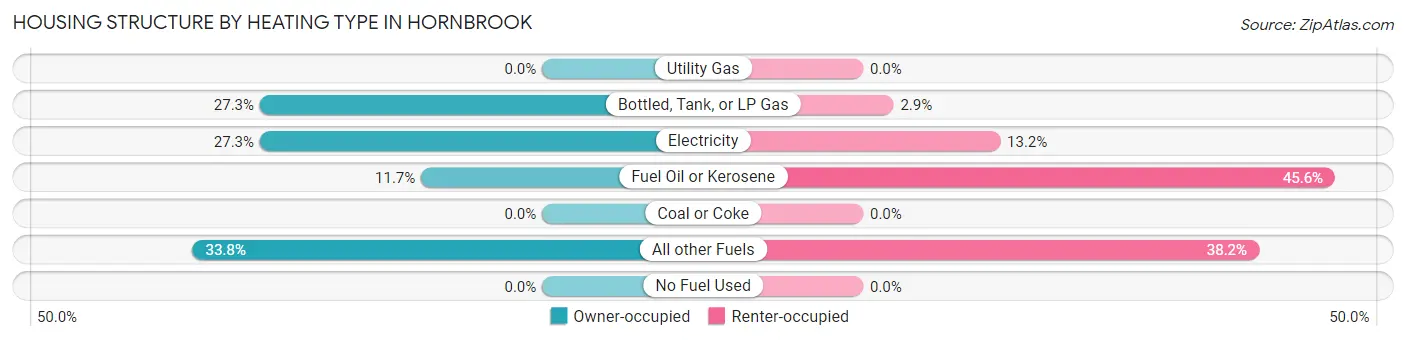
| Heating Type | Owner-occupied | Renter-occupied |
| Utility Gas | 0 (0.0%) | 0 (0.0%) |
| Bottled, Tank, or LP Gas | 21 (27.3%) | 2 (2.9%) |
| Electricity | 21 (27.3%) | 9 (13.2%) |
| Fuel Oil or Kerosene | 9 (11.7%) | 31 (45.6%) |
| Coal or Coke | 0 (0.0%) | 0 (0.0%) |
| All other Fuels | 26 (33.8%) | 26 (38.2%) |
| No Fuel Used | 0 (0.0%) | 0 (0.0%) |
| Total | 77 (100.0%) | 68 (100.0%) |
Household Vehicle Usage in Hornbrook
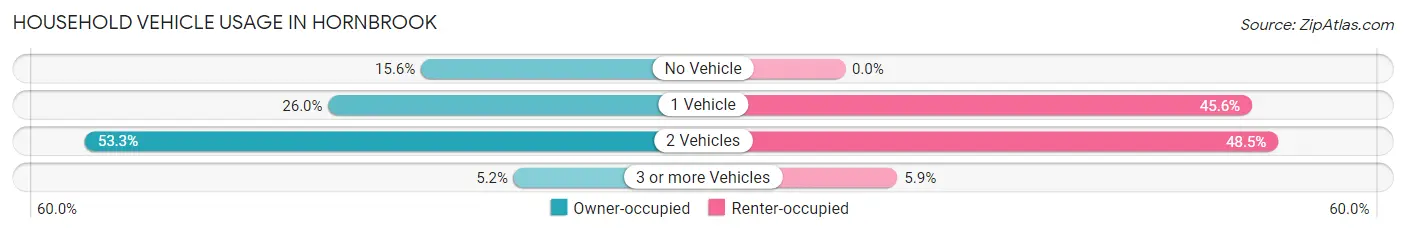
| Vehicles per Household | Owner-occupied | Renter-occupied |
| No Vehicle | 12 (15.6%) | 0 (0.0%) |
| 1 Vehicle | 20 (26.0%) | 31 (45.6%) |
| 2 Vehicles | 41 (53.2%) | 33 (48.5%) |
| 3 or more Vehicles | 4 (5.2%) | 4 (5.9%) |
| Total | 77 (100.0%) | 68 (100.0%) |
Real Estate & Mortgages in Hornbrook
Real Estate and Mortgage Overview in Hornbrook
| Characteristic | Without Mortgage | With Mortgage |
| Housing Units | 57 | 20 |
| Median Property Value | $54,600 | $0 |
| Median Household Income | - | - |
| Monthly Housing Costs | $367 | $0 |
| Real Estate Taxes | $800 | $0 |
Property Value by Mortgage Status in Hornbrook
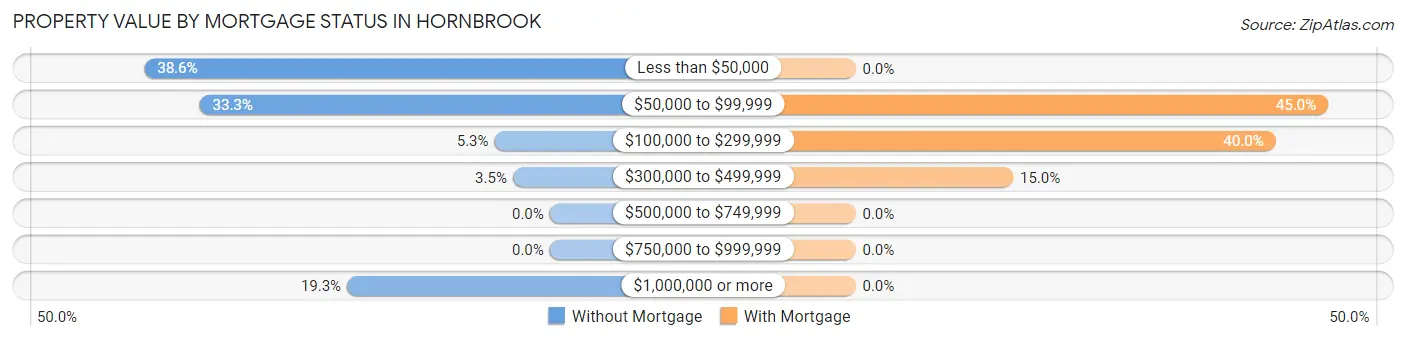
| Property Value | Without Mortgage | With Mortgage |
| Less than $50,000 | 22 (38.6%) | 0 (0.0%) |
| $50,000 to $99,999 | 19 (33.3%) | 9 (45.0%) |
| $100,000 to $299,999 | 3 (5.3%) | 8 (40.0%) |
| $300,000 to $499,999 | 2 (3.5%) | 3 (15.0%) |
| $500,000 to $749,999 | 0 (0.0%) | 0 (0.0%) |
| $750,000 to $999,999 | 0 (0.0%) | 0 (0.0%) |
| $1,000,000 or more | 11 (19.3%) | 0 (0.0%) |
| Total | 57 (100.0%) | 20 (100.0%) |
Household Income by Mortgage Status in Hornbrook
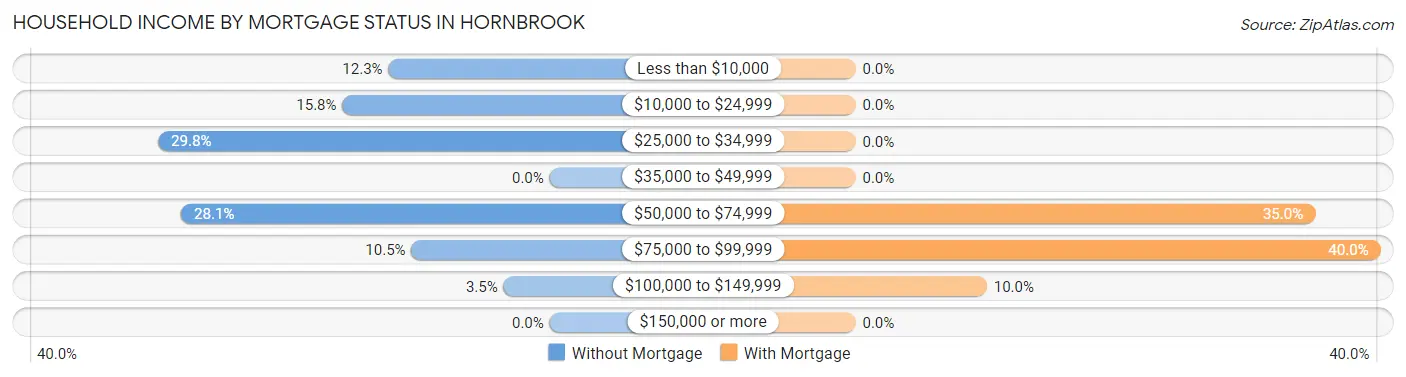
| Household Income | Without Mortgage | With Mortgage |
| Less than $10,000 | 7 (12.3%) | 0 (0.0%) |
| $10,000 to $24,999 | 9 (15.8%) | 0 (0.0%) |
| $25,000 to $34,999 | 17 (29.8%) | 0 (0.0%) |
| $35,000 to $49,999 | 0 (0.0%) | 0 (0.0%) |
| $50,000 to $74,999 | 16 (28.1%) | 7 (35.0%) |
| $75,000 to $99,999 | 6 (10.5%) | 8 (40.0%) |
| $100,000 to $149,999 | 2 (3.5%) | 2 (10.0%) |
| $150,000 or more | 0 (0.0%) | 0 (0.0%) |
| Total | 57 (100.0%) | 20 (100.0%) |
Property Value to Household Income Ratio in Hornbrook
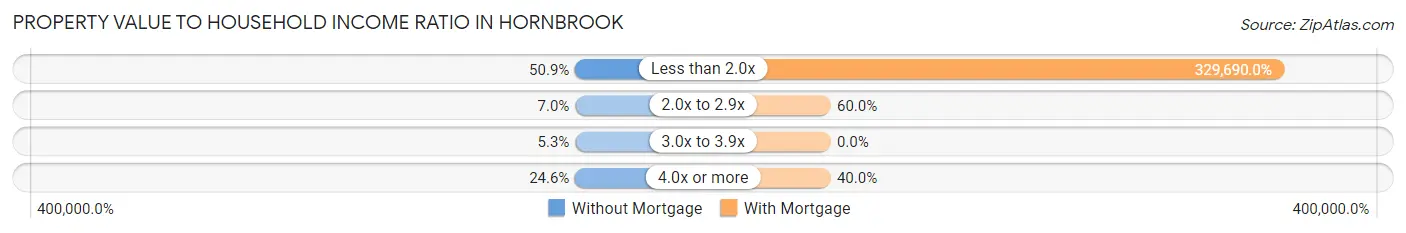
| Value-to-Income Ratio | Without Mortgage | With Mortgage |
| Less than 2.0x | 29 (50.9%) | 65,938 (329,690.0%) |
| 2.0x to 2.9x | 4 (7.0%) | 12 (60.0%) |
| 3.0x to 3.9x | 3 (5.3%) | 0 (0.0%) |
| 4.0x or more | 14 (24.6%) | 8 (40.0%) |
| Total | 57 (100.0%) | 20 (100.0%) |
Real Estate Taxes by Mortgage Status in Hornbrook
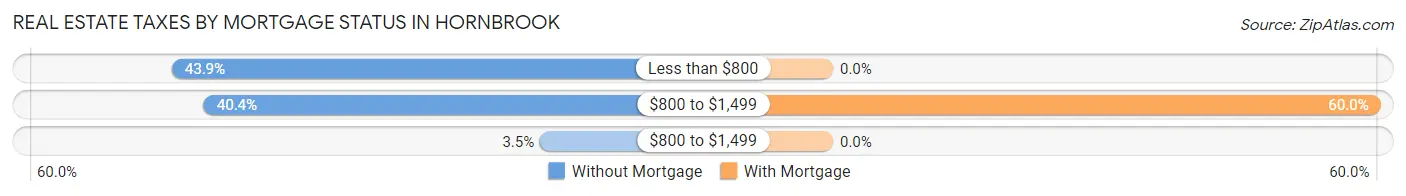
| Property Taxes | Without Mortgage | With Mortgage |
| Less than $800 | 25 (43.9%) | 0 (0.0%) |
| $800 to $1,499 | 23 (40.4%) | 12 (60.0%) |
| $800 to $1,499 | 2 (3.5%) | 0 (0.0%) |
| Total | 57 (100.0%) | 20 (100.0%) |
Health & Disability in Hornbrook
Health Insurance Coverage by Age in Hornbrook
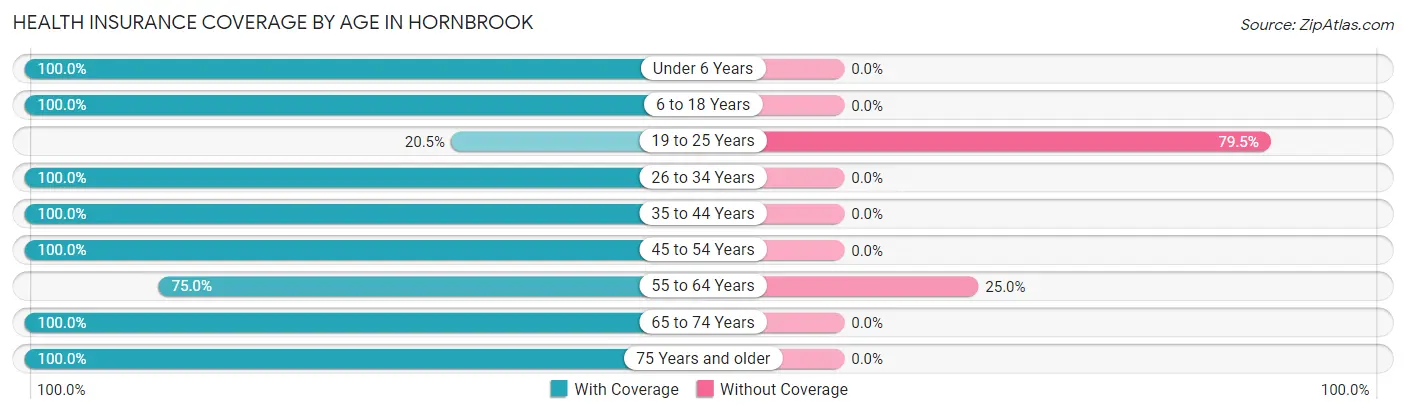
| Age Bracket | With Coverage | Without Coverage |
| Under 6 Years | 68 (100.0%) | 0 (0.0%) |
| 6 to 18 Years | 74 (100.0%) | 0 (0.0%) |
| 19 to 25 Years | 8 (20.5%) | 31 (79.5%) |
| 26 to 34 Years | 31 (100.0%) | 0 (0.0%) |
| 35 to 44 Years | 29 (100.0%) | 0 (0.0%) |
| 45 to 54 Years | 46 (100.0%) | 0 (0.0%) |
| 55 to 64 Years | 21 (75.0%) | 7 (25.0%) |
| 65 to 74 Years | 41 (100.0%) | 0 (0.0%) |
| 75 Years and older | 25 (100.0%) | 0 (0.0%) |
| Total | 343 (90.0%) | 38 (10.0%) |
Health Insurance Coverage by Citizenship Status in Hornbrook
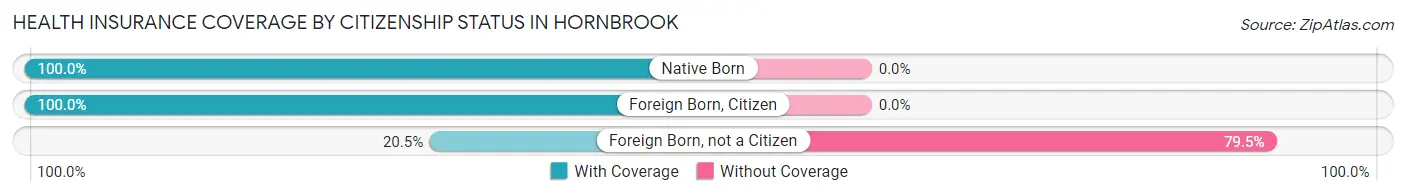
| Citizenship Status | With Coverage | Without Coverage |
| Native Born | 68 (100.0%) | 0 (0.0%) |
| Foreign Born, Citizen | 74 (100.0%) | 0 (0.0%) |
| Foreign Born, not a Citizen | 8 (20.5%) | 31 (79.5%) |
Health Insurance Coverage by Household Income in Hornbrook
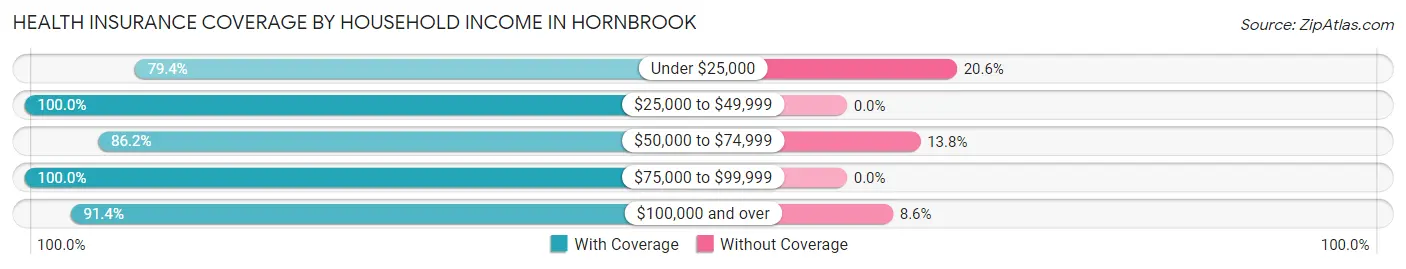
| Household Income | With Coverage | Without Coverage |
| Under $25,000 | 27 (79.4%) | 7 (20.6%) |
| $25,000 to $49,999 | 85 (100.0%) | 0 (0.0%) |
| $50,000 to $74,999 | 163 (86.2%) | 26 (13.8%) |
| $75,000 to $99,999 | 15 (100.0%) | 0 (0.0%) |
| $100,000 and over | 53 (91.4%) | 5 (8.6%) |
Public vs Private Health Insurance Coverage by Age in Hornbrook
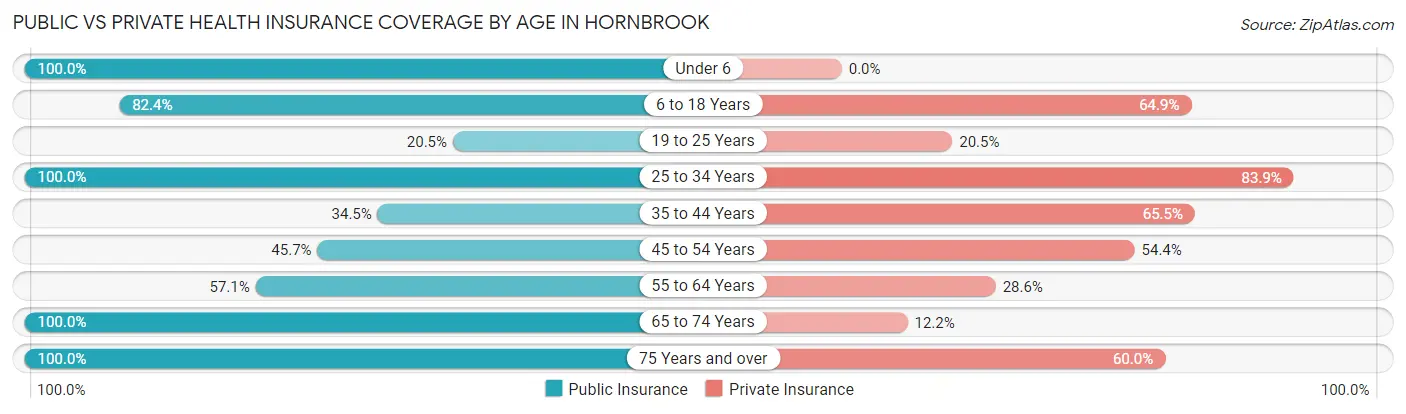
| Age Bracket | Public Insurance | Private Insurance |
| Under 6 | 68 (100.0%) | 0 (0.0%) |
| 6 to 18 Years | 61 (82.4%) | 48 (64.9%) |
| 19 to 25 Years | 8 (20.5%) | 8 (20.5%) |
| 25 to 34 Years | 31 (100.0%) | 26 (83.9%) |
| 35 to 44 Years | 10 (34.5%) | 19 (65.5%) |
| 45 to 54 Years | 21 (45.7%) | 25 (54.3%) |
| 55 to 64 Years | 16 (57.1%) | 8 (28.6%) |
| 65 to 74 Years | 41 (100.0%) | 5 (12.2%) |
| 75 Years and over | 25 (100.0%) | 15 (60.0%) |
| Total | 281 (73.8%) | 154 (40.4%) |
Disability Status by Sex by Age in Hornbrook
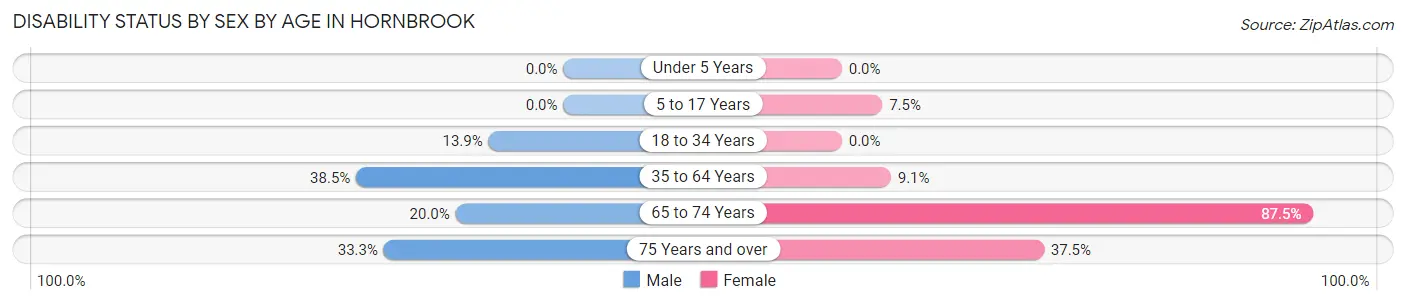
| Age Bracket | Male | Female |
| Under 5 Years | 0 (0.0%) | 0 (0.0%) |
| 5 to 17 Years | 0 (0.0%) | 3 (7.5%) |
| 18 to 34 Years | 5 (13.9%) | 0 (0.0%) |
| 35 to 64 Years | 10 (38.5%) | 7 (9.1%) |
| 65 to 74 Years | 5 (20.0%) | 14 (87.5%) |
| 75 Years and over | 3 (33.3%) | 6 (37.5%) |
Disability Class by Sex by Age in Hornbrook
Disability Class: Hearing Difficulty
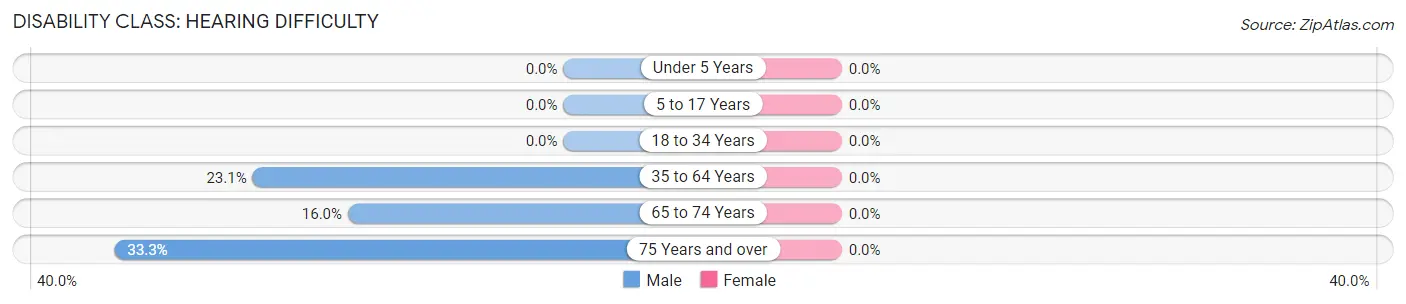
| Age Bracket | Male | Female |
| Under 5 Years | 0 (0.0%) | 0 (0.0%) |
| 5 to 17 Years | 0 (0.0%) | 0 (0.0%) |
| 18 to 34 Years | 0 (0.0%) | 0 (0.0%) |
| 35 to 64 Years | 6 (23.1%) | 0 (0.0%) |
| 65 to 74 Years | 4 (16.0%) | 0 (0.0%) |
| 75 Years and over | 3 (33.3%) | 0 (0.0%) |
Disability Class: Vision Difficulty
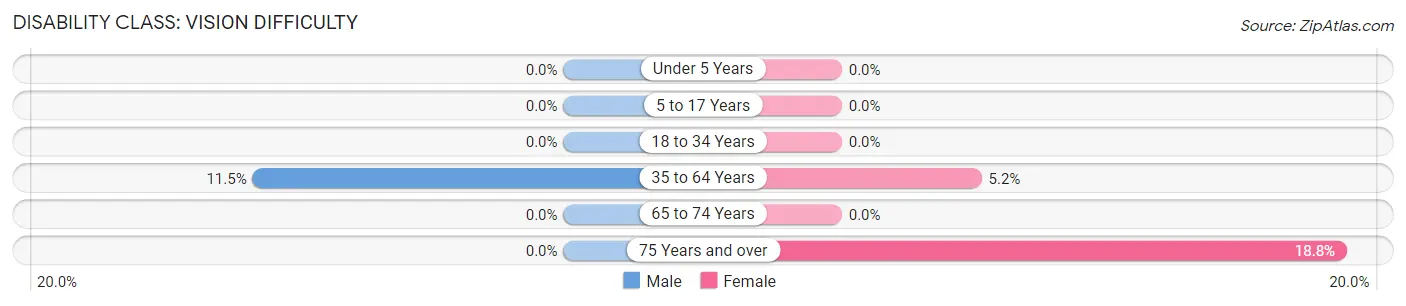
| Age Bracket | Male | Female |
| Under 5 Years | 0 (0.0%) | 0 (0.0%) |
| 5 to 17 Years | 0 (0.0%) | 0 (0.0%) |
| 18 to 34 Years | 0 (0.0%) | 0 (0.0%) |
| 35 to 64 Years | 3 (11.5%) | 4 (5.2%) |
| 65 to 74 Years | 0 (0.0%) | 0 (0.0%) |
| 75 Years and over | 0 (0.0%) | 3 (18.8%) |
Disability Class: Cognitive Difficulty
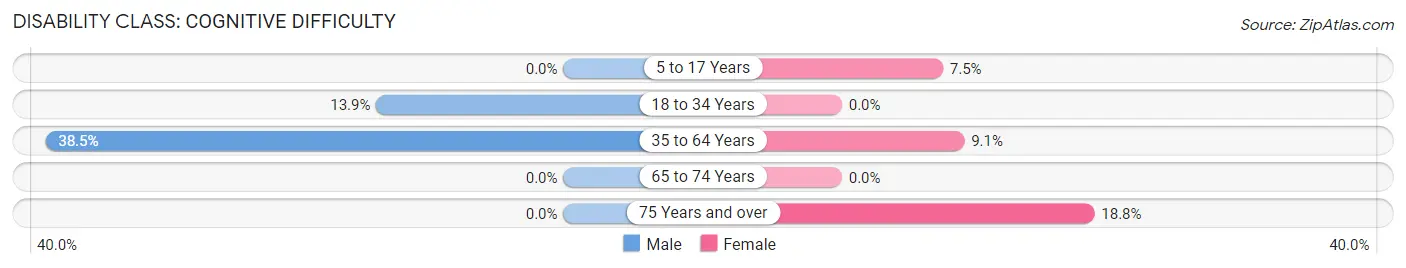
| Age Bracket | Male | Female |
| 5 to 17 Years | 0 (0.0%) | 3 (7.5%) |
| 18 to 34 Years | 5 (13.9%) | 0 (0.0%) |
| 35 to 64 Years | 10 (38.5%) | 7 (9.1%) |
| 65 to 74 Years | 0 (0.0%) | 0 (0.0%) |
| 75 Years and over | 0 (0.0%) | 3 (18.8%) |
Disability Class: Ambulatory Difficulty
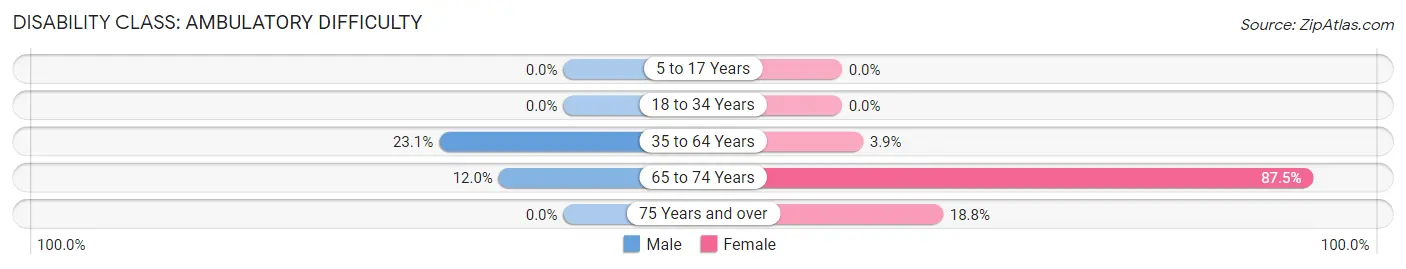
| Age Bracket | Male | Female |
| 5 to 17 Years | 0 (0.0%) | 0 (0.0%) |
| 18 to 34 Years | 0 (0.0%) | 0 (0.0%) |
| 35 to 64 Years | 6 (23.1%) | 3 (3.9%) |
| 65 to 74 Years | 3 (12.0%) | 14 (87.5%) |
| 75 Years and over | 0 (0.0%) | 3 (18.8%) |
Disability Class: Self-Care Difficulty
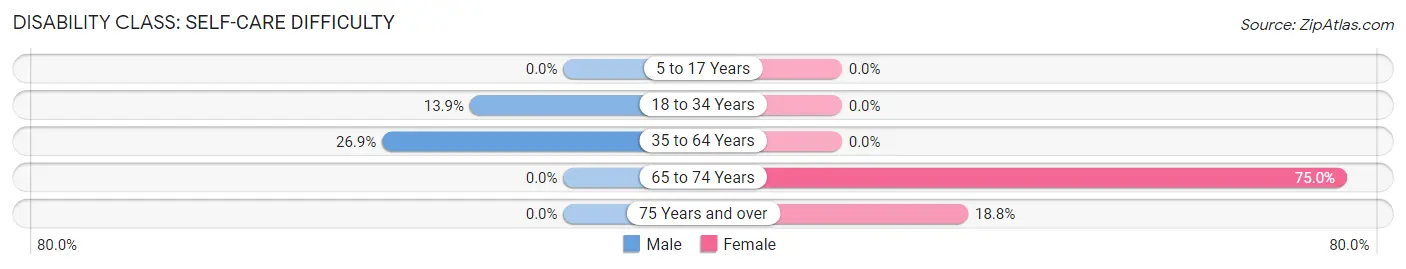
| Age Bracket | Male | Female |
| 5 to 17 Years | 0 (0.0%) | 0 (0.0%) |
| 18 to 34 Years | 5 (13.9%) | 0 (0.0%) |
| 35 to 64 Years | 7 (26.9%) | 0 (0.0%) |
| 65 to 74 Years | 0 (0.0%) | 12 (75.0%) |
| 75 Years and over | 0 (0.0%) | 3 (18.8%) |
Technology Access in Hornbrook
Computing Device Access in Hornbrook
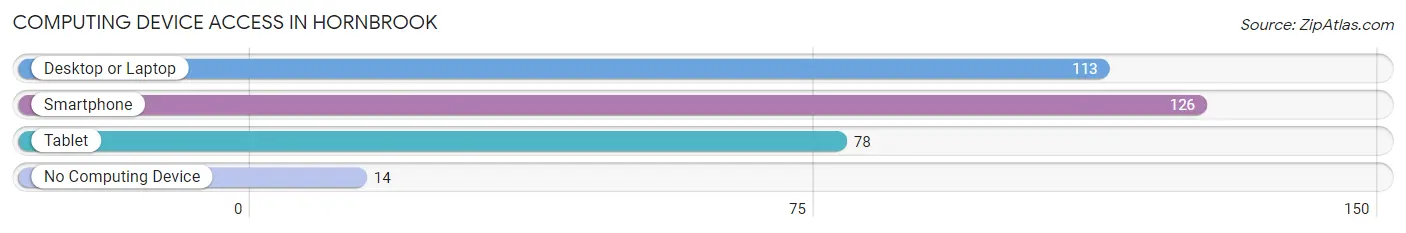
| Device Type | # Households | % Households |
| Desktop or Laptop | 113 | 77.9% |
| Smartphone | 126 | 86.9% |
| Tablet | 78 | 53.8% |
| No Computing Device | 14 | 9.7% |
| Total | 145 | 100.0% |
Internet Access in Hornbrook
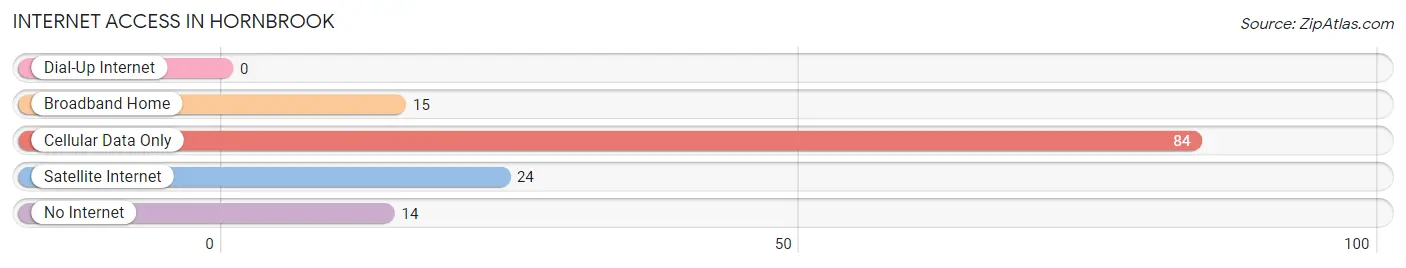
| Internet Type | # Households | % Households |
| Dial-Up Internet | 0 | 0.0% |
| Broadband Home | 15 | 10.3% |
| Cellular Data Only | 84 | 57.9% |
| Satellite Internet | 24 | 16.6% |
| No Internet | 14 | 9.7% |
| Total | 145 | 100.0% |
Hornbrook Summary
Hornbrook is a small unincorporated community located in Siskiyou County, California, United States. It is situated along Interstate 5, approximately 10 miles (16 km) south of the Oregon border. The population of Hornbrook was estimated to be around 200 in 2020.
History
Hornbrook was founded in 1852 by William Hornbrook, a settler from Ohio. He established a trading post and a stagecoach stop along the Applegate Trail, which was a major route for settlers traveling to California during the Gold Rush. The town was named after him.
In the late 19th century, Hornbrook was a bustling town with a population of over 500. It had a post office, a hotel, a general store, a blacksmith shop, and a saloon. The town was also home to a number of businesses, including a sawmill, a flour mill, and a brickyard.
In the early 20th century, the population of Hornbrook began to decline as the Applegate Trail was replaced by the railroad. The town was bypassed by the railroad and the population dwindled to just a few hundred by the 1950s.
Geography
Hornbrook is located in the Klamath Mountains of northern California. It is situated along Interstate 5, approximately 10 miles (16 km) south of the Oregon border. The town is surrounded by the Klamath National Forest and is located near the headwaters of the Klamath River.
The climate in Hornbrook is semi-arid, with hot summers and cold winters. The average annual temperature is around 50°F (10°C). The average annual precipitation is around 20 inches (51 cm).
Economy
The economy of Hornbrook is largely based on tourism. The town is a popular destination for outdoor activities such as fishing, hunting, and camping. There are also several businesses in town, including a gas station, a restaurant, and a general store.
Demographics
As of the 2010 census, the population of Hornbrook was estimated to be around 200. The racial makeup of the town was 94.5% White, 0.5% African American, 0.5% Native American, 0.5% Asian, and 4.0% from other races. The median household income was $31,250 and the median family income was $37,500.
Conclusion
Hornbrook is a small unincorporated community located in Siskiyou County, California. It was founded in 1852 by William Hornbrook and was once a bustling town with a population of over 500. Today, the population of Hornbrook is estimated to be around 200 and the economy is largely based on tourism. The town is a popular destination for outdoor activities such as fishing, hunting, and camping.
Common Questions
What is Per Capita Income in Hornbrook?
Per Capita income in Hornbrook is $21,811.
What is the Median Family Income in Hornbrook?
Median Family Income in Hornbrook is $32,404.
What is the Median Household income in Hornbrook?
Median Household Income in Hornbrook is $46,607.
What is Income or Wage Gap in Hornbrook?
Income or Wage Gap in Hornbrook is 17.6%.
Women in Hornbrook earn 82.4 cents for every dollar earned by a man.
What is Inequality or Gini Index in Hornbrook?
Inequality or Gini Index in Hornbrook is 0.37.
What is the Total Population of Hornbrook?
Total Population of Hornbrook is 381.
What is the Total Male Population of Hornbrook?
Total Male Population of Hornbrook is 135.
What is the Total Female Population of Hornbrook?
Total Female Population of Hornbrook is 246.
What is the Ratio of Males per 100 Females in Hornbrook?
There are 54.88 Males per 100 Females in Hornbrook.
What is the Ratio of Females per 100 Males in Hornbrook?
There are 182.22 Females per 100 Males in Hornbrook.
What is the Median Population Age in Hornbrook?
Median Population Age in Hornbrook is 34.2 Years.
What is the Average Family Size in Hornbrook
Average Family Size in Hornbrook is 3.5 People.
What is the Average Household Size in Hornbrook
Average Household Size in Hornbrook is 2.6 People.
How Large is the Labor Force in Hornbrook?
There are 150 People in the Labor Forcein in Hornbrook.
What is the Percentage of People in the Labor Force in Hornbrook?
60.2% of People are in the Labor Force in Hornbrook.
What is the Unemployment Rate in Hornbrook?
Unemployment Rate in Hornbrook is 19.3%.