Cities with the Highest Percentage of Population with a Degree in Physical and Health Sciences in Nevada
RELATED REPORTS & OPTIONS
Physical and Health Sciences
Nevada
Compare Cities
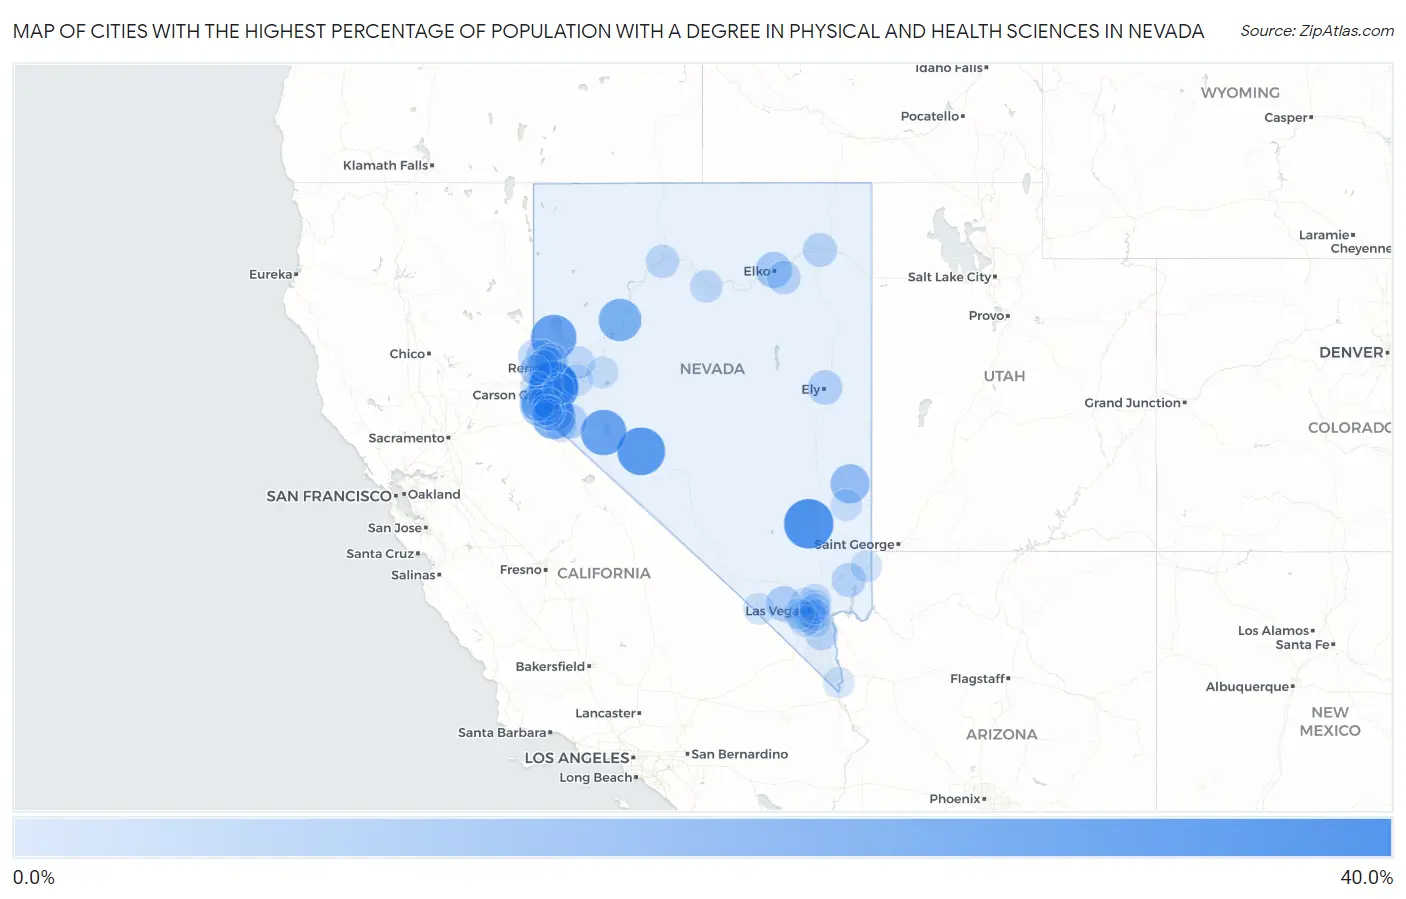
Map of Cities with the Highest Percentage of Population with a Degree in Physical and Health Sciences in Nevada
0.0%
40.0%
Cities with the Highest Percentage of Population with a Degree in Physical and Health Sciences in Nevada
| City | % Graduates | vs State | vs National | |
| 1. | Silver City | 31.6% | 3.2%(+28.4)#1 | 3.1%(+28.5)#233 |
| 2. | Alamo | 31.5% | 3.2%(+28.3)#2 | 3.1%(+28.4)#237 |
| 3. | Virginia City | 28.8% | 3.2%(+25.7)#3 | 3.1%(+25.7)#281 |
| 4. | Mina | 28.6% | 3.2%(+25.4)#4 | 3.1%(+25.5)#291 |
| 5. | Walker Lake | 25.0% | 3.2%(+21.8)#5 | 3.1%(+21.9)#366 |
| 6. | Sutcliffe | 25.0% | 3.2%(+21.8)#6 | 3.1%(+21.9)#372 |
| 7. | Carter Springs | 21.3% | 3.2%(+18.2)#7 | 3.1%(+18.2)#494 |
| 8. | Lovelock | 19.6% | 3.2%(+16.4)#8 | 3.1%(+16.5)#570 |
| 9. | Fish Springs | 16.0% | 3.2%(+12.8)#9 | 3.1%(+12.9)#796 |
| 10. | Pioche | 14.3% | 3.2%(+11.1)#10 | 3.1%(+11.2)#944 |
| 11. | Kingsbury | 12.6% | 3.2%(+9.48)#11 | 3.1%(+9.54)#1,140 |
| 12. | Elko | 9.5% | 3.2%(+6.35)#12 | 3.1%(+6.41)#1,729 |
| 13. | Lakeridge | 8.4% | 3.2%(+5.24)#13 | 3.1%(+5.29)#2,086 |
| 14. | Mount Charleston | 8.2% | 3.2%(+5.04)#14 | 3.1%(+5.10)#2,149 |
| 15. | Smith Valley | 7.4% | 3.2%(+4.29)#15 | 3.1%(+4.34)#2,504 |
| 16. | Ely | 7.1% | 3.2%(+3.94)#16 | 3.1%(+4.00)#2,723 |
| 17. | Washoe Valley | 7.1% | 3.2%(+3.91)#17 | 3.1%(+3.97)#2,742 |
| 18. | Glenbrook | 6.6% | 3.2%(+3.41)#18 | 3.1%(+3.47)#3,044 |
| 19. | Moapa Valley | 6.3% | 3.2%(+3.17)#19 | 3.1%(+3.23)#3,203 |
| 20. | Wells | 6.2% | 3.2%(+3.09)#20 | 3.1%(+3.15)#3,248 |
| 21. | Spring Creek | 5.8% | 3.2%(+2.66)#21 | 3.1%(+2.71)#3,625 |
| 22. | Cold Springs | 5.7% | 3.2%(+2.57)#22 | 3.1%(+2.63)#3,683 |
| 23. | Mogul | 5.3% | 3.2%(+2.17)#23 | 3.1%(+2.22)#4,082 |
| 24. | Winnemucca | 5.2% | 3.2%(+2.05)#24 | 3.1%(+2.11)#4,219 |
| 25. | Lemmon Valley | 4.7% | 3.2%(+1.58)#25 | 3.1%(+1.64)#4,799 |
| 26. | Boulder City | 4.7% | 3.2%(+1.57)#26 | 3.1%(+1.62)#4,821 |
| 27. | Sun Valley | 4.5% | 3.2%(+1.34)#27 | 3.1%(+1.40)#5,157 |
| 28. | Sparks | 4.4% | 3.2%(+1.24)#28 | 3.1%(+1.30)#5,311 |
| 29. | Spanish Springs | 4.1% | 3.2%(+0.943)#29 | 3.1%(+0.999)#5,792 |
| 30. | Battle Mountain | 4.0% | 3.2%(+0.804)#30 | 3.1%(+0.861)#6,062 |
| 31. | Genoa | 3.8% | 3.2%(+0.690)#31 | 3.1%(+0.746)#6,279 |
| 32. | Reno | 3.8% | 3.2%(+0.634)#32 | 3.1%(+0.690)#6,395 |
| 33. | Incline Village | 3.7% | 3.2%(+0.509)#33 | 3.1%(+0.565)#6,654 |
| 34. | Fernley | 3.7% | 3.2%(+0.496)#34 | 3.1%(+0.553)#6,673 |
| 35. | Indian Hills | 3.6% | 3.2%(+0.460)#35 | 3.1%(+0.517)#6,748 |
| 36. | Paradise | 3.5% | 3.2%(+0.310)#36 | 3.1%(+0.366)#7,104 |
| 37. | Las Vegas | 3.3% | 3.2%(+0.126)#37 | 3.1%(+0.182)#7,563 |
| 38. | North Las Vegas | 3.2% | 3.2%(+0.081)#38 | 3.1%(+0.137)#7,671 |
| 39. | Skyland | 3.2% | 3.2%(+0.019)#39 | 3.1%(+0.075)#7,831 |
| 40. | Fallon | 3.2% | 3.2%(+0.006)#40 | 3.1%(+0.062)#7,862 |
| 41. | Carson | 3.1% | 3.2%(-0.056)#41 | 3.1%(+0.000)#8,016 |
| 42. | Henderson | 2.9% | 3.2%(-0.242)#42 | 3.1%(-0.186)#8,546 |
| 43. | Silver Springs | 2.9% | 3.2%(-0.279)#43 | 3.1%(-0.223)#8,637 |
| 44. | Caliente | 2.8% | 3.2%(-0.397)#44 | 3.1%(-0.341)#9,016 |
| 45. | Spring Valley | 2.6% | 3.2%(-0.534)#45 | 3.1%(-0.478)#9,445 |
| 46. | Mesquite | 2.6% | 3.2%(-0.580)#46 | 3.1%(-0.524)#9,586 |
| 47. | Winchester | 2.5% | 3.2%(-0.654)#47 | 3.1%(-0.598)#9,799 |
| 48. | Johnson Lane | 2.4% | 3.2%(-0.738)#48 | 3.1%(-0.682)#10,036 |
| 49. | Nellis Afb | 2.4% | 3.2%(-0.758)#49 | 3.1%(-0.702)#10,091 |
| 50. | Whitney | 2.3% | 3.2%(-0.849)#50 | 3.1%(-0.792)#10,366 |
| 51. | Pahrump | 2.3% | 3.2%(-0.885)#51 | 3.1%(-0.829)#10,484 |
| 52. | Topaz Ranch Estates | 2.1% | 3.2%(-1.05)#52 | 3.1%(-0.994)#10,963 |
| 53. | Laughlin | 2.0% | 3.2%(-1.11)#53 | 3.1%(-1.06)#11,136 |
| 54. | Enterprise | 2.0% | 3.2%(-1.13)#54 | 3.1%(-1.08)#11,210 |
| 55. | Summerlin South | 1.8% | 3.2%(-1.40)#55 | 3.1%(-1.34)#12,016 |
| 56. | Dayton | 1.7% | 3.2%(-1.45)#56 | 3.1%(-1.39)#12,168 |
| 57. | East Valley | 1.5% | 3.2%(-1.67)#57 | 3.1%(-1.61)#12,770 |
| 58. | Gardnerville Ranchos | 1.4% | 3.2%(-1.72)#58 | 3.1%(-1.66)#12,889 |
| 59. | Sunrise Manor | 1.4% | 3.2%(-1.80)#59 | 3.1%(-1.75)#13,105 |
| 60. | Minden | 1.1% | 3.2%(-2.08)#60 | 3.1%(-2.03)#13,788 |
| 61. | Verdi | 0.88% | 3.2%(-2.27)#61 | 3.1%(-2.22)#14,215 |
1
2Common Questions
What are the Top 10 Cities with the Highest Percentage of Population with a Degree in Physical and Health Sciences in Nevada?
Top 10 Cities with the Highest Percentage of Population with a Degree in Physical and Health Sciences in Nevada are:
#1
31.6%
#2
31.5%
#3
28.8%
#4
28.6%
#5
25.0%
#6
25.0%
#7
21.3%
#8
19.6%
#9
16.0%
#10
14.3%
What city has the Highest Percentage of Population with a Degree in Physical and Health Sciences in Nevada?
Silver City has the Highest Percentage of Population with a Degree in Physical and Health Sciences in Nevada with 31.6%.
What is the Percentage of Population with a Degree in Physical and Health Sciences in the State of Nevada?
Percentage of Population with a Degree in Physical and Health Sciences in Nevada is 3.2%.
What is the Percentage of Population with a Degree in Physical and Health Sciences in the United States?
Percentage of Population with a Degree in Physical and Health Sciences in the United States is 3.1%.