Zip Codes with the Highest Percentage of Population with a Degree in Physical and Health Sciences in Los Angeles, CA
RELATED REPORTS & OPTIONS
Physical and Health Sciences
Los Angeles
Compare Zip Codes
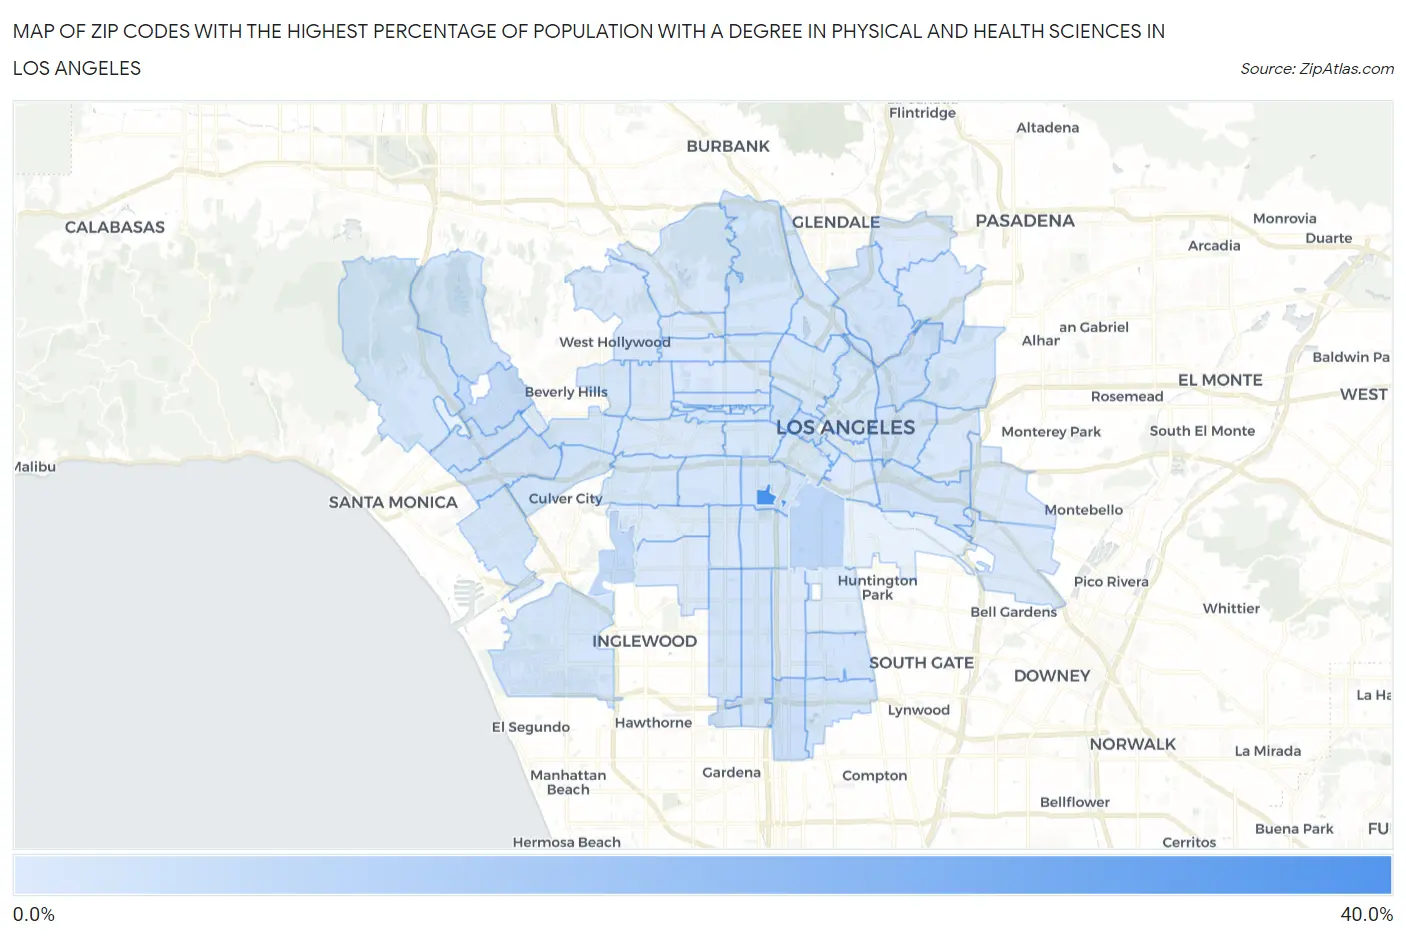
Map of Zip Codes with the Highest Percentage of Population with a Degree in Physical and Health Sciences in Los Angeles
0.57%
34.7%
Zip Codes with the Highest Percentage of Population with a Degree in Physical and Health Sciences in Los Angeles, CA
| Zip Code | % Graduates | vs State | vs National | |
| 1. | 90089 | 34.7% | 3.1%(+31.6)#11 | 3.1%(+31.6)#140 |
| 2. | 90011 | 7.1% | 3.1%(+4.01)#120 | 3.1%(+4.02)#2,443 |
| 3. | 90056 | 6.4% | 3.1%(+3.25)#142 | 3.1%(+3.26)#2,939 |
| 4. | 90024 | 4.5% | 3.1%(+1.41)#280 | 3.1%(+1.42)#5,486 |
| 5. | 90061 | 4.2% | 3.1%(+1.04)#337 | 3.1%(+1.06)#6,306 |
| 6. | 90017 | 4.1% | 3.1%(+1.03)#339 | 3.1%(+1.05)#6,326 |
| 7. | 90031 | 3.9% | 3.1%(+0.748)#385 | 3.1%(+0.764)#7,148 |
| 8. | 90057 | 3.8% | 3.1%(+0.641)#413 | 3.1%(+0.657)#7,506 |
| 9. | 90025 | 3.3% | 3.1%(+0.148)#537 | 3.1%(+0.164)#9,329 |
| 10. | 90007 | 3.0% | 3.1%(-0.153)#646 | 3.1%(-0.137)#10,593 |
| 11. | 90033 | 2.9% | 3.1%(-0.177)#651 | 3.1%(-0.161)#10,707 |
| 12. | 90064 | 2.9% | 3.1%(-0.182)#654 | 3.1%(-0.167)#10,736 |
| 13. | 90065 | 2.9% | 3.1%(-0.238)#668 | 3.1%(-0.222)#10,953 |
| 14. | 90044 | 2.8% | 3.1%(-0.292)#690 | 3.1%(-0.277)#11,208 |
| 15. | 90047 | 2.8% | 3.1%(-0.308)#701 | 3.1%(-0.292)#11,290 |
| 16. | 90023 | 2.8% | 3.1%(-0.315)#704 | 3.1%(-0.299)#11,331 |
| 17. | 90002 | 2.7% | 3.1%(-0.408)#735 | 3.1%(-0.392)#11,737 |
| 18. | 90034 | 2.5% | 3.1%(-0.574)#806 | 3.1%(-0.558)#12,536 |
| 19. | 90066 | 2.4% | 3.1%(-0.687)#838 | 3.1%(-0.671)#13,055 |
| 20. | 90018 | 2.4% | 3.1%(-0.737)#863 | 3.1%(-0.721)#13,301 |
| 21. | 90077 | 2.3% | 3.1%(-0.769)#875 | 3.1%(-0.753)#13,449 |
| 22. | 90059 | 2.3% | 3.1%(-0.797)#887 | 3.1%(-0.781)#13,595 |
| 23. | 90032 | 2.3% | 3.1%(-0.830)#899 | 3.1%(-0.814)#13,744 |
| 24. | 90045 | 2.3% | 3.1%(-0.830)#900 | 3.1%(-0.815)#13,749 |
| 25. | 90049 | 2.3% | 3.1%(-0.832)#902 | 3.1%(-0.816)#13,758 |
| 26. | 90035 | 2.2% | 3.1%(-0.910)#926 | 3.1%(-0.894)#14,116 |
| 27. | 90037 | 2.2% | 3.1%(-0.916)#932 | 3.1%(-0.901)#14,148 |
| 28. | 90027 | 2.2% | 3.1%(-0.922)#936 | 3.1%(-0.906)#14,177 |
| 29. | 90005 | 2.2% | 3.1%(-0.948)#953 | 3.1%(-0.932)#14,287 |
| 30. | 90039 | 2.1% | 3.1%(-1.04)#983 | 3.1%(-1.03)#14,771 |
| 31. | 90048 | 2.1% | 3.1%(-1.05)#986 | 3.1%(-1.04)#14,833 |
| 32. | 90006 | 2.1% | 3.1%(-1.06)#988 | 3.1%(-1.04)#14,845 |
| 33. | 90026 | 2.0% | 3.1%(-1.11)#1,005 | 3.1%(-1.10)#15,083 |
| 34. | 90029 | 2.0% | 3.1%(-1.11)#1,008 | 3.1%(-1.10)#15,093 |
| 35. | 90012 | 1.9% | 3.1%(-1.20)#1,037 | 3.1%(-1.19)#15,484 |
| 36. | 90014 | 1.8% | 3.1%(-1.27)#1,063 | 3.1%(-1.26)#15,798 |
| 37. | 90016 | 1.8% | 3.1%(-1.32)#1,078 | 3.1%(-1.30)#16,002 |
| 38. | 90015 | 1.8% | 3.1%(-1.34)#1,084 | 3.1%(-1.32)#16,118 |
| 39. | 90019 | 1.6% | 3.1%(-1.51)#1,133 | 3.1%(-1.50)#16,856 |
| 40. | 90062 | 1.5% | 3.1%(-1.57)#1,149 | 3.1%(-1.55)#17,115 |
| 41. | 90042 | 1.5% | 3.1%(-1.59)#1,157 | 3.1%(-1.58)#17,187 |
| 42. | 90036 | 1.5% | 3.1%(-1.63)#1,169 | 3.1%(-1.61)#17,353 |
| 43. | 90028 | 1.4% | 3.1%(-1.70)#1,184 | 3.1%(-1.68)#17,666 |
| 44. | 90020 | 1.4% | 3.1%(-1.71)#1,190 | 3.1%(-1.70)#17,717 |
| 45. | 90063 | 1.4% | 3.1%(-1.74)#1,194 | 3.1%(-1.72)#17,806 |
| 46. | 90068 | 1.4% | 3.1%(-1.76)#1,202 | 3.1%(-1.75)#17,896 |
| 47. | 90040 | 1.3% | 3.1%(-1.86)#1,226 | 3.1%(-1.85)#18,327 |
| 48. | 90046 | 1.2% | 3.1%(-1.88)#1,228 | 3.1%(-1.86)#18,386 |
| 49. | 90022 | 1.2% | 3.1%(-1.91)#1,239 | 3.1%(-1.90)#18,514 |
| 50. | 90021 | 1.1% | 3.1%(-2.01)#1,254 | 3.1%(-1.99)#18,847 |
| 51. | 90004 | 1.0% | 3.1%(-2.08)#1,271 | 3.1%(-2.06)#19,131 |
| 52. | 90041 | 0.95% | 3.1%(-2.17)#1,284 | 3.1%(-2.15)#19,412 |
| 53. | 90038 | 0.94% | 3.1%(-2.17)#1,285 | 3.1%(-2.16)#19,431 |
| 54. | 90003 | 0.90% | 3.1%(-2.22)#1,287 | 3.1%(-2.20)#19,574 |
| 55. | 90043 | 0.89% | 3.1%(-2.22)#1,291 | 3.1%(-2.21)#19,595 |
| 56. | 90010 | 0.72% | 3.1%(-2.39)#1,310 | 3.1%(-2.38)#20,074 |
| 57. | 90008 | 0.72% | 3.1%(-2.40)#1,311 | 3.1%(-2.38)#20,092 |
| 58. | 90067 | 0.71% | 3.1%(-2.40)#1,313 | 3.1%(-2.39)#20,096 |
| 59. | 90013 | 0.67% | 3.1%(-2.44)#1,318 | 3.1%(-2.43)#20,219 |
| 60. | 90001 | 0.57% | 3.1%(-2.55)#1,328 | 3.1%(-2.53)#20,476 |
1
Common Questions
What are the Top 10 Zip Codes with the Highest Percentage of Population with a Degree in Physical and Health Sciences in Los Angeles, CA?
Top 10 Zip Codes with the Highest Percentage of Population with a Degree in Physical and Health Sciences in Los Angeles, CA are:
What zip code has the Highest Percentage of Population with a Degree in Physical and Health Sciences in Los Angeles, CA?
90089 has the Highest Percentage of Population with a Degree in Physical and Health Sciences in Los Angeles, CA with 34.7%.
What is the Percentage of Population with a Degree in Physical and Health Sciences in Los Angeles, CA?
Percentage of Population with a Degree in Physical and Health Sciences in Los Angeles is 2.3%.
What is the Percentage of Population with a Degree in Physical and Health Sciences in California?
Percentage of Population with a Degree in Physical and Health Sciences in California is 3.1%.
What is the Percentage of Population with a Degree in Physical and Health Sciences in the United States?
Percentage of Population with a Degree in Physical and Health Sciences in the United States is 3.1%.