Cities with the Highest Percentage of Population with a Degree in Physical and Health Sciences in Iowa
RELATED REPORTS & OPTIONS
Physical and Health Sciences
Iowa
Compare Cities
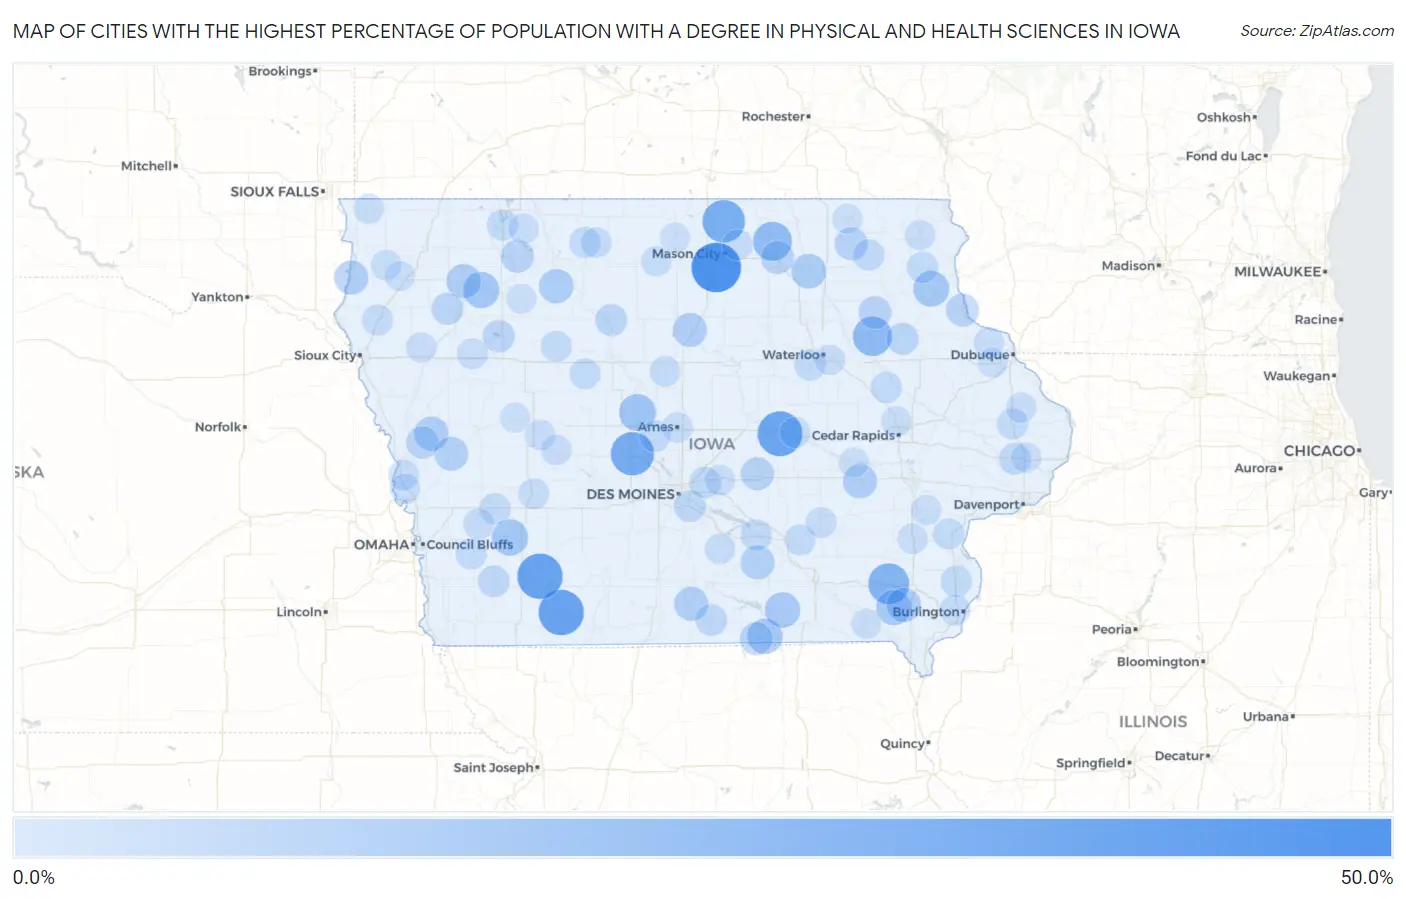
Map of Cities with the Highest Percentage of Population with a Degree in Physical and Health Sciences in Iowa
0.0%
50.0%
Cities with the Highest Percentage of Population with a Degree in Physical and Health Sciences in Iowa
| City | % Graduates | vs State | vs National | |
| 1. | Burchinal | 50.0% | 2.4%(+47.6)#1 | 3.1%(+46.9)#101 |
| 2. | Sharpsburg | 40.0% | 2.4%(+37.6)#2 | 3.1%(+36.9)#144 |
| 3. | Carbon | 40.0% | 2.4%(+37.6)#3 | 3.1%(+36.9)#145 |
| 4. | Montour | 38.7% | 2.4%(+36.3)#4 | 3.1%(+35.6)#156 |
| 5. | Bouton | 35.0% | 2.4%(+32.6)#5 | 3.1%(+31.9)#192 |
| 6. | Kensett | 33.3% | 2.4%(+31.0)#6 | 3.1%(+30.2)#205 |
| 7. | Lockridge | 29.5% | 2.4%(+27.2)#7 | 3.1%(+26.4)#269 |
| 8. | Hazleton | 25.8% | 2.4%(+23.4)#8 | 3.1%(+22.7)#347 |
| 9. | Orchard | 25.0% | 2.4%(+22.6)#9 | 3.1%(+21.9)#383 |
| 10. | Oak Hills | 24.6% | 2.4%(+22.2)#10 | 3.1%(+21.5)#403 |
| 11. | Fraser | 20.0% | 2.4%(+17.6)#11 | 3.1%(+16.9)#551 |
| 12. | Lewis | 18.8% | 2.4%(+16.4)#12 | 3.1%(+15.7)#605 |
| 13. | Peterson | 18.5% | 2.4%(+16.1)#13 | 3.1%(+15.4)#620 |
| 14. | St Olaf | 17.6% | 2.4%(+15.3)#14 | 3.1%(+14.5)#661 |
| 15. | Hillsboro | 16.7% | 2.4%(+14.3)#15 | 3.1%(+13.6)#733 |
| 16. | Exline | 16.7% | 2.4%(+14.3)#16 | 3.1%(+13.6)#736 |
| 17. | Unionville | 16.7% | 2.4%(+14.3)#17 | 3.1%(+13.6)#740 |
| 18. | Ionia | 15.4% | 2.4%(+13.0)#18 | 3.1%(+12.3)#828 |
| 19. | Sutherland | 14.5% | 2.4%(+12.2)#19 | 3.1%(+11.4)#921 |
| 20. | Salem | 14.3% | 2.4%(+11.9)#20 | 3.1%(+11.2)#954 |
| 21. | Mallard | 14.3% | 2.4%(+11.9)#21 | 3.1%(+11.2)#957 |
| 22. | Soldier | 14.3% | 2.4%(+11.9)#22 | 3.1%(+11.2)#965 |
| 23. | Williamsburg | 14.0% | 2.4%(+11.6)#23 | 3.1%(+10.9)#991 |
| 24. | Hawarden | 13.8% | 2.4%(+11.4)#24 | 3.1%(+10.7)#1,004 |
| 25. | Humeston | 13.6% | 2.4%(+11.3)#25 | 3.1%(+10.5)#1,024 |
| 26. | Dows | 13.6% | 2.4%(+11.2)#26 | 3.1%(+10.5)#1,033 |
| 27. | Dunlap | 13.3% | 2.4%(+11.0)#27 | 3.1%(+10.2)#1,048 |
| 28. | Lovilia | 13.3% | 2.4%(+11.0)#28 | 3.1%(+10.2)#1,053 |
| 29. | Kellogg | 11.5% | 2.4%(+9.11)#29 | 3.1%(+8.38)#1,299 |
| 30. | Protivin | 11.4% | 2.4%(+9.07)#30 | 3.1%(+8.33)#1,307 |
| 31. | Guttenberg | 11.2% | 2.4%(+8.84)#31 | 3.1%(+8.10)#1,339 |
| 32. | Floyd | 11.1% | 2.4%(+8.75)#32 | 3.1%(+8.01)#1,355 |
| 33. | Cincinnati | 11.1% | 2.4%(+8.75)#33 | 3.1%(+8.01)#1,358 |
| 34. | Dickens | 11.1% | 2.4%(+8.75)#34 | 3.1%(+8.01)#1,361 |
| 35. | Maynard | 11.0% | 2.4%(+8.61)#35 | 3.1%(+7.88)#1,380 |
| 36. | Moorhead | 10.0% | 2.4%(+7.64)#36 | 3.1%(+6.90)#1,609 |
| 37. | Lakeside | 9.8% | 2.4%(+7.40)#37 | 3.1%(+6.66)#1,663 |
| 38. | Dakota City | 9.3% | 2.4%(+6.90)#38 | 3.1%(+6.16)#1,799 |
| 39. | Lamont | 9.1% | 2.4%(+6.73)#39 | 3.1%(+5.99)#1,845 |
| 40. | Meriden | 9.1% | 2.4%(+6.73)#40 | 3.1%(+5.99)#1,861 |
| 41. | Grand Mound | 8.7% | 2.4%(+6.33)#41 | 3.1%(+5.60)#1,981 |
| 42. | Carlisle | 8.6% | 2.4%(+6.28)#42 | 3.1%(+5.54)#2,008 |
| 43. | Red Oak | 8.6% | 2.4%(+6.24)#43 | 3.1%(+5.50)#2,024 |
| 44. | Corydon | 8.4% | 2.4%(+6.01)#44 | 3.1%(+5.27)#2,089 |
| 45. | Kent Estates | 8.3% | 2.4%(+5.98)#45 | 3.1%(+5.24)#2,093 |
| 46. | Mitchellville | 8.0% | 2.4%(+5.60)#46 | 3.1%(+4.86)#2,259 |
| 47. | Fort Atkinson | 7.9% | 2.4%(+5.53)#47 | 3.1%(+4.80)#2,279 |
| 48. | Walnut | 7.7% | 2.4%(+5.33)#48 | 3.1%(+4.59)#2,369 |
| 49. | Luana | 7.7% | 2.4%(+5.33)#49 | 3.1%(+4.59)#2,385 |
| 50. | Harvey | 7.7% | 2.4%(+5.33)#50 | 3.1%(+4.59)#2,388 |
| 51. | Luther | 7.7% | 2.4%(+5.33)#51 | 3.1%(+4.59)#2,389 |
| 52. | Mediapolis | 7.6% | 2.4%(+5.24)#52 | 3.1%(+4.50)#2,427 |
| 53. | Fenton | 7.5% | 2.4%(+5.14)#53 | 3.1%(+4.40)#2,474 |
| 54. | Hudson | 7.4% | 2.4%(+5.08)#54 | 3.1%(+4.34)#2,505 |
| 55. | Macedonia | 7.4% | 2.4%(+5.05)#55 | 3.1%(+4.31)#2,531 |
| 56. | Walker | 7.3% | 2.4%(+4.96)#56 | 3.1%(+4.22)#2,571 |
| 57. | Maquoketa | 7.3% | 2.4%(+4.92)#57 | 3.1%(+4.19)#2,593 |
| 58. | Letts | 7.1% | 2.4%(+4.78)#58 | 3.1%(+4.04)#2,692 |
| 59. | Somers | 7.1% | 2.4%(+4.78)#59 | 3.1%(+4.04)#2,701 |
| 60. | Milford | 7.0% | 2.4%(+4.65)#60 | 3.1%(+3.92)#2,779 |
| 61. | Merrill | 7.0% | 2.4%(+4.64)#61 | 3.1%(+3.90)#2,786 |
| 62. | Keomah Village | 7.0% | 2.4%(+4.62)#62 | 3.1%(+3.88)#2,798 |
| 63. | Pomeroy | 6.8% | 2.4%(+4.42)#63 | 3.1%(+3.68)#2,922 |
| 64. | Galva | 6.7% | 2.4%(+4.31)#64 | 3.1%(+3.57)#2,990 |
| 65. | Hancock | 6.7% | 2.4%(+4.31)#65 | 3.1%(+3.57)#2,996 |
| 66. | Rock Falls | 6.7% | 2.4%(+4.31)#66 | 3.1%(+3.57)#3,002 |
| 67. | Mondamin | 6.5% | 2.4%(+4.16)#67 | 3.1%(+3.42)#3,076 |
| 68. | Exira | 6.5% | 2.4%(+4.09)#68 | 3.1%(+3.35)#3,111 |
| 69. | West Burlington | 6.4% | 2.4%(+4.01)#69 | 3.1%(+3.27)#3,181 |
| 70. | What Cheer | 6.2% | 2.4%(+3.89)#70 | 3.1%(+3.15)#3,249 |
| 71. | Kamrar | 6.2% | 2.4%(+3.89)#71 | 3.1%(+3.15)#3,270 |
| 72. | Lone Rock | 6.2% | 2.4%(+3.89)#72 | 3.1%(+3.15)#3,273 |
| 73. | Toledo | 6.1% | 2.4%(+3.78)#73 | 3.1%(+3.05)#3,349 |
| 74. | Melcher Dallas | 6.1% | 2.4%(+3.70)#74 | 3.1%(+2.96)#3,408 |
| 75. | Ainsworth | 5.9% | 2.4%(+3.52)#75 | 3.1%(+2.78)#3,557 |
| 76. | Willey | 5.9% | 2.4%(+3.52)#76 | 3.1%(+2.78)#3,579 |
| 77. | Ames | 5.8% | 2.4%(+3.48)#77 | 3.1%(+2.74)#3,600 |
| 78. | Andrew | 5.7% | 2.4%(+3.35)#78 | 3.1%(+2.61)#3,700 |
| 79. | Waukon | 5.7% | 2.4%(+3.35)#79 | 3.1%(+2.61)#3,707 |
| 80. | Colfax | 5.7% | 2.4%(+3.31)#80 | 3.1%(+2.57)#3,742 |
| 81. | Terril | 5.7% | 2.4%(+3.30)#81 | 3.1%(+2.56)#3,746 |
| 82. | Modale | 5.6% | 2.4%(+3.19)#82 | 3.1%(+2.46)#3,848 |
| 83. | Coon Rapids | 5.5% | 2.4%(+3.17)#83 | 3.1%(+2.43)#3,870 |
| 84. | Sioux Center | 5.4% | 2.4%(+3.08)#84 | 3.1%(+2.35)#3,952 |
| 85. | Rickardsville | 5.4% | 2.4%(+3.04)#85 | 3.1%(+2.31)#3,997 |
| 86. | Evansdale | 5.4% | 2.4%(+3.04)#86 | 3.1%(+2.30)#4,006 |
| 87. | Britt | 5.3% | 2.4%(+2.95)#87 | 3.1%(+2.21)#4,090 |
| 88. | Hiawatha | 5.3% | 2.4%(+2.92)#88 | 3.1%(+2.18)#4,125 |
| 89. | Lone Tree | 5.3% | 2.4%(+2.90)#89 | 3.1%(+2.16)#4,139 |
| 90. | Pierson | 5.3% | 2.4%(+2.90)#90 | 3.1%(+2.16)#4,154 |
| 91. | Lester | 5.3% | 2.4%(+2.90)#91 | 3.1%(+2.16)#4,155 |
| 92. | Forest City | 5.3% | 2.4%(+2.89)#92 | 3.1%(+2.16)#4,174 |
| 93. | Dewitt | 5.2% | 2.4%(+2.80)#93 | 3.1%(+2.06)#4,265 |
| 94. | Marengo | 5.1% | 2.4%(+2.77)#94 | 3.1%(+2.03)#4,301 |
| 95. | Cresco | 5.1% | 2.4%(+2.69)#95 | 3.1%(+1.95)#4,399 |
| 96. | Keosauqua | 5.0% | 2.4%(+2.68)#96 | 3.1%(+1.94)#4,411 |
| 97. | Marathon | 5.0% | 2.4%(+2.64)#97 | 3.1%(+1.90)#4,460 |
| 98. | Peosta | 5.0% | 2.4%(+2.60)#98 | 3.1%(+1.86)#4,500 |
| 99. | Arcadia | 4.9% | 2.4%(+2.56)#99 | 3.1%(+1.82)#4,546 |
| 100. | Orange City | 4.9% | 2.4%(+2.52)#100 | 3.1%(+1.78)#4,598 |
Common Questions
What are the Top 10 Cities with the Highest Percentage of Population with a Degree in Physical and Health Sciences in Iowa?
Top 10 Cities with the Highest Percentage of Population with a Degree in Physical and Health Sciences in Iowa are:
What city has the Highest Percentage of Population with a Degree in Physical and Health Sciences in Iowa?
Burchinal has the Highest Percentage of Population with a Degree in Physical and Health Sciences in Iowa with 50.0%.
What is the Percentage of Population with a Degree in Physical and Health Sciences in the State of Iowa?
Percentage of Population with a Degree in Physical and Health Sciences in Iowa is 2.4%.
What is the Percentage of Population with a Degree in Physical and Health Sciences in the United States?
Percentage of Population with a Degree in Physical and Health Sciences in the United States is 3.1%.