Rouse, CA Map & Demographics
Rouse Map
Rouse Overview
$15,960
PER CAPITA INCOME
$39,883
AVG FAMILY INCOME
$38,164
AVG HOUSEHOLD INCOME
42.0%
WAGE / INCOME GAP [ % ]
58.0¢/ $1
WAGE / INCOME GAP [ $ ]
0.37
INEQUALITY / GINI INDEX
1,003
TOTAL POPULATION
552
MALE POPULATION
451
FEMALE POPULATION
122.39
MALES / 100 FEMALES
81.70
FEMALES / 100 MALES
29.0
MEDIAN AGE
3.1
AVG FAMILY SIZE
3.0
AVG HOUSEHOLD SIZE
414
LABOR FORCE [ PEOPLE ]
59.6%
PERCENT IN LABOR FORCE
1.4%
UNEMPLOYMENT RATE
Income in Rouse
Income Overview in Rouse
Per Capita Income in Rouse is $15,960, while median incomes of families and households are $39,883 and $38,164 respectively.
| Characteristic | Number | Measure |
| Per Capita Income | 1,003 | $15,960 |
| Median Family Income | 287 | $39,883 |
| Mean Family Income | 287 | $49,135 |
| Median Household Income | 339 | $38,164 |
| Mean Household Income | 339 | $46,951 |
| Income Deficit | 287 | $0 |
| Wage / Income Gap (%) | 1,003 | 41.96% |
| Wage / Income Gap ($) | 1,003 | 58.04¢ per $1 |
| Gini / Inequality Index | 1,003 | 0.37 |
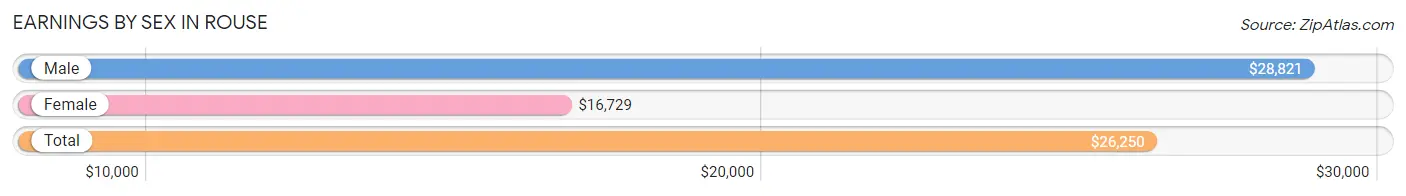
Earnings by Sex in Rouse
Average Earnings in Rouse are $26,250, $28,821 for men and $16,729 for women, a difference of 42.0%.
| Sex | Number | Average Earnings |
| Male | 245 (54.4%) | $28,821 |
| Female | 205 (45.6%) | $16,729 |
| Total | 450 (100.0%) | $26,250 |
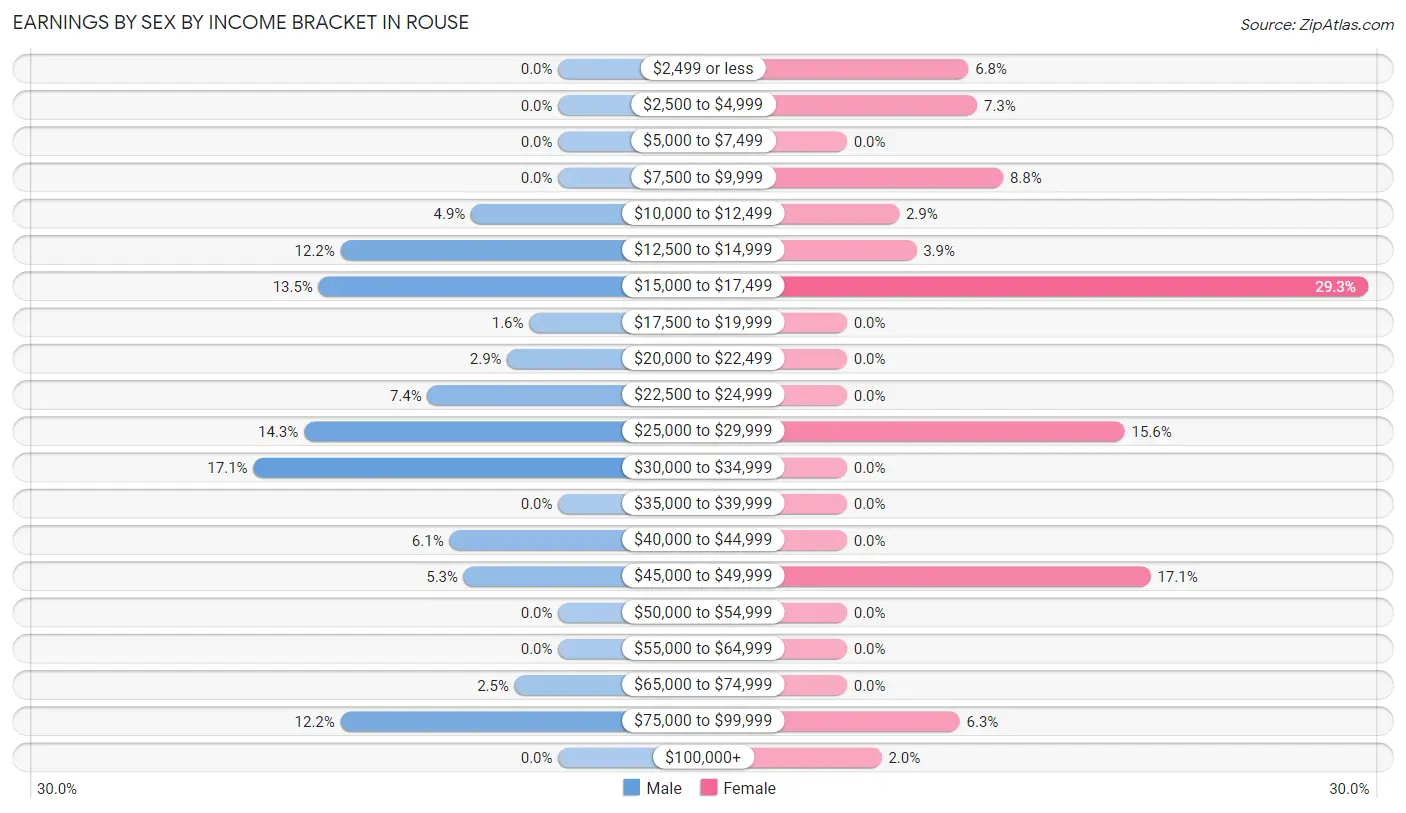
Earnings by Sex by Income Bracket in Rouse
The most common earnings brackets in Rouse are $30,000 to $34,999 for men (42 | 17.1%) and $15,000 to $17,499 for women (60 | 29.3%).
| Income | Male | Female |
| $2,499 or less | 0 (0.0%) | 14 (6.8%) |
| $2,500 to $4,999 | 0 (0.0%) | 15 (7.3%) |
| $5,000 to $7,499 | 0 (0.0%) | 0 (0.0%) |
| $7,500 to $9,999 | 0 (0.0%) | 18 (8.8%) |
| $10,000 to $12,499 | 12 (4.9%) | 6 (2.9%) |
| $12,500 to $14,999 | 30 (12.2%) | 8 (3.9%) |
| $15,000 to $17,499 | 33 (13.5%) | 60 (29.3%) |
| $17,500 to $19,999 | 4 (1.6%) | 0 (0.0%) |
| $20,000 to $22,499 | 7 (2.9%) | 0 (0.0%) |
| $22,500 to $24,999 | 18 (7.3%) | 0 (0.0%) |
| $25,000 to $29,999 | 35 (14.3%) | 32 (15.6%) |
| $30,000 to $34,999 | 42 (17.1%) | 0 (0.0%) |
| $35,000 to $39,999 | 0 (0.0%) | 0 (0.0%) |
| $40,000 to $44,999 | 15 (6.1%) | 0 (0.0%) |
| $45,000 to $49,999 | 13 (5.3%) | 35 (17.1%) |
| $50,000 to $54,999 | 0 (0.0%) | 0 (0.0%) |
| $55,000 to $64,999 | 0 (0.0%) | 0 (0.0%) |
| $65,000 to $74,999 | 6 (2.5%) | 0 (0.0%) |
| $75,000 to $99,999 | 30 (12.2%) | 13 (6.3%) |
| $100,000+ | 0 (0.0%) | 4 (1.9%) |
| Total | 245 (100.0%) | 205 (100.0%) |
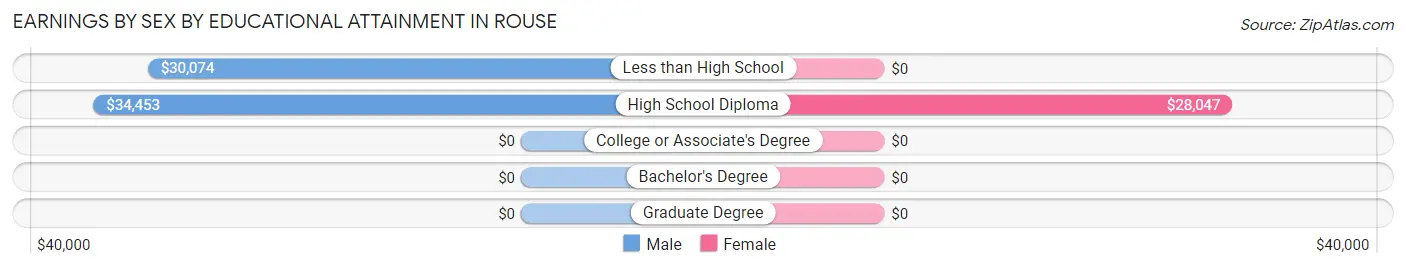
Earnings by Sex by Educational Attainment in Rouse
Average earnings in Rouse are $28,250 for men and $27,539 for women, a difference of 2.5%. Men with an educational attainment of high school diploma enjoy the highest average annual earnings of $34,453, while those with less than high school education earn the least with $30,074. Women with an educational attainment of high school diploma earn the most with the average annual earnings of $28,047, while those with high school diploma education have the smallest earnings of $28,047.
| Educational Attainment | Male Income | Female Income |
| Less than High School | $30,074 | $0 |
| High School Diploma | $34,453 | $28,047 |
| College or Associate's Degree | - | - |
| Bachelor's Degree | - | - |
| Graduate Degree | - | - |
| Total | $28,250 | $27,539 |
Family Income in Rouse
Family Income Brackets in Rouse
According to the Rouse family income data, there are 102 families falling into the $35,000 to $49,999 income range, which is the most common income bracket and makes up 35.5% of all families.
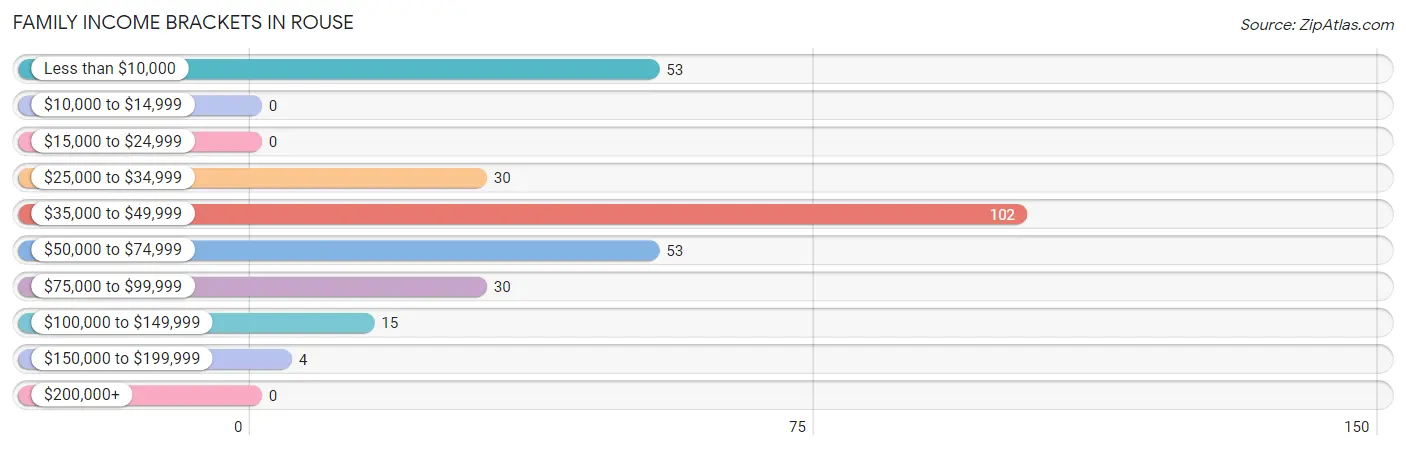
| Income Bracket | # Families | % Families |
| Less than $10,000 | 53 | 18.5% |
| $10,000 to $14,999 | 0 | 0.0% |
| $15,000 to $24,999 | 0 | 0.0% |
| $25,000 to $34,999 | 30 | 10.5% |
| $35,000 to $49,999 | 102 | 35.5% |
| $50,000 to $74,999 | 53 | 18.5% |
| $75,000 to $99,999 | 30 | 10.5% |
| $100,000 to $149,999 | 15 | 5.2% |
| $150,000 to $199,999 | 4 | 1.4% |
| $200,000+ | 0 | 0.0% |
Family Income by Famaliy Size in Rouse
3-person families (111 | 38.7%) account for the highest median family income in Rouse with $58,036 per family, while 2-person families (99 | 34.5%) have the highest median income of $19,902 per family member.
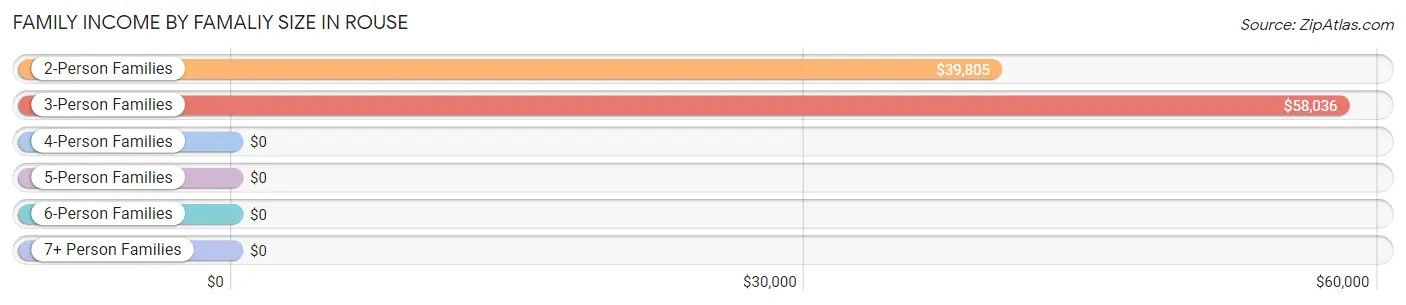
| Income Bracket | # Families | Median Income |
| 2-Person Families | 99 (34.5%) | $39,805 |
| 3-Person Families | 111 (38.7%) | $58,036 |
| 4-Person Families | 24 (8.4%) | $0 |
| 5-Person Families | 53 (18.5%) | $0 |
| 6-Person Families | 0 (0.0%) | $0 |
| 7+ Person Families | 0 (0.0%) | $0 |
| Total | 287 (100.0%) | $39,883 |
Family Income by Number of Earners in Rouse
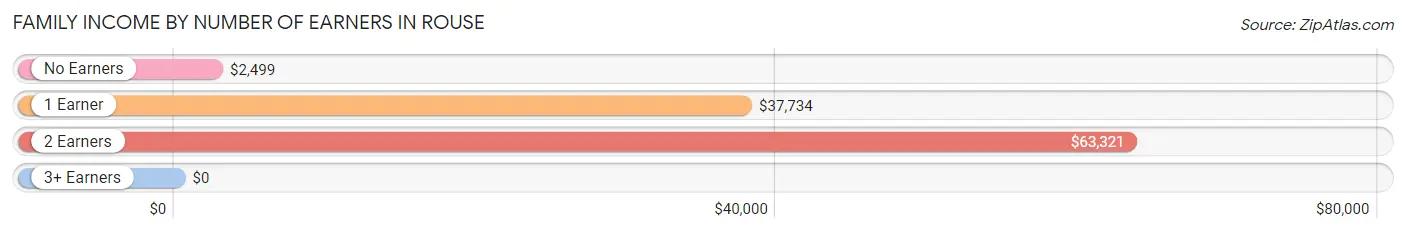
| Number of Earners | # Families | Median Income |
| No Earners | 35 (12.2%) | $2,499 |
| 1 Earner | 162 (56.5%) | $37,734 |
| 2 Earners | 77 (26.8%) | $63,321 |
| 3+ Earners | 13 (4.5%) | $0 |
| Total | 287 (100.0%) | $39,883 |
Household Income in Rouse
Household Income Brackets in Rouse
With 102 households falling in the category, the $35,000 to $49,999 income range is the most frequent in Rouse, accounting for 30.1% of all households.
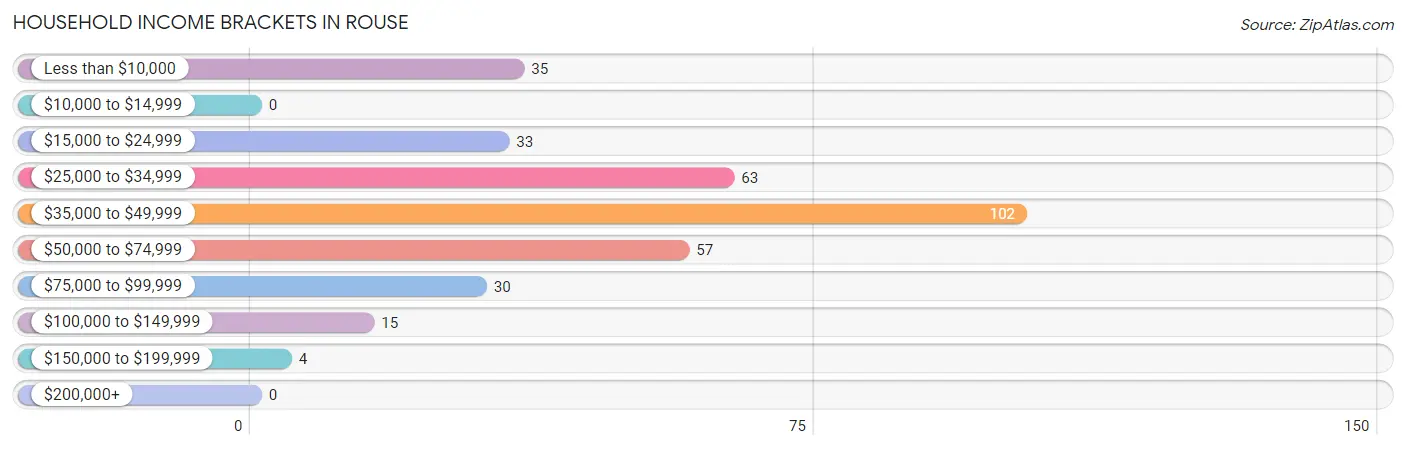
| Income Bracket | # Households | % Households |
| Less than $10,000 | 35 | 10.3% |
| $10,000 to $14,999 | 0 | 0.0% |
| $15,000 to $24,999 | 33 | 9.7% |
| $25,000 to $34,999 | 63 | 18.6% |
| $35,000 to $49,999 | 102 | 30.1% |
| $50,000 to $74,999 | 57 | 16.8% |
| $75,000 to $99,999 | 30 | 8.8% |
| $100,000 to $149,999 | 15 | 4.4% |
| $150,000 to $199,999 | 4 | 1.2% |
| $200,000+ | 0 | 0.0% |
Household Income by Householder Age in Rouse
The median household income in Rouse is $38,164, with the highest median household income of $36,625 found in the 25 to 44 years age bracket for the primary householder. A total of 181 households (53.4%) fall into this category. Meanwhile, the 15 to 24 years age bracket for the primary householder has the lowest median household income of $0, with 16 households (4.7%) in this group.
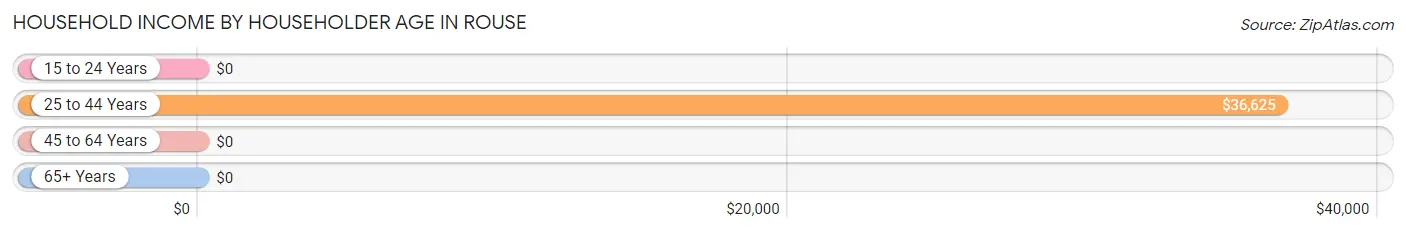
| Income Bracket | # Households | Median Income |
| 15 to 24 Years | 16 (4.7%) | $0 |
| 25 to 44 Years | 181 (53.4%) | $36,625 |
| 45 to 64 Years | 98 (28.9%) | $0 |
| 65+ Years | 44 (13.0%) | $0 |
| Total | 339 (100.0%) | $38,164 |
Poverty in Rouse
Income Below Poverty by Sex and Age in Rouse
With 16.1% poverty level for males and 28.4% for females among the residents of Rouse, under 5 year old males and 5 year old females are the most vulnerable to poverty, with 40 males (78.4%) and 15 females (100.0%) in their respective age groups living below the poverty level.
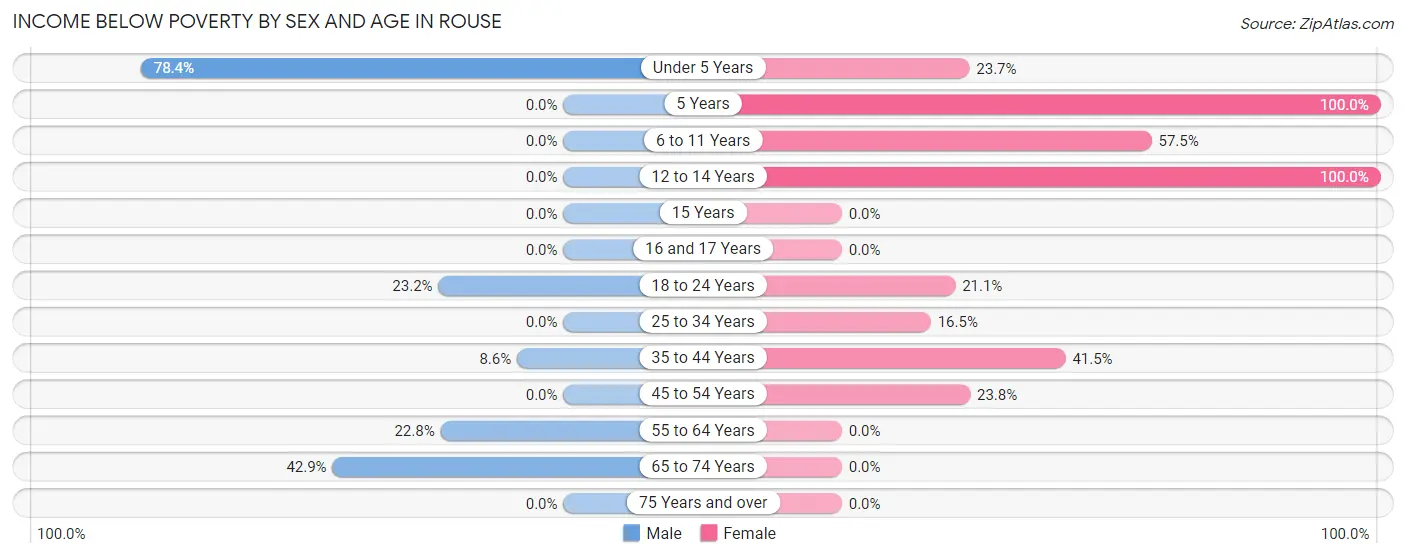
| Age Bracket | Male | Female |
| Under 5 Years | 40 (78.4%) | 18 (23.7%) |
| 5 Years | 0 (0.0%) | 15 (100.0%) |
| 6 to 11 Years | 0 (0.0%) | 23 (57.5%) |
| 12 to 14 Years | 0 (0.0%) | 9 (100.0%) |
| 15 Years | 0 (0.0%) | 0 (0.0%) |
| 16 and 17 Years | 0 (0.0%) | 0 (0.0%) |
| 18 to 24 Years | 16 (23.2%) | 8 (21.0%) |
| 25 to 34 Years | 0 (0.0%) | 18 (16.5%) |
| 35 to 44 Years | 8 (8.6%) | 22 (41.5%) |
| 45 to 54 Years | 0 (0.0%) | 15 (23.8%) |
| 55 to 64 Years | 13 (22.8%) | 0 (0.0%) |
| 65 to 74 Years | 12 (42.9%) | 0 (0.0%) |
| 75 Years and over | 0 (0.0%) | 0 (0.0%) |
| Total | 89 (16.1%) | 128 (28.4%) |
Income Above Poverty by Sex and Age in Rouse
According to the poverty statistics in Rouse, males aged 6 to 11 years and females aged 55 to 64 years are the age groups that are most secure financially, with 100.0% of males and 100.0% of females in these age groups living above the poverty line.
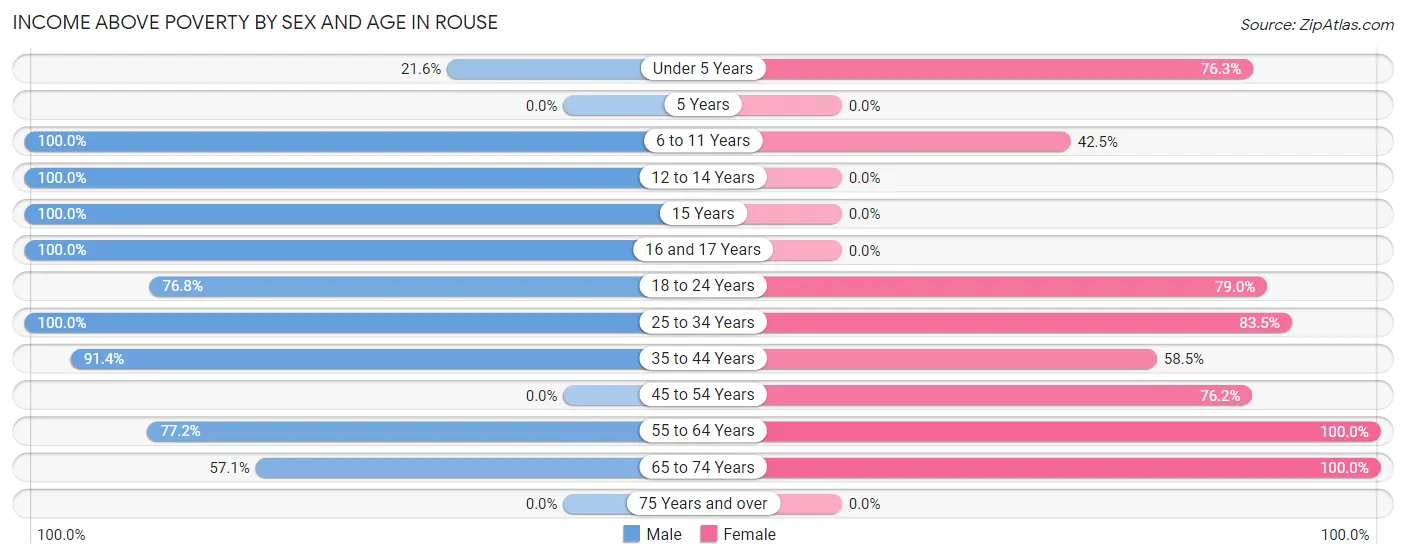
| Age Bracket | Male | Female |
| Under 5 Years | 11 (21.6%) | 58 (76.3%) |
| 5 Years | 0 (0.0%) | 0 (0.0%) |
| 6 to 11 Years | 102 (100.0%) | 17 (42.5%) |
| 12 to 14 Years | 7 (100.0%) | 0 (0.0%) |
| 15 Years | 8 (100.0%) | 0 (0.0%) |
| 16 and 17 Years | 21 (100.0%) | 0 (0.0%) |
| 18 to 24 Years | 53 (76.8%) | 30 (78.9%) |
| 25 to 34 Years | 116 (100.0%) | 91 (83.5%) |
| 35 to 44 Years | 85 (91.4%) | 31 (58.5%) |
| 45 to 54 Years | 0 (0.0%) | 48 (76.2%) |
| 55 to 64 Years | 44 (77.2%) | 8 (100.0%) |
| 65 to 74 Years | 16 (57.1%) | 40 (100.0%) |
| 75 Years and over | 0 (0.0%) | 0 (0.0%) |
| Total | 463 (83.9%) | 323 (71.6%) |
Income Below Poverty Among Married-Couple Families in Rouse
The poverty statistics for married-couple families in Rouse show that 12.6% or 20 of the total 159 families live below the poverty line. Families with no children have the highest poverty rate of 16.4%, comprising of 12 families. On the other hand, families with 3 or 4 children have the lowest poverty rate of 0.0%, which includes 0 families.
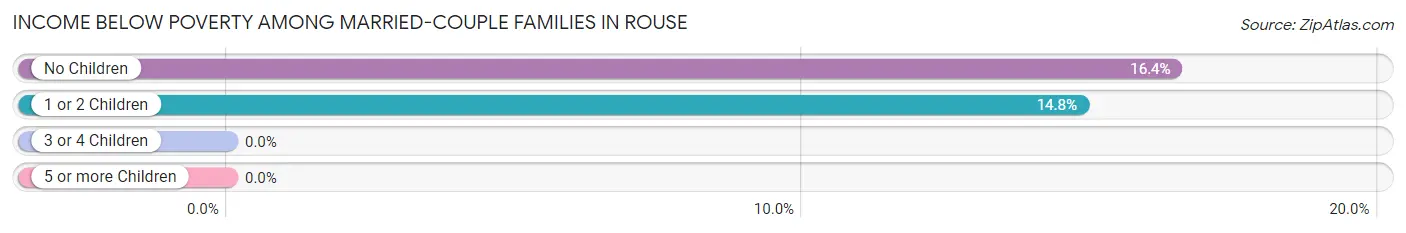
| Children | Above Poverty | Below Poverty |
| No Children | 61 (83.6%) | 12 (16.4%) |
| 1 or 2 Children | 46 (85.2%) | 8 (14.8%) |
| 3 or 4 Children | 32 (100.0%) | 0 (0.0%) |
| 5 or more Children | 0 (0.0%) | 0 (0.0%) |
| Total | 139 (87.4%) | 20 (12.6%) |
Income Below Poverty Among Single-Parent Households in Rouse
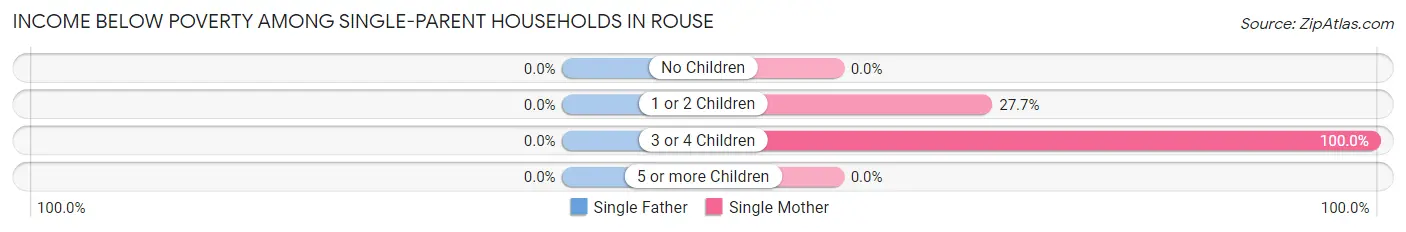
| Children | Single Father | Single Mother |
| No Children | 0 (0.0%) | 0 (0.0%) |
| 1 or 2 Children | 0 (0.0%) | 18 (27.7%) |
| 3 or 4 Children | 0 (0.0%) | 15 (100.0%) |
| 5 or more Children | 0 (0.0%) | 0 (0.0%) |
| Total | 0 (0.0%) | 33 (29.5%) |
Income Below Poverty Among Married-Couple vs Single-Parent Households in Rouse
The poverty data for Rouse shows that 20 of the married-couple family households (12.6%) and 33 of the single-parent households (25.8%) are living below the poverty level. Within the married-couple family households, those with no children have the highest poverty rate, with 12 households (16.4%) falling below the poverty line. Among the single-parent households, those with 3 or 4 children have the highest poverty rate, with 15 household (100.0%) living below poverty.
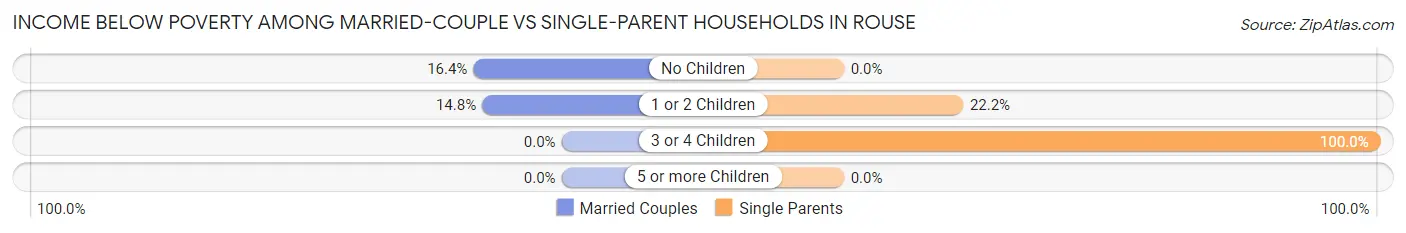
| Children | Married-Couple Families | Single-Parent Households |
| No Children | 12 (16.4%) | 0 (0.0%) |
| 1 or 2 Children | 8 (14.8%) | 18 (22.2%) |
| 3 or 4 Children | 0 (0.0%) | 15 (100.0%) |
| 5 or more Children | 0 (0.0%) | 0 (0.0%) |
| Total | 20 (12.6%) | 33 (25.8%) |
Race in Rouse
The most populous races in Rouse are Hispanic or Latino (684 | 68.2%), White / Caucasian (529 | 52.7%), and Two or more Races (172 | 17.2%).
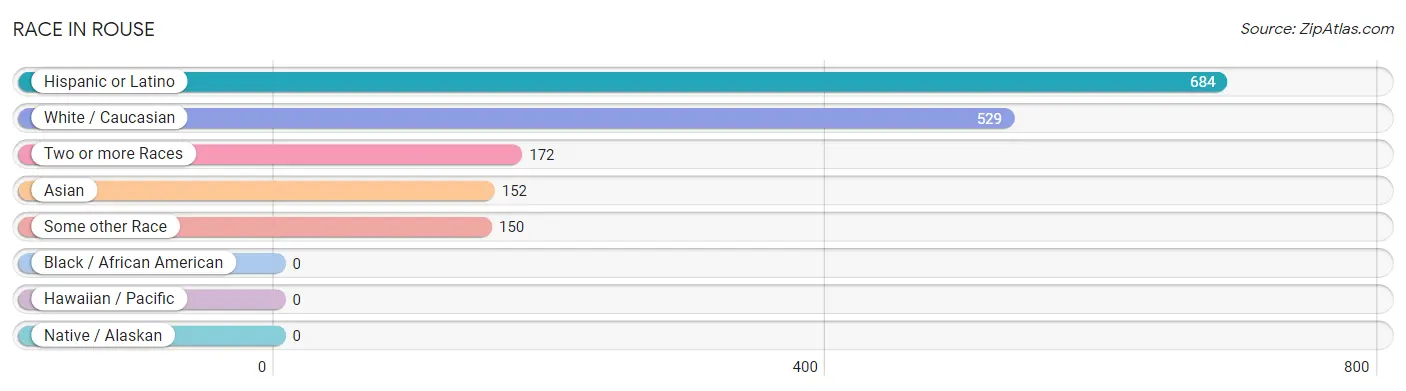
| Race | # Population | % Population |
| Asian | 152 | 15.1% |
| Black / African American | 0 | 0.0% |
| Hawaiian / Pacific | 0 | 0.0% |
| Hispanic or Latino | 684 | 68.2% |
| Native / Alaskan | 0 | 0.0% |
| White / Caucasian | 529 | 52.7% |
| Two or more Races | 172 | 17.2% |
| Some other Race | 150 | 15.0% |
| Total | 1,003 | 100.0% |
Ancestry in Rouse
The most populous ancestries reported in Rouse are Mexican (608 | 60.6%), Bangladeshi (98 | 9.8%), Central American (76 | 7.6%), Salvadoran (76 | 7.6%), and English (66 | 6.6%), together accounting for 92.1% of all Rouse residents.
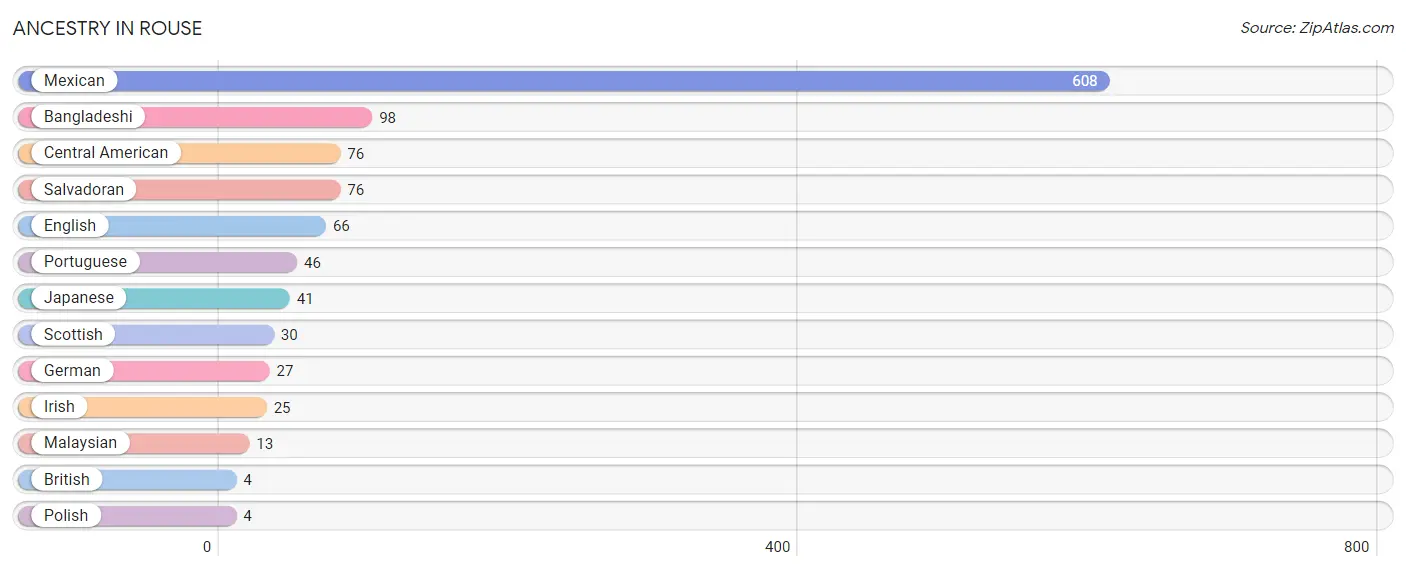
| Ancestry | # Population | % Population |
| Bangladeshi | 98 | 9.8% |
| British | 4 | 0.4% |
| Central American | 76 | 7.6% |
| English | 66 | 6.6% |
| German | 27 | 2.7% |
| Irish | 25 | 2.5% |
| Japanese | 41 | 4.1% |
| Malaysian | 13 | 1.3% |
| Mexican | 608 | 60.6% |
| Polish | 4 | 0.4% |
| Portuguese | 46 | 4.6% |
| Salvadoran | 76 | 7.6% |
| Scottish | 30 | 3.0% | View All 13 Rows |
Immigrants in Rouse
The most numerous immigrant groups reported in Rouse came from Central America (236 | 23.5%), Latin America (236 | 23.5%), Mexico (200 | 19.9%), Asia (69 | 6.9%), and South Eastern Asia (69 | 6.9%), together accounting for 80.8% of all Rouse residents.
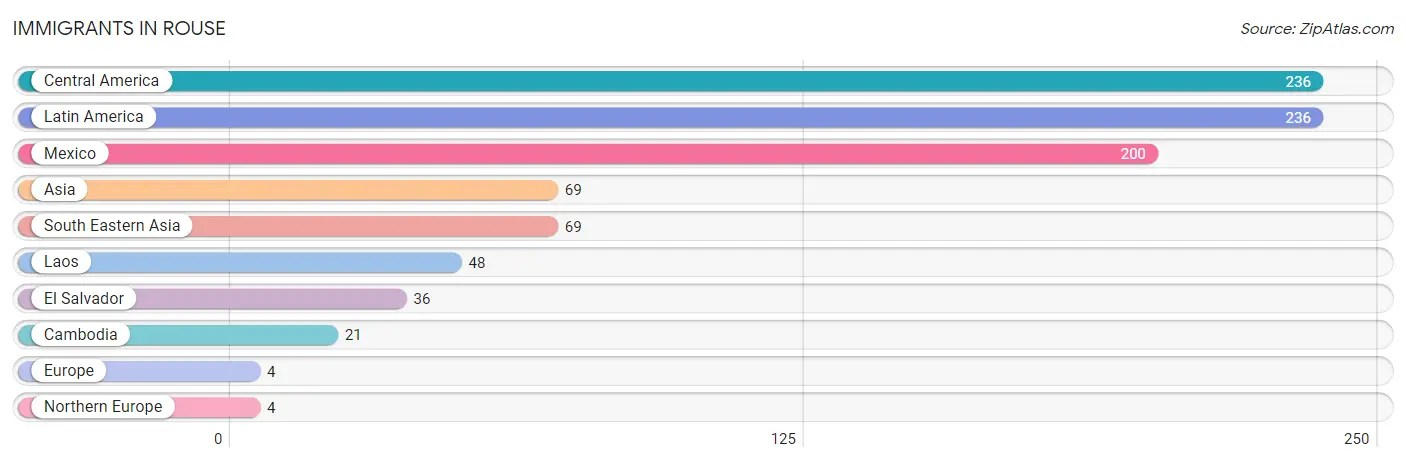
| Immigration Origin | # Population | % Population |
| Asia | 69 | 6.9% |
| Cambodia | 21 | 2.1% |
| Central America | 236 | 23.5% |
| El Salvador | 36 | 3.6% |
| Europe | 4 | 0.4% |
| Laos | 48 | 4.8% |
| Latin America | 236 | 23.5% |
| Mexico | 200 | 19.9% |
| Northern Europe | 4 | 0.4% |
| South Eastern Asia | 69 | 6.9% | View All 10 Rows |
Sex and Age in Rouse
Sex and Age in Rouse
The most populous age groups in Rouse are 25 to 29 Years (77 | 14.0%) for men and 25 to 29 Years (91 | 20.2%) for women.
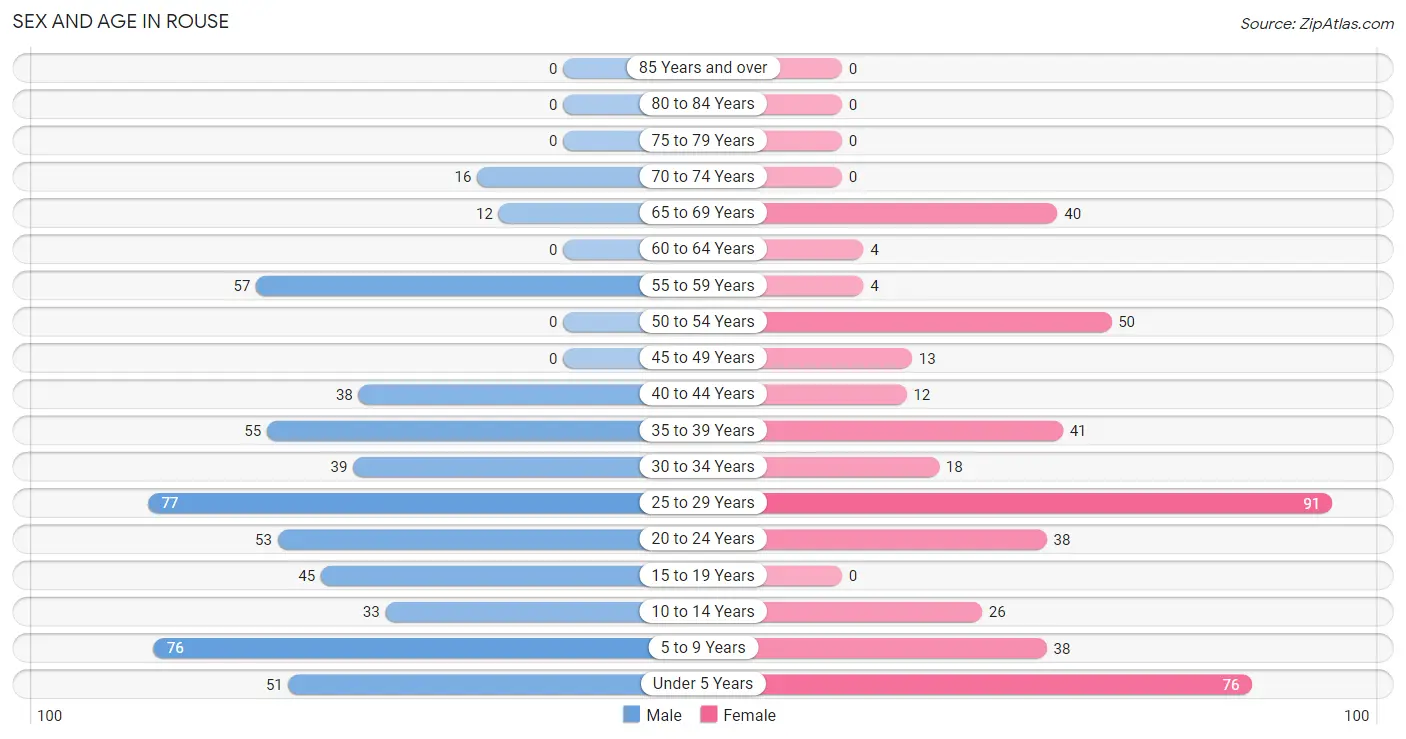
| Age Bracket | Male | Female |
| Under 5 Years | 51 (9.2%) | 76 (16.9%) |
| 5 to 9 Years | 76 (13.8%) | 38 (8.4%) |
| 10 to 14 Years | 33 (6.0%) | 26 (5.8%) |
| 15 to 19 Years | 45 (8.2%) | 0 (0.0%) |
| 20 to 24 Years | 53 (9.6%) | 38 (8.4%) |
| 25 to 29 Years | 77 (14.0%) | 91 (20.2%) |
| 30 to 34 Years | 39 (7.1%) | 18 (4.0%) |
| 35 to 39 Years | 55 (10.0%) | 41 (9.1%) |
| 40 to 44 Years | 38 (6.9%) | 12 (2.7%) |
| 45 to 49 Years | 0 (0.0%) | 13 (2.9%) |
| 50 to 54 Years | 0 (0.0%) | 50 (11.1%) |
| 55 to 59 Years | 57 (10.3%) | 4 (0.9%) |
| 60 to 64 Years | 0 (0.0%) | 4 (0.9%) |
| 65 to 69 Years | 12 (2.2%) | 40 (8.9%) |
| 70 to 74 Years | 16 (2.9%) | 0 (0.0%) |
| 75 to 79 Years | 0 (0.0%) | 0 (0.0%) |
| 80 to 84 Years | 0 (0.0%) | 0 (0.0%) |
| 85 Years and over | 0 (0.0%) | 0 (0.0%) |
| Total | 552 (100.0%) | 451 (100.0%) |
Families and Households in Rouse
Median Family Size in Rouse
The median family size in Rouse is 3.15 persons per family, with married-couple families (159 | 55.4%) accounting for the largest median family size of 3.26 persons per family. On the other hand, single male/father families (16 | 5.6%) represent the smallest median family size with 1.38 persons per family.
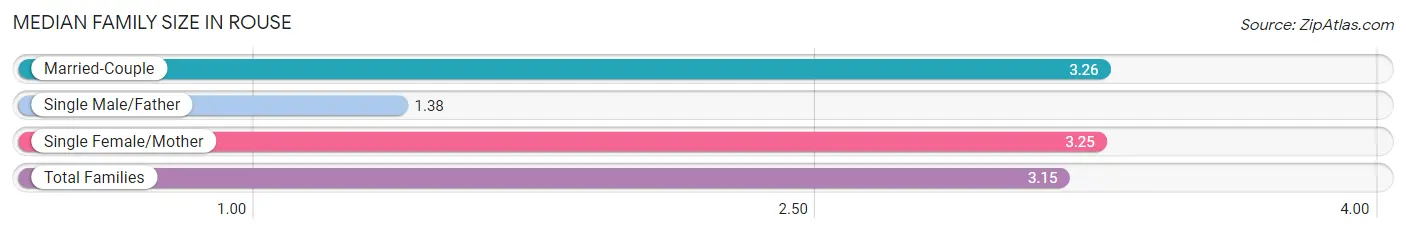
| Family Type | # Families | Family Size |
| Married-Couple | 159 (55.4%) | 3.26 |
| Single Male/Father | 16 (5.6%) | 1.38 |
| Single Female/Mother | 112 (39.0%) | 3.25 |
| Total Families | 287 (100.0%) | 3.15 |
Median Household Size in Rouse
The median household size in Rouse is 2.96 persons per household, with single female/mother households (112 | 33.0%) accounting for the largest median household size of 3.56 persons per household. non-family households (52 | 15.3%) represent the smallest median household size with 1.08 persons per household.
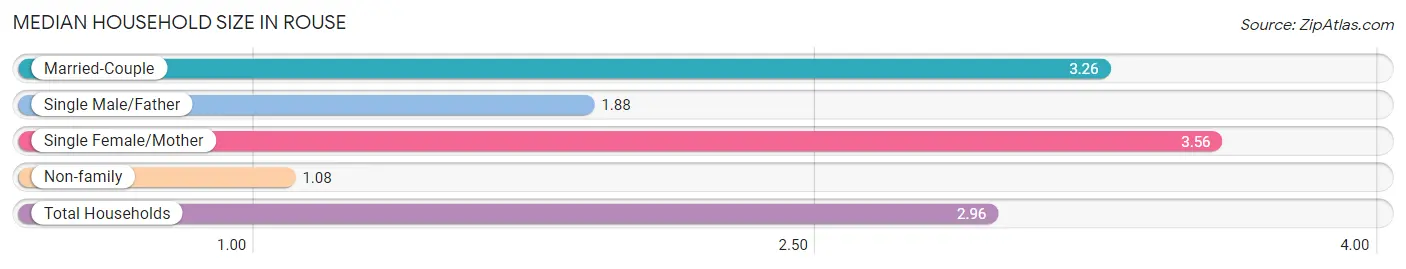
| Household Type | # Households | Household Size |
| Married-Couple | 159 (46.9%) | 3.26 |
| Single Male/Father | 16 (4.7%) | 1.88 |
| Single Female/Mother | 112 (33.0%) | 3.56 |
| Non-family | 52 (15.3%) | 1.08 |
| Total Households | 339 (100.0%) | 2.96 |
Household Size by Marriage Status in Rouse
Out of a total of 339 households in Rouse, 287 (84.7%) are family households, while 52 (15.3%) are nonfamily households. The most numerous type of family households are 3-person households, comprising 109, and the most common type of nonfamily households are 1-person households, comprising 48.
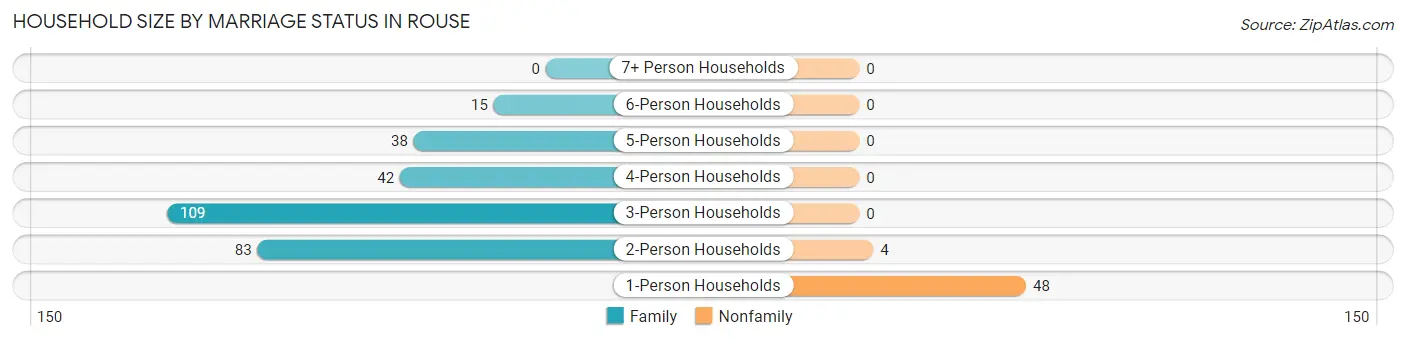
| Household Size | Family Households | Nonfamily Households |
| 1-Person Households | - | 48 (14.2%) |
| 2-Person Households | 83 (24.5%) | 4 (1.2%) |
| 3-Person Households | 109 (32.2%) | 0 (0.0%) |
| 4-Person Households | 42 (12.4%) | 0 (0.0%) |
| 5-Person Households | 38 (11.2%) | 0 (0.0%) |
| 6-Person Households | 15 (4.4%) | 0 (0.0%) |
| 7+ Person Households | 0 (0.0%) | 0 (0.0%) |
| Total | 287 (84.7%) | 52 (15.3%) |
Female Fertility in Rouse
Fertility by Age in Rouse
| Age Bracket | Women with Births | Births / 1,000 Women |
| 15 to 19 years | 0 (0.0%) | 0.0 |
| 20 to 34 years | 0 (0.0%) | 0.0 |
| 35 to 50 years | 0 (0.0%) | 0.0 |
| Total | 0 (0.0%) | 0.0 |
Fertility by Age by Marriage Status in Rouse
| Age Bracket | Married | Unmarried |
| 15 to 19 years | 0 (0.0%) | 0 (0.0%) |
| 20 to 34 years | 0 (0.0%) | 0 (0.0%) |
| 35 to 50 years | 0 (0.0%) | 0 (0.0%) |
| Total | 0 (0.0%) | 0 (0.0%) |
Fertility by Education in Rouse
| Educational Attainment | Women with Births | Births / 1,000 Women |
| Less than High School | 0 (0.0%) | 0.0 |
| High School Diploma | 0 (0.0%) | 0.0 |
| College or Associate's Degree | 0 (0.0%) | 0.0 |
| Bachelor's Degree | 0 (0.0%) | 0.0 |
| Graduate Degree | 0 (0.0%) | 0.0 |
| Total | 0 (0.0%) | 0.0 |
Fertility by Education by Marriage Status in Rouse
| Educational Attainment | Married | Unmarried |
| Less than High School | 0 (0.0%) | 0 (0.0%) |
| High School Diploma | 0 (0.0%) | 0 (0.0%) |
| College or Associate's Degree | 0 (0.0%) | 0 (0.0%) |
| Bachelor's Degree | 0 (0.0%) | 0 (0.0%) |
| Graduate Degree | 0 (0.0%) | 0 (0.0%) |
| Total | 0 (0.0%) | 0 (0.0%) |
Employment Characteristics in Rouse
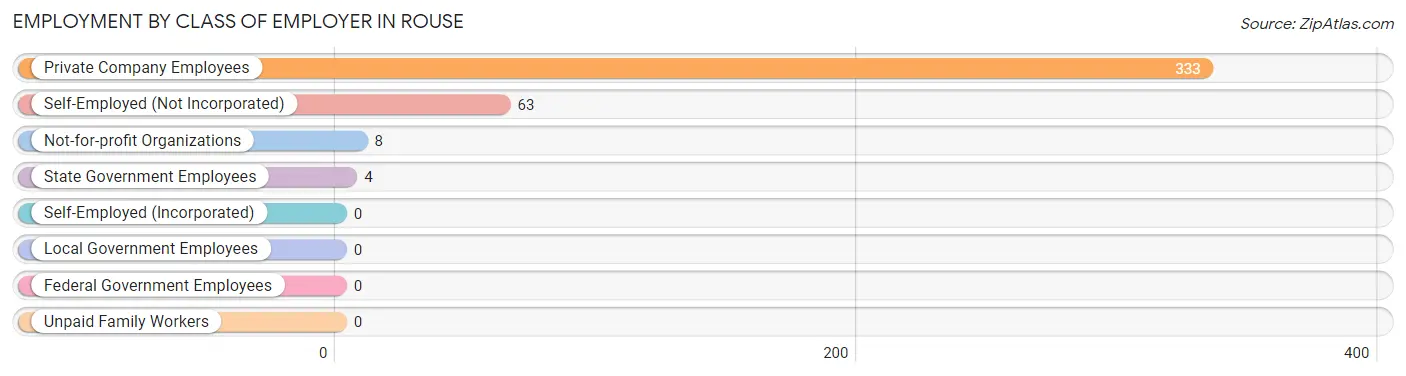
Employment by Class of Employer in Rouse
Among the 408 employed individuals in Rouse, private company employees (333 | 81.6%), self-employed (not incorporated) (63 | 15.4%), and not-for-profit organizations (8 | 2.0%) make up the most common classes of employment.
| Employer Class | # Employees | % Employees |
| Private Company Employees | 333 | 81.6% |
| Self-Employed (Incorporated) | 0 | 0.0% |
| Self-Employed (Not Incorporated) | 63 | 15.4% |
| Not-for-profit Organizations | 8 | 2.0% |
| Local Government Employees | 0 | 0.0% |
| State Government Employees | 4 | 1.0% |
| Federal Government Employees | 0 | 0.0% |
| Unpaid Family Workers | 0 | 0.0% |
| Total | 408 | 100.0% |
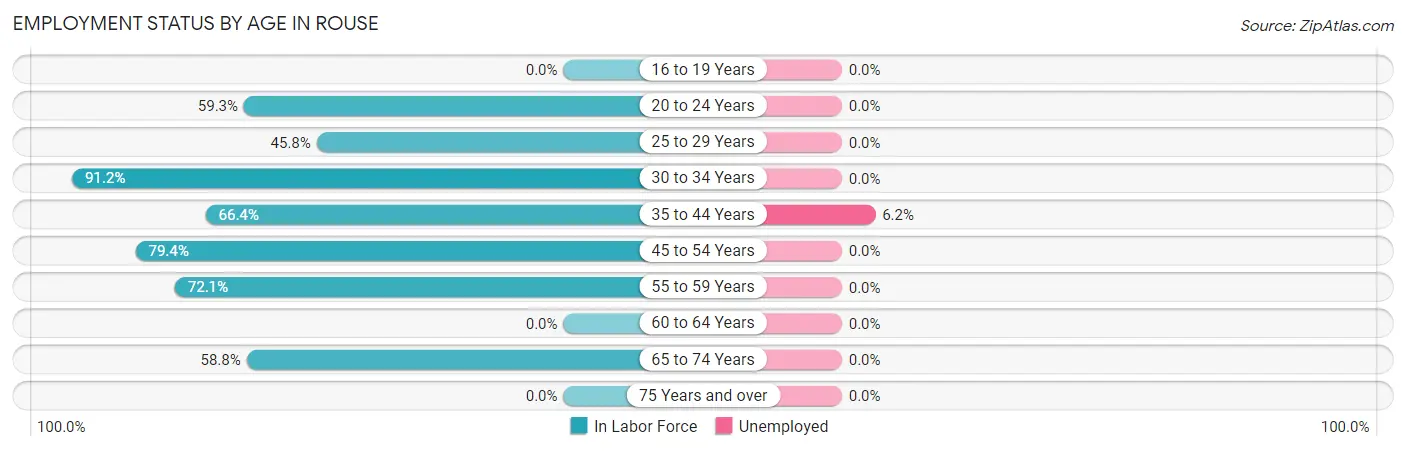
Employment Status by Age in Rouse
According to the labor force statistics for Rouse, out of the total population over 16 years of age (695), 59.6% or 414 individuals are in the labor force, with 1.4% or 6 of them unemployed. The age group with the highest labor force participation rate is 30 to 34 years, with 91.2% or 52 individuals in the labor force. Within the labor force, the 35 to 44 years age range has the highest percentage of unemployed individuals, with 6.2% or 6 of them being unemployed.
| Age Bracket | In Labor Force | Unemployed |
| 16 to 19 Years | 0 (0.0%) | 0 (0.0%) |
| 20 to 24 Years | 54 (59.3%) | 0 (0.0%) |
| 25 to 29 Years | 77 (45.8%) | 0 (0.0%) |
| 30 to 34 Years | 52 (91.2%) | 0 (0.0%) |
| 35 to 44 Years | 97 (66.4%) | 6 (6.2%) |
| 45 to 54 Years | 50 (79.4%) | 0 (0.0%) |
| 55 to 59 Years | 44 (72.1%) | 0 (0.0%) |
| 60 to 64 Years | 0 (0.0%) | 0 (0.0%) |
| 65 to 74 Years | 40 (58.8%) | 0 (0.0%) |
| 75 Years and over | 0 (0.0%) | 0 (0.0%) |
| Total | 414 (59.6%) | 6 (1.4%) |
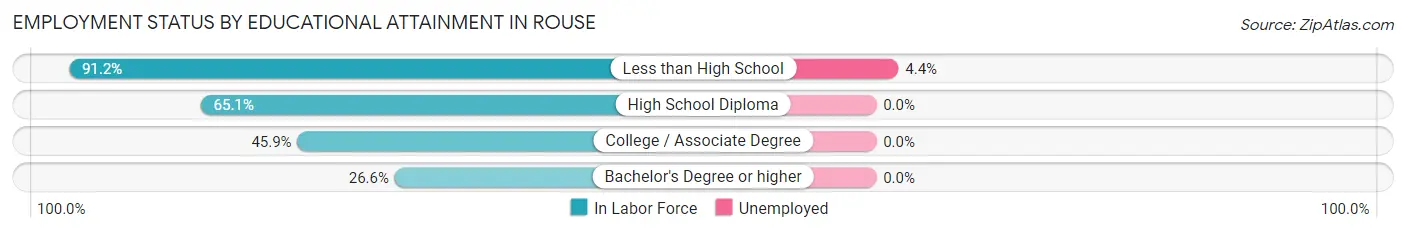
Employment Status by Educational Attainment in Rouse
According to labor force statistics for Rouse, 64.1% of individuals (320) out of the total population between 25 and 64 years of age (499) are in the labor force, with 1.9% or 6 of them being unemployed. The group with the highest labor force participation rate are those with the educational attainment of less than high school, with 91.2% or 135 individuals in the labor force. Within the labor force, individuals with less than high school education have the highest percentage of unemployment, with 4.4% or 6 of them being unemployed.
| Educational Attainment | In Labor Force | Unemployed |
| Less than High School | 135 (91.2%) | 7 (4.4%) |
| High School Diploma | 123 (65.1%) | 0 (0.0%) |
| College / Associate Degree | 45 (45.9%) | 0 (0.0%) |
| Bachelor's Degree or higher | 17 (26.6%) | 0 (0.0%) |
| Total | 320 (64.1%) | 9 (1.9%) |
Employment Occupations by Sex in Rouse
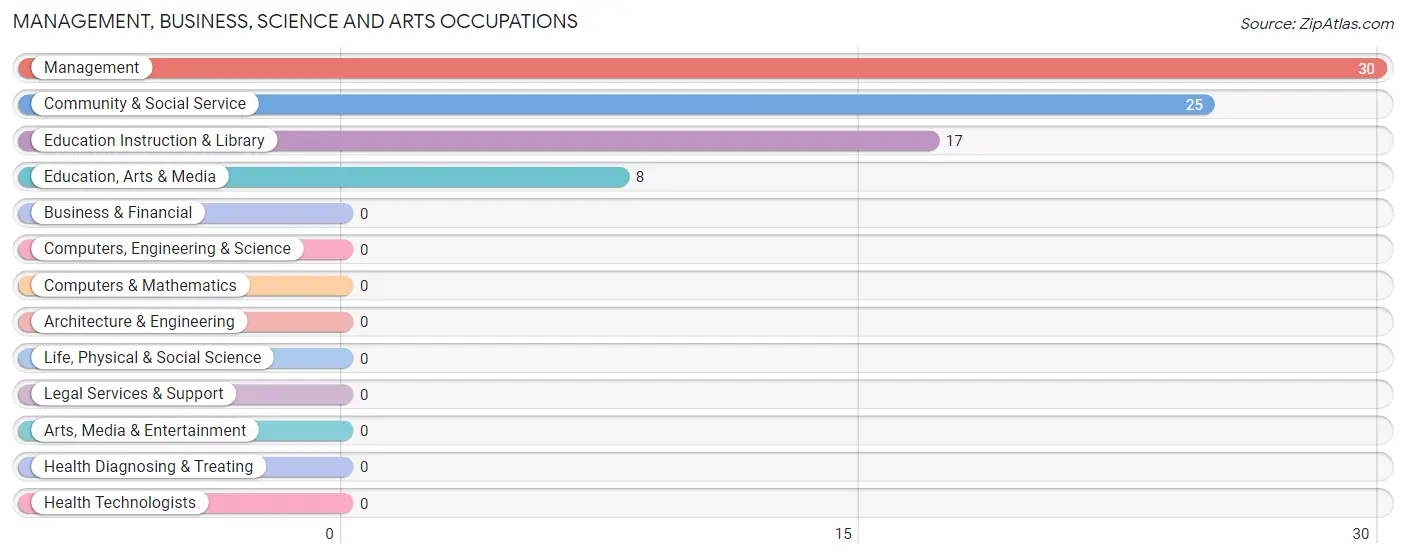
Management, Business, Science and Arts Occupations
The most common Management, Business, Science and Arts occupations in Rouse are Management (30 | 7.3%), Community & Social Service (25 | 6.1%), Education Instruction & Library (17 | 4.2%), and Education, Arts & Media (8 | 2.0%).
Management, Business, Science and Arts Occupations by Sex
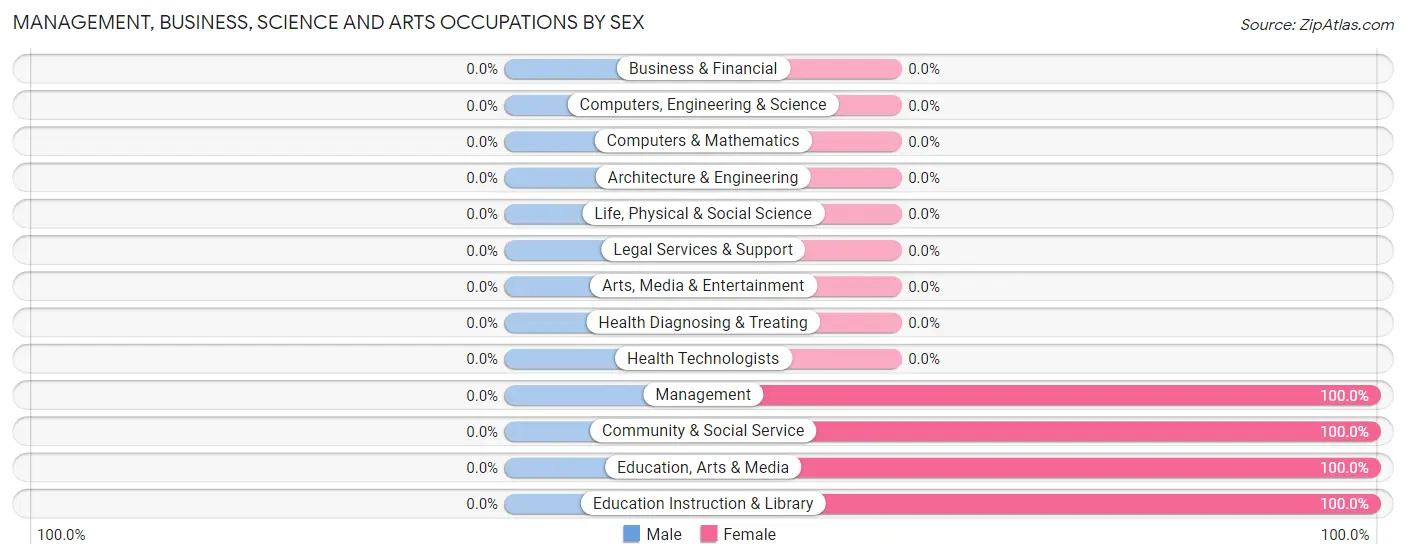
| Occupation | Male | Female |
| Management | 0 (0.0%) | 30 (100.0%) |
| Business & Financial | 0 (0.0%) | 0 (0.0%) |
| Computers, Engineering & Science | 0 (0.0%) | 0 (0.0%) |
| Computers & Mathematics | 0 (0.0%) | 0 (0.0%) |
| Architecture & Engineering | 0 (0.0%) | 0 (0.0%) |
| Life, Physical & Social Science | 0 (0.0%) | 0 (0.0%) |
| Community & Social Service | 0 (0.0%) | 25 (100.0%) |
| Education, Arts & Media | 0 (0.0%) | 8 (100.0%) |
| Legal Services & Support | 0 (0.0%) | 0 (0.0%) |
| Education Instruction & Library | 0 (0.0%) | 17 (100.0%) |
| Arts, Media & Entertainment | 0 (0.0%) | 0 (0.0%) |
| Health Diagnosing & Treating | 0 (0.0%) | 0 (0.0%) |
| Health Technologists | 0 (0.0%) | 0 (0.0%) |
| Total (Category) | 0 (0.0%) | 55 (100.0%) |
| Total (Overall) | 215 (52.7%) | 193 (47.3%) |
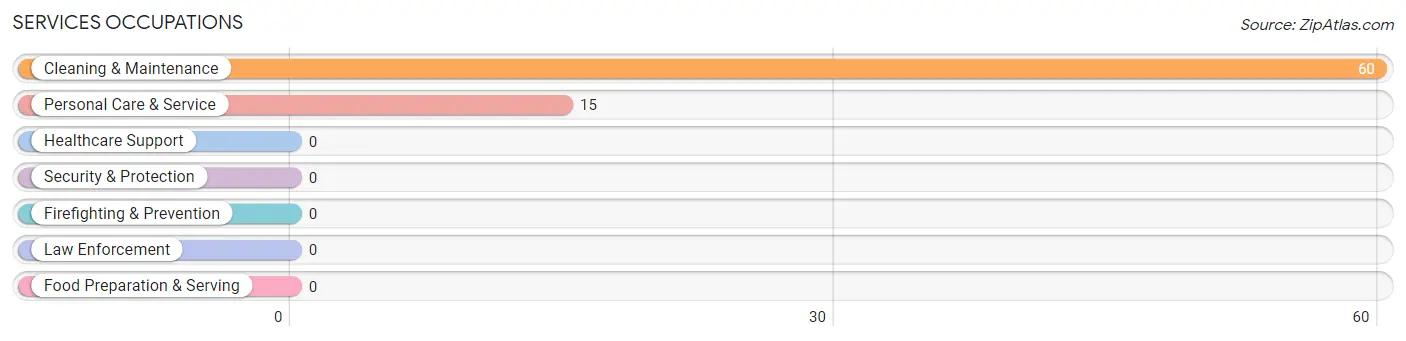
Services Occupations
The most common Services occupations in Rouse are Cleaning & Maintenance (60 | 14.7%), and Personal Care & Service (15 | 3.7%).
Services Occupations by Sex
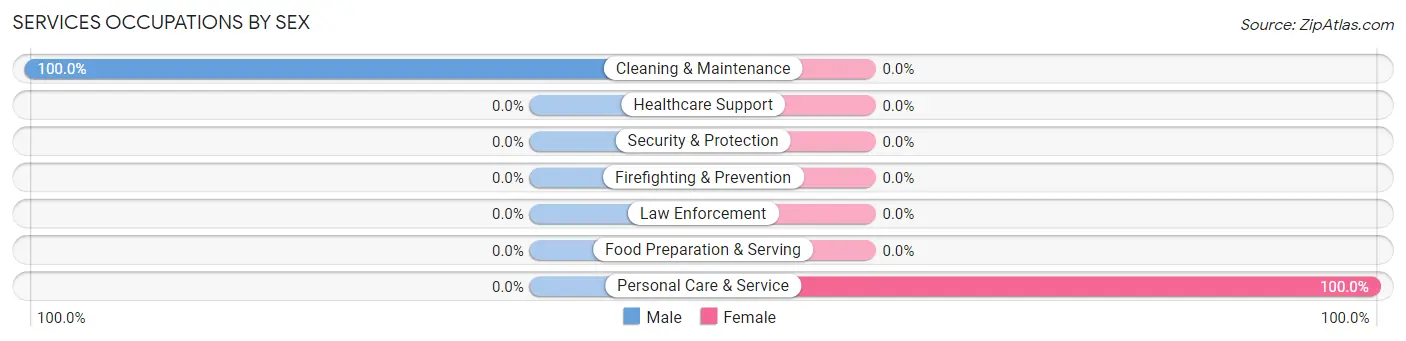
| Occupation | Male | Female |
| Healthcare Support | 0 (0.0%) | 0 (0.0%) |
| Security & Protection | 0 (0.0%) | 0 (0.0%) |
| Firefighting & Prevention | 0 (0.0%) | 0 (0.0%) |
| Law Enforcement | 0 (0.0%) | 0 (0.0%) |
| Food Preparation & Serving | 0 (0.0%) | 0 (0.0%) |
| Cleaning & Maintenance | 60 (100.0%) | 0 (0.0%) |
| Personal Care & Service | 0 (0.0%) | 15 (100.0%) |
| Total (Category) | 60 (80.0%) | 15 (20.0%) |
| Total (Overall) | 215 (52.7%) | 193 (47.3%) |
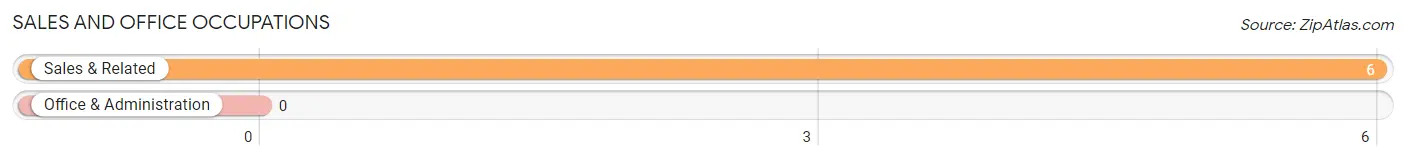
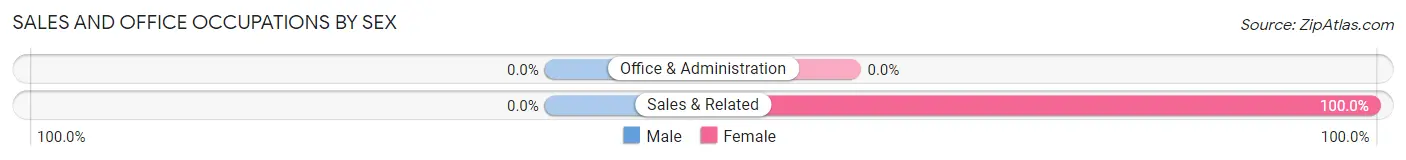
Sales and Office Occupations
The most common Sales and Office occupations in Rouse are , and Sales & Related (6 | 1.5%).
Sales and Office Occupations by Sex
| Occupation | Male | Female |
| Sales & Related | 0 (0.0%) | 6 (100.0%) |
| Office & Administration | 0 (0.0%) | 0 (0.0%) |
| Total (Category) | 0 (0.0%) | 6 (100.0%) |
| Total (Overall) | 215 (52.7%) | 193 (47.3%) |
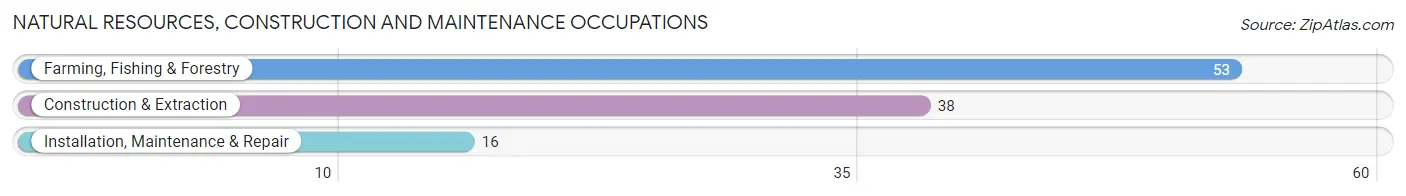
Natural Resources, Construction and Maintenance Occupations
The most common Natural Resources, Construction and Maintenance occupations in Rouse are Farming, Fishing & Forestry (53 | 13.0%), Construction & Extraction (38 | 9.3%), and Installation, Maintenance & Repair (16 | 3.9%).
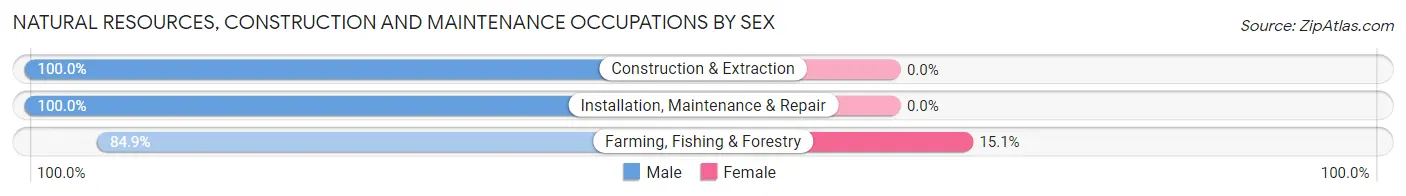
Natural Resources, Construction and Maintenance Occupations by Sex
| Occupation | Male | Female |
| Farming, Fishing & Forestry | 45 (84.9%) | 8 (15.1%) |
| Construction & Extraction | 38 (100.0%) | 0 (0.0%) |
| Installation, Maintenance & Repair | 16 (100.0%) | 0 (0.0%) |
| Total (Category) | 99 (92.5%) | 8 (7.5%) |
| Total (Overall) | 215 (52.7%) | 193 (47.3%) |
Production, Transportation and Moving Occupations
The most common Production, Transportation and Moving occupations in Rouse are Production (76 | 18.6%), Material Moving (56 | 13.7%), and Transportation (33 | 8.1%).
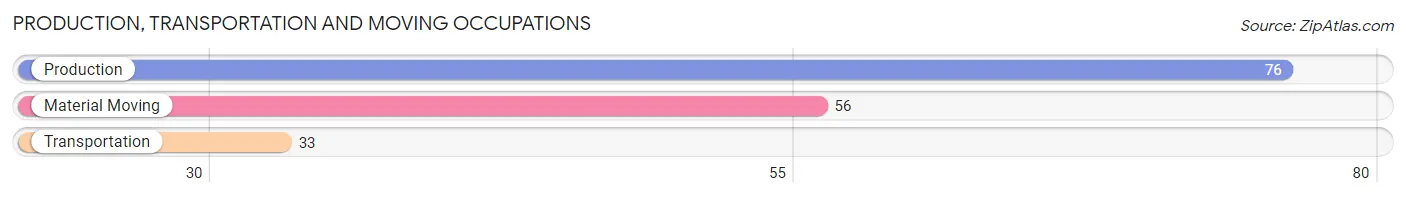
Production, Transportation and Moving Occupations by Sex
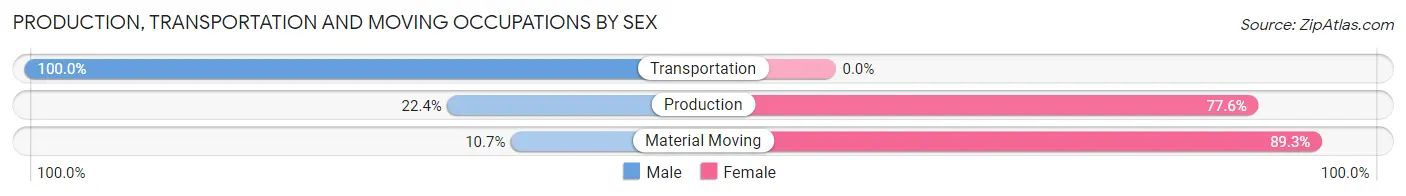
| Occupation | Male | Female |
| Production | 17 (22.4%) | 59 (77.6%) |
| Transportation | 33 (100.0%) | 0 (0.0%) |
| Material Moving | 6 (10.7%) | 50 (89.3%) |
| Total (Category) | 56 (33.9%) | 109 (66.1%) |
| Total (Overall) | 215 (52.7%) | 193 (47.3%) |
Employment Industries by Sex in Rouse
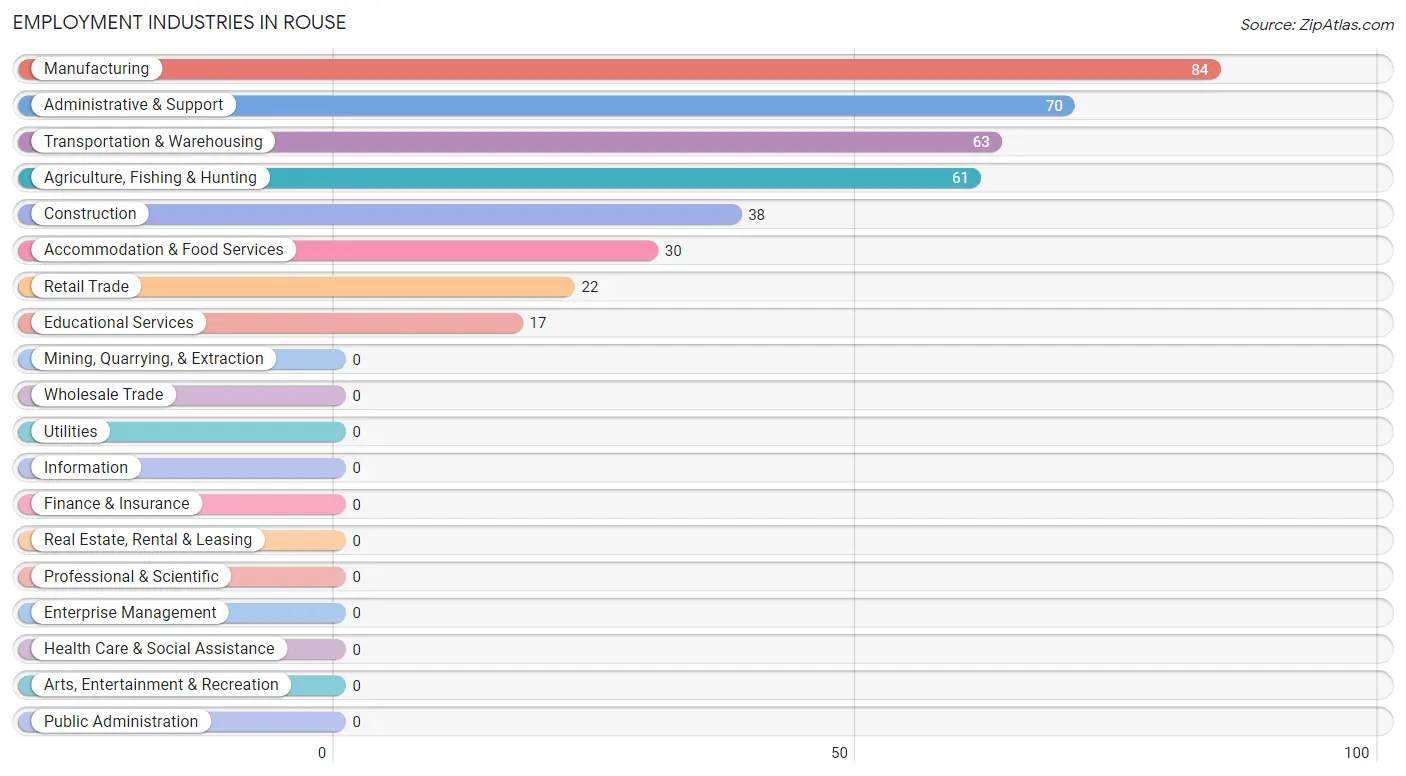
Employment Industries in Rouse
The major employment industries in Rouse include Manufacturing (84 | 20.6%), Administrative & Support (70 | 17.2%), Transportation & Warehousing (63 | 15.4%), Agriculture, Fishing & Hunting (61 | 14.9%), and Construction (38 | 9.3%).
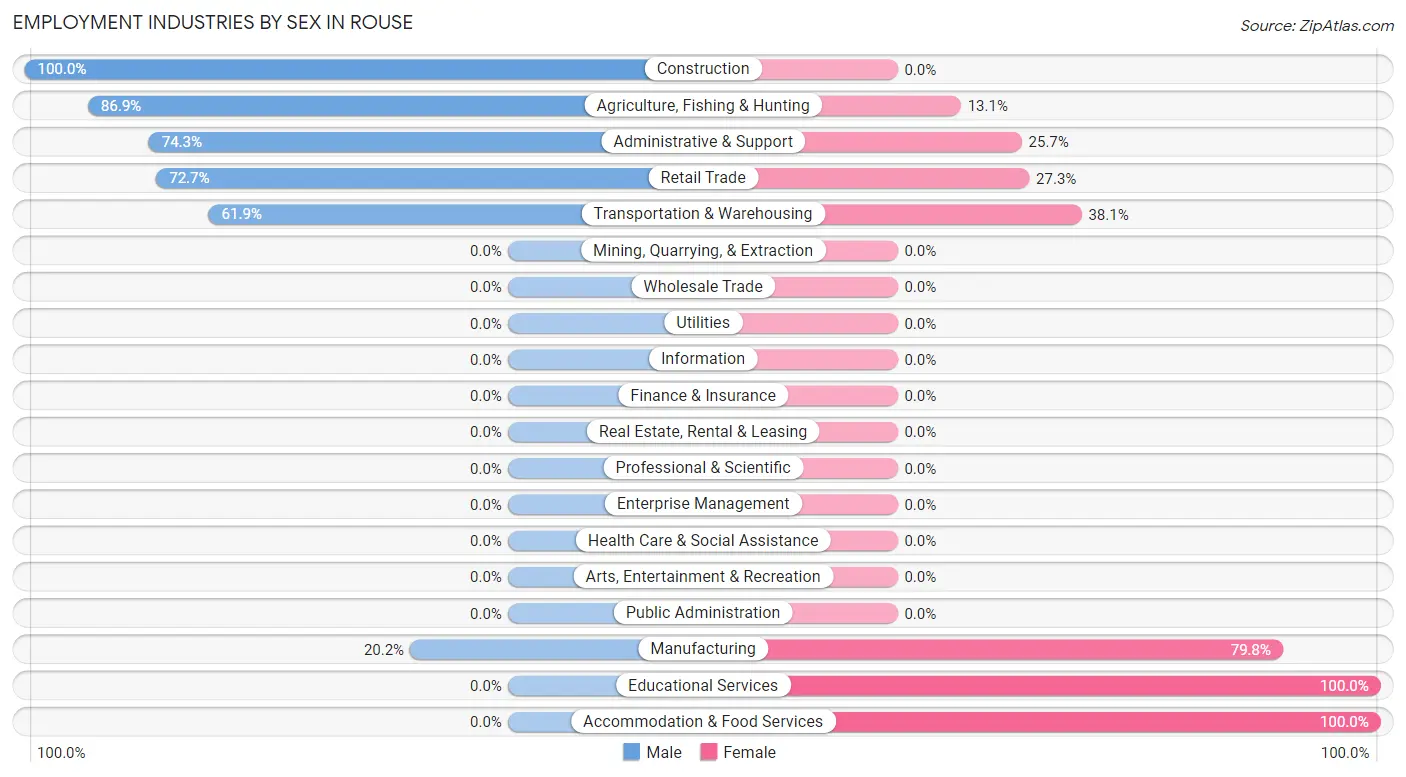
Employment Industries by Sex in Rouse
The Rouse industries that see more men than women are Construction (100.0%), Agriculture, Fishing & Hunting (86.9%), and Administrative & Support (74.3%), whereas the industries that tend to have a higher number of women are Educational Services (100.0%), Accommodation & Food Services (100.0%), and Manufacturing (79.8%).
| Industry | Male | Female |
| Agriculture, Fishing & Hunting | 53 (86.9%) | 8 (13.1%) |
| Mining, Quarrying, & Extraction | 0 (0.0%) | 0 (0.0%) |
| Construction | 38 (100.0%) | 0 (0.0%) |
| Manufacturing | 17 (20.2%) | 67 (79.8%) |
| Wholesale Trade | 0 (0.0%) | 0 (0.0%) |
| Retail Trade | 16 (72.7%) | 6 (27.3%) |
| Transportation & Warehousing | 39 (61.9%) | 24 (38.1%) |
| Utilities | 0 (0.0%) | 0 (0.0%) |
| Information | 0 (0.0%) | 0 (0.0%) |
| Finance & Insurance | 0 (0.0%) | 0 (0.0%) |
| Real Estate, Rental & Leasing | 0 (0.0%) | 0 (0.0%) |
| Professional & Scientific | 0 (0.0%) | 0 (0.0%) |
| Enterprise Management | 0 (0.0%) | 0 (0.0%) |
| Administrative & Support | 52 (74.3%) | 18 (25.7%) |
| Educational Services | 0 (0.0%) | 17 (100.0%) |
| Health Care & Social Assistance | 0 (0.0%) | 0 (0.0%) |
| Arts, Entertainment & Recreation | 0 (0.0%) | 0 (0.0%) |
| Accommodation & Food Services | 0 (0.0%) | 30 (100.0%) |
| Public Administration | 0 (0.0%) | 0 (0.0%) |
| Total | 215 (52.7%) | 193 (47.3%) |
Education in Rouse
School Enrollment in Rouse
The most common levels of schooling among the 299 students in Rouse are elementary school (99 | 33.1%), high school (69 | 23.1%), and middle school (59 | 19.7%).
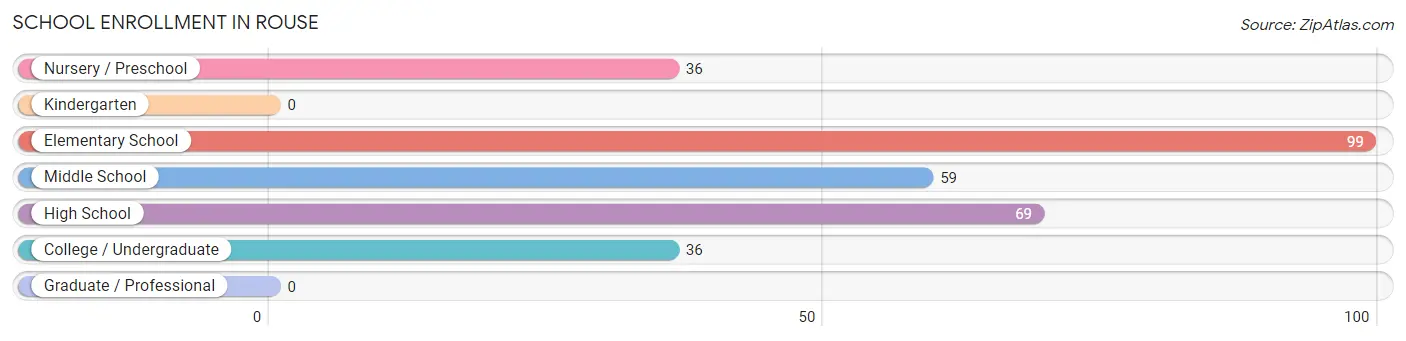
| School Level | # Students | % Students |
| Nursery / Preschool | 36 | 12.0% |
| Kindergarten | 0 | 0.0% |
| Elementary School | 99 | 33.1% |
| Middle School | 59 | 19.7% |
| High School | 69 | 23.1% |
| College / Undergraduate | 36 | 12.0% |
| Graduate / Professional | 0 | 0.0% |
| Total | 299 | 100.0% |
School Enrollment by Age by Funding Source in Rouse
Out of a total of 299 students who are enrolled in schools in Rouse, 16 (5.4%) attend a private institution, while the remaining 283 (94.6%) are enrolled in public schools. The age group of 20 to 24 year olds has the highest likelihood of being enrolled in private schools, with 16 (66.7% in the age bracket) enrolled. Conversely, the age group of 3 to 4 year olds has the lowest likelihood of being enrolled in a private school, with 36 (100.0% in the age bracket) attending a public institution.
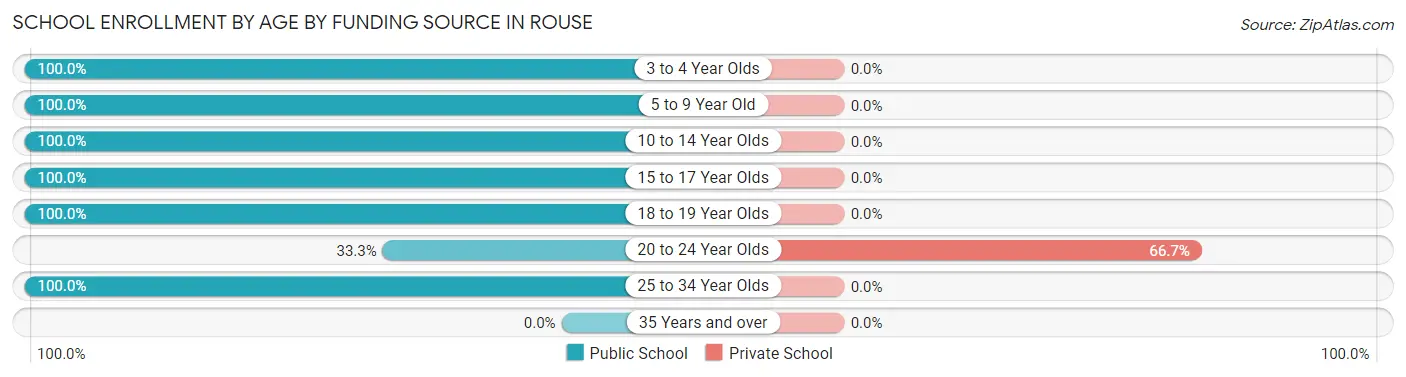
| Age Bracket | Public School | Private School |
| 3 to 4 Year Olds | 36 (100.0%) | 0 (0.0%) |
| 5 to 9 Year Old | 99 (100.0%) | 0 (0.0%) |
| 10 to 14 Year Olds | 59 (100.0%) | 0 (0.0%) |
| 15 to 17 Year Olds | 29 (100.0%) | 0 (0.0%) |
| 18 to 19 Year Olds | 16 (100.0%) | 0 (0.0%) |
| 20 to 24 Year Olds | 8 (33.3%) | 16 (66.7%) |
| 25 to 34 Year Olds | 36 (100.0%) | 0 (0.0%) |
| 35 Years and over | 0 (0.0%) | 0 (0.0%) |
| Total | 283 (94.6%) | 16 (5.4%) |
Educational Attainment by Field of Study in Rouse
Physical & health sciences (43 | 51.2%), education (25 | 29.8%), social sciences (8 | 9.5%), literature & languages (4 | 4.8%), and liberal arts & history (4 | 4.8%) are the most common fields of study among 84 individuals in Rouse who have obtained a bachelor's degree or higher.
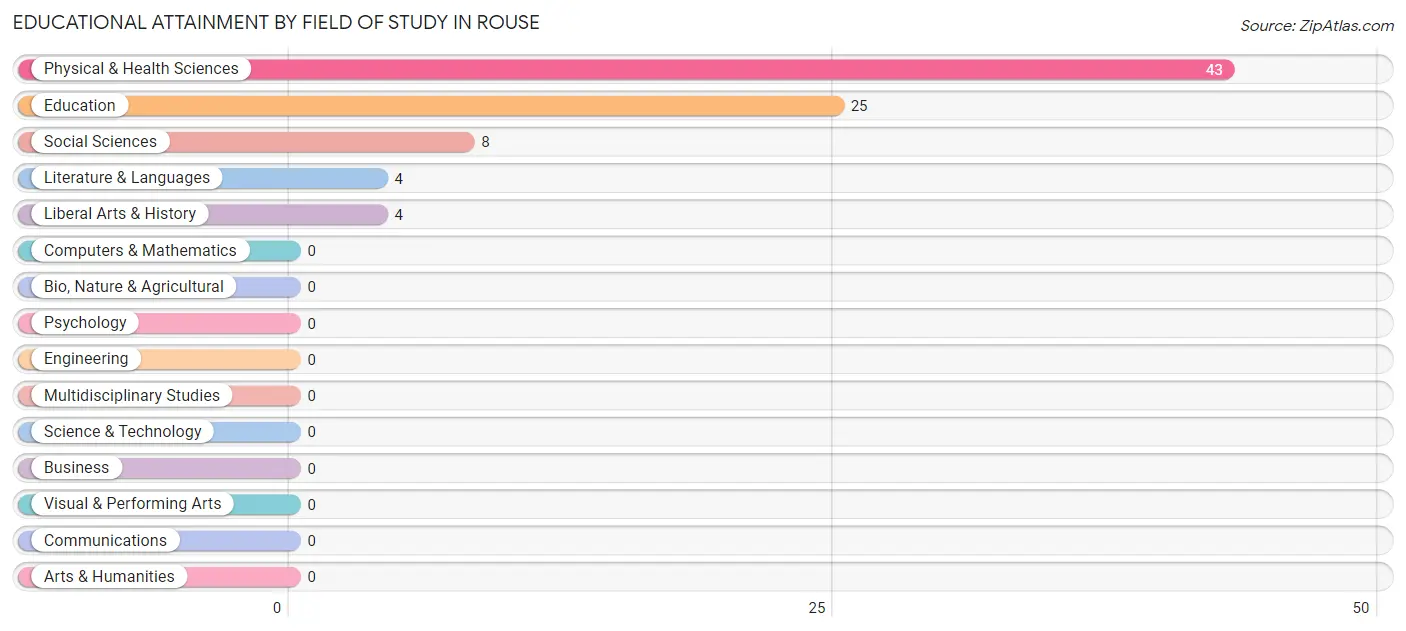
| Field of Study | # Graduates | % Graduates |
| Computers & Mathematics | 0 | 0.0% |
| Bio, Nature & Agricultural | 0 | 0.0% |
| Physical & Health Sciences | 43 | 51.2% |
| Psychology | 0 | 0.0% |
| Social Sciences | 8 | 9.5% |
| Engineering | 0 | 0.0% |
| Multidisciplinary Studies | 0 | 0.0% |
| Science & Technology | 0 | 0.0% |
| Business | 0 | 0.0% |
| Education | 25 | 29.8% |
| Literature & Languages | 4 | 4.8% |
| Liberal Arts & History | 4 | 4.8% |
| Visual & Performing Arts | 0 | 0.0% |
| Communications | 0 | 0.0% |
| Arts & Humanities | 0 | 0.0% |
| Total | 84 | 100.0% |
Transportation & Commute in Rouse
Vehicle Availability by Sex in Rouse
The most prevalent vehicle ownership categories in Rouse are males with 2 vehicles (103, accounting for 47.9%) and females with 2 vehicles (134, making up 53.4%).
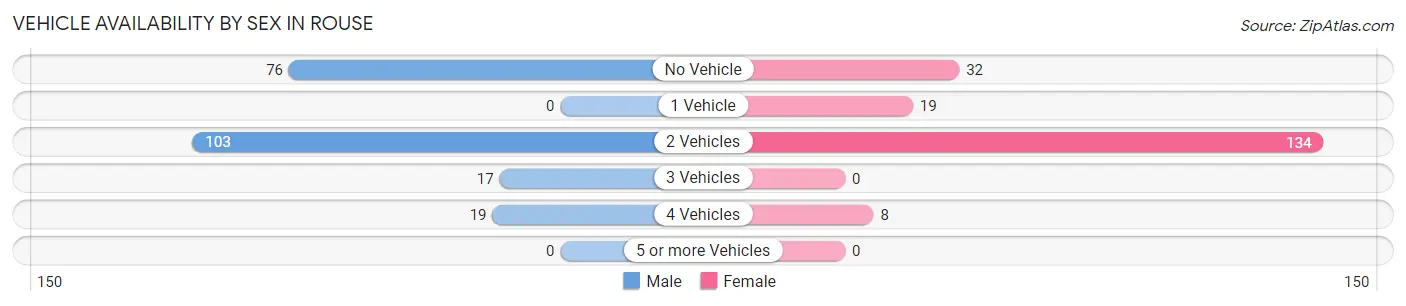
| Vehicles Available | Male | Female |
| No Vehicle | 76 (35.3%) | 32 (16.6%) |
| 1 Vehicle | 0 (0.0%) | 19 (9.8%) |
| 2 Vehicles | 103 (47.9%) | 134 (69.4%) |
| 3 Vehicles | 17 (7.9%) | 0 (0.0%) |
| 4 Vehicles | 19 (8.8%) | 8 (4.2%) |
| 5 or more Vehicles | 0 (0.0%) | 0 (0.0%) |
| Total | 215 (100.0%) | 193 (100.0%) |
Commute Time in Rouse
The most frequently occuring commute durations in Rouse are 90 or more minutes (94 commuters, 23.0%), 20 to 24 minutes (69 commuters, 16.9%), and 15 to 19 minutes (68 commuters, 16.7%).
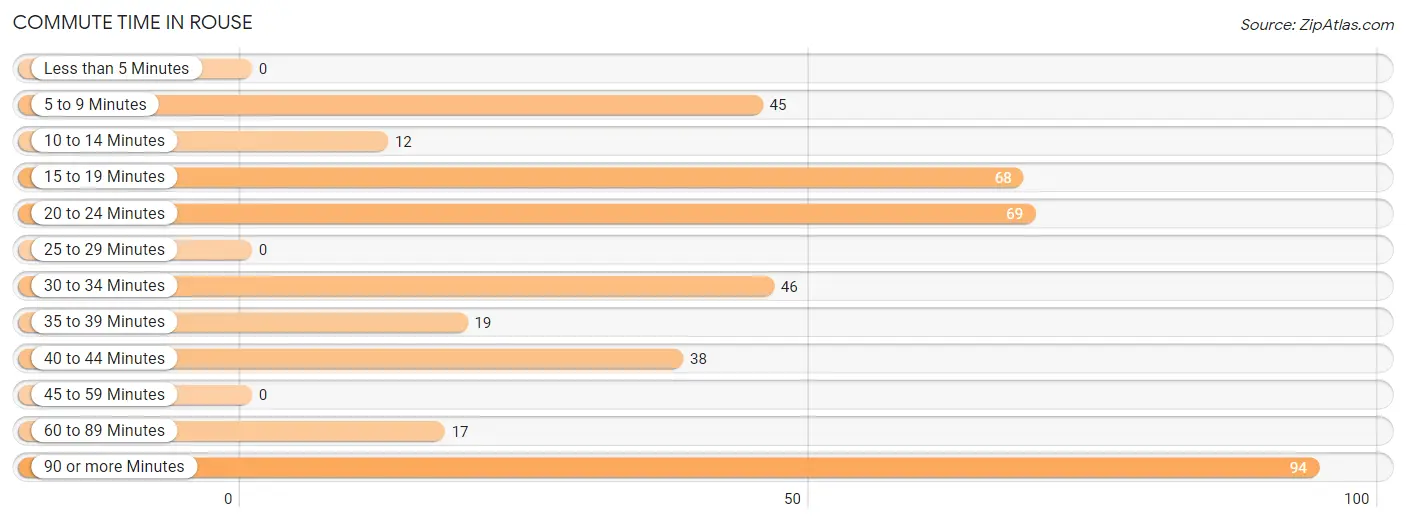
| Commute Time | # Commuters | % Commuters |
| Less than 5 Minutes | 0 | 0.0% |
| 5 to 9 Minutes | 45 | 11.0% |
| 10 to 14 Minutes | 12 | 2.9% |
| 15 to 19 Minutes | 68 | 16.7% |
| 20 to 24 Minutes | 69 | 16.9% |
| 25 to 29 Minutes | 0 | 0.0% |
| 30 to 34 Minutes | 46 | 11.3% |
| 35 to 39 Minutes | 19 | 4.7% |
| 40 to 44 Minutes | 38 | 9.3% |
| 45 to 59 Minutes | 0 | 0.0% |
| 60 to 89 Minutes | 17 | 4.2% |
| 90 or more Minutes | 94 | 23.0% |
Commute Time by Sex in Rouse
The most common commute times in Rouse are 90 or more minutes (77 commuters, 35.8%) for males and 5 to 9 minutes (45 commuters, 23.3%) for females.
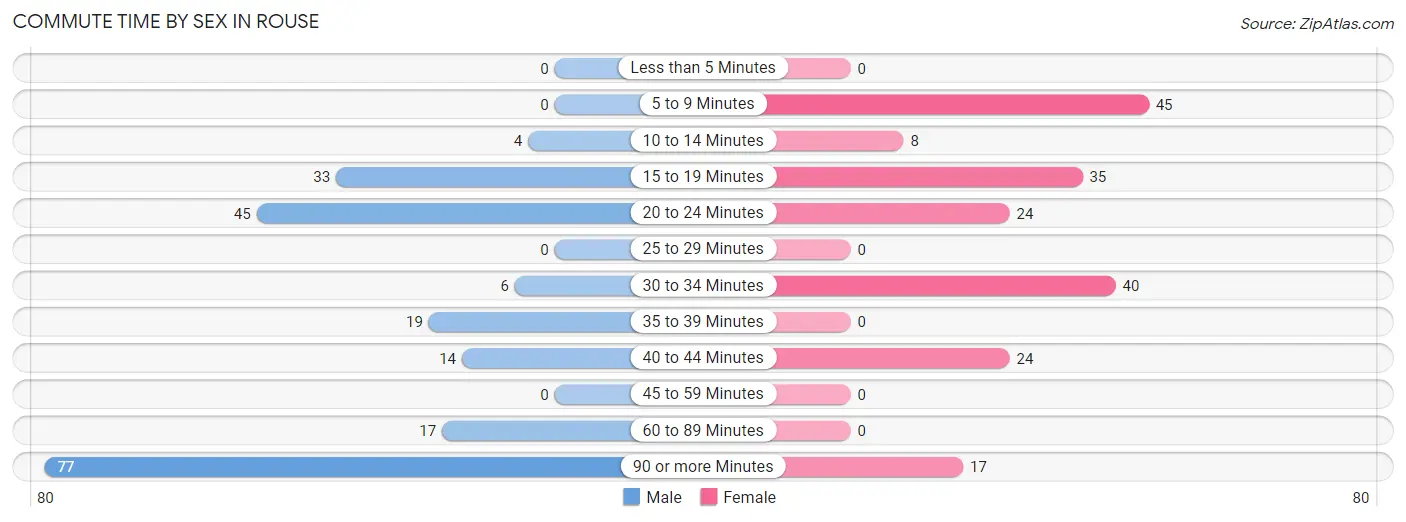
| Commute Time | Male | Female |
| Less than 5 Minutes | 0 (0.0%) | 0 (0.0%) |
| 5 to 9 Minutes | 0 (0.0%) | 45 (23.3%) |
| 10 to 14 Minutes | 4 (1.9%) | 8 (4.2%) |
| 15 to 19 Minutes | 33 (15.3%) | 35 (18.1%) |
| 20 to 24 Minutes | 45 (20.9%) | 24 (12.4%) |
| 25 to 29 Minutes | 0 (0.0%) | 0 (0.0%) |
| 30 to 34 Minutes | 6 (2.8%) | 40 (20.7%) |
| 35 to 39 Minutes | 19 (8.8%) | 0 (0.0%) |
| 40 to 44 Minutes | 14 (6.5%) | 24 (12.4%) |
| 45 to 59 Minutes | 0 (0.0%) | 0 (0.0%) |
| 60 to 89 Minutes | 17 (7.9%) | 0 (0.0%) |
| 90 or more Minutes | 77 (35.8%) | 17 (8.8%) |
Time of Departure to Work by Sex in Rouse
The most frequent times of departure to work in Rouse are 12:00 AM to 4:59 AM (63, 29.3%) for males and 12:00 PM to 3:59 PM (50, 25.9%) for females.
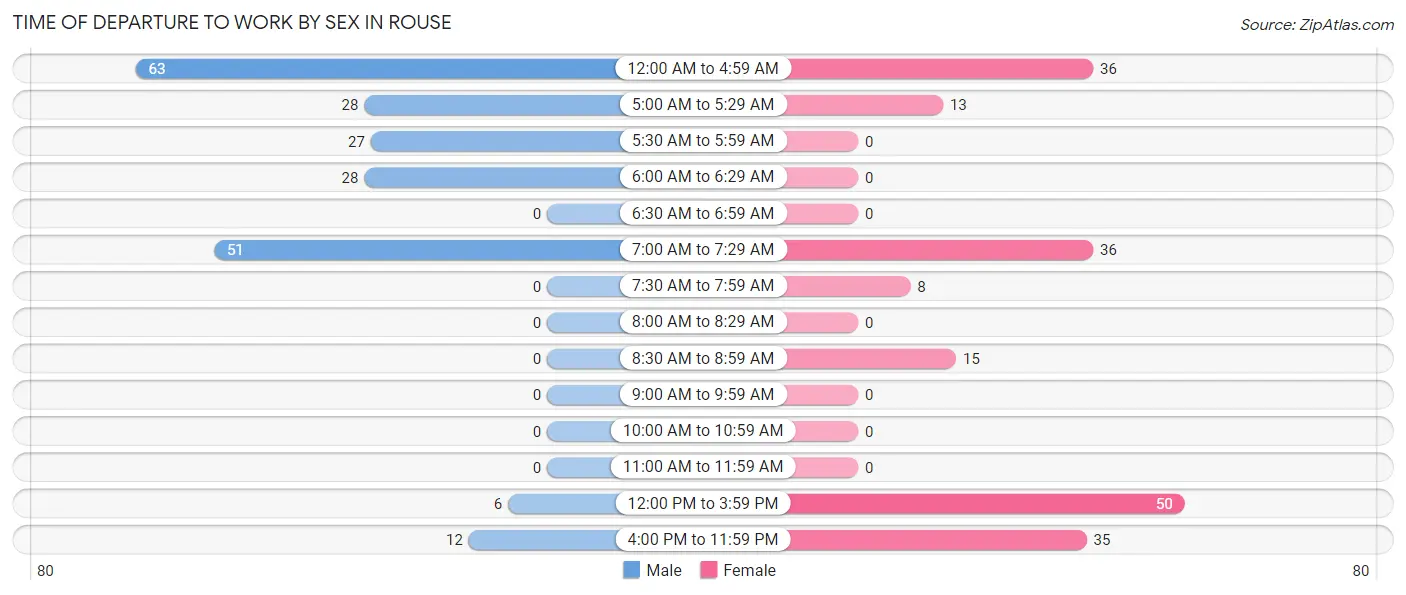
| Time of Departure | Male | Female |
| 12:00 AM to 4:59 AM | 63 (29.3%) | 36 (18.6%) |
| 5:00 AM to 5:29 AM | 28 (13.0%) | 13 (6.7%) |
| 5:30 AM to 5:59 AM | 27 (12.6%) | 0 (0.0%) |
| 6:00 AM to 6:29 AM | 28 (13.0%) | 0 (0.0%) |
| 6:30 AM to 6:59 AM | 0 (0.0%) | 0 (0.0%) |
| 7:00 AM to 7:29 AM | 51 (23.7%) | 36 (18.6%) |
| 7:30 AM to 7:59 AM | 0 (0.0%) | 8 (4.2%) |
| 8:00 AM to 8:29 AM | 0 (0.0%) | 0 (0.0%) |
| 8:30 AM to 8:59 AM | 0 (0.0%) | 15 (7.8%) |
| 9:00 AM to 9:59 AM | 0 (0.0%) | 0 (0.0%) |
| 10:00 AM to 10:59 AM | 0 (0.0%) | 0 (0.0%) |
| 11:00 AM to 11:59 AM | 0 (0.0%) | 0 (0.0%) |
| 12:00 PM to 3:59 PM | 6 (2.8%) | 50 (25.9%) |
| 4:00 PM to 11:59 PM | 12 (5.6%) | 35 (18.1%) |
| Total | 215 (100.0%) | 193 (100.0%) |
Housing Occupancy in Rouse
Occupancy by Ownership in Rouse
Of the total 339 dwellings in Rouse, owner-occupied units account for 112 (33.0%), while renter-occupied units make up 227 (67.0%).
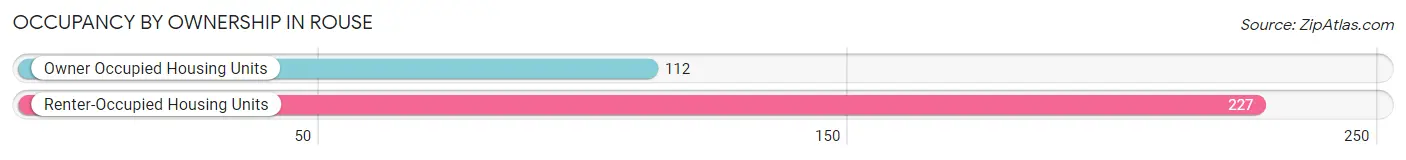
| Occupancy | # Housing Units | % Housing Units |
| Owner Occupied Housing Units | 112 | 33.0% |
| Renter-Occupied Housing Units | 227 | 67.0% |
| Total Occupied Housing Units | 339 | 100.0% |
Occupancy by Household Size in Rouse
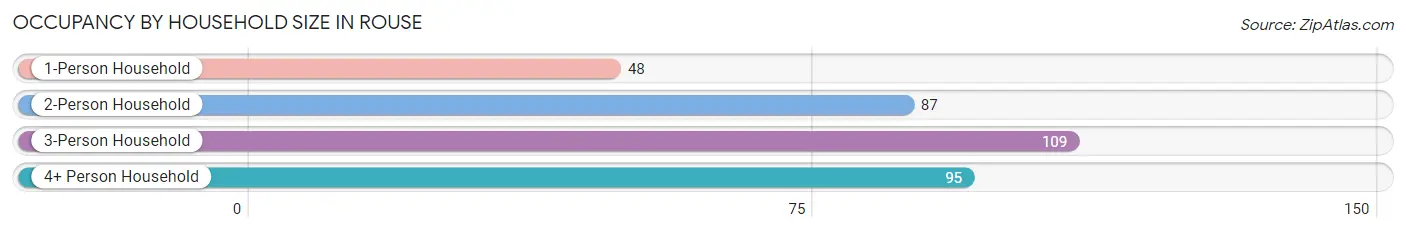
| Household Size | # Housing Units | % Housing Units |
| 1-Person Household | 48 | 14.2% |
| 2-Person Household | 87 | 25.7% |
| 3-Person Household | 109 | 32.2% |
| 4+ Person Household | 95 | 28.0% |
| Total Housing Units | 339 | 100.0% |
Occupancy by Ownership by Household Size in Rouse
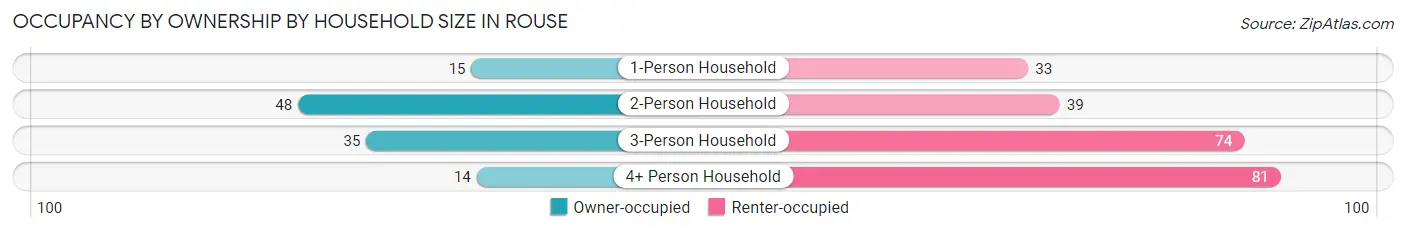
| Household Size | Owner-occupied | Renter-occupied |
| 1-Person Household | 15 (31.2%) | 33 (68.8%) |
| 2-Person Household | 48 (55.2%) | 39 (44.8%) |
| 3-Person Household | 35 (32.1%) | 74 (67.9%) |
| 4+ Person Household | 14 (14.7%) | 81 (85.3%) |
| Total Housing Units | 112 (33.0%) | 227 (67.0%) |
Occupancy by Educational Attainment in Rouse
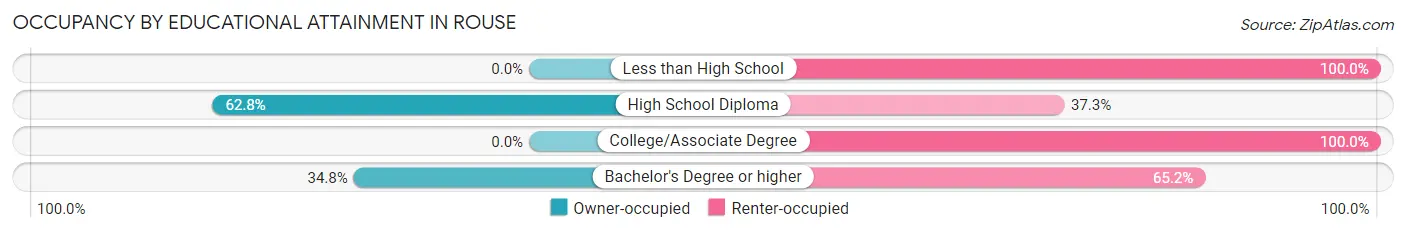
| Household Size | Owner-occupied | Renter-occupied |
| Less than High School | 0 (0.0%) | 67 (100.0%) |
| High School Diploma | 96 (62.7%) | 57 (37.2%) |
| College/Associate Degree | 0 (0.0%) | 73 (100.0%) |
| Bachelor's Degree or higher | 16 (34.8%) | 30 (65.2%) |
Occupancy by Age of Householder in Rouse
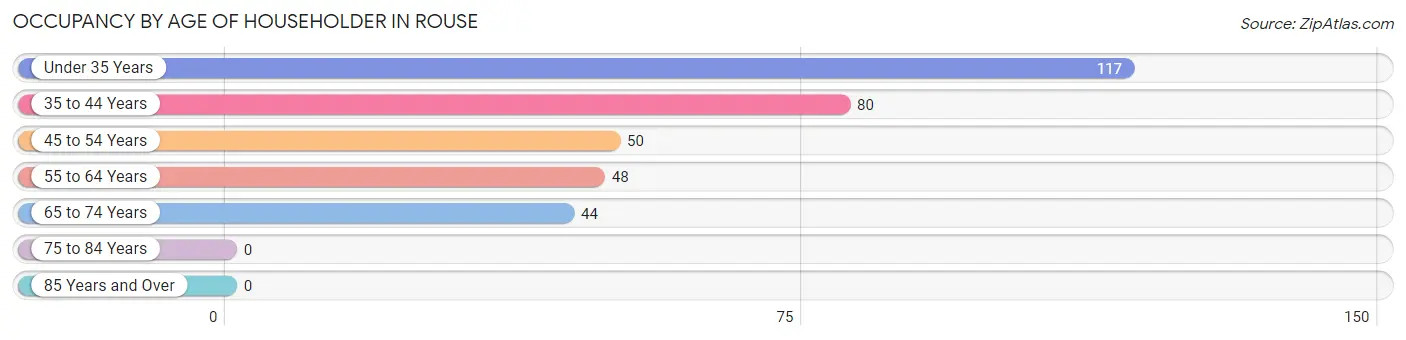
| Age Bracket | # Households | % Households |
| Under 35 Years | 117 | 34.5% |
| 35 to 44 Years | 80 | 23.6% |
| 45 to 54 Years | 50 | 14.7% |
| 55 to 64 Years | 48 | 14.2% |
| 65 to 74 Years | 44 | 13.0% |
| 75 to 84 Years | 0 | 0.0% |
| 85 Years and Over | 0 | 0.0% |
| Total | 339 | 100.0% |
Housing Finances in Rouse
Median Income by Occupancy in Rouse
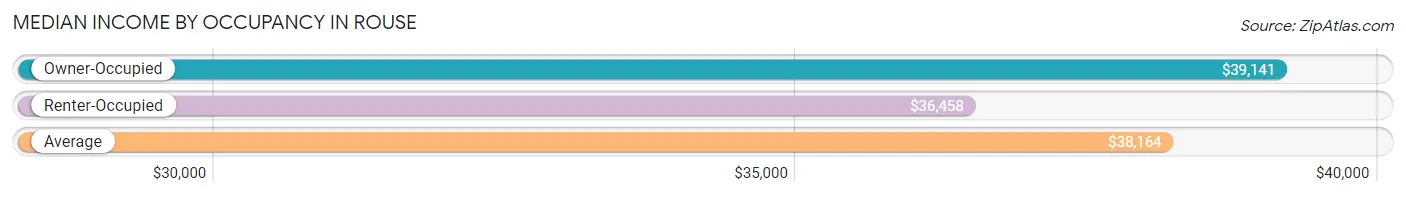
| Occupancy Type | # Households | Median Income |
| Owner-Occupied | 112 (33.0%) | $39,141 |
| Renter-Occupied | 227 (67.0%) | $36,458 |
| Average | 339 (100.0%) | $38,164 |
Occupancy by Householder Income Bracket in Rouse
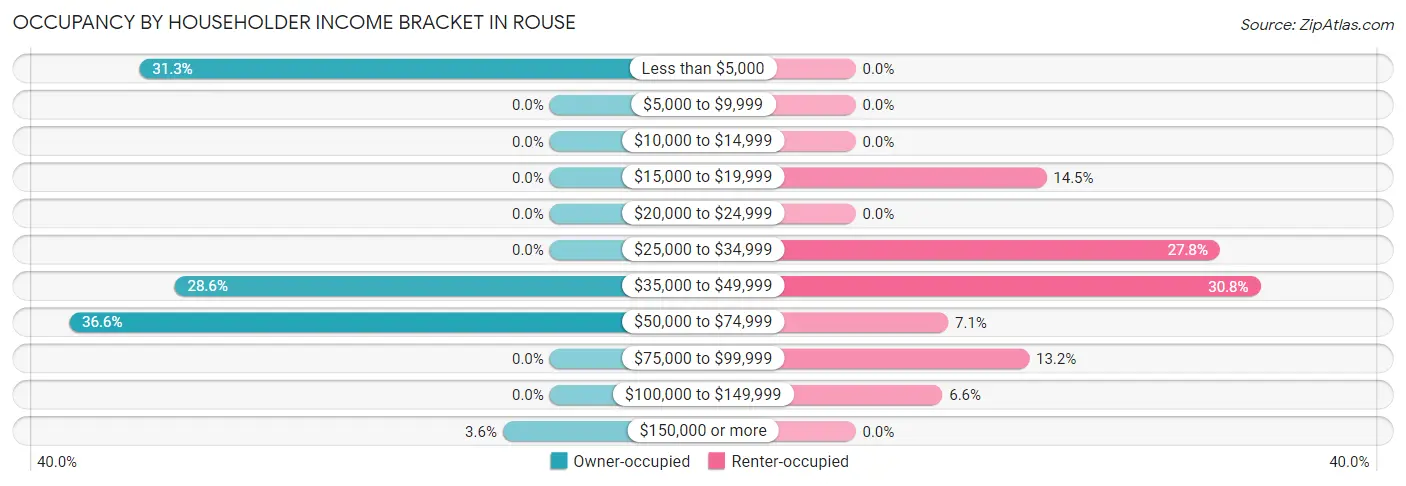
| Income Bracket | Owner-occupied | Renter-occupied |
| Less than $5,000 | 35 (31.2%) | 0 (0.0%) |
| $5,000 to $9,999 | 0 (0.0%) | 0 (0.0%) |
| $10,000 to $14,999 | 0 (0.0%) | 0 (0.0%) |
| $15,000 to $19,999 | 0 (0.0%) | 33 (14.5%) |
| $20,000 to $24,999 | 0 (0.0%) | 0 (0.0%) |
| $25,000 to $34,999 | 0 (0.0%) | 63 (27.8%) |
| $35,000 to $49,999 | 32 (28.6%) | 70 (30.8%) |
| $50,000 to $74,999 | 41 (36.6%) | 16 (7.0%) |
| $75,000 to $99,999 | 0 (0.0%) | 30 (13.2%) |
| $100,000 to $149,999 | 0 (0.0%) | 15 (6.6%) |
| $150,000 or more | 4 (3.6%) | 0 (0.0%) |
| Total | 112 (100.0%) | 227 (100.0%) |
Monthly Housing Cost Tiers in Rouse
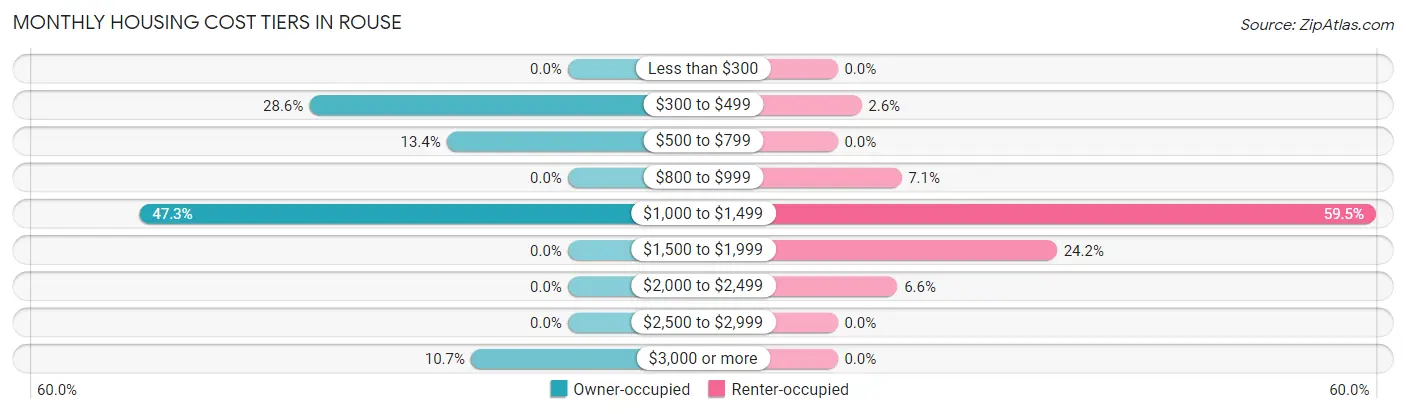
| Monthly Cost | Owner-occupied | Renter-occupied |
| Less than $300 | 0 (0.0%) | 0 (0.0%) |
| $300 to $499 | 32 (28.6%) | 6 (2.6%) |
| $500 to $799 | 15 (13.4%) | 0 (0.0%) |
| $800 to $999 | 0 (0.0%) | 16 (7.0%) |
| $1,000 to $1,499 | 53 (47.3%) | 135 (59.5%) |
| $1,500 to $1,999 | 0 (0.0%) | 55 (24.2%) |
| $2,000 to $2,499 | 0 (0.0%) | 15 (6.6%) |
| $2,500 to $2,999 | 0 (0.0%) | 0 (0.0%) |
| $3,000 or more | 12 (10.7%) | 0 (0.0%) |
| Total | 112 (100.0%) | 227 (100.0%) |
Physical Housing Characteristics in Rouse
Housing Structures in Rouse
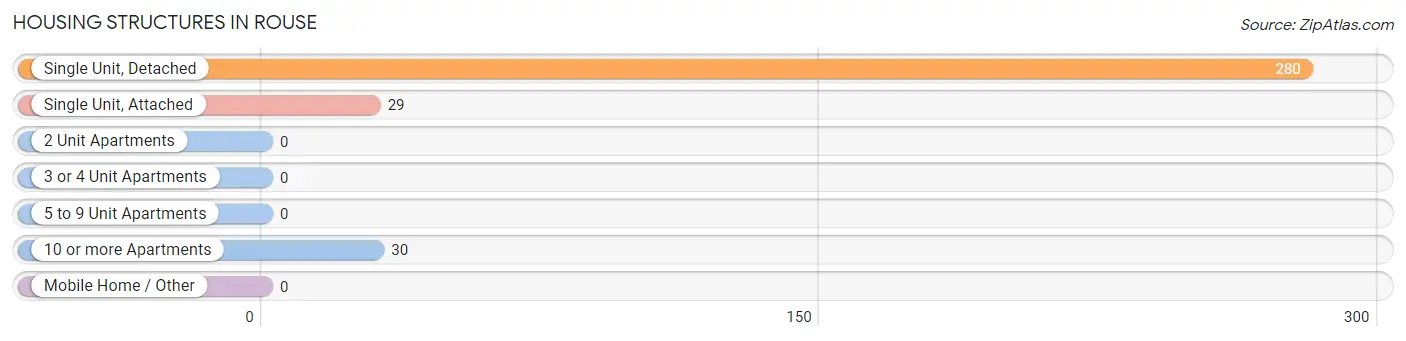
| Structure Type | # Housing Units | % Housing Units |
| Single Unit, Detached | 280 | 82.6% |
| Single Unit, Attached | 29 | 8.6% |
| 2 Unit Apartments | 0 | 0.0% |
| 3 or 4 Unit Apartments | 0 | 0.0% |
| 5 to 9 Unit Apartments | 0 | 0.0% |
| 10 or more Apartments | 30 | 8.8% |
| Mobile Home / Other | 0 | 0.0% |
| Total | 339 | 100.0% |
Housing Structures by Occupancy in Rouse
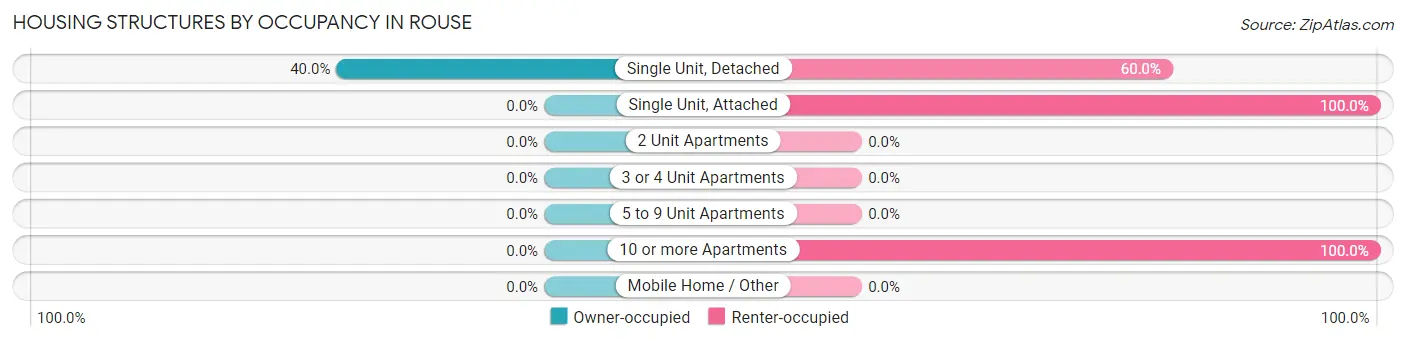
| Structure Type | Owner-occupied | Renter-occupied |
| Single Unit, Detached | 112 (40.0%) | 168 (60.0%) |
| Single Unit, Attached | 0 (0.0%) | 29 (100.0%) |
| 2 Unit Apartments | 0 (0.0%) | 0 (0.0%) |
| 3 or 4 Unit Apartments | 0 (0.0%) | 0 (0.0%) |
| 5 to 9 Unit Apartments | 0 (0.0%) | 0 (0.0%) |
| 10 or more Apartments | 0 (0.0%) | 30 (100.0%) |
| Mobile Home / Other | 0 (0.0%) | 0 (0.0%) |
| Total | 112 (33.0%) | 227 (67.0%) |
Housing Structures by Number of Rooms in Rouse
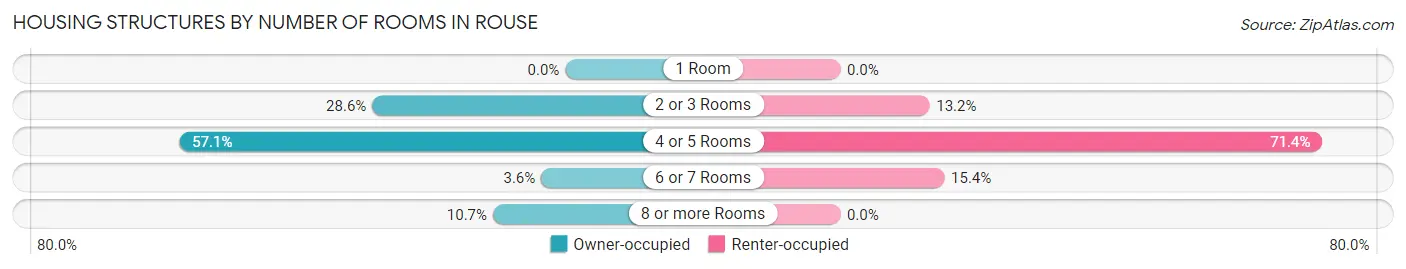
| Number of Rooms | Owner-occupied | Renter-occupied |
| 1 Room | 0 (0.0%) | 0 (0.0%) |
| 2 or 3 Rooms | 32 (28.6%) | 30 (13.2%) |
| 4 or 5 Rooms | 64 (57.1%) | 162 (71.4%) |
| 6 or 7 Rooms | 4 (3.6%) | 35 (15.4%) |
| 8 or more Rooms | 12 (10.7%) | 0 (0.0%) |
| Total | 112 (100.0%) | 227 (100.0%) |
Housing Structure by Heating Type in Rouse
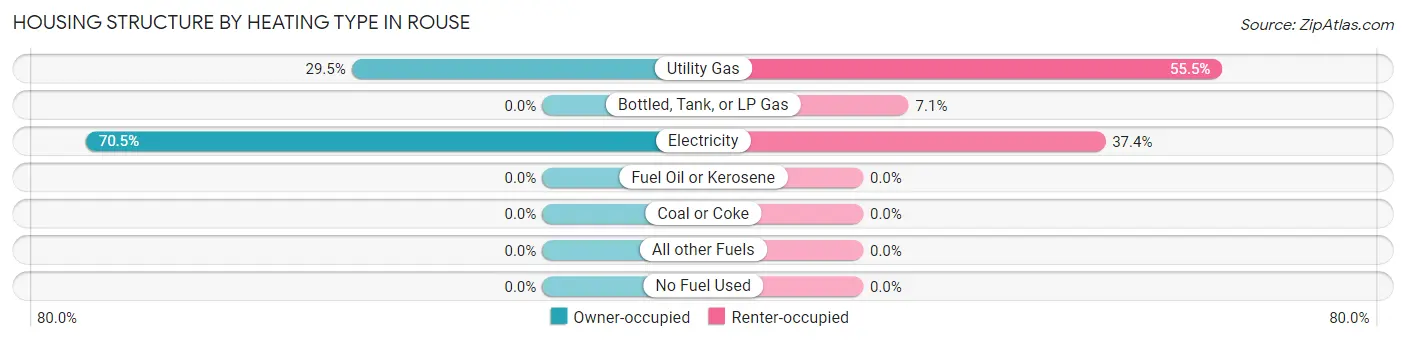
| Heating Type | Owner-occupied | Renter-occupied |
| Utility Gas | 33 (29.5%) | 126 (55.5%) |
| Bottled, Tank, or LP Gas | 0 (0.0%) | 16 (7.0%) |
| Electricity | 79 (70.5%) | 85 (37.4%) |
| Fuel Oil or Kerosene | 0 (0.0%) | 0 (0.0%) |
| Coal or Coke | 0 (0.0%) | 0 (0.0%) |
| All other Fuels | 0 (0.0%) | 0 (0.0%) |
| No Fuel Used | 0 (0.0%) | 0 (0.0%) |
| Total | 112 (100.0%) | 227 (100.0%) |
Household Vehicle Usage in Rouse
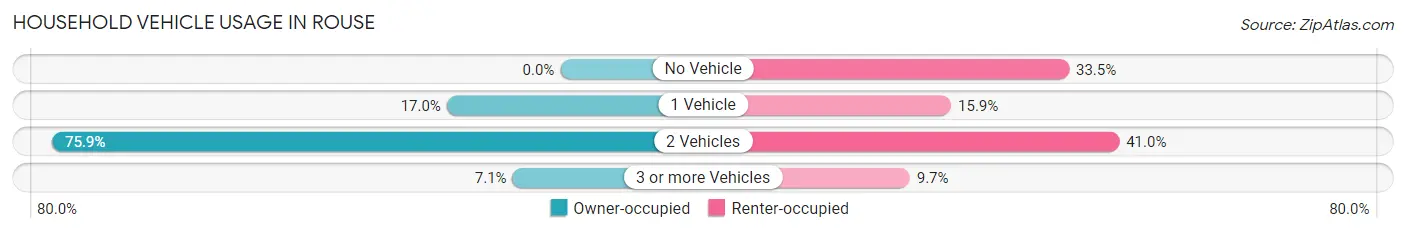
| Vehicles per Household | Owner-occupied | Renter-occupied |
| No Vehicle | 0 (0.0%) | 76 (33.5%) |
| 1 Vehicle | 19 (17.0%) | 36 (15.9%) |
| 2 Vehicles | 85 (75.9%) | 93 (41.0%) |
| 3 or more Vehicles | 8 (7.1%) | 22 (9.7%) |
| Total | 112 (100.0%) | 227 (100.0%) |
Real Estate & Mortgages in Rouse
Real Estate and Mortgage Overview in Rouse
| Characteristic | Without Mortgage | With Mortgage |
| Housing Units | 51 | 61 |
| Median Property Value | $289,800 | $0 |
| Median Household Income | $38,320 | $0 |
| Monthly Housing Costs | - | - |
| Real Estate Taxes | - | - |
Property Value by Mortgage Status in Rouse
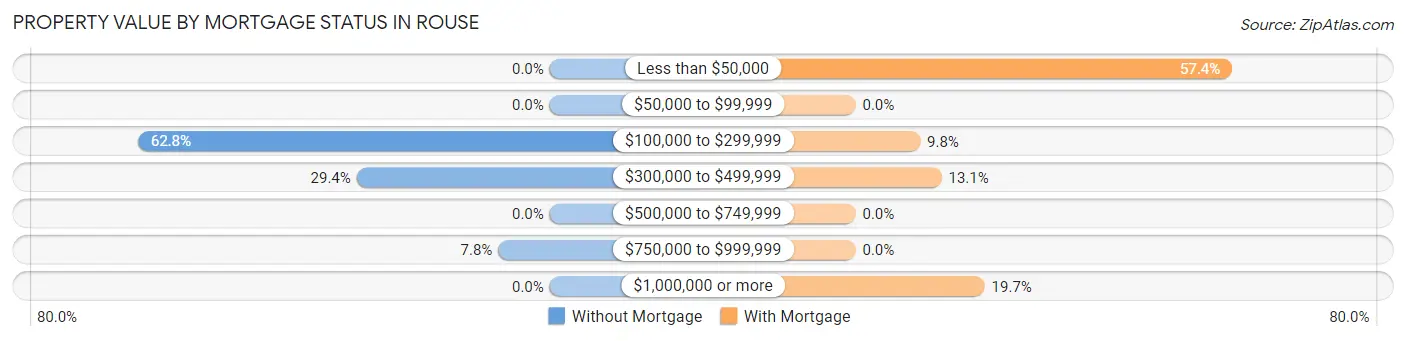
| Property Value | Without Mortgage | With Mortgage |
| Less than $50,000 | 0 (0.0%) | 35 (57.4%) |
| $50,000 to $99,999 | 0 (0.0%) | 0 (0.0%) |
| $100,000 to $299,999 | 32 (62.7%) | 6 (9.8%) |
| $300,000 to $499,999 | 15 (29.4%) | 8 (13.1%) |
| $500,000 to $749,999 | 0 (0.0%) | 0 (0.0%) |
| $750,000 to $999,999 | 4 (7.8%) | 0 (0.0%) |
| $1,000,000 or more | 0 (0.0%) | 12 (19.7%) |
| Total | 51 (100.0%) | 61 (100.0%) |
Household Income by Mortgage Status in Rouse
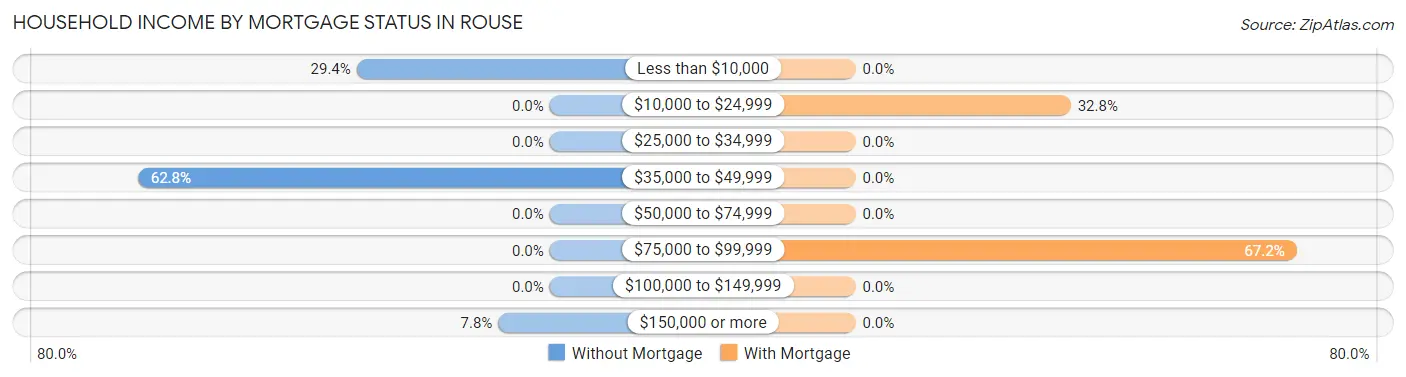
| Household Income | Without Mortgage | With Mortgage |
| Less than $10,000 | 15 (29.4%) | 0 (0.0%) |
| $10,000 to $24,999 | 0 (0.0%) | 20 (32.8%) |
| $25,000 to $34,999 | 0 (0.0%) | 0 (0.0%) |
| $35,000 to $49,999 | 32 (62.7%) | 0 (0.0%) |
| $50,000 to $74,999 | 0 (0.0%) | 0 (0.0%) |
| $75,000 to $99,999 | 0 (0.0%) | 41 (67.2%) |
| $100,000 to $149,999 | 0 (0.0%) | 0 (0.0%) |
| $150,000 or more | 4 (7.8%) | 0 (0.0%) |
| Total | 51 (100.0%) | 61 (100.0%) |
Property Value to Household Income Ratio in Rouse
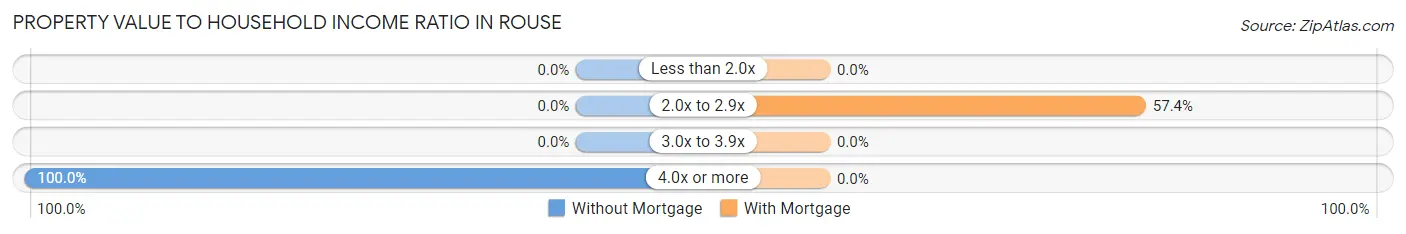
| Value-to-Income Ratio | Without Mortgage | With Mortgage |
| Less than 2.0x | 0 (0.0%) | 0 (0.0%) |
| 2.0x to 2.9x | 0 (0.0%) | 35 (57.4%) |
| 3.0x to 3.9x | 0 (0.0%) | 0 (0.0%) |
| 4.0x or more | 51 (100.0%) | 0 (0.0%) |
| Total | 51 (100.0%) | 61 (100.0%) |
Real Estate Taxes by Mortgage Status in Rouse
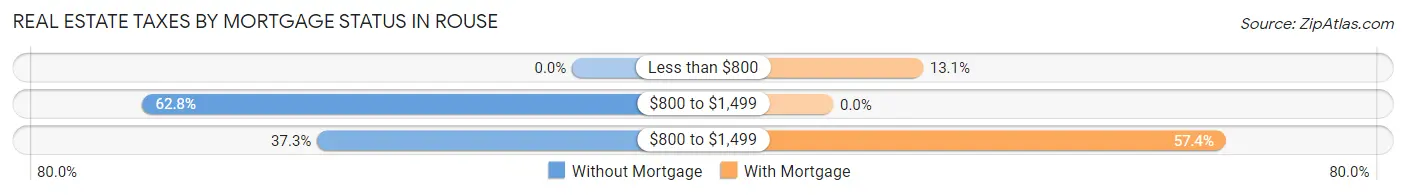
| Property Taxes | Without Mortgage | With Mortgage |
| Less than $800 | 0 (0.0%) | 8 (13.1%) |
| $800 to $1,499 | 32 (62.7%) | 0 (0.0%) |
| $800 to $1,499 | 19 (37.2%) | 35 (57.4%) |
| Total | 51 (100.0%) | 61 (100.0%) |
Health & Disability in Rouse
Health Insurance Coverage by Age in Rouse
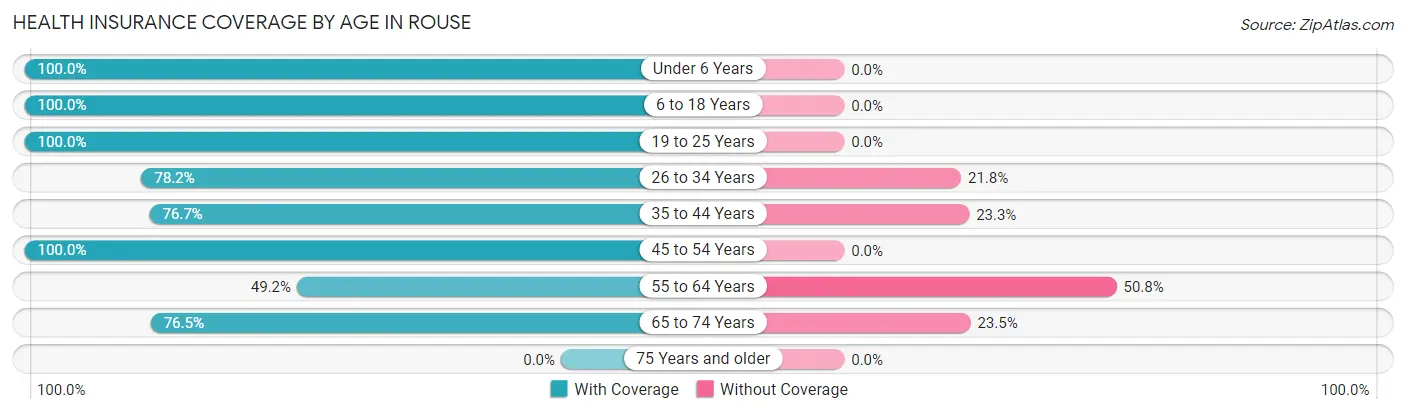
| Age Bracket | With Coverage | Without Coverage |
| Under 6 Years | 142 (100.0%) | 0 (0.0%) |
| 6 to 18 Years | 203 (100.0%) | 0 (0.0%) |
| 19 to 25 Years | 91 (100.0%) | 0 (0.0%) |
| 26 to 34 Years | 176 (78.2%) | 49 (21.8%) |
| 35 to 44 Years | 112 (76.7%) | 34 (23.3%) |
| 45 to 54 Years | 63 (100.0%) | 0 (0.0%) |
| 55 to 64 Years | 32 (49.2%) | 33 (50.8%) |
| 65 to 74 Years | 52 (76.5%) | 16 (23.5%) |
| 75 Years and older | 0 (0.0%) | 0 (0.0%) |
| Total | 871 (86.8%) | 132 (13.2%) |
Health Insurance Coverage by Citizenship Status in Rouse
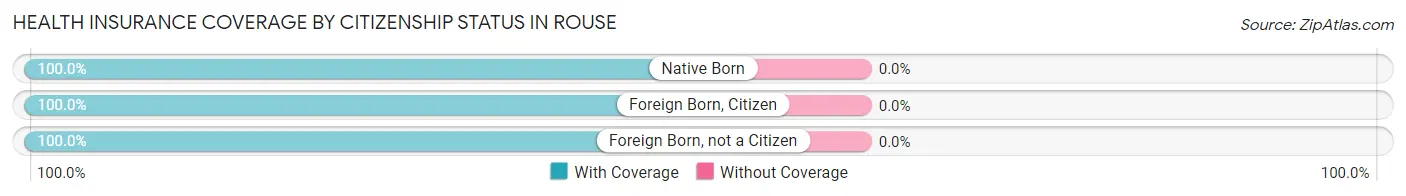
| Citizenship Status | With Coverage | Without Coverage |
| Native Born | 142 (100.0%) | 0 (0.0%) |
| Foreign Born, Citizen | 203 (100.0%) | 0 (0.0%) |
| Foreign Born, not a Citizen | 91 (100.0%) | 0 (0.0%) |
Health Insurance Coverage by Household Income in Rouse
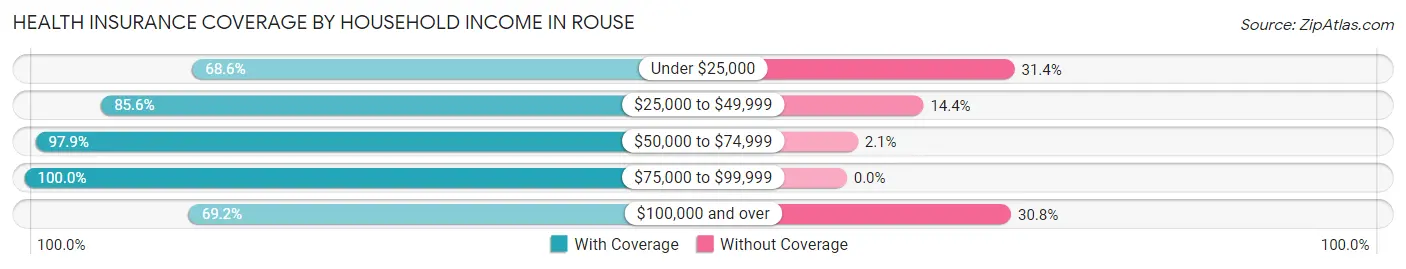
| Household Income | With Coverage | Without Coverage |
| Under $25,000 | 72 (68.6%) | 33 (31.4%) |
| $25,000 to $49,999 | 471 (85.6%) | 79 (14.4%) |
| $50,000 to $74,999 | 190 (97.9%) | 4 (2.1%) |
| $75,000 to $99,999 | 102 (100.0%) | 0 (0.0%) |
| $100,000 and over | 36 (69.2%) | 16 (30.8%) |
Public vs Private Health Insurance Coverage by Age in Rouse
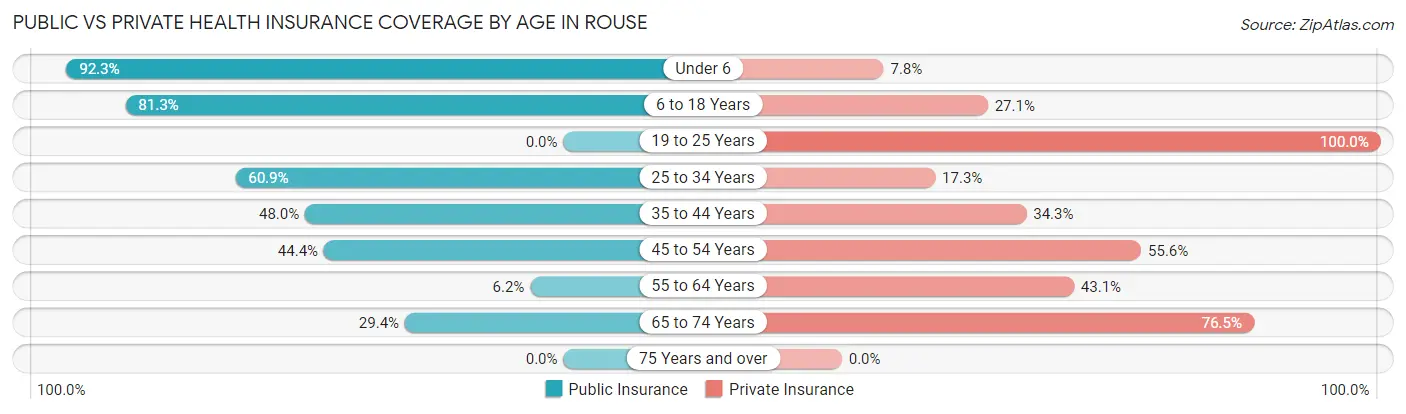
| Age Bracket | Public Insurance | Private Insurance |
| Under 6 | 131 (92.2%) | 11 (7.7%) |
| 6 to 18 Years | 165 (81.3%) | 55 (27.1%) |
| 19 to 25 Years | 0 (0.0%) | 91 (100.0%) |
| 25 to 34 Years | 137 (60.9%) | 39 (17.3%) |
| 35 to 44 Years | 70 (47.9%) | 50 (34.3%) |
| 45 to 54 Years | 28 (44.4%) | 35 (55.6%) |
| 55 to 64 Years | 4 (6.1%) | 28 (43.1%) |
| 65 to 74 Years | 20 (29.4%) | 52 (76.5%) |
| 75 Years and over | 0 (0.0%) | 0 (0.0%) |
| Total | 555 (55.3%) | 361 (36.0%) |
Disability Status by Sex by Age in Rouse
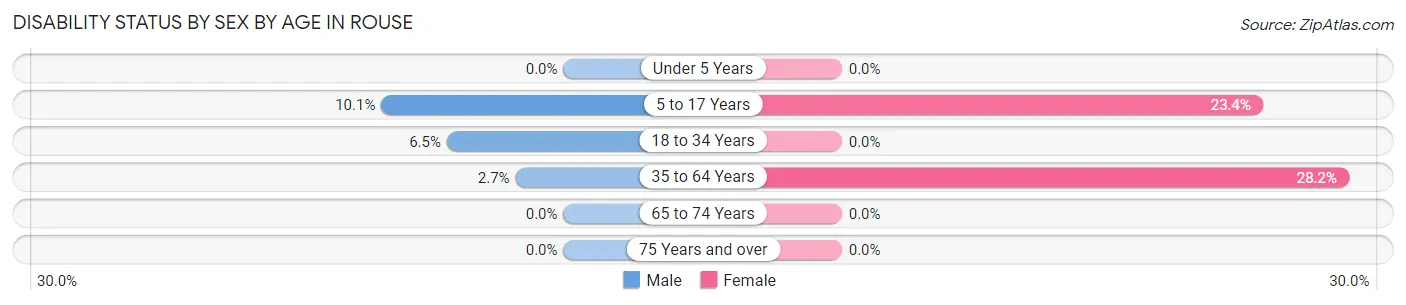
| Age Bracket | Male | Female |
| Under 5 Years | 0 (0.0%) | 0 (0.0%) |
| 5 to 17 Years | 14 (10.1%) | 15 (23.4%) |
| 18 to 34 Years | 12 (6.5%) | 0 (0.0%) |
| 35 to 64 Years | 4 (2.7%) | 35 (28.2%) |
| 65 to 74 Years | 0 (0.0%) | 0 (0.0%) |
| 75 Years and over | 0 (0.0%) | 0 (0.0%) |
Disability Class by Sex by Age in Rouse
Disability Class: Hearing Difficulty
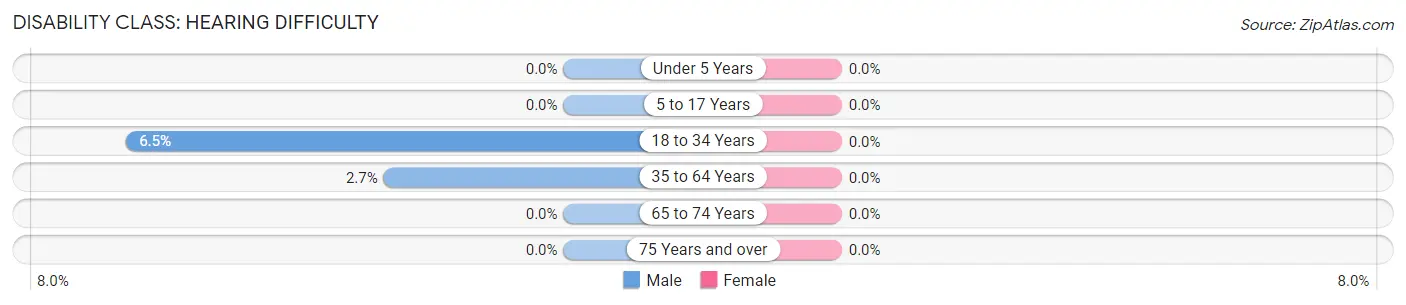
| Age Bracket | Male | Female |
| Under 5 Years | 0 (0.0%) | 0 (0.0%) |
| 5 to 17 Years | 0 (0.0%) | 0 (0.0%) |
| 18 to 34 Years | 12 (6.5%) | 0 (0.0%) |
| 35 to 64 Years | 4 (2.7%) | 0 (0.0%) |
| 65 to 74 Years | 0 (0.0%) | 0 (0.0%) |
| 75 Years and over | 0 (0.0%) | 0 (0.0%) |
Disability Class: Vision Difficulty
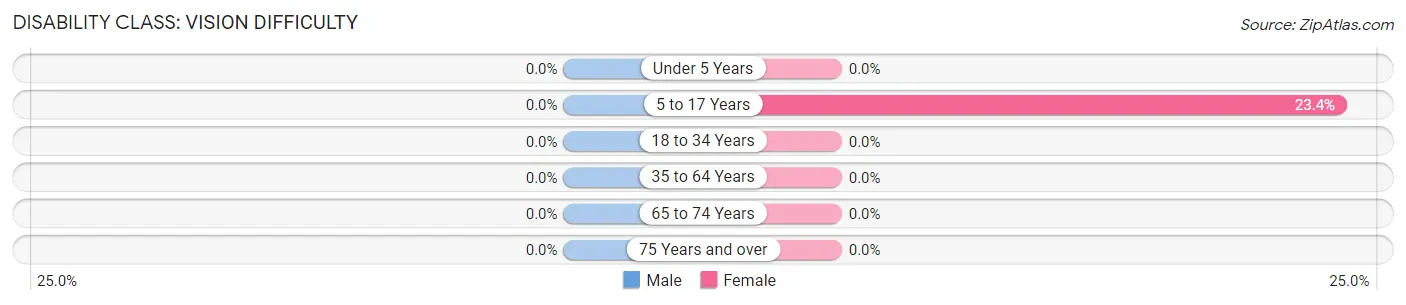
| Age Bracket | Male | Female |
| Under 5 Years | 0 (0.0%) | 0 (0.0%) |
| 5 to 17 Years | 0 (0.0%) | 15 (23.4%) |
| 18 to 34 Years | 0 (0.0%) | 0 (0.0%) |
| 35 to 64 Years | 0 (0.0%) | 0 (0.0%) |
| 65 to 74 Years | 0 (0.0%) | 0 (0.0%) |
| 75 Years and over | 0 (0.0%) | 0 (0.0%) |
Disability Class: Cognitive Difficulty
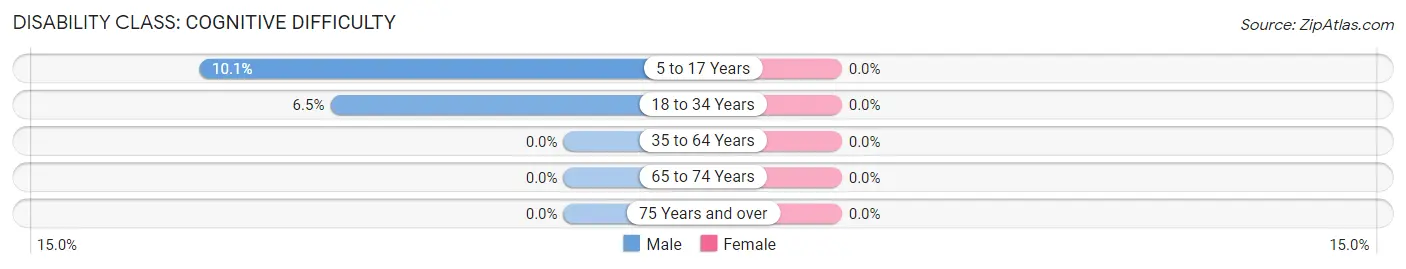
| Age Bracket | Male | Female |
| 5 to 17 Years | 14 (10.1%) | 0 (0.0%) |
| 18 to 34 Years | 12 (6.5%) | 0 (0.0%) |
| 35 to 64 Years | 0 (0.0%) | 0 (0.0%) |
| 65 to 74 Years | 0 (0.0%) | 0 (0.0%) |
| 75 Years and over | 0 (0.0%) | 0 (0.0%) |
Disability Class: Ambulatory Difficulty
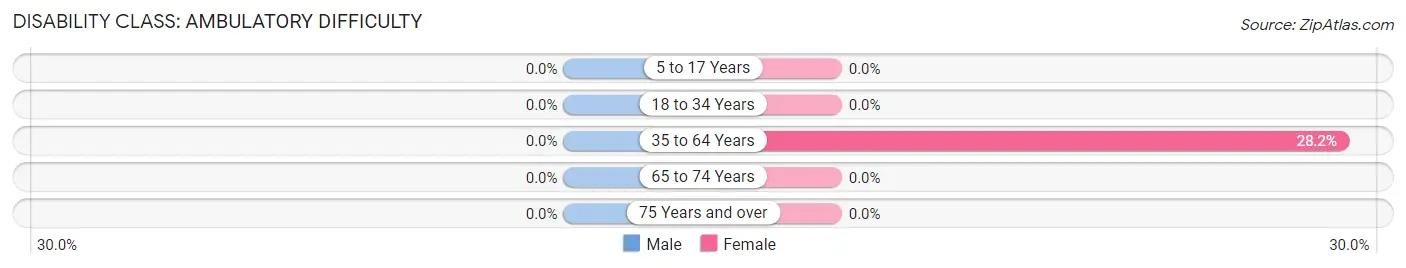
| Age Bracket | Male | Female |
| 5 to 17 Years | 0 (0.0%) | 0 (0.0%) |
| 18 to 34 Years | 0 (0.0%) | 0 (0.0%) |
| 35 to 64 Years | 0 (0.0%) | 35 (28.2%) |
| 65 to 74 Years | 0 (0.0%) | 0 (0.0%) |
| 75 Years and over | 0 (0.0%) | 0 (0.0%) |
Disability Class: Self-Care Difficulty
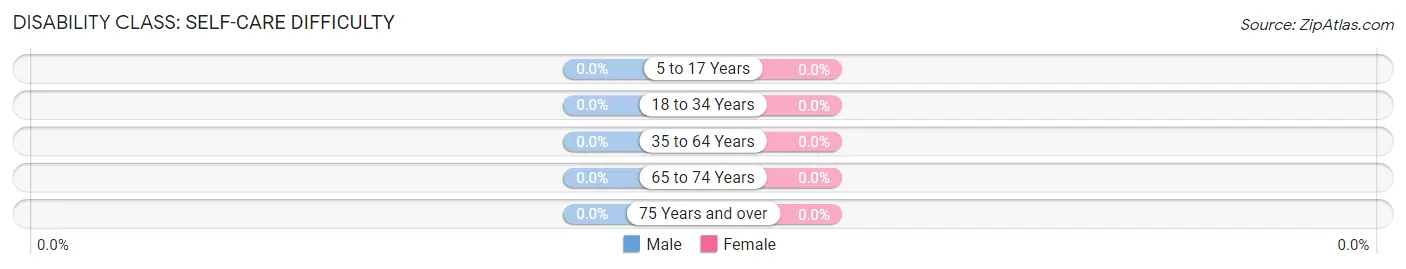
| Age Bracket | Male | Female |
| 5 to 17 Years | 0 (0.0%) | 0 (0.0%) |
| 18 to 34 Years | 0 (0.0%) | 0 (0.0%) |
| 35 to 64 Years | 0 (0.0%) | 0 (0.0%) |
| 65 to 74 Years | 0 (0.0%) | 0 (0.0%) |
| 75 Years and over | 0 (0.0%) | 0 (0.0%) |
Technology Access in Rouse
Computing Device Access in Rouse
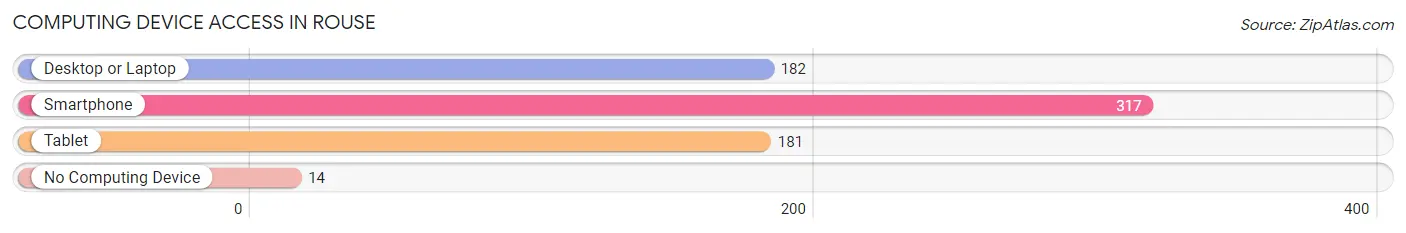
| Device Type | # Households | % Households |
| Desktop or Laptop | 182 | 53.7% |
| Smartphone | 317 | 93.5% |
| Tablet | 181 | 53.4% |
| No Computing Device | 14 | 4.1% |
| Total | 339 | 100.0% |
Internet Access in Rouse
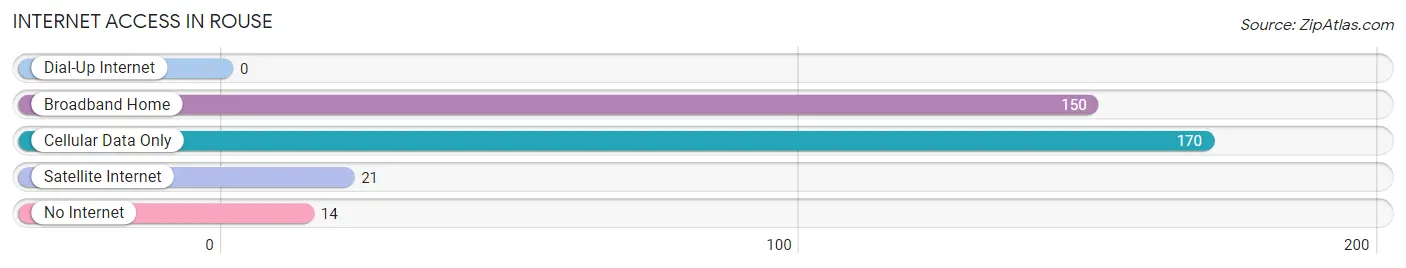
| Internet Type | # Households | % Households |
| Dial-Up Internet | 0 | 0.0% |
| Broadband Home | 150 | 44.3% |
| Cellular Data Only | 170 | 50.1% |
| Satellite Internet | 21 | 6.2% |
| No Internet | 14 | 4.1% |
| Total | 339 | 100.0% |
Rouse Summary
Rouse is a small unincorporated community located in the Sierra Nevada foothills of El Dorado County, California. It is situated in the western part of the county, approximately 25 miles east of Placerville and 40 miles northeast of Sacramento. The community is located in the Sierra Nevada mountain range, at an elevation of 2,400 feet.
History
Rouse was founded in 1849 by a group of miners who were searching for gold in the area. The miners named the settlement after a local Native American chief, Chief Rouse. The town was initially a mining camp, but it soon grew into a small community. The town was home to a post office, a school, a hotel, and several stores.
In the late 1800s, Rouse was a popular destination for tourists who wanted to experience the beauty of the Sierra Nevada mountains. The town was also home to a number of logging operations, which provided employment for many of the residents.
In the early 1900s, the town began to decline as the gold rush ended and the logging industry moved away. By the 1950s, the population had dwindled to just a few hundred people.
Geography
Rouse is located in the western part of El Dorado County, approximately 25 miles east of Placerville and 40 miles northeast of Sacramento. The community is situated in the Sierra Nevada mountain range, at an elevation of 2,400 feet.
The town is surrounded by the Eldorado National Forest, which provides a variety of recreational activities for visitors. The area is also home to a number of lakes, including Union Valley Reservoir, Jenkinson Lake, and Silver Lake.
Economy
Rouse is a small, rural community with a limited economy. The town is home to a few small businesses, including a general store, a gas station, and a restaurant. The town is also home to a number of bed and breakfasts, which provide lodging for visitors.
The town is also home to a number of wineries, which produce a variety of wines. The area is also home to a number of apple orchards, which produce a variety of apples.
Demographics
As of the 2010 census, the population of Rouse was 545. The racial makeup of the town was 95.3% White, 0.7% African American, 0.7% Native American, 0.7% Asian, 0.4% Pacific Islander, and 1.8% from two or more races.
The median household income in Rouse was $45,000, and the median family income was $50,000. The per capita income was $20,000. The town had a poverty rate of 11.3%.
Conclusion
Rouse is a small, rural community located in the Sierra Nevada foothills of El Dorado County, California. The town was founded in 1849 by a group of miners who were searching for gold in the area. The town was initially a mining camp, but it soon grew into a small community. The town is home to a few small businesses, including a general store, a gas station, and a restaurant. The town is also home to a number of wineries, apple orchards, and bed and breakfasts. As of the 2010 census, the population of Rouse was 545. The median household income in Rouse was $45,000, and the median family income was $50,000. The town had a poverty rate of 11.3%.
Common Questions
What is Per Capita Income in Rouse?
Per Capita income in Rouse is $15,960.
What is the Median Family Income in Rouse?
Median Family Income in Rouse is $39,883.
What is the Median Household income in Rouse?
Median Household Income in Rouse is $38,164.
What is Income or Wage Gap in Rouse?
Income or Wage Gap in Rouse is 42.0%.
Women in Rouse earn 58.0 cents for every dollar earned by a man.
What is Inequality or Gini Index in Rouse?
Inequality or Gini Index in Rouse is 0.37.
What is the Total Population of Rouse?
Total Population of Rouse is 1,003.
What is the Total Male Population of Rouse?
Total Male Population of Rouse is 552.
What is the Total Female Population of Rouse?
Total Female Population of Rouse is 451.
What is the Ratio of Males per 100 Females in Rouse?
There are 122.39 Males per 100 Females in Rouse.
What is the Ratio of Females per 100 Males in Rouse?
There are 81.70 Females per 100 Males in Rouse.
What is the Median Population Age in Rouse?
Median Population Age in Rouse is 29.0 Years.
What is the Average Family Size in Rouse
Average Family Size in Rouse is 3.1 People.
What is the Average Household Size in Rouse
Average Household Size in Rouse is 3.0 People.
How Large is the Labor Force in Rouse?
There are 414 People in the Labor Forcein in Rouse.
What is the Percentage of People in the Labor Force in Rouse?
59.6% of People are in the Labor Force in Rouse.
What is the Unemployment Rate in Rouse?
Unemployment Rate in Rouse is 1.4%.