Cities with the Highest Percentage of Population with a Degree in Physical and Health Sciences in Mississippi
RELATED REPORTS & OPTIONS
Physical and Health Sciences
Mississippi
Compare Cities
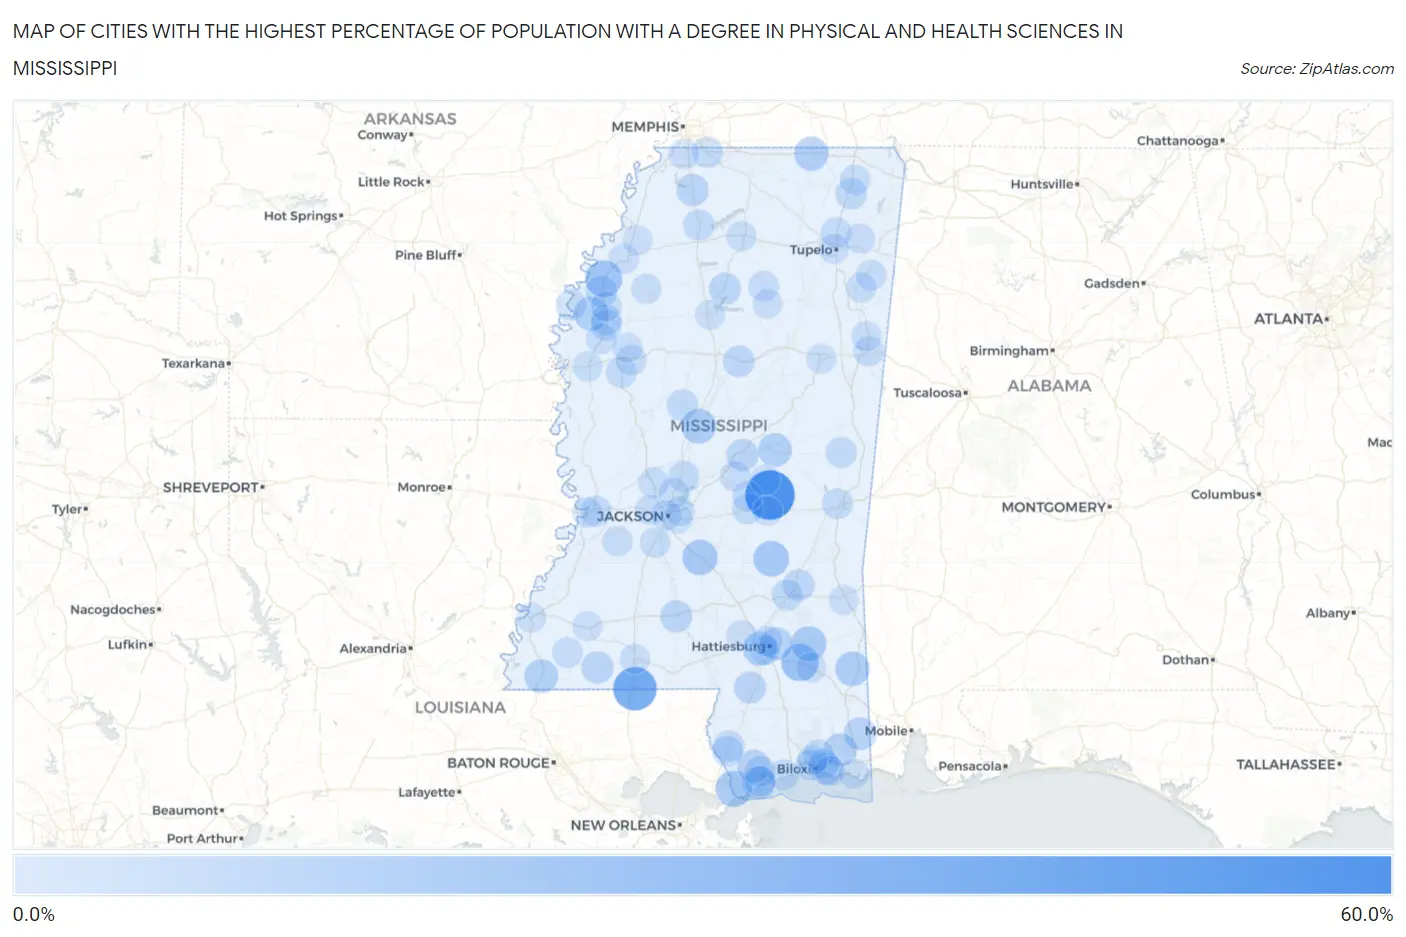
Map of Cities with the Highest Percentage of Population with a Degree in Physical and Health Sciences in Mississippi
0.0%
60.0%
Cities with the Highest Percentage of Population with a Degree in Physical and Health Sciences in Mississippi
| City | % Graduates | vs State | vs National | |
| 1. | Conehatta | 53.8% | 3.0%(+50.9)#1 | 3.1%(+50.7)#67 |
| 2. | Fernwood | 50.0% | 3.0%(+47.0)#2 | 3.1%(+46.9)#92 |
| 3. | Osyka | 37.5% | 3.0%(+34.5)#3 | 3.1%(+34.4)#169 |
| 4. | New Augusta | 21.2% | 3.0%(+18.2)#4 | 3.1%(+18.1)#501 |
| 5. | Duncan | 20.0% | 3.0%(+17.0)#5 | 3.1%(+16.9)#538 |
| 6. | Pearlington | 18.6% | 3.0%(+15.6)#6 | 3.1%(+15.5)#615 |
| 7. | Bay Springs | 16.4% | 3.0%(+13.5)#7 | 3.1%(+13.3)#754 |
| 8. | D Lo | 15.9% | 3.0%(+12.9)#8 | 3.1%(+12.8)#798 |
| 9. | Richton | 15.3% | 3.0%(+12.3)#9 | 3.1%(+12.2)#837 |
| 10. | Goodman | 14.3% | 3.0%(+11.3)#10 | 3.1%(+11.2)#942 |
| 11. | Leakesville | 13.7% | 3.0%(+10.7)#11 | 3.1%(+10.6)#1,021 |
| 12. | West Hattiesburg | 13.2% | 3.0%(+10.2)#12 | 3.1%(+10.1)#1,073 |
| 13. | Pace | 13.0% | 3.0%(+10.1)#13 | 3.1%(+9.94)#1,097 |
| 14. | Walnut | 13.0% | 3.0%(+9.98)#14 | 3.1%(+9.86)#1,107 |
| 15. | Waveland | 12.4% | 3.0%(+9.39)#15 | 3.1%(+9.28)#1,175 |
| 16. | Woodville | 12.2% | 3.0%(+9.23)#16 | 3.1%(+9.11)#1,194 |
| 17. | Pearl River | 11.7% | 3.0%(+8.69)#17 | 3.1%(+8.58)#1,269 |
| 18. | Vancleave | 10.6% | 3.0%(+7.57)#18 | 3.1%(+7.46)#1,456 |
| 19. | Kiln | 10.2% | 3.0%(+7.26)#19 | 3.1%(+7.14)#1,550 |
| 20. | Petal | 10.2% | 3.0%(+7.17)#20 | 3.1%(+7.05)#1,571 |
| 21. | Hurley | 9.7% | 3.0%(+6.72)#21 | 3.1%(+6.61)#1,672 |
| 22. | Liberty | 8.2% | 3.0%(+5.20)#22 | 3.1%(+5.08)#2,159 |
| 23. | Coldwater | 8.2% | 3.0%(+5.18)#23 | 3.1%(+5.06)#2,164 |
| 24. | Monticello | 8.1% | 3.0%(+5.14)#24 | 3.1%(+5.03)#2,178 |
| 25. | Lumberton | 8.0% | 3.0%(+4.99)#25 | 3.1%(+4.88)#2,254 |
| 26. | Carthage | 8.0% | 3.0%(+4.99)#26 | 3.1%(+4.87)#2,255 |
| 27. | Ocean Springs | 7.9% | 3.0%(+4.93)#27 | 3.1%(+4.82)#2,267 |
| 28. | Coffeeville | 7.8% | 3.0%(+4.83)#28 | 3.1%(+4.71)#2,319 |
| 29. | Sandersville | 7.0% | 3.0%(+4.02)#29 | 3.1%(+3.90)#2,788 |
| 30. | Shelby | 6.9% | 3.0%(+3.88)#30 | 3.1%(+3.77)#2,868 |
| 31. | Kilmichael | 6.9% | 3.0%(+3.88)#31 | 3.1%(+3.76)#2,871 |
| 32. | Hide A Way Lake | 6.5% | 3.0%(+3.50)#32 | 3.1%(+3.38)#3,096 |
| 33. | Booneville | 6.4% | 3.0%(+3.38)#33 | 3.1%(+3.26)#3,183 |
| 34. | Lexington | 6.3% | 3.0%(+3.35)#34 | 3.1%(+3.24)#3,198 |
| 35. | Sardis | 5.9% | 3.0%(+2.94)#35 | 3.1%(+2.82)#3,524 |
| 36. | Laurel | 5.9% | 3.0%(+2.89)#36 | 3.1%(+2.78)#3,582 |
| 37. | Biloxi | 5.8% | 3.0%(+2.79)#37 | 3.1%(+2.68)#3,651 |
| 38. | Boyle | 5.6% | 3.0%(+2.65)#38 | 3.1%(+2.53)#3,771 |
| 39. | De Kalb | 5.6% | 3.0%(+2.57)#39 | 3.1%(+2.46)#3,833 |
| 40. | Canton | 5.5% | 3.0%(+2.51)#40 | 3.1%(+2.39)#3,908 |
| 41. | Beechwood | 5.4% | 3.0%(+2.45)#41 | 3.1%(+2.33)#3,970 |
| 42. | Forest | 5.4% | 3.0%(+2.44)#42 | 3.1%(+2.33)#3,973 |
| 43. | Long Beach | 5.4% | 3.0%(+2.37)#43 | 3.1%(+2.26)#4,042 |
| 44. | Latimer | 5.3% | 3.0%(+2.29)#44 | 3.1%(+2.17)#4,130 |
| 45. | Inverness | 5.3% | 3.0%(+2.28)#45 | 3.1%(+2.16)#4,143 |
| 46. | Olive Branch | 5.2% | 3.0%(+2.23)#46 | 3.1%(+2.11)#4,213 |
| 47. | Diamondhead | 5.1% | 3.0%(+2.11)#47 | 3.1%(+1.99)#4,351 |
| 48. | Meridian | 4.9% | 3.0%(+1.96)#48 | 3.1%(+1.85)#4,511 |
| 49. | Cleveland | 4.9% | 3.0%(+1.95)#49 | 3.1%(+1.84)#4,524 |
| 50. | Rosedale | 4.9% | 3.0%(+1.92)#50 | 3.1%(+1.81)#4,570 |
| 51. | Picayune | 4.9% | 3.0%(+1.91)#51 | 3.1%(+1.79)#4,589 |
| 52. | Flora | 4.8% | 3.0%(+1.78)#52 | 3.1%(+1.66)#4,742 |
| 53. | Saltillo | 4.5% | 3.0%(+1.50)#53 | 3.1%(+1.38)#5,180 |
| 54. | Glendale | 4.4% | 3.0%(+1.42)#54 | 3.1%(+1.31)#5,300 |
| 55. | Moorhead | 4.3% | 3.0%(+1.36)#55 | 3.1%(+1.25)#5,387 |
| 56. | Gulf Hills | 4.3% | 3.0%(+1.30)#56 | 3.1%(+1.19)#5,488 |
| 57. | Bruce | 4.3% | 3.0%(+1.28)#57 | 3.1%(+1.17)#5,522 |
| 58. | Smithville | 4.2% | 3.0%(+1.18)#58 | 3.1%(+1.07)#5,679 |
| 59. | Rienzi | 4.2% | 3.0%(+1.18)#59 | 3.1%(+1.07)#5,684 |
| 60. | Crosby | 4.2% | 3.0%(+1.18)#60 | 3.1%(+1.07)#5,689 |
| 61. | Columbus | 4.1% | 3.0%(+1.15)#61 | 3.1%(+1.03)#5,737 |
| 62. | Shaw | 4.0% | 3.0%(+1.06)#62 | 3.1%(+0.947)#5,886 |
| 63. | Utica | 4.0% | 3.0%(+1.02)#63 | 3.1%(+0.900)#5,968 |
| 64. | Hillsboro | 4.0% | 3.0%(+1.02)#64 | 3.1%(+0.900)#5,970 |
| 65. | Merigold | 4.0% | 3.0%(+1.02)#65 | 3.1%(+0.900)#5,975 |
| 66. | Terry | 4.0% | 3.0%(+0.967)#66 | 3.1%(+0.852)#6,075 |
| 67. | Lena | 3.8% | 3.0%(+0.862)#67 | 3.1%(+0.746)#6,298 |
| 68. | Mantachie | 3.8% | 3.0%(+0.826)#68 | 3.1%(+0.710)#6,349 |
| 69. | Horn Lake | 3.8% | 3.0%(+0.825)#69 | 3.1%(+0.709)#6,352 |
| 70. | Gulf Park Estates | 3.8% | 3.0%(+0.804)#70 | 3.1%(+0.688)#6,398 |
| 71. | Clinton | 3.7% | 3.0%(+0.706)#71 | 3.1%(+0.590)#6,605 |
| 72. | Vicksburg | 3.6% | 3.0%(+0.629)#72 | 3.1%(+0.513)#6,760 |
| 73. | Sebastopol | 3.4% | 3.0%(+0.464)#73 | 3.1%(+0.349)#7,163 |
| 74. | Clarksdale | 3.4% | 3.0%(+0.422)#74 | 3.1%(+0.307)#7,253 |
| 75. | Madison | 3.3% | 3.0%(+0.310)#75 | 3.1%(+0.194)#7,537 |
| 76. | Amory | 3.3% | 3.0%(+0.295)#76 | 3.1%(+0.179)#7,570 |
| 77. | Beaumont | 3.2% | 3.0%(+0.242)#77 | 3.1%(+0.126)#7,698 |
| 78. | Sumner | 3.2% | 3.0%(+0.191)#78 | 3.1%(+0.075)#7,832 |
| 79. | Bay St Louis | 3.2% | 3.0%(+0.190)#79 | 3.1%(+0.074)#7,834 |
| 80. | Tupelo | 3.2% | 3.0%(+0.189)#80 | 3.1%(+0.073)#7,836 |
| 81. | Leland | 3.1% | 3.0%(+0.155)#81 | 3.1%(+0.039)#7,916 |
| 82. | Oxford | 3.1% | 3.0%(+0.110)#82 | 3.1%(-0.005)#8,030 |
| 83. | Mccomb | 3.1% | 3.0%(+0.100)#83 | 3.1%(-0.016)#8,058 |
| 84. | Hattiesburg | 3.0% | 3.0%(+0.061)#84 | 3.1%(-0.055)#8,165 |
| 85. | Lake | 3.0% | 3.0%(+0.046)#85 | 3.1%(-0.069)#8,210 |
| 86. | Sumrall | 3.0% | 3.0%(-0.027)#86 | 3.1%(-0.143)#8,421 |
| 87. | Waynesboro | 2.9% | 3.0%(-0.035)#87 | 3.1%(-0.151)#8,442 |
| 88. | Meadville | 2.9% | 3.0%(-0.071)#88 | 3.1%(-0.187)#8,553 |
| 89. | Pearl | 2.9% | 3.0%(-0.108)#89 | 3.1%(-0.224)#8,641 |
| 90. | Natchez | 2.9% | 3.0%(-0.120)#90 | 3.1%(-0.236)#8,675 |
| 91. | Jonestown | 2.9% | 3.0%(-0.127)#91 | 3.1%(-0.243)#8,700 |
| 92. | Grenada | 2.8% | 3.0%(-0.168)#92 | 3.1%(-0.283)#8,834 |
| 93. | Jackson | 2.8% | 3.0%(-0.168)#93 | 3.1%(-0.284)#8,835 |
| 94. | Pascagoula | 2.8% | 3.0%(-0.181)#94 | 3.1%(-0.297)#8,873 |
| 95. | D Iberville | 2.8% | 3.0%(-0.182)#95 | 3.1%(-0.298)#8,880 |
| 96. | Columbus Afb | 2.8% | 3.0%(-0.199)#96 | 3.1%(-0.315)#8,931 |
| 97. | Sunflower | 2.7% | 3.0%(-0.244)#97 | 3.1%(-0.360)#9,074 |
| 98. | Calhoun City | 2.7% | 3.0%(-0.267)#98 | 3.1%(-0.382)#9,147 |
| 99. | Flowood | 2.7% | 3.0%(-0.301)#99 | 3.1%(-0.416)#9,260 |
| 100. | Starkville | 2.7% | 3.0%(-0.333)#100 | 3.1%(-0.449)#9,360 |
Common Questions
What are the Top 10 Cities with the Highest Percentage of Population with a Degree in Physical and Health Sciences in Mississippi?
Top 10 Cities with the Highest Percentage of Population with a Degree in Physical and Health Sciences in Mississippi are:
#1
53.8%
#2
37.5%
#3
21.2%
#4
20.0%
#5
18.6%
#6
16.4%
#7
15.9%
#8
15.3%
#9
14.3%
#10
13.7%
What city has the Highest Percentage of Population with a Degree in Physical and Health Sciences in Mississippi?
Conehatta has the Highest Percentage of Population with a Degree in Physical and Health Sciences in Mississippi with 53.8%.
What is the Percentage of Population with a Degree in Physical and Health Sciences in the State of Mississippi?
Percentage of Population with a Degree in Physical and Health Sciences in Mississippi is 3.0%.
What is the Percentage of Population with a Degree in Physical and Health Sciences in the United States?
Percentage of Population with a Degree in Physical and Health Sciences in the United States is 3.1%.