Cities with the Highest Percentage of Population with a Degree in Physical and Health Sciences in Kentucky
RELATED REPORTS & OPTIONS
Physical and Health Sciences
Kentucky
Compare Cities
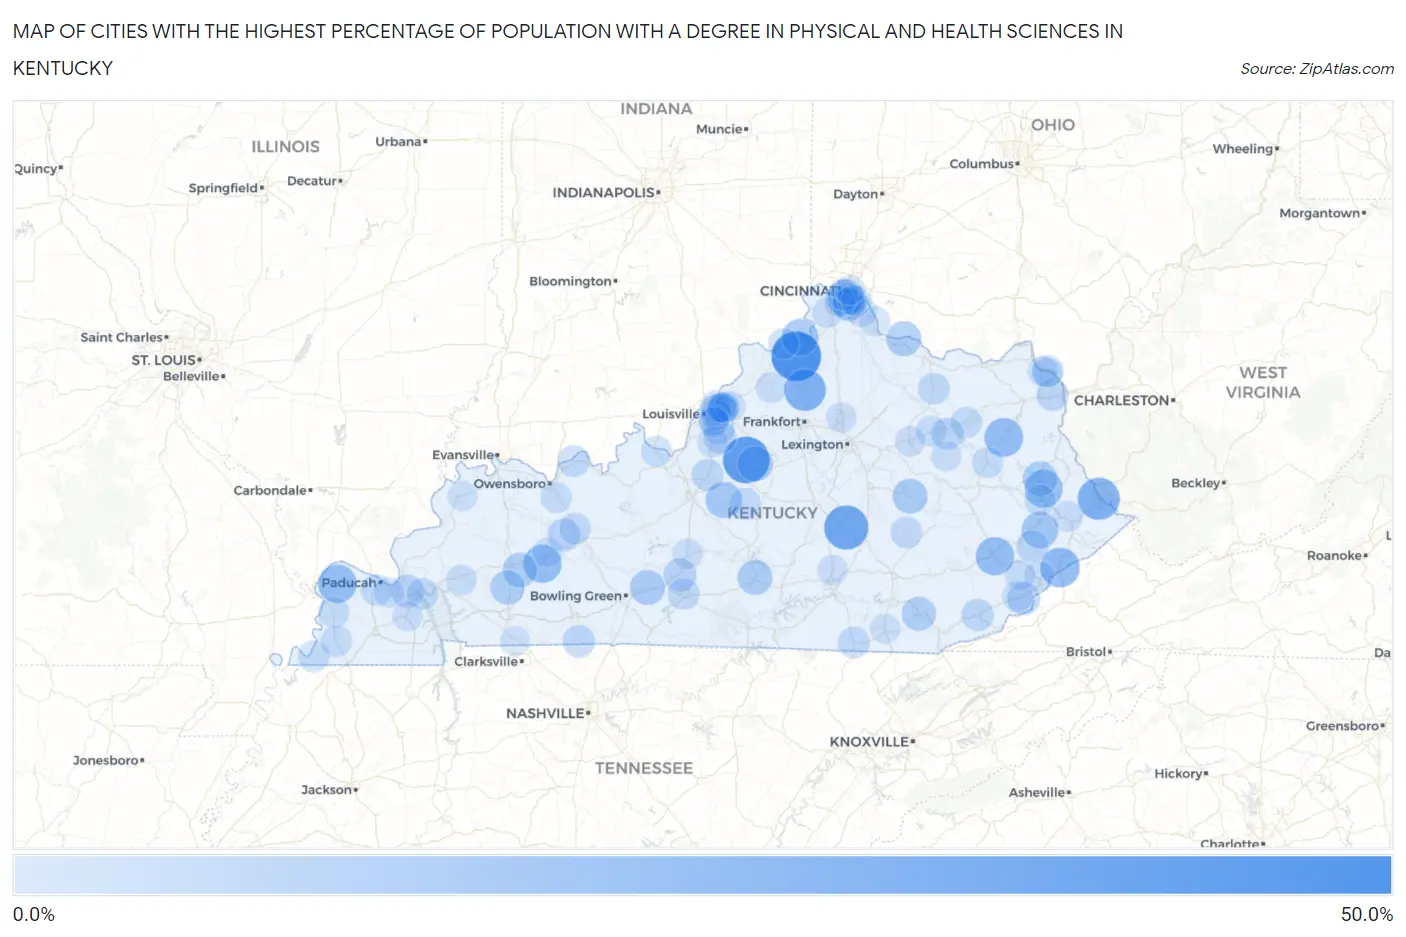
Map of Cities with the Highest Percentage of Population with a Degree in Physical and Health Sciences in Kentucky
0.0%
50.0%
Cities with the Highest Percentage of Population with a Degree in Physical and Health Sciences in Kentucky
| City | % Graduates | vs State | vs National | |
| 1. | Sanders | 50.0% | 3.1%(+46.9)#1 | 3.1%(+46.9)#85 |
| 2. | Fairfield | 42.9% | 3.1%(+39.8)#2 | 3.1%(+39.8)#126 |
| 3. | Crab Orchard | 36.8% | 3.1%(+33.8)#3 | 3.1%(+33.7)#175 |
| 4. | Yelvington | 34.6% | 3.1%(+31.5)#4 | 3.1%(+31.5)#195 |
| 5. | South Williamson | 31.8% | 3.1%(+28.7)#5 | 3.1%(+28.7)#230 |
| 6. | Monterey | 30.8% | 3.1%(+27.7)#6 | 3.1%(+27.7)#244 |
| 7. | Jenkins | 25.9% | 3.1%(+22.8)#7 | 3.1%(+22.8)#345 |
| 8. | Sandy Hook | 23.7% | 3.1%(+20.6)#8 | 3.1%(+20.6)#418 |
| 9. | La Center | 23.4% | 3.1%(+20.3)#9 | 3.1%(+20.3)#428 |
| 10. | Hazard | 23.3% | 3.1%(+20.2)#10 | 3.1%(+20.2)#433 |
| 11. | Greenville | 23.0% | 3.1%(+19.9)#11 | 3.1%(+19.9)#441 |
| 12. | Auxier | 21.9% | 3.1%(+18.8)#12 | 3.1%(+18.8)#476 |
| 13. | Warsaw | 19.3% | 3.1%(+16.2)#13 | 3.1%(+16.2)#580 |
| 14. | Wayland | 18.8% | 3.1%(+15.7)#14 | 3.1%(+15.7)#606 |
| 15. | Kenton Vale | 18.8% | 3.1%(+15.7)#15 | 3.1%(+15.7)#609 |
| 16. | New Haven | 17.8% | 3.1%(+14.7)#16 | 3.1%(+14.7)#653 |
| 17. | Bloomfield | 16.0% | 3.1%(+12.9)#17 | 3.1%(+12.9)#794 |
| 18. | Augusta | 15.1% | 3.1%(+12.0)#18 | 3.1%(+12.0)#863 |
| 19. | Ravenna | 15.0% | 3.1%(+11.9)#19 | 3.1%(+11.9)#868 |
| 20. | Oakland | 15.0% | 3.1%(+11.9)#20 | 3.1%(+11.9)#873 |
| 21. | Columbia | 14.8% | 3.1%(+11.7)#21 | 3.1%(+11.7)#900 |
| 22. | Paintsville | 14.6% | 3.1%(+11.5)#22 | 3.1%(+11.5)#910 |
| 23. | White Plains | 13.8% | 3.1%(+10.8)#23 | 3.1%(+10.7)#1,002 |
| 24. | Crofton | 13.5% | 3.1%(+10.4)#24 | 3.1%(+10.4)#1,037 |
| 25. | Barbourville | 13.3% | 3.1%(+10.2)#25 | 3.1%(+10.2)#1,066 |
| 26. | Fairview | 10.5% | 3.1%(+7.44)#26 | 3.1%(+7.43)#1,474 |
| 27. | Cave City | 10.5% | 3.1%(+7.38)#27 | 3.1%(+7.37)#1,486 |
| 28. | Calvert City | 10.3% | 3.1%(+7.26)#28 | 3.1%(+7.25)#1,507 |
| 29. | Benham | 10.0% | 3.1%(+6.91)#29 | 3.1%(+6.90)#1,595 |
| 30. | Centertown | 10.0% | 3.1%(+6.91)#30 | 3.1%(+6.90)#1,600 |
| 31. | Heritage Creek | 10.0% | 3.1%(+6.86)#31 | 3.1%(+6.85)#1,629 |
| 32. | Taylor Mill | 9.5% | 3.1%(+6.41)#32 | 3.1%(+6.39)#1,732 |
| 33. | Adairville | 9.0% | 3.1%(+5.87)#33 | 3.1%(+5.86)#1,903 |
| 34. | Loyall | 8.8% | 3.1%(+5.74)#34 | 3.1%(+5.72)#1,945 |
| 35. | Cannonsburg | 8.5% | 3.1%(+5.39)#35 | 3.1%(+5.37)#2,060 |
| 36. | Pippa Passes | 8.4% | 3.1%(+5.33)#36 | 3.1%(+5.32)#2,080 |
| 37. | Worthington | 8.2% | 3.1%(+5.08)#37 | 3.1%(+5.06)#2,163 |
| 38. | Salt Lick | 8.2% | 3.1%(+5.08)#38 | 3.1%(+5.06)#2,166 |
| 39. | Lebanon Junction | 8.1% | 3.1%(+5.00)#39 | 3.1%(+4.99)#2,196 |
| 40. | Lewisport | 8.0% | 3.1%(+4.95)#40 | 3.1%(+4.94)#2,215 |
| 41. | Loretto | 7.7% | 3.1%(+4.60)#41 | 3.1%(+4.59)#2,372 |
| 42. | Glasgow | 7.6% | 3.1%(+4.56)#42 | 3.1%(+4.54)#2,405 |
| 43. | Wilder | 7.5% | 3.1%(+4.43)#43 | 3.1%(+4.42)#2,465 |
| 44. | Pine Knot | 7.5% | 3.1%(+4.40)#44 | 3.1%(+4.38)#2,479 |
| 45. | Flemingsburg | 7.4% | 3.1%(+4.36)#45 | 3.1%(+4.35)#2,499 |
| 46. | Hollow Creek | 7.4% | 3.1%(+4.36)#46 | 3.1%(+4.35)#2,501 |
| 47. | Hartford | 7.4% | 3.1%(+4.32)#47 | 3.1%(+4.31)#2,516 |
| 48. | Mckee | 7.3% | 3.1%(+4.23)#48 | 3.1%(+4.22)#2,569 |
| 49. | Hickman | 7.2% | 3.1%(+4.15)#49 | 3.1%(+4.14)#2,631 |
| 50. | Prestonsburg | 7.1% | 3.1%(+3.99)#50 | 3.1%(+3.98)#2,734 |
| 51. | Grand Rivers | 6.9% | 3.1%(+3.84)#51 | 3.1%(+3.83)#2,817 |
| 52. | Hendron | 6.9% | 3.1%(+3.78)#52 | 3.1%(+3.77)#2,862 |
| 53. | Ten Broeck | 6.7% | 3.1%(+3.58)#53 | 3.1%(+3.57)#3,003 |
| 54. | Morehead | 6.6% | 3.1%(+3.52)#54 | 3.1%(+3.51)#3,024 |
| 55. | Bardwell | 6.5% | 3.1%(+3.36)#55 | 3.1%(+3.35)#3,112 |
| 56. | Alexandria | 6.4% | 3.1%(+3.33)#56 | 3.1%(+3.32)#3,145 |
| 57. | Glenview | 6.4% | 3.1%(+3.33)#57 | 3.1%(+3.31)#3,147 |
| 58. | West Liberty | 6.3% | 3.1%(+3.25)#58 | 3.1%(+3.24)#3,197 |
| 59. | Clinton | 6.1% | 3.1%(+3.01)#59 | 3.1%(+3.00)#3,381 |
| 60. | Brandenburg | 6.0% | 3.1%(+2.89)#60 | 3.1%(+2.88)#3,473 |
| 61. | Crestview Hills | 6.0% | 3.1%(+2.87)#61 | 3.1%(+2.85)#3,503 |
| 62. | Masonville | 5.9% | 3.1%(+2.79)#62 | 3.1%(+2.78)#3,553 |
| 63. | Ghent | 5.9% | 3.1%(+2.79)#63 | 3.1%(+2.78)#3,569 |
| 64. | Goose Creek | 5.9% | 3.1%(+2.79)#64 | 3.1%(+2.78)#3,571 |
| 65. | Owingsville | 5.8% | 3.1%(+2.67)#65 | 3.1%(+2.66)#3,671 |
| 66. | Cumberland | 5.7% | 3.1%(+2.63)#66 | 3.1%(+2.61)#3,695 |
| 67. | Park Hills | 5.6% | 3.1%(+2.49)#67 | 3.1%(+2.48)#3,811 |
| 68. | Coal Run Village | 5.6% | 3.1%(+2.47)#68 | 3.1%(+2.46)#3,824 |
| 69. | New Castle | 5.6% | 3.1%(+2.47)#69 | 3.1%(+2.46)#3,831 |
| 70. | Briarwood | 5.4% | 3.1%(+2.35)#70 | 3.1%(+2.34)#3,969 |
| 71. | Glenview Manor | 5.3% | 3.1%(+2.22)#71 | 3.1%(+2.21)#4,093 |
| 72. | Princeton | 5.3% | 3.1%(+2.20)#72 | 3.1%(+2.18)#4,122 |
| 73. | Union | 5.2% | 3.1%(+2.08)#73 | 3.1%(+2.06)#4,260 |
| 74. | Indian Hills | 5.2% | 3.1%(+2.07)#74 | 3.1%(+2.06)#4,266 |
| 75. | Blackey | 5.0% | 3.1%(+1.91)#75 | 3.1%(+1.90)#4,463 |
| 76. | Mount Sterling | 4.9% | 3.1%(+1.77)#76 | 3.1%(+1.76)#4,625 |
| 77. | Munfordville | 4.9% | 3.1%(+1.77)#77 | 3.1%(+1.76)#4,629 |
| 78. | Science Hill | 4.8% | 3.1%(+1.75)#78 | 3.1%(+1.74)#4,658 |
| 79. | Hillview | 4.8% | 3.1%(+1.74)#79 | 3.1%(+1.73)#4,677 |
| 80. | Mentor | 4.8% | 3.1%(+1.67)#80 | 3.1%(+1.66)#4,774 |
| 81. | Worthington Hills | 4.8% | 3.1%(+1.66)#81 | 3.1%(+1.65)#4,789 |
| 82. | Norbourne Estates | 4.7% | 3.1%(+1.64)#82 | 3.1%(+1.63)#4,811 |
| 83. | Broeck Pointe | 4.7% | 3.1%(+1.64)#83 | 3.1%(+1.62)#4,820 |
| 84. | Whitesburg | 4.6% | 3.1%(+1.48)#84 | 3.1%(+1.47)#5,030 |
| 85. | Reidland | 4.6% | 3.1%(+1.48)#85 | 3.1%(+1.47)#5,034 |
| 86. | Benton | 4.5% | 3.1%(+1.45)#86 | 3.1%(+1.43)#5,105 |
| 87. | Georgetown | 4.5% | 3.1%(+1.44)#87 | 3.1%(+1.43)#5,114 |
| 88. | Wellington | 4.4% | 3.1%(+1.35)#88 | 3.1%(+1.34)#5,254 |
| 89. | Crestview | 4.4% | 3.1%(+1.32)#89 | 3.1%(+1.31)#5,291 |
| 90. | West Buechel | 4.3% | 3.1%(+1.24)#90 | 3.1%(+1.23)#5,436 |
| 91. | Frenchburg | 4.3% | 3.1%(+1.17)#91 | 3.1%(+1.16)#5,538 |
| 92. | Wurtland | 4.2% | 3.1%(+1.12)#92 | 3.1%(+1.11)#5,607 |
| 93. | Highland Heights | 4.2% | 3.1%(+1.10)#93 | 3.1%(+1.08)#5,634 |
| 94. | Morganfield | 4.1% | 3.1%(+1.04)#94 | 3.1%(+1.02)#5,755 |
| 95. | Williamsburg | 4.0% | 3.1%(+0.947)#95 | 3.1%(+0.935)#5,906 |
| 96. | Central City | 4.0% | 3.1%(+0.881)#96 | 3.1%(+0.869)#6,044 |
| 97. | Oak Grove | 4.0% | 3.1%(+0.862)#97 | 3.1%(+0.850)#6,078 |
| 98. | Barbourmeade | 3.9% | 3.1%(+0.853)#98 | 3.1%(+0.841)#6,094 |
| 99. | Bellevue | 3.9% | 3.1%(+0.771)#99 | 3.1%(+0.759)#6,257 |
| 100. | Raceland | 3.8% | 3.1%(+0.731)#100 | 3.1%(+0.719)#6,336 |
Common Questions
What are the Top 10 Cities with the Highest Percentage of Population with a Degree in Physical and Health Sciences in Kentucky?
Top 10 Cities with the Highest Percentage of Population with a Degree in Physical and Health Sciences in Kentucky are:
#1
50.0%
#2
42.9%
#3
36.8%
#4
31.8%
#5
30.8%
#6
25.9%
#7
23.7%
#8
23.4%
#9
23.3%
#10
23.0%
What city has the Highest Percentage of Population with a Degree in Physical and Health Sciences in Kentucky?
Sanders has the Highest Percentage of Population with a Degree in Physical and Health Sciences in Kentucky with 50.0%.
What is the Percentage of Population with a Degree in Physical and Health Sciences in the State of Kentucky?
Percentage of Population with a Degree in Physical and Health Sciences in Kentucky is 3.1%.
What is the Percentage of Population with a Degree in Physical and Health Sciences in the United States?
Percentage of Population with a Degree in Physical and Health Sciences in the United States is 3.1%.