Cities with the Highest Percentage of Population with a Degree in Physical and Health Sciences in South Carolina
RELATED REPORTS & OPTIONS
Physical and Health Sciences
South Carolina
Compare Cities
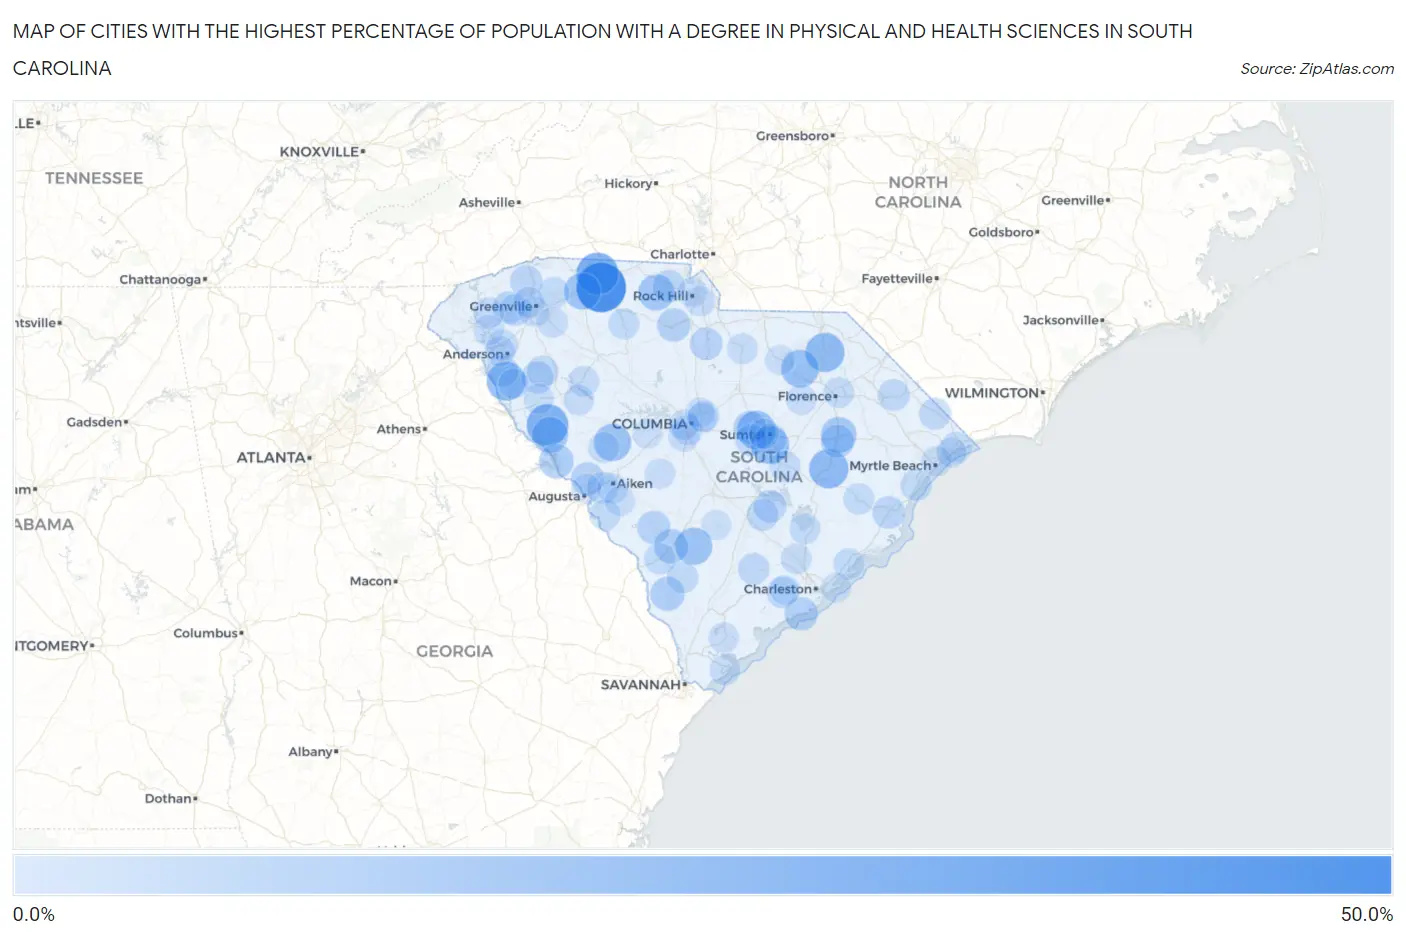
Map of Cities with the Highest Percentage of Population with a Degree in Physical and Health Sciences in South Carolina
0.0%
50.0%
Cities with the Highest Percentage of Population with a Degree in Physical and Health Sciences in South Carolina
| City | % Graduates | vs State | vs National | |
| 1. | Clifton | 50.0% | 2.9%(+47.1)#1 | 3.1%(+46.9)#80 |
| 2. | Mayo | 31.9% | 2.9%(+29.0)#2 | 3.1%(+28.8)#228 |
| 3. | Troy | 30.8% | 2.9%(+27.8)#3 | 3.1%(+27.7)#243 |
| 4. | Seabrook | 27.3% | 2.9%(+24.3)#4 | 3.1%(+24.2)#312 |
| 5. | Kingstree | 24.7% | 2.9%(+21.8)#5 | 3.1%(+21.6)#398 |
| 6. | Society Hill | 24.5% | 2.9%(+21.6)#6 | 3.1%(+21.4)#405 |
| 7. | Iva | 24.4% | 2.9%(+21.4)#7 | 3.1%(+21.3)#408 |
| 8. | Cherryvale | 22.9% | 2.9%(+20.0)#8 | 3.1%(+19.8)#442 |
| 9. | Lakewood | 22.4% | 2.9%(+19.5)#9 | 3.1%(+19.3)#456 |
| 10. | North Hartsville | 21.0% | 2.9%(+18.1)#10 | 3.1%(+17.9)#506 |
| 11. | Ward | 20.0% | 2.9%(+17.1)#11 | 3.1%(+16.9)#542 |
| 12. | Ehrhardt | 19.7% | 2.9%(+16.7)#12 | 3.1%(+16.6)#565 |
| 13. | Arcadia | 19.2% | 2.9%(+16.2)#13 | 3.1%(+16.1)#586 |
| 14. | Mccormick | 17.4% | 2.9%(+14.5)#14 | 3.1%(+14.3)#672 |
| 15. | Sharon | 17.4% | 2.9%(+14.5)#15 | 3.1%(+14.3)#678 |
| 16. | Scranton | 16.7% | 2.9%(+13.7)#16 | 3.1%(+13.6)#716 |
| 17. | Modoc | 13.5% | 2.9%(+10.6)#17 | 3.1%(+10.4)#1,035 |
| 18. | Estill | 13.0% | 2.9%(+10.0)#18 | 3.1%(+9.88)#1,106 |
| 19. | Ulmer | 12.8% | 2.9%(+9.89)#19 | 3.1%(+9.72)#1,126 |
| 20. | Kiawah Island | 11.1% | 2.9%(+8.18)#20 | 3.1%(+8.01)#1,345 |
| 21. | Eureka Mill | 11.0% | 2.9%(+8.04)#21 | 3.1%(+7.88)#1,378 |
| 22. | Stateburg | 10.4% | 2.9%(+7.47)#22 | 3.1%(+7.31)#1,497 |
| 23. | Lake City | 10.4% | 2.9%(+7.47)#23 | 3.1%(+7.31)#1,498 |
| 24. | Barnwell | 10.3% | 2.9%(+7.41)#24 | 3.1%(+7.25)#1,506 |
| 25. | Murphys Estates | 9.9% | 2.9%(+7.01)#25 | 3.1%(+6.84)#1,630 |
| 26. | Debordieu Colony | 9.9% | 2.9%(+6.97)#26 | 3.1%(+6.81)#1,636 |
| 27. | Hilltop | 9.9% | 2.9%(+6.93)#27 | 3.1%(+6.77)#1,641 |
| 28. | Great Falls | 9.3% | 2.9%(+6.35)#28 | 3.1%(+6.19)#1,789 |
| 29. | Eutawville | 9.1% | 2.9%(+6.16)#29 | 3.1%(+5.99)#1,849 |
| 30. | Arial | 9.0% | 2.9%(+6.02)#30 | 3.1%(+5.86)#1,902 |
| 31. | Georgetown | 8.9% | 2.9%(+5.97)#31 | 3.1%(+5.81)#1,917 |
| 32. | York | 8.8% | 2.9%(+5.83)#32 | 3.1%(+5.67)#1,961 |
| 33. | Slater Marietta | 8.3% | 2.9%(+5.37)#33 | 3.1%(+5.21)#2,130 |
| 34. | Due West | 7.8% | 2.9%(+4.84)#34 | 3.1%(+4.68)#2,335 |
| 35. | Fripp Island | 7.7% | 2.9%(+4.74)#35 | 3.1%(+4.58)#2,396 |
| 36. | Wedgefield | 7.6% | 2.9%(+4.63)#36 | 3.1%(+4.46)#2,444 |
| 37. | Easley | 7.5% | 2.9%(+4.54)#37 | 3.1%(+4.37)#2,486 |
| 38. | Holly Hill | 7.4% | 2.9%(+4.47)#38 | 3.1%(+4.31)#2,517 |
| 39. | Mullins | 7.3% | 2.9%(+4.33)#39 | 3.1%(+4.17)#2,607 |
| 40. | Loris | 7.3% | 2.9%(+4.32)#40 | 3.1%(+4.15)#2,615 |
| 41. | Starr | 6.9% | 2.9%(+3.96)#41 | 3.1%(+3.80)#2,847 |
| 42. | Cottageville | 6.9% | 2.9%(+3.93)#42 | 3.1%(+3.76)#2,870 |
| 43. | Hollywood | 6.8% | 2.9%(+3.91)#43 | 3.1%(+3.75)#2,887 |
| 44. | Gloverville | 6.7% | 2.9%(+3.78)#44 | 3.1%(+3.62)#2,953 |
| 45. | Donalds | 6.7% | 2.9%(+3.73)#45 | 3.1%(+3.57)#2,992 |
| 46. | Allendale | 6.6% | 2.9%(+3.66)#46 | 3.1%(+3.50)#3,027 |
| 47. | Hampton | 6.4% | 2.9%(+3.44)#47 | 3.1%(+3.27)#3,177 |
| 48. | Murrells Inlet | 6.2% | 2.9%(+3.29)#48 | 3.1%(+3.12)#3,294 |
| 49. | The Cliffs Valley | 6.1% | 2.9%(+3.15)#49 | 3.1%(+2.99)#3,385 |
| 50. | Greer | 5.8% | 2.9%(+2.89)#50 | 3.1%(+2.73)#3,609 |
| 51. | Awendaw | 5.8% | 2.9%(+2.87)#51 | 3.1%(+2.70)#3,632 |
| 52. | Union | 5.8% | 2.9%(+2.84)#52 | 3.1%(+2.67)#3,653 |
| 53. | Carolina Forest | 5.7% | 2.9%(+2.75)#53 | 3.1%(+2.58)#3,729 |
| 54. | Andrews | 5.7% | 2.9%(+2.74)#54 | 3.1%(+2.58)#3,732 |
| 55. | Woodfield | 5.7% | 2.9%(+2.72)#55 | 3.1%(+2.55)#3,752 |
| 56. | Berea | 5.6% | 2.9%(+2.64)#56 | 3.1%(+2.47)#3,818 |
| 57. | Manning | 5.5% | 2.9%(+2.56)#57 | 3.1%(+2.39)#3,900 |
| 58. | North Myrtle Beach | 5.5% | 2.9%(+2.54)#58 | 3.1%(+2.37)#3,925 |
| 59. | Northlake | 5.4% | 2.9%(+2.48)#59 | 3.1%(+2.31)#3,983 |
| 60. | Pinopolis | 5.4% | 2.9%(+2.44)#60 | 3.1%(+2.28)#4,023 |
| 61. | Quinby | 5.4% | 2.9%(+2.42)#61 | 3.1%(+2.26)#4,045 |
| 62. | Jackson | 5.3% | 2.9%(+2.39)#62 | 3.1%(+2.23)#4,078 |
| 63. | Cross Hill | 5.3% | 2.9%(+2.33)#63 | 3.1%(+2.16)#4,149 |
| 64. | Johnston | 5.2% | 2.9%(+2.27)#64 | 3.1%(+2.11)#4,214 |
| 65. | Pine Ridge | 5.1% | 2.9%(+2.19)#65 | 3.1%(+2.03)#4,302 |
| 66. | Ladson | 5.1% | 2.9%(+2.14)#66 | 3.1%(+1.97)#4,374 |
| 67. | Kershaw | 4.9% | 2.9%(+2.01)#67 | 3.1%(+1.85)#4,509 |
| 68. | Dunean | 4.9% | 2.9%(+2.00)#68 | 3.1%(+1.83)#4,529 |
| 69. | South Sumter | 4.8% | 2.9%(+1.91)#69 | 3.1%(+1.75)#4,650 |
| 70. | Six Mile | 4.7% | 2.9%(+1.76)#70 | 3.1%(+1.60)#4,853 |
| 71. | Chickasaw Point | 4.6% | 2.9%(+1.65)#71 | 3.1%(+1.49)#5,008 |
| 72. | Simpsonville | 4.6% | 2.9%(+1.62)#72 | 3.1%(+1.45)#5,048 |
| 73. | Ninety Six | 4.5% | 2.9%(+1.61)#73 | 3.1%(+1.45)#5,067 |
| 74. | Hilton Head Island | 4.5% | 2.9%(+1.60)#74 | 3.1%(+1.43)#5,109 |
| 75. | Cayce | 4.4% | 2.9%(+1.47)#75 | 3.1%(+1.31)#5,297 |
| 76. | Clemson | 4.3% | 2.9%(+1.38)#76 | 3.1%(+1.21)#5,456 |
| 77. | West Columbia | 4.2% | 2.9%(+1.24)#77 | 3.1%(+1.07)#5,655 |
| 78. | Burton | 4.1% | 2.9%(+1.20)#78 | 3.1%(+1.04)#5,729 |
| 79. | Lesslie | 4.1% | 2.9%(+1.13)#79 | 3.1%(+0.963)#5,854 |
| 80. | Centerville | 4.1% | 2.9%(+1.13)#80 | 3.1%(+0.962)#5,855 |
| 81. | Aiken | 4.1% | 2.9%(+1.12)#81 | 3.1%(+0.959)#5,859 |
| 82. | Myrtle Beach | 4.0% | 2.9%(+1.08)#82 | 3.1%(+0.915)#5,940 |
| 83. | Sumter | 4.0% | 2.9%(+1.07)#83 | 3.1%(+0.904)#5,953 |
| 84. | Perry | 4.0% | 2.9%(+1.07)#84 | 3.1%(+0.900)#5,983 |
| 85. | Briarcliffe Acres | 3.9% | 2.9%(+1.01)#85 | 3.1%(+0.848)#6,088 |
| 86. | Abbeville | 3.9% | 2.9%(+0.936)#86 | 3.1%(+0.771)#6,231 |
| 87. | Lamar | 3.8% | 2.9%(+0.857)#87 | 3.1%(+0.692)#6,392 |
| 88. | Lake Secession | 3.8% | 2.9%(+0.839)#88 | 3.1%(+0.674)#6,432 |
| 89. | Baxter | 3.7% | 2.9%(+0.774)#89 | 3.1%(+0.609)#6,550 |
| 90. | New Ellenton | 3.7% | 2.9%(+0.769)#90 | 3.1%(+0.604)#6,560 |
| 91. | North Augusta | 3.6% | 2.9%(+0.665)#91 | 3.1%(+0.500)#6,791 |
| 92. | Mcbee | 3.6% | 2.9%(+0.662)#92 | 3.1%(+0.497)#6,797 |
| 93. | Isle Of Palms | 3.5% | 2.9%(+0.582)#93 | 3.1%(+0.417)#6,989 |
| 94. | Summit | 3.5% | 2.9%(+0.574)#94 | 3.1%(+0.409)#7,007 |
| 95. | Rock Hill | 3.4% | 2.9%(+0.512)#95 | 3.1%(+0.348)#7,166 |
| 96. | Dentsville | 3.4% | 2.9%(+0.434)#96 | 3.1%(+0.269)#7,350 |
| 97. | Ravenel | 3.4% | 2.9%(+0.423)#97 | 3.1%(+0.258)#7,373 |
| 98. | Columbia | 3.3% | 2.9%(+0.412)#98 | 3.1%(+0.247)#7,398 |
| 99. | Branchville | 3.3% | 2.9%(+0.398)#99 | 3.1%(+0.234)#7,433 |
| 100. | Ben Avon | 3.3% | 2.9%(+0.386)#100 | 3.1%(+0.221)#7,473 |
Common Questions
What are the Top 10 Cities with the Highest Percentage of Population with a Degree in Physical and Health Sciences in South Carolina?
Top 10 Cities with the Highest Percentage of Population with a Degree in Physical and Health Sciences in South Carolina are:
#1
50.0%
#2
31.9%
#3
30.8%
#4
24.7%
#5
24.5%
#6
24.4%
#7
22.9%
#8
22.4%
#9
21.0%
#10
20.0%
What city has the Highest Percentage of Population with a Degree in Physical and Health Sciences in South Carolina?
Clifton has the Highest Percentage of Population with a Degree in Physical and Health Sciences in South Carolina with 50.0%.
What is the Percentage of Population with a Degree in Physical and Health Sciences in the State of South Carolina?
Percentage of Population with a Degree in Physical and Health Sciences in South Carolina is 2.9%.
What is the Percentage of Population with a Degree in Physical and Health Sciences in the United States?
Percentage of Population with a Degree in Physical and Health Sciences in the United States is 3.1%.