Maywood, CA Map & Demographics
Maywood Map
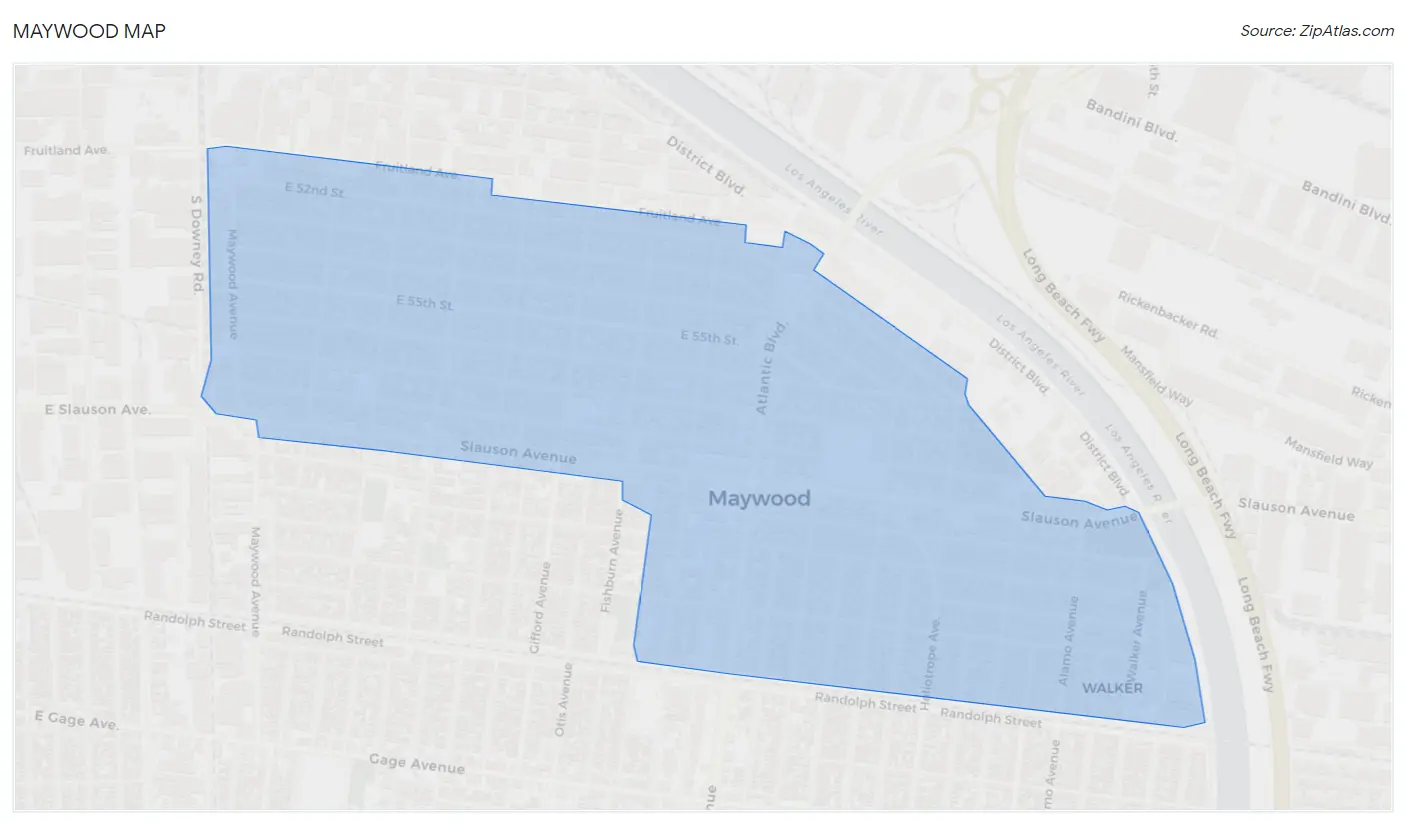
Maywood Overview
$19,236
PER CAPITA INCOME
$59,691
AVG FAMILY INCOME
$57,615
AVG HOUSEHOLD INCOME
24.1%
WAGE / INCOME GAP [ % ]
75.9¢/ $1
WAGE / INCOME GAP [ $ ]
$10,900
FAMILY INCOME DEFICIT
0.42
INEQUALITY / GINI INDEX
25,009
TOTAL POPULATION
12,952
MALE POPULATION
12,057
FEMALE POPULATION
107.42
MALES / 100 FEMALES
93.09
FEMALES / 100 MALES
31.8
MEDIAN AGE
4.2
AVG FAMILY SIZE
3.9
AVG HOUSEHOLD SIZE
12,212
LABOR FORCE [ PEOPLE ]
65.0%
PERCENT IN LABOR FORCE
5.6%
UNEMPLOYMENT RATE
Maywood Zip Codes
Maywood Area Codes
Income in Maywood
Income Overview in Maywood
Per Capita Income in Maywood is $19,236, while median incomes of families and households are $59,691 and $57,615 respectively.
| Characteristic | Number | Measure |
| Per Capita Income | 25,009 | $19,236 |
| Median Family Income | 5,280 | $59,691 |
| Mean Family Income | 5,280 | $73,360 |
| Median Household Income | 6,358 | $57,615 |
| Mean Household Income | 6,358 | $71,546 |
| Income Deficit | 5,280 | $10,900 |
| Wage / Income Gap (%) | 25,009 | 24.09% |
| Wage / Income Gap ($) | 25,009 | 75.91¢ per $1 |
| Gini / Inequality Index | 25,009 | 0.42 |
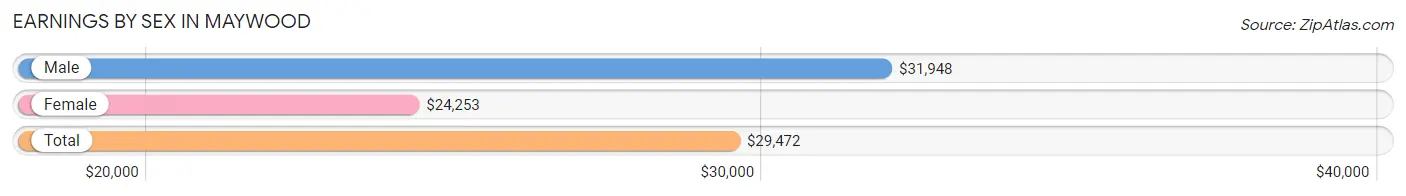
Earnings by Sex in Maywood
Average Earnings in Maywood are $29,472, $31,948 for men and $24,253 for women, a difference of 24.1%.
| Sex | Number | Average Earnings |
| Male | 7,337 (59.9%) | $31,948 |
| Female | 4,908 (40.1%) | $24,253 |
| Total | 12,245 (100.0%) | $29,472 |
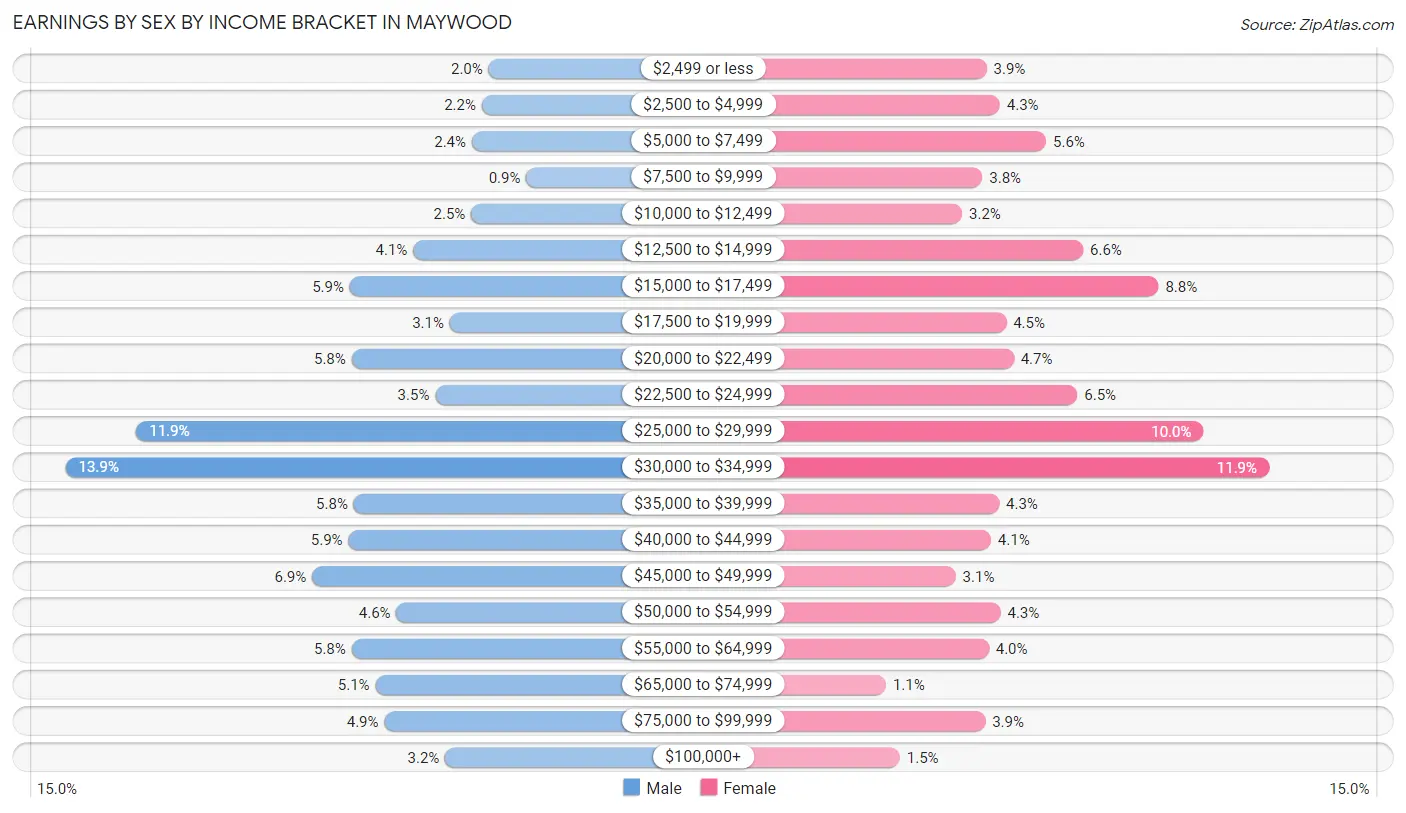
Earnings by Sex by Income Bracket in Maywood
The most common earnings brackets in Maywood are $30,000 to $34,999 for men (1,016 | 13.9%) and $30,000 to $34,999 for women (582 | 11.9%).
| Income | Male | Female |
| $2,499 or less | 144 (2.0%) | 193 (3.9%) |
| $2,500 to $4,999 | 158 (2.1%) | 211 (4.3%) |
| $5,000 to $7,499 | 178 (2.4%) | 275 (5.6%) |
| $7,500 to $9,999 | 66 (0.9%) | 187 (3.8%) |
| $10,000 to $12,499 | 180 (2.5%) | 159 (3.2%) |
| $12,500 to $14,999 | 299 (4.1%) | 326 (6.6%) |
| $15,000 to $17,499 | 430 (5.9%) | 430 (8.8%) |
| $17,500 to $19,999 | 224 (3.0%) | 220 (4.5%) |
| $20,000 to $22,499 | 426 (5.8%) | 230 (4.7%) |
| $22,500 to $24,999 | 254 (3.5%) | 318 (6.5%) |
| $25,000 to $29,999 | 870 (11.9%) | 492 (10.0%) |
| $30,000 to $34,999 | 1,016 (13.9%) | 582 (11.9%) |
| $35,000 to $39,999 | 422 (5.8%) | 210 (4.3%) |
| $40,000 to $44,999 | 433 (5.9%) | 199 (4.1%) |
| $45,000 to $49,999 | 508 (6.9%) | 150 (3.1%) |
| $50,000 to $54,999 | 334 (4.5%) | 212 (4.3%) |
| $55,000 to $64,999 | 426 (5.8%) | 196 (4.0%) |
| $65,000 to $74,999 | 377 (5.1%) | 54 (1.1%) |
| $75,000 to $99,999 | 359 (4.9%) | 191 (3.9%) |
| $100,000+ | 233 (3.2%) | 73 (1.5%) |
| Total | 7,337 (100.0%) | 4,908 (100.0%) |
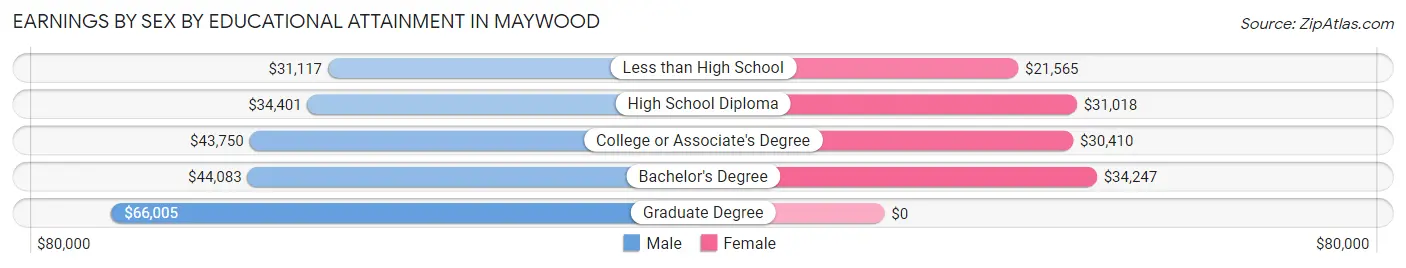
Earnings by Sex by Educational Attainment in Maywood
Average earnings in Maywood are $33,875 for men and $27,096 for women, a difference of 20.0%. Men with an educational attainment of graduate degree enjoy the highest average annual earnings of $66,005, while those with less than high school education earn the least with $31,117. Women with an educational attainment of bachelor's degree earn the most with the average annual earnings of $34,247, while those with less than high school education have the smallest earnings of $21,565.
| Educational Attainment | Male Income | Female Income |
| Less than High School | $31,117 | $21,565 |
| High School Diploma | $34,401 | $31,018 |
| College or Associate's Degree | $43,750 | $30,410 |
| Bachelor's Degree | $44,083 | $34,247 |
| Graduate Degree | $66,005 | $0 |
| Total | $33,875 | $27,096 |
Family Income in Maywood
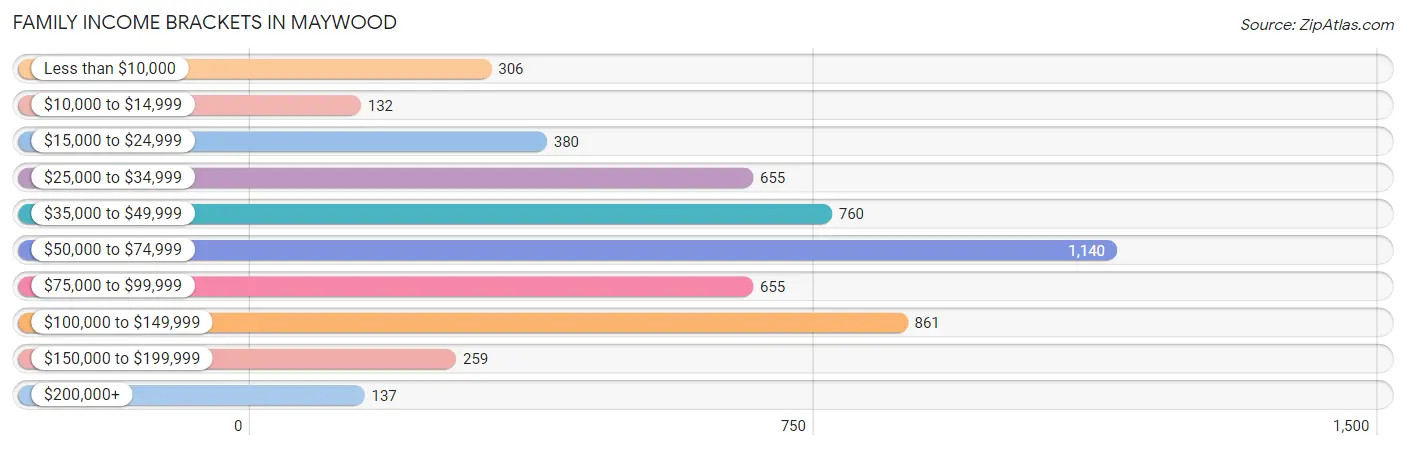
Family Income Brackets in Maywood
According to the Maywood family income data, there are 1,140 families falling into the $50,000 to $74,999 income range, which is the most common income bracket and makes up 21.6% of all families. Conversely, the $10,000 to $14,999 income bracket is the least frequent group with only 132 families (2.5%) belonging to this category.
| Income Bracket | # Families | % Families |
| Less than $10,000 | 306 | 5.8% |
| $10,000 to $14,999 | 132 | 2.5% |
| $15,000 to $24,999 | 380 | 7.2% |
| $25,000 to $34,999 | 655 | 12.4% |
| $35,000 to $49,999 | 760 | 14.4% |
| $50,000 to $74,999 | 1,140 | 21.6% |
| $75,000 to $99,999 | 655 | 12.4% |
| $100,000 to $149,999 | 861 | 16.3% |
| $150,000 to $199,999 | 259 | 4.9% |
| $200,000+ | 137 | 2.6% |
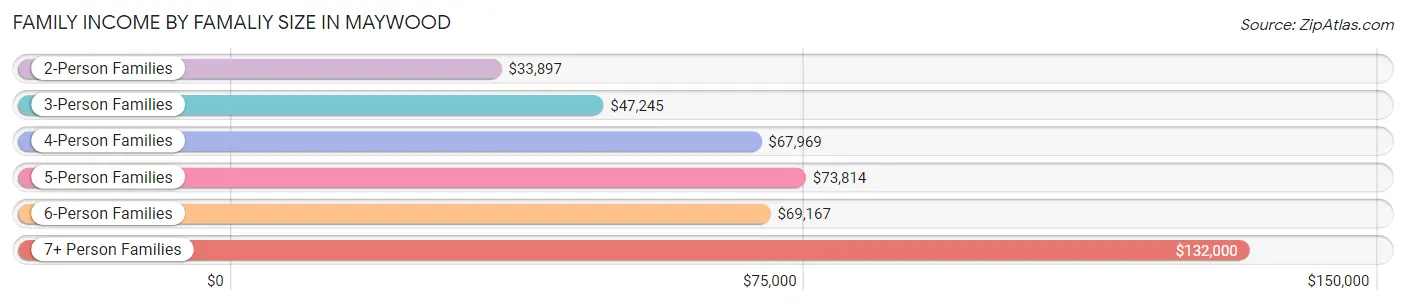
Family Income by Famaliy Size in Maywood
7+ person families (180 | 3.4%) account for the highest median family income in Maywood with $132,000 per family, while 7+ person families (180 | 3.4%) have the highest median income of $18,857 per family member.
| Income Bracket | # Families | Median Income |
| 2-Person Families | 757 (14.3%) | $33,897 |
| 3-Person Families | 1,250 (23.7%) | $47,245 |
| 4-Person Families | 1,423 (27.0%) | $67,969 |
| 5-Person Families | 1,056 (20.0%) | $73,814 |
| 6-Person Families | 614 (11.6%) | $69,167 |
| 7+ Person Families | 180 (3.4%) | $132,000 |
| Total | 5,280 (100.0%) | $59,691 |
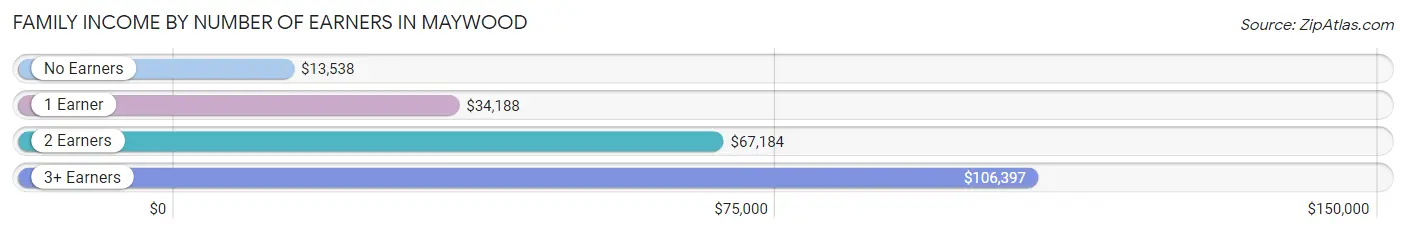
Family Income by Number of Earners in Maywood
The median family income in Maywood is $59,691, with families comprising 3+ earners (1,185) having the highest median family income of $106,397, while families with no earners (356) have the lowest median family income of $13,538, accounting for 22.4% and 6.7% of families, respectively.
| Number of Earners | # Families | Median Income |
| No Earners | 356 (6.7%) | $13,538 |
| 1 Earner | 1,718 (32.5%) | $34,188 |
| 2 Earners | 2,021 (38.3%) | $67,184 |
| 3+ Earners | 1,185 (22.4%) | $106,397 |
| Total | 5,280 (100.0%) | $59,691 |
Household Income in Maywood
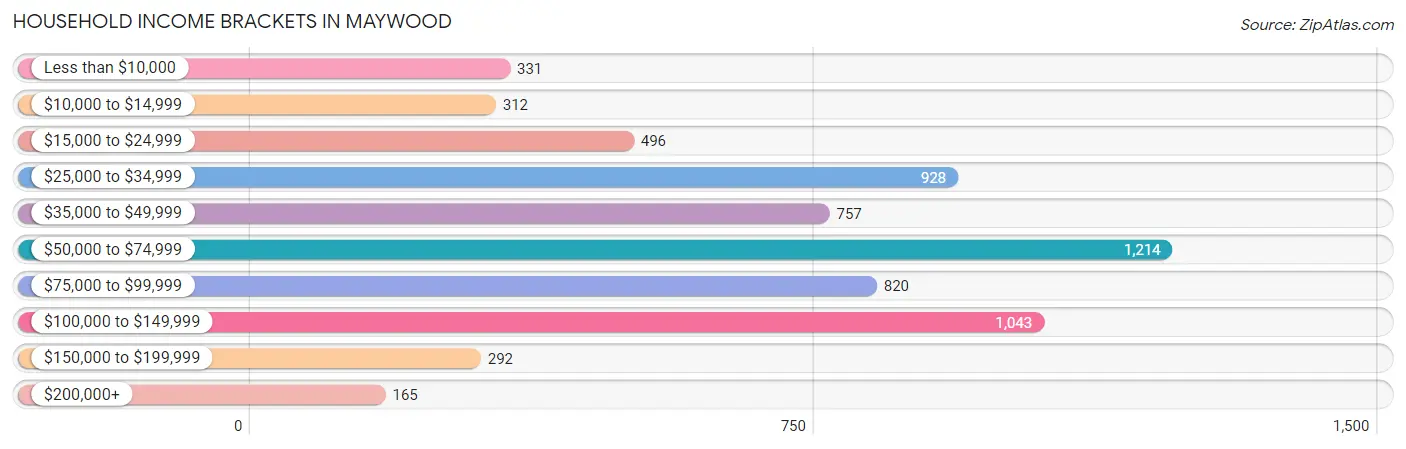
Household Income Brackets in Maywood
With 1,214 households falling in the category, the $50,000 to $74,999 income range is the most frequent in Maywood, accounting for 19.1% of all households. In contrast, only 165 households (2.6%) fall into the $200,000+ income bracket, making it the least populous group.
| Income Bracket | # Households | % Households |
| Less than $10,000 | 331 | 5.2% |
| $10,000 to $14,999 | 312 | 4.9% |
| $15,000 to $24,999 | 496 | 7.8% |
| $25,000 to $34,999 | 928 | 14.6% |
| $35,000 to $49,999 | 757 | 11.9% |
| $50,000 to $74,999 | 1,214 | 19.1% |
| $75,000 to $99,999 | 820 | 12.9% |
| $100,000 to $149,999 | 1,043 | 16.4% |
| $150,000 to $199,999 | 292 | 4.6% |
| $200,000+ | 165 | 2.6% |
Household Income by Householder Age in Maywood
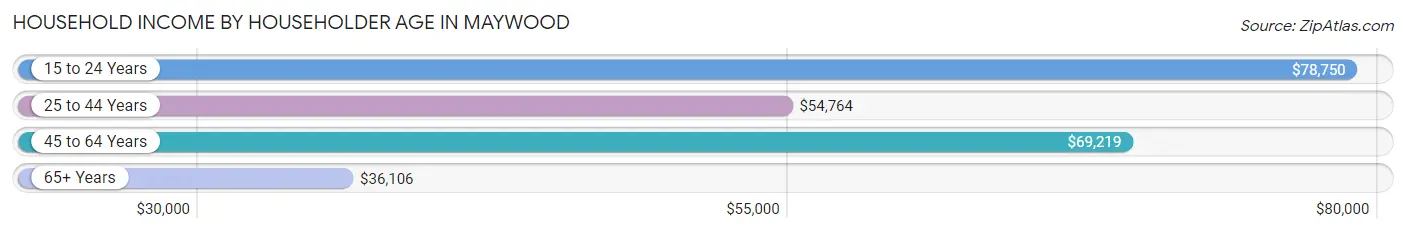
The median household income in Maywood is $57,615, with the highest median household income of $78,750 found in the 15 to 24 years age bracket for the primary householder. A total of 106 households (1.7%) fall into this category. Meanwhile, the 65+ years age bracket for the primary householder has the lowest median household income of $36,106, with 1,301 households (20.5%) in this group.
| Income Bracket | # Households | Median Income |
| 15 to 24 Years | 106 (1.7%) | $78,750 |
| 25 to 44 Years | 2,519 (39.6%) | $54,764 |
| 45 to 64 Years | 2,432 (38.3%) | $69,219 |
| 65+ Years | 1,301 (20.5%) | $36,106 |
| Total | 6,358 (100.0%) | $57,615 |
Poverty in Maywood
Income Below Poverty by Sex and Age in Maywood
With 18.1% poverty level for males and 22.7% for females among the residents of Maywood, 6 to 11 year old males and 15 year old females are the most vulnerable to poverty, with 483 males (37.0%) and 71 females (45.8%) in their respective age groups living below the poverty level.
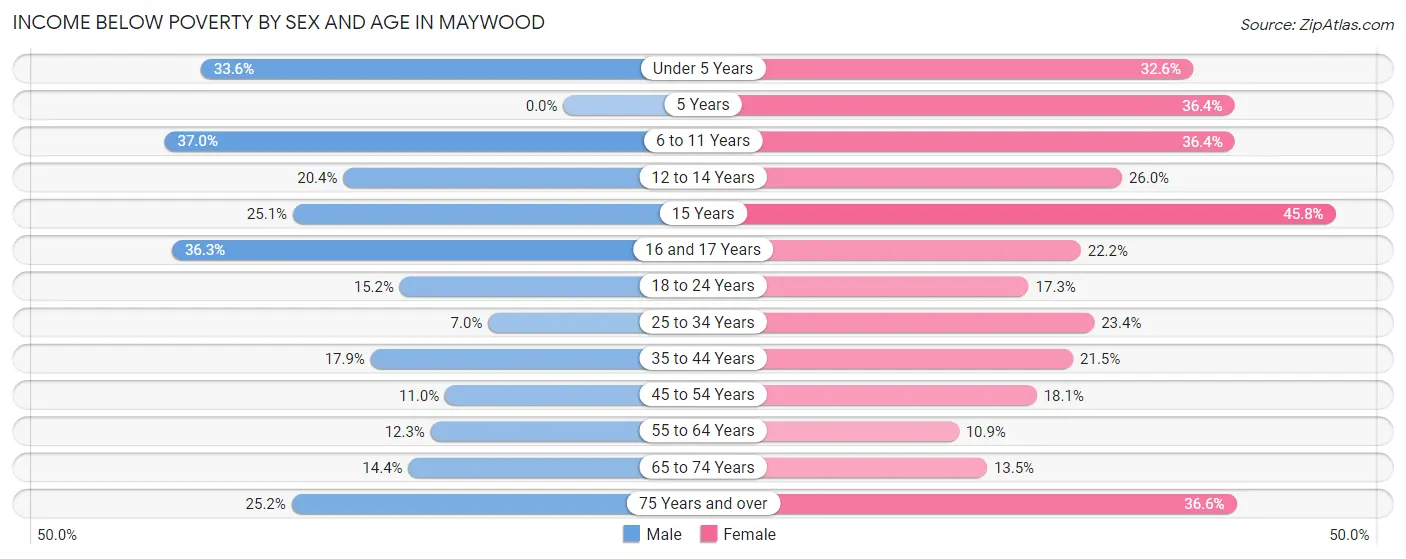
| Age Bracket | Male | Female |
| Under 5 Years | 257 (33.6%) | 273 (32.6%) |
| 5 Years | 0 (0.0%) | 51 (36.4%) |
| 6 to 11 Years | 483 (37.0%) | 407 (36.4%) |
| 12 to 14 Years | 185 (20.4%) | 137 (26.0%) |
| 15 Years | 66 (25.1%) | 71 (45.8%) |
| 16 and 17 Years | 142 (36.3%) | 65 (22.2%) |
| 18 to 24 Years | 210 (15.2%) | 275 (17.3%) |
| 25 to 34 Years | 153 (7.0%) | 404 (23.4%) |
| 35 to 44 Years | 294 (17.9%) | 353 (21.5%) |
| 45 to 54 Years | 192 (11.0%) | 265 (18.1%) |
| 55 to 64 Years | 130 (12.3%) | 115 (10.8%) |
| 65 to 74 Years | 92 (14.4%) | 120 (13.5%) |
| 75 Years and over | 115 (25.2%) | 171 (36.6%) |
| Total | 2,319 (18.1%) | 2,707 (22.7%) |
Income Above Poverty by Sex and Age in Maywood
According to the poverty statistics in Maywood, males aged 5 years and females aged 55 to 64 years are the age groups that are most secure financially, with 100.0% of males and 89.1% of females in these age groups living above the poverty line.
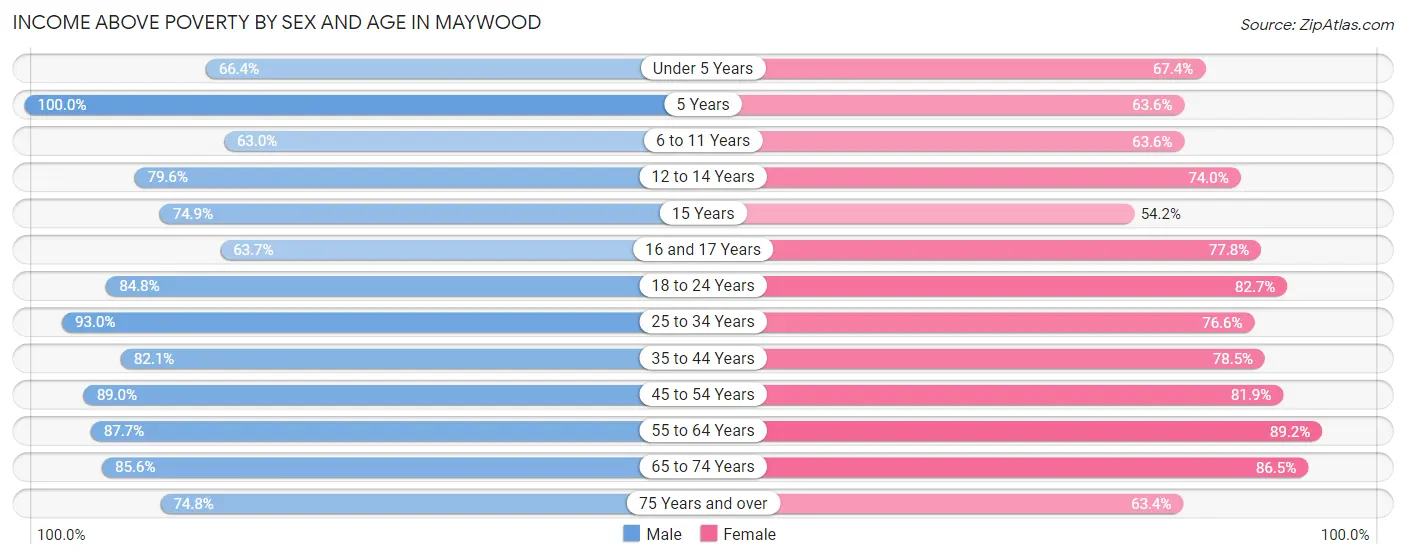
| Age Bracket | Male | Female |
| Under 5 Years | 507 (66.4%) | 565 (67.4%) |
| 5 Years | 82 (100.0%) | 89 (63.6%) |
| 6 to 11 Years | 822 (63.0%) | 710 (63.6%) |
| 12 to 14 Years | 721 (79.6%) | 390 (74.0%) |
| 15 Years | 197 (74.9%) | 84 (54.2%) |
| 16 and 17 Years | 249 (63.7%) | 228 (77.8%) |
| 18 to 24 Years | 1,173 (84.8%) | 1,311 (82.7%) |
| 25 to 34 Years | 2,041 (93.0%) | 1,320 (76.6%) |
| 35 to 44 Years | 1,350 (82.1%) | 1,291 (78.5%) |
| 45 to 54 Years | 1,557 (89.0%) | 1,200 (81.9%) |
| 55 to 64 Years | 926 (87.7%) | 945 (89.1%) |
| 65 to 74 Years | 548 (85.6%) | 771 (86.5%) |
| 75 Years and over | 341 (74.8%) | 296 (63.4%) |
| Total | 10,514 (81.9%) | 9,200 (77.3%) |
Income Below Poverty Among Married-Couple Families in Maywood
The poverty statistics for married-couple families in Maywood show that 14.5% or 451 of the total 3,117 families live below the poverty line. Families with 5 or more children have the highest poverty rate of 100.0%, comprising of 21 families. On the other hand, families with no children have the lowest poverty rate of 12.4%, which includes 153 families.
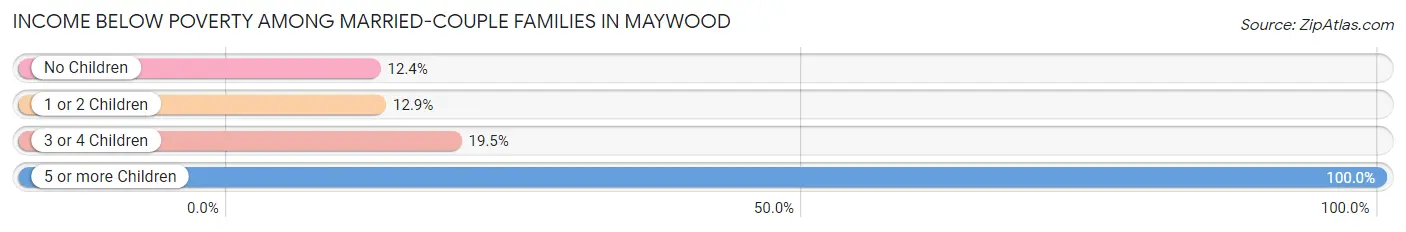
| Children | Above Poverty | Below Poverty |
| No Children | 1,080 (87.6%) | 153 (12.4%) |
| 1 or 2 Children | 1,135 (87.1%) | 168 (12.9%) |
| 3 or 4 Children | 451 (80.5%) | 109 (19.5%) |
| 5 or more Children | 0 (0.0%) | 21 (100.0%) |
| Total | 2,666 (85.5%) | 451 (14.5%) |
Income Below Poverty Among Single-Parent Households in Maywood
According to the poverty data in Maywood, 19.2% or 163 single-father households and 30.7% or 404 single-mother households are living below the poverty line. Among single-father households, those with 3 or 4 children have the highest poverty rate, with 16 households (31.4%) experiencing poverty. Likewise, among single-mother households, those with 5 or more children have the highest poverty rate, with 17 households (100.0%) falling below the poverty line.
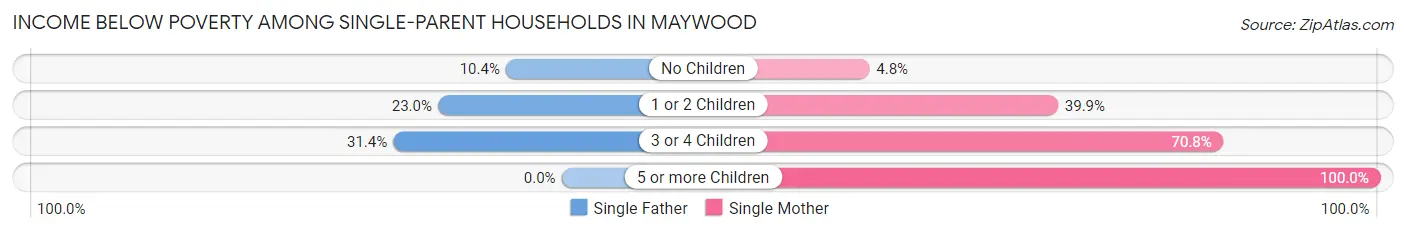
| Children | Single Father | Single Mother |
| No Children | 30 (10.4%) | 25 (4.8%) |
| 1 or 2 Children | 117 (23.0%) | 241 (39.9%) |
| 3 or 4 Children | 16 (31.4%) | 121 (70.8%) |
| 5 or more Children | 0 (0.0%) | 17 (100.0%) |
| Total | 163 (19.2%) | 404 (30.7%) |
Income Below Poverty Among Married-Couple vs Single-Parent Households in Maywood
The poverty data for Maywood shows that 451 of the married-couple family households (14.5%) and 567 of the single-parent households (26.2%) are living below the poverty level. Within the married-couple family households, those with 5 or more children have the highest poverty rate, with 21 households (100.0%) falling below the poverty line. Among the single-parent households, those with 5 or more children have the highest poverty rate, with 17 household (100.0%) living below poverty.
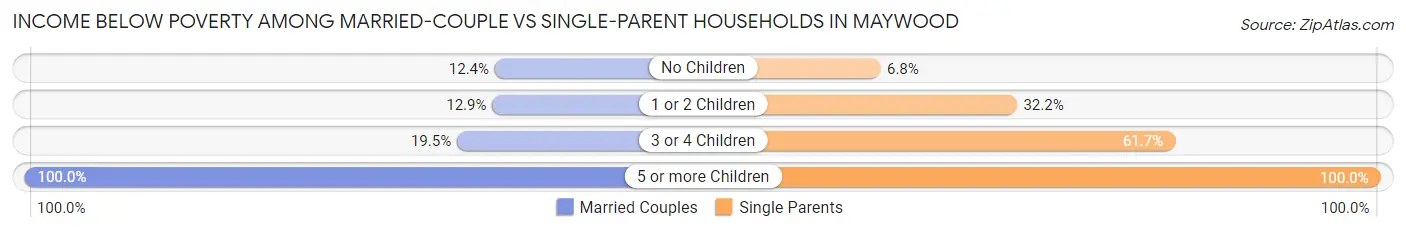
| Children | Married-Couple Families | Single-Parent Households |
| No Children | 153 (12.4%) | 55 (6.8%) |
| 1 or 2 Children | 168 (12.9%) | 358 (32.2%) |
| 3 or 4 Children | 109 (19.5%) | 137 (61.7%) |
| 5 or more Children | 21 (100.0%) | 17 (100.0%) |
| Total | 451 (14.5%) | 567 (26.2%) |
Race in Maywood
The most populous races in Maywood are Hispanic or Latino (24,406 | 97.6%), Some other Race (10,106 | 40.4%), and White / Caucasian (8,746 | 35.0%).
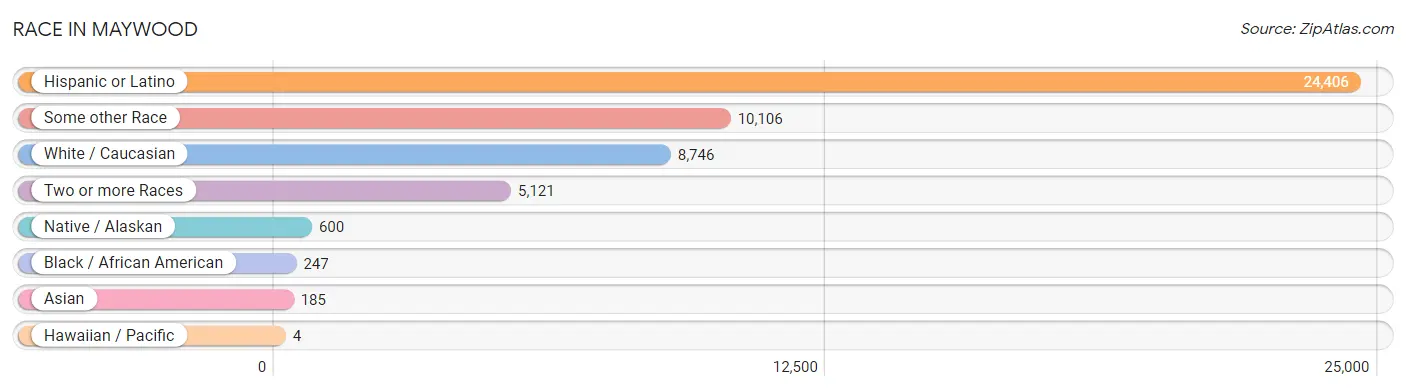
| Race | # Population | % Population |
| Asian | 185 | 0.7% |
| Black / African American | 247 | 1.0% |
| Hawaiian / Pacific | 4 | 0.0% |
| Hispanic or Latino | 24,406 | 97.6% |
| Native / Alaskan | 600 | 2.4% |
| White / Caucasian | 8,746 | 35.0% |
| Two or more Races | 5,121 | 20.5% |
| Some other Race | 10,106 | 40.4% |
| Total | 25,009 | 100.0% |
Ancestry in Maywood
The most populous ancestries reported in Maywood are Mexican (20,099 | 80.4%), Central American (3,624 | 14.5%), Salvadoran (2,270 | 9.1%), Guatemalan (886 | 3.5%), and American (502 | 2.0%), together accounting for 109.5% of all Maywood residents.
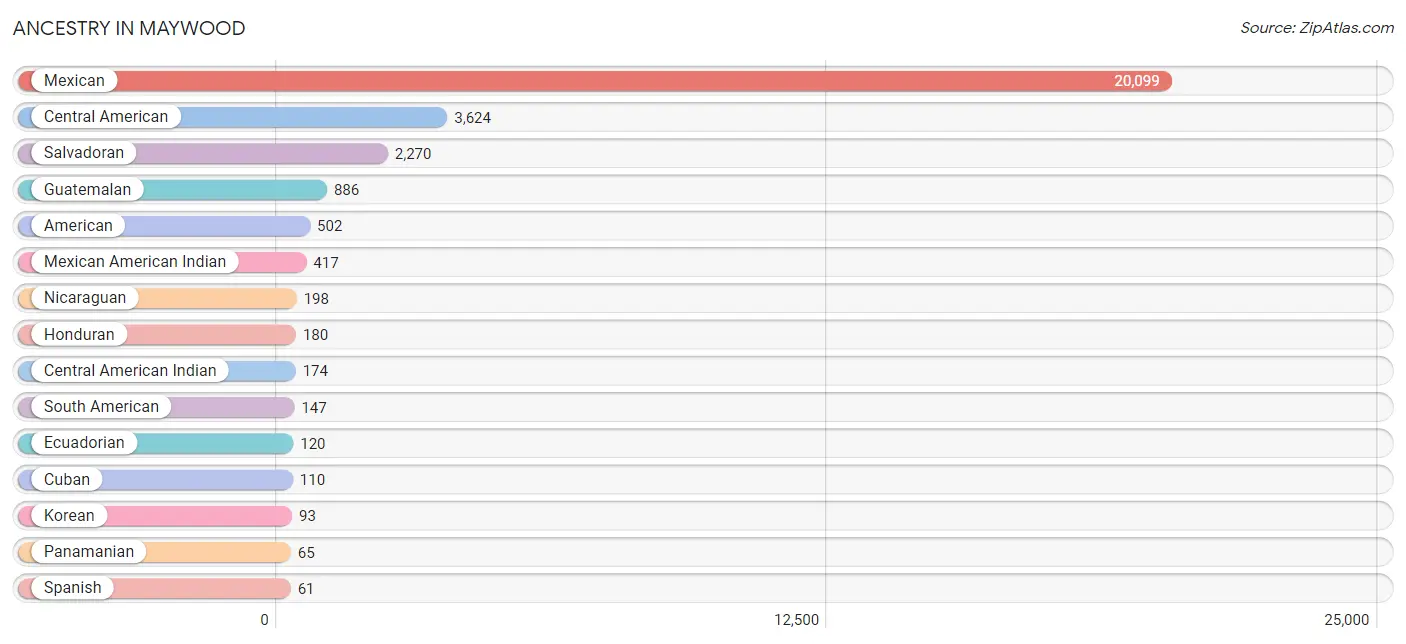
| Ancestry | # Population | % Population |
| African | 20 | 0.1% |
| American | 502 | 2.0% |
| Arab | 7 | 0.0% |
| Argentinean | 17 | 0.1% |
| Armenian | 11 | 0.0% |
| Bhutanese | 8 | 0.0% |
| Burmese | 12 | 0.1% |
| Central American | 3,624 | 14.5% |
| Central American Indian | 174 | 0.7% |
| Colombian | 2 | 0.0% |
| Costa Rican | 20 | 0.1% |
| Cuban | 110 | 0.4% |
| Ecuadorian | 120 | 0.5% |
| English | 12 | 0.1% |
| European | 20 | 0.1% |
| French | 11 | 0.0% |
| German | 57 | 0.2% |
| Greek | 5 | 0.0% |
| Guamanian / Chamorro | 4 | 0.0% |
| Guatemalan | 886 | 3.5% |
| Honduran | 180 | 0.7% |
| Indian (Asian) | 3 | 0.0% |
| Irish | 30 | 0.1% |
| Italian | 36 | 0.1% |
| Japanese | 6 | 0.0% |
| Korean | 93 | 0.4% |
| Laotian | 35 | 0.1% |
| Mexican | 20,099 | 80.4% |
| Mexican American Indian | 417 | 1.7% |
| Mongolian | 7 | 0.0% |
| Nicaraguan | 198 | 0.8% |
| Pakistani | 13 | 0.1% |
| Panamanian | 65 | 0.3% |
| Peruvian | 3 | 0.0% |
| Polish | 37 | 0.2% |
| Salvadoran | 2,270 | 9.1% |
| Scandinavian | 5 | 0.0% |
| South American | 147 | 0.6% |
| Spanish | 61 | 0.2% |
| Sri Lankan | 31 | 0.1% |
| Subsaharan African | 20 | 0.1% |
| Thai | 11 | 0.0% |
| Venezuelan | 5 | 0.0% | View All 43 Rows |
Immigrants in Maywood
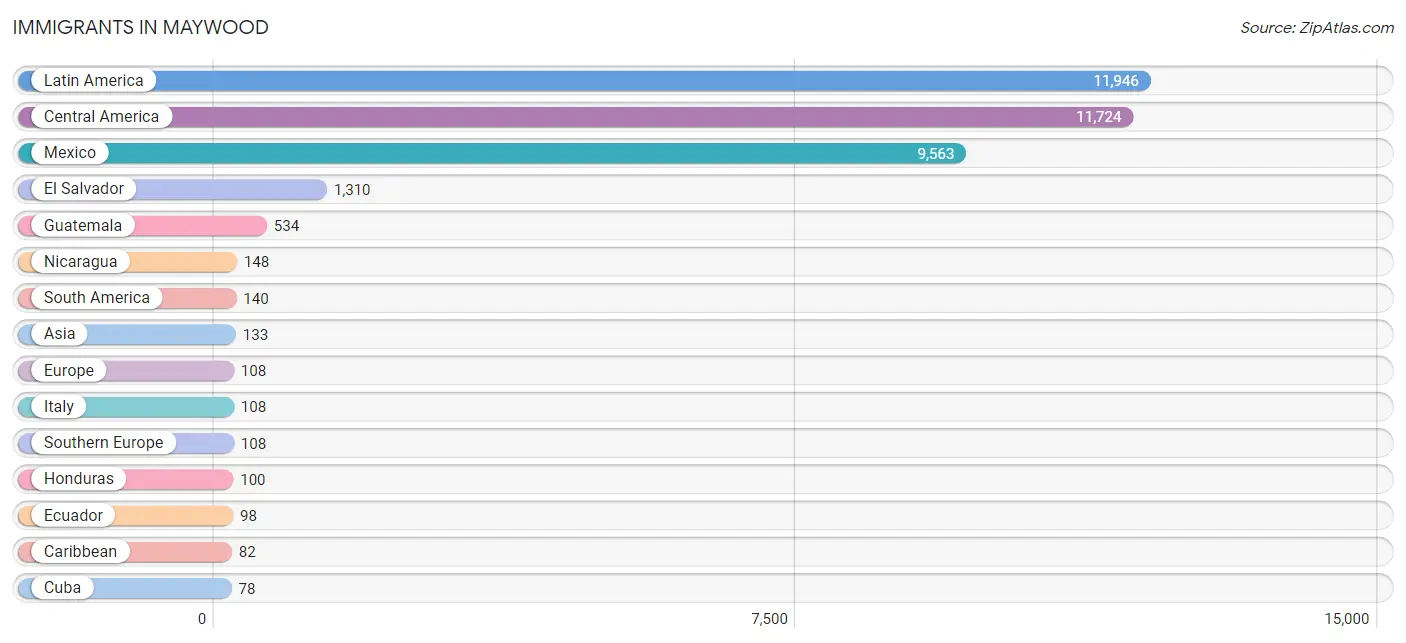
The most numerous immigrant groups reported in Maywood came from Latin America (11,946 | 47.8%), Central America (11,724 | 46.9%), Mexico (9,563 | 38.2%), El Salvador (1,310 | 5.2%), and Guatemala (534 | 2.1%), together accounting for 140.3% of all Maywood residents.
| Immigration Origin | # Population | % Population |
| Argentina | 5 | 0.0% |
| Armenia | 67 | 0.3% |
| Asia | 133 | 0.5% |
| Brazil | 6 | 0.0% |
| Caribbean | 82 | 0.3% |
| Central America | 11,724 | 46.9% |
| Colombia | 2 | 0.0% |
| Costa Rica | 20 | 0.1% |
| Cuba | 78 | 0.3% |
| Eastern Asia | 4 | 0.0% |
| Ecuador | 98 | 0.4% |
| El Salvador | 1,310 | 5.2% |
| Europe | 108 | 0.4% |
| Guatemala | 534 | 2.1% |
| Honduras | 100 | 0.4% |
| Italy | 108 | 0.4% |
| Korea | 4 | 0.0% |
| Latin America | 11,946 | 47.8% |
| Malaysia | 7 | 0.0% |
| Mexico | 9,563 | 38.2% |
| Nicaragua | 148 | 0.6% |
| Panama | 49 | 0.2% |
| Peru | 3 | 0.0% |
| Philippines | 45 | 0.2% |
| South America | 140 | 0.6% |
| South Eastern Asia | 62 | 0.3% |
| Southern Europe | 108 | 0.4% |
| Thailand | 7 | 0.0% |
| Venezuela | 26 | 0.1% |
| Vietnam | 3 | 0.0% |
| Western Asia | 67 | 0.3% | View All 31 Rows |
Sex and Age in Maywood
Sex and Age in Maywood
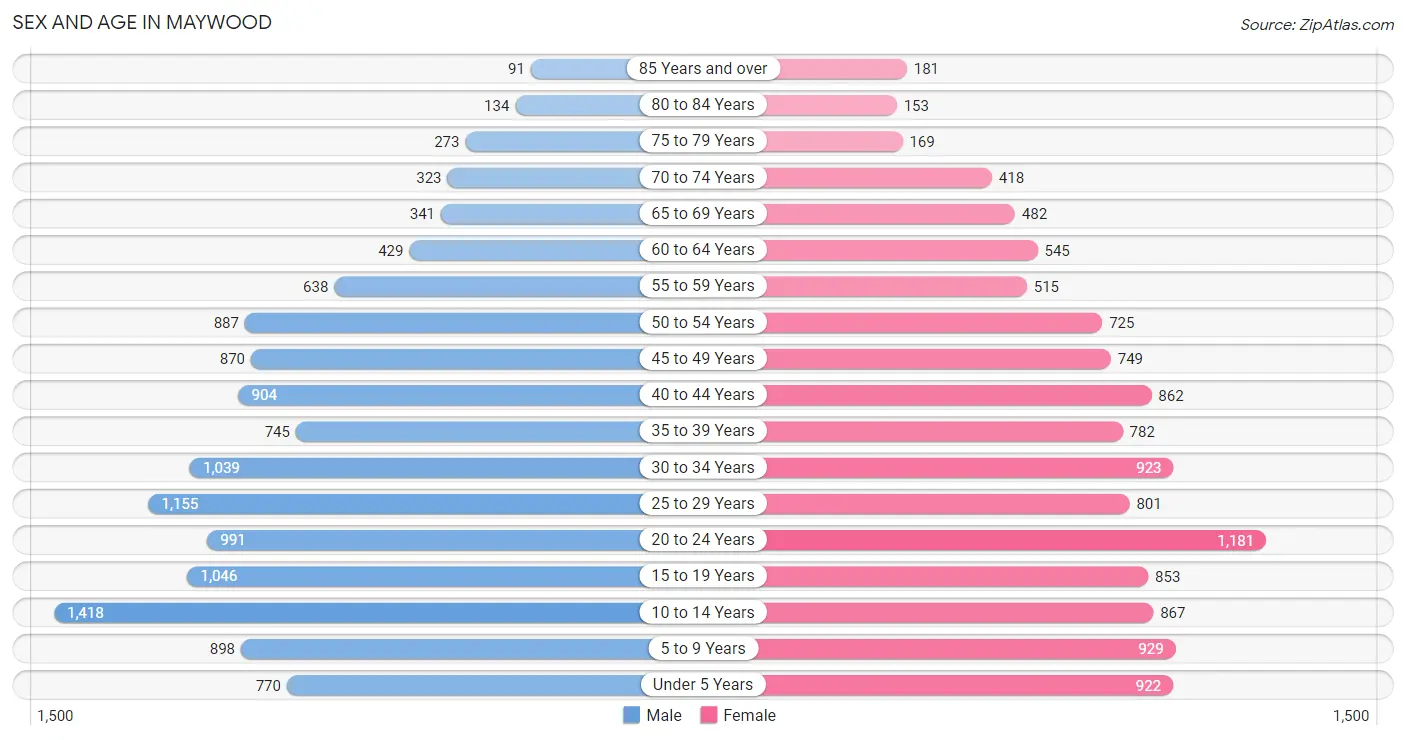
The most populous age groups in Maywood are 10 to 14 Years (1,418 | 11.0%) for men and 20 to 24 Years (1,181 | 9.8%) for women.
| Age Bracket | Male | Female |
| Under 5 Years | 770 (5.9%) | 922 (7.6%) |
| 5 to 9 Years | 898 (6.9%) | 929 (7.7%) |
| 10 to 14 Years | 1,418 (11.0%) | 867 (7.2%) |
| 15 to 19 Years | 1,046 (8.1%) | 853 (7.1%) |
| 20 to 24 Years | 991 (7.6%) | 1,181 (9.8%) |
| 25 to 29 Years | 1,155 (8.9%) | 801 (6.6%) |
| 30 to 34 Years | 1,039 (8.0%) | 923 (7.7%) |
| 35 to 39 Years | 745 (5.8%) | 782 (6.5%) |
| 40 to 44 Years | 904 (7.0%) | 862 (7.1%) |
| 45 to 49 Years | 870 (6.7%) | 749 (6.2%) |
| 50 to 54 Years | 887 (6.9%) | 725 (6.0%) |
| 55 to 59 Years | 638 (4.9%) | 515 (4.3%) |
| 60 to 64 Years | 429 (3.3%) | 545 (4.5%) |
| 65 to 69 Years | 341 (2.6%) | 482 (4.0%) |
| 70 to 74 Years | 323 (2.5%) | 418 (3.5%) |
| 75 to 79 Years | 273 (2.1%) | 169 (1.4%) |
| 80 to 84 Years | 134 (1.0%) | 153 (1.3%) |
| 85 Years and over | 91 (0.7%) | 181 (1.5%) |
| Total | 12,952 (100.0%) | 12,057 (100.0%) |
Families and Households in Maywood
Median Family Size in Maywood
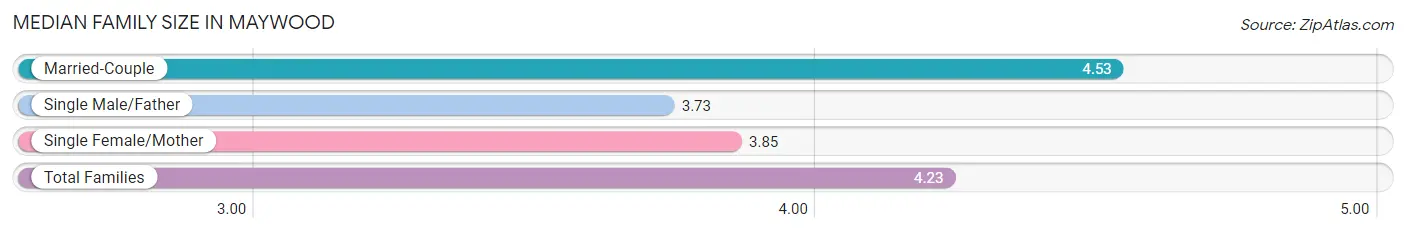
The median family size in Maywood is 4.23 persons per family, with married-couple families (3,117 | 59.0%) accounting for the largest median family size of 4.53 persons per family. On the other hand, single male/father families (848 | 16.1%) represent the smallest median family size with 3.73 persons per family.
| Family Type | # Families | Family Size |
| Married-Couple | 3,117 (59.0%) | 4.53 |
| Single Male/Father | 848 (16.1%) | 3.73 |
| Single Female/Mother | 1,315 (24.9%) | 3.85 |
| Total Families | 5,280 (100.0%) | 4.23 |
Median Household Size in Maywood
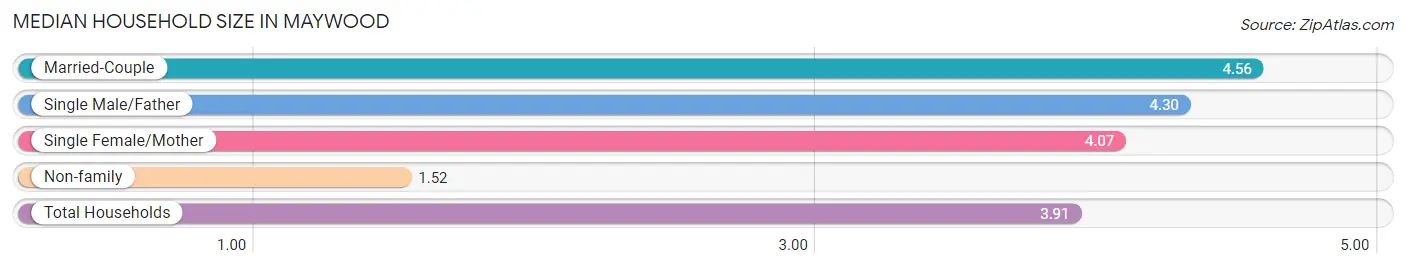
The median household size in Maywood is 3.91 persons per household, with married-couple households (3,117 | 49.0%) accounting for the largest median household size of 4.56 persons per household. non-family households (1,078 | 17.0%) represent the smallest median household size with 1.52 persons per household.
| Household Type | # Households | Household Size |
| Married-Couple | 3,117 (49.0%) | 4.56 |
| Single Male/Father | 848 (13.3%) | 4.30 |
| Single Female/Mother | 1,315 (20.7%) | 4.07 |
| Non-family | 1,078 (17.0%) | 1.52 |
| Total Households | 6,358 (100.0%) | 3.91 |
Household Size by Marriage Status in Maywood
Out of a total of 6,358 households in Maywood, 5,280 (83.0%) are family households, while 1,078 (17.0%) are nonfamily households. The most numerous type of family households are 4-person households, comprising 1,705, and the most common type of nonfamily households are 1-person households, comprising 772.
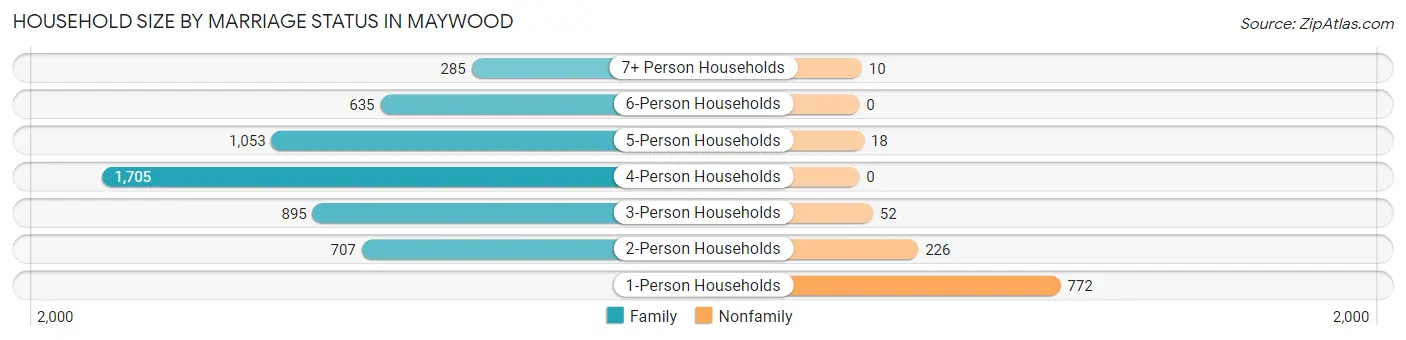
| Household Size | Family Households | Nonfamily Households |
| 1-Person Households | - | 772 (12.1%) |
| 2-Person Households | 707 (11.1%) | 226 (3.5%) |
| 3-Person Households | 895 (14.1%) | 52 (0.8%) |
| 4-Person Households | 1,705 (26.8%) | 0 (0.0%) |
| 5-Person Households | 1,053 (16.6%) | 18 (0.3%) |
| 6-Person Households | 635 (10.0%) | 0 (0.0%) |
| 7+ Person Households | 285 (4.5%) | 10 (0.2%) |
| Total | 5,280 (83.0%) | 1,078 (17.0%) |
Female Fertility in Maywood
Fertility by Age in Maywood
Average fertility rate in Maywood is 59.0 births per 1,000 women. Women in the age bracket of 20 to 34 years have the highest fertility rate with 88.0 births per 1,000 women. Women in the age bracket of 20 to 34 years acount for 68.8% of all women with births.
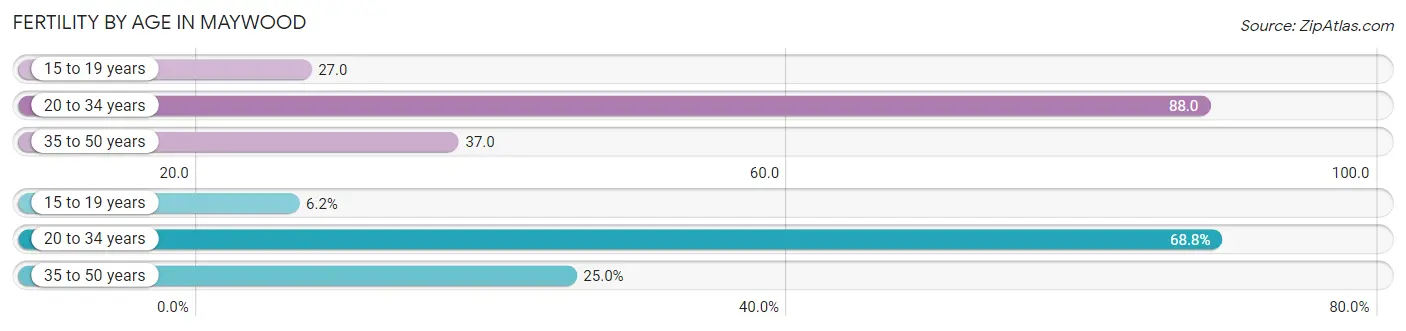
| Age Bracket | Women with Births | Births / 1,000 Women |
| 15 to 19 years | 23 (6.2%) | 27.0 |
| 20 to 34 years | 256 (68.8%) | 88.0 |
| 35 to 50 years | 93 (25.0%) | 37.0 |
| Total | 372 (100.0%) | 59.0 |
Fertility by Age by Marriage Status in Maywood
57.8% of women with births (372) in Maywood are married. The highest percentage of unmarried women with births falls into 15 to 19 years age bracket with 100.0% of them unmarried at the time of birth, while the lowest percentage of unmarried women with births belong to 35 to 50 years age bracket with 20.4% of them unmarried.
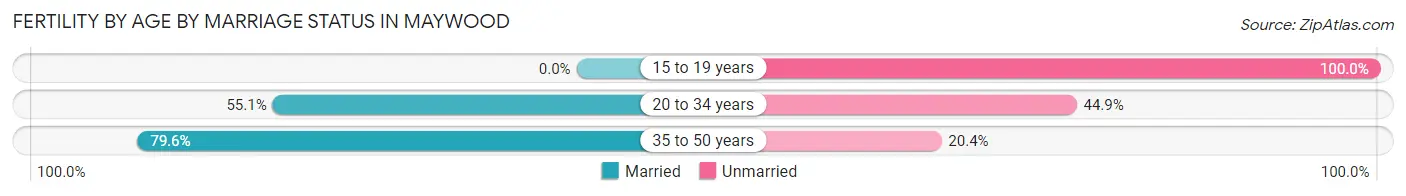
| Age Bracket | Married | Unmarried |
| 15 to 19 years | 0 (0.0%) | 23 (100.0%) |
| 20 to 34 years | 141 (55.1%) | 115 (44.9%) |
| 35 to 50 years | 74 (79.6%) | 19 (20.4%) |
| Total | 215 (57.8%) | 157 (42.2%) |
Fertility by Education in Maywood
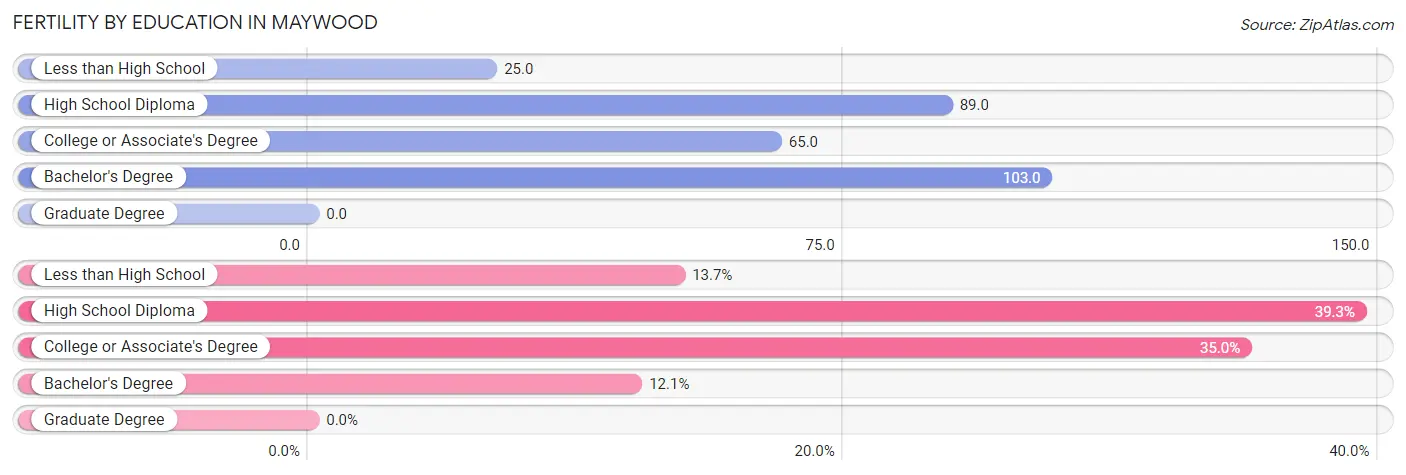
| Educational Attainment | Women with Births | Births / 1,000 Women |
| Less than High School | 51 (13.7%) | 25.0 |
| High School Diploma | 146 (39.3%) | 89.0 |
| College or Associate's Degree | 130 (34.9%) | 65.0 |
| Bachelor's Degree | 45 (12.1%) | 103.0 |
| Graduate Degree | 0 (0.0%) | 0.0 |
| Total | 372 (100.0%) | 59.0 |
Fertility by Education by Marriage Status in Maywood
42.2% of women with births in Maywood are unmarried. Women with the educational attainment of bachelor's degree are most likely to be married with 100.0% of them married at childbirth, while women with the educational attainment of less than high school are least likely to be married with 52.9% of them unmarried at childbirth.
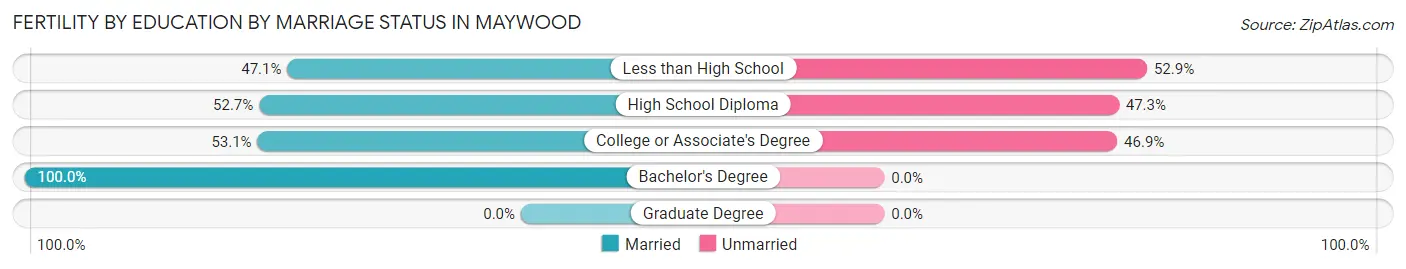
| Educational Attainment | Married | Unmarried |
| Less than High School | 24 (47.1%) | 27 (52.9%) |
| High School Diploma | 77 (52.7%) | 69 (47.3%) |
| College or Associate's Degree | 69 (53.1%) | 61 (46.9%) |
| Bachelor's Degree | 45 (100.0%) | 0 (0.0%) |
| Graduate Degree | 0 (0.0%) | 0 (0.0%) |
| Total | 215 (57.8%) | 157 (42.2%) |
Employment Characteristics in Maywood
Employment by Class of Employer in Maywood
Among the 11,189 employed individuals in Maywood, private company employees (8,933 | 79.8%), not-for-profit organizations (748 | 6.7%), and self-employed (not incorporated) (581 | 5.2%) make up the most common classes of employment.
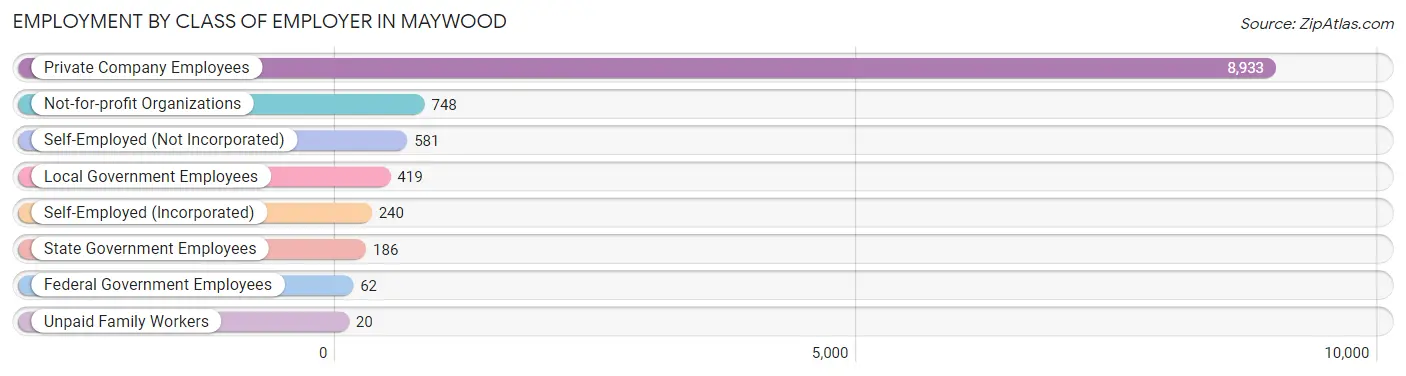
| Employer Class | # Employees | % Employees |
| Private Company Employees | 8,933 | 79.8% |
| Self-Employed (Incorporated) | 240 | 2.1% |
| Self-Employed (Not Incorporated) | 581 | 5.2% |
| Not-for-profit Organizations | 748 | 6.7% |
| Local Government Employees | 419 | 3.7% |
| State Government Employees | 186 | 1.7% |
| Federal Government Employees | 62 | 0.5% |
| Unpaid Family Workers | 20 | 0.2% |
| Total | 11,189 | 100.0% |
Employment Status by Age in Maywood
According to the labor force statistics for Maywood, out of the total population over 16 years of age (18,787), 65.0% or 12,212 individuals are in the labor force, with 5.6% or 684 of them unemployed. The age group with the highest labor force participation rate is 25 to 29 years, with 85.1% or 1,665 individuals in the labor force. Within the labor force, the 16 to 19 years age range has the highest percentage of unemployed individuals, with 29.3% or 97 of them being unemployed.
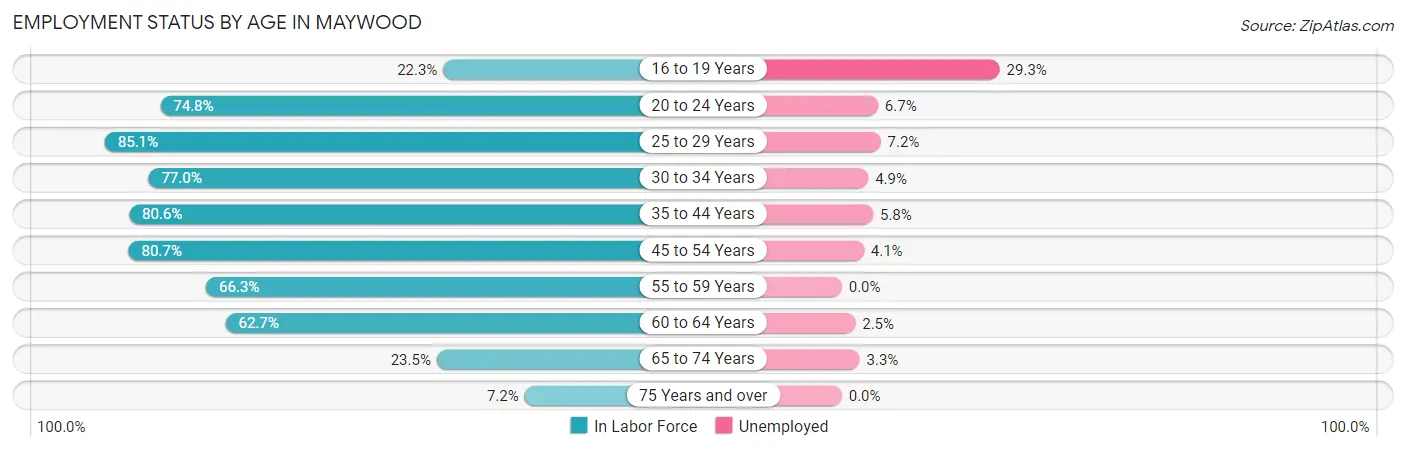
| Age Bracket | In Labor Force | Unemployed |
| 16 to 19 Years | 330 (22.3%) | 97 (29.3%) |
| 20 to 24 Years | 1,625 (74.8%) | 109 (6.7%) |
| 25 to 29 Years | 1,665 (85.1%) | 120 (7.2%) |
| 30 to 34 Years | 1,511 (77.0%) | 74 (4.9%) |
| 35 to 44 Years | 2,654 (80.6%) | 154 (5.8%) |
| 45 to 54 Years | 2,607 (80.7%) | 107 (4.1%) |
| 55 to 59 Years | 764 (66.3%) | 0 (0.0%) |
| 60 to 64 Years | 611 (62.7%) | 15 (2.5%) |
| 65 to 74 Years | 368 (23.5%) | 12 (3.3%) |
| 75 Years and over | 72 (7.2%) | 0 (0.0%) |
| Total | 12,212 (65.0%) | 684 (5.6%) |
Employment Status by Educational Attainment in Maywood
According to labor force statistics for Maywood, 78.1% of individuals (9,816) out of the total population between 25 and 64 years of age (12,569) are in the labor force, with 4.8% or 471 of them being unemployed. The group with the highest labor force participation rate are those with the educational attainment of bachelor's degree or higher, with 95.8% or 1,163 individuals in the labor force. Within the labor force, individuals with college / associate degree education have the highest percentage of unemployment, with 6.5% or 107 of them being unemployed.
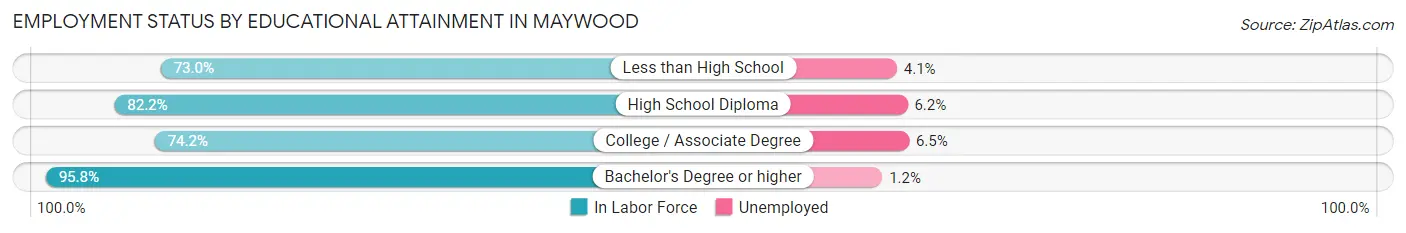
| Educational Attainment | In Labor Force | Unemployed |
| Less than High School | 4,016 (73.0%) | 226 (4.1%) |
| High School Diploma | 2,995 (82.2%) | 226 (6.2%) |
| College / Associate Degree | 1,639 (74.2%) | 144 (6.5%) |
| Bachelor's Degree or higher | 1,163 (95.8%) | 15 (1.2%) |
| Total | 9,816 (78.1%) | 603 (4.8%) |
Employment Occupations by Sex in Maywood
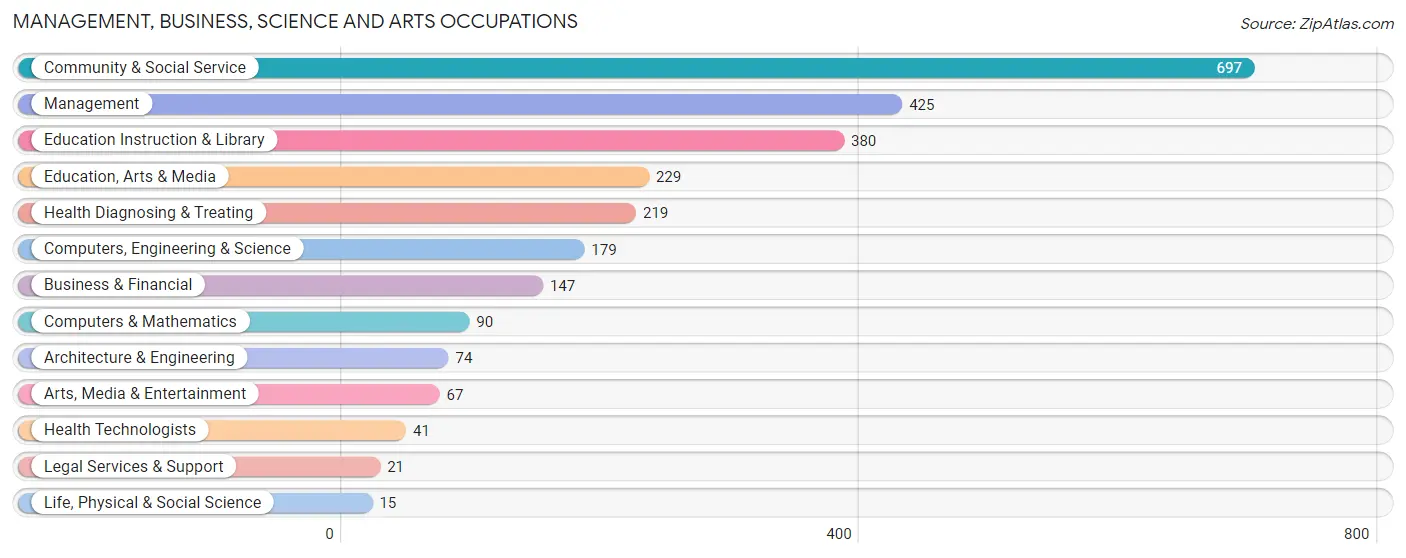
Management, Business, Science and Arts Occupations
The most common Management, Business, Science and Arts occupations in Maywood are Community & Social Service (697 | 6.0%), Management (425 | 3.7%), Education Instruction & Library (380 | 3.3%), Education, Arts & Media (229 | 2.0%), and Health Diagnosing & Treating (219 | 1.9%).
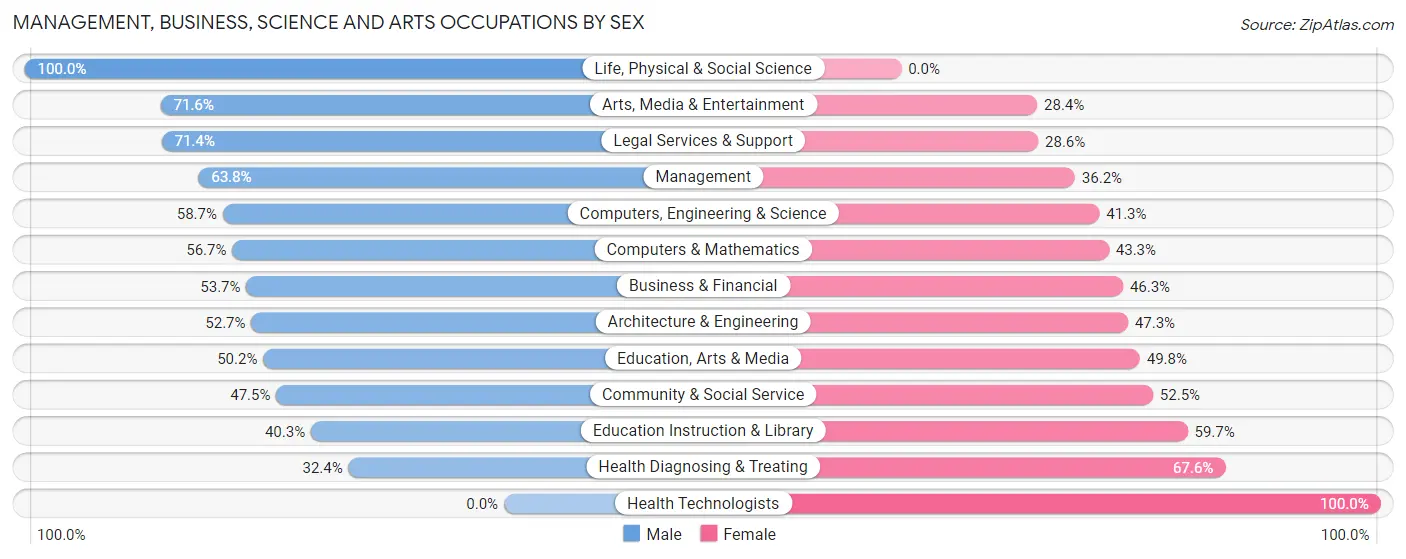
Management, Business, Science and Arts Occupations by Sex
Within the Management, Business, Science and Arts occupations in Maywood, the most male-oriented occupations are Life, Physical & Social Science (100.0%), Arts, Media & Entertainment (71.6%), and Legal Services & Support (71.4%), while the most female-oriented occupations are Health Technologists (100.0%), Health Diagnosing & Treating (67.6%), and Education Instruction & Library (59.7%).
| Occupation | Male | Female |
| Management | 271 (63.8%) | 154 (36.2%) |
| Business & Financial | 79 (53.7%) | 68 (46.3%) |
| Computers, Engineering & Science | 105 (58.7%) | 74 (41.3%) |
| Computers & Mathematics | 51 (56.7%) | 39 (43.3%) |
| Architecture & Engineering | 39 (52.7%) | 35 (47.3%) |
| Life, Physical & Social Science | 15 (100.0%) | 0 (0.0%) |
| Community & Social Service | 331 (47.5%) | 366 (52.5%) |
| Education, Arts & Media | 115 (50.2%) | 114 (49.8%) |
| Legal Services & Support | 15 (71.4%) | 6 (28.6%) |
| Education Instruction & Library | 153 (40.3%) | 227 (59.7%) |
| Arts, Media & Entertainment | 48 (71.6%) | 19 (28.4%) |
| Health Diagnosing & Treating | 71 (32.4%) | 148 (67.6%) |
| Health Technologists | 0 (0.0%) | 41 (100.0%) |
| Total (Category) | 857 (51.4%) | 810 (48.6%) |
| Total (Overall) | 6,993 (60.7%) | 4,530 (39.3%) |
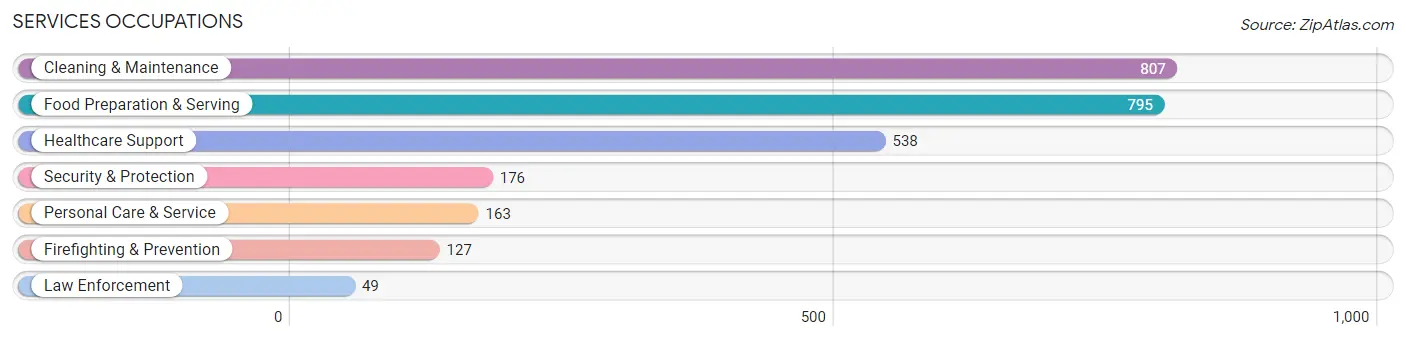
Services Occupations
The most common Services occupations in Maywood are Cleaning & Maintenance (807 | 7.0%), Food Preparation & Serving (795 | 6.9%), Healthcare Support (538 | 4.7%), Security & Protection (176 | 1.5%), and Personal Care & Service (163 | 1.4%).
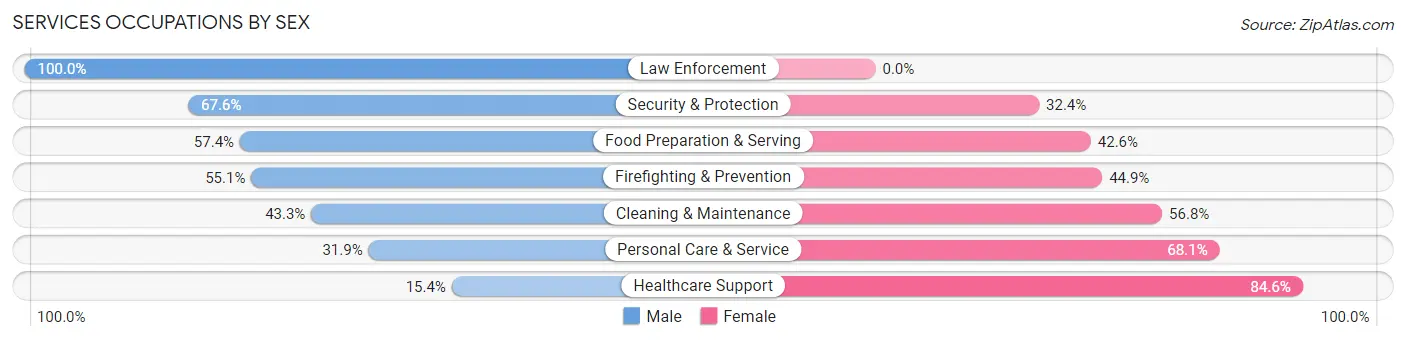
Services Occupations by Sex
Within the Services occupations in Maywood, the most male-oriented occupations are Law Enforcement (100.0%), Security & Protection (67.6%), and Food Preparation & Serving (57.4%), while the most female-oriented occupations are Healthcare Support (84.6%), Personal Care & Service (68.1%), and Cleaning & Maintenance (56.8%).
| Occupation | Male | Female |
| Healthcare Support | 83 (15.4%) | 455 (84.6%) |
| Security & Protection | 119 (67.6%) | 57 (32.4%) |
| Firefighting & Prevention | 70 (55.1%) | 57 (44.9%) |
| Law Enforcement | 49 (100.0%) | 0 (0.0%) |
| Food Preparation & Serving | 456 (57.4%) | 339 (42.6%) |
| Cleaning & Maintenance | 349 (43.2%) | 458 (56.8%) |
| Personal Care & Service | 52 (31.9%) | 111 (68.1%) |
| Total (Category) | 1,059 (42.7%) | 1,420 (57.3%) |
| Total (Overall) | 6,993 (60.7%) | 4,530 (39.3%) |
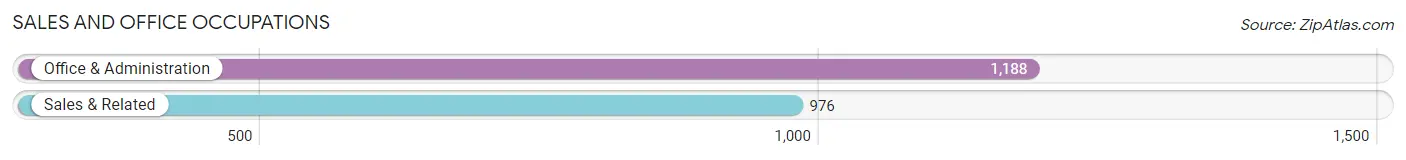
Sales and Office Occupations
The most common Sales and Office occupations in Maywood are Office & Administration (1,188 | 10.3%), and Sales & Related (976 | 8.5%).
Sales and Office Occupations by Sex
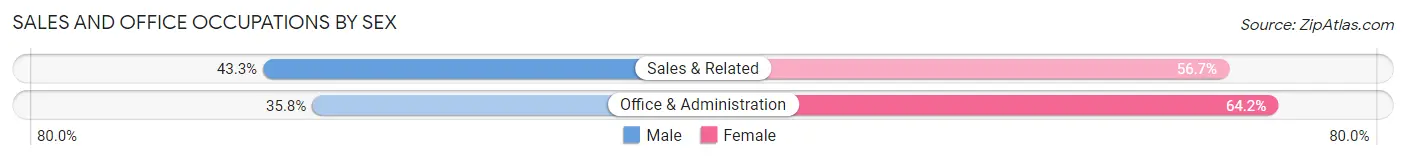
| Occupation | Male | Female |
| Sales & Related | 423 (43.3%) | 553 (56.7%) |
| Office & Administration | 425 (35.8%) | 763 (64.2%) |
| Total (Category) | 848 (39.2%) | 1,316 (60.8%) |
| Total (Overall) | 6,993 (60.7%) | 4,530 (39.3%) |
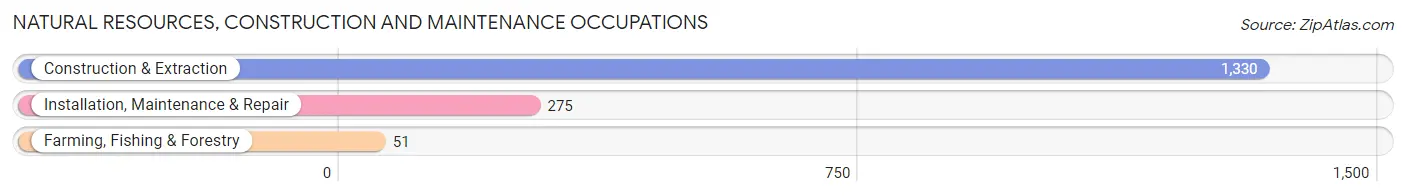
Natural Resources, Construction and Maintenance Occupations
The most common Natural Resources, Construction and Maintenance occupations in Maywood are Construction & Extraction (1,330 | 11.5%), Installation, Maintenance & Repair (275 | 2.4%), and Farming, Fishing & Forestry (51 | 0.4%).
Natural Resources, Construction and Maintenance Occupations by Sex
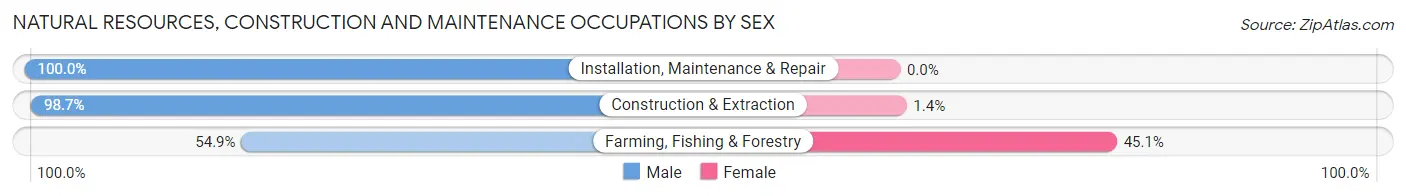
| Occupation | Male | Female |
| Farming, Fishing & Forestry | 28 (54.9%) | 23 (45.1%) |
| Construction & Extraction | 1,312 (98.7%) | 18 (1.3%) |
| Installation, Maintenance & Repair | 275 (100.0%) | 0 (0.0%) |
| Total (Category) | 1,615 (97.5%) | 41 (2.5%) |
| Total (Overall) | 6,993 (60.7%) | 4,530 (39.3%) |
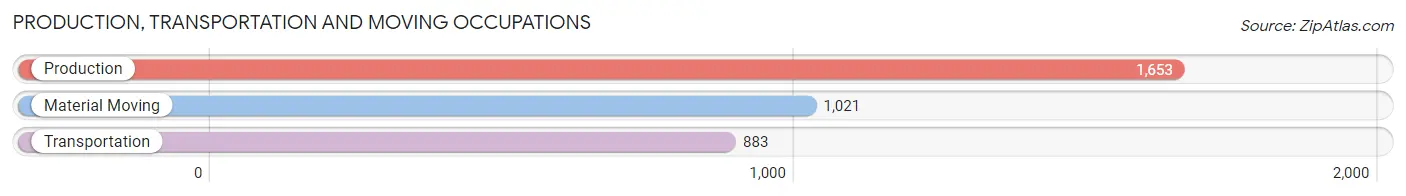
Production, Transportation and Moving Occupations
The most common Production, Transportation and Moving occupations in Maywood are Production (1,653 | 14.3%), Material Moving (1,021 | 8.9%), and Transportation (883 | 7.7%).
Production, Transportation and Moving Occupations by Sex
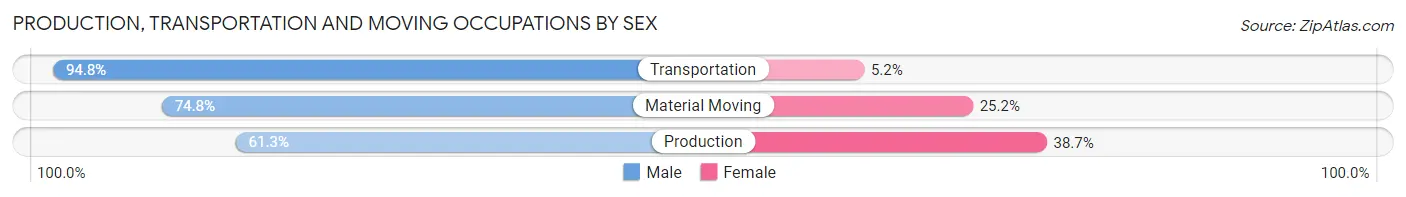
| Occupation | Male | Female |
| Production | 1,013 (61.3%) | 640 (38.7%) |
| Transportation | 837 (94.8%) | 46 (5.2%) |
| Material Moving | 764 (74.8%) | 257 (25.2%) |
| Total (Category) | 2,614 (73.5%) | 943 (26.5%) |
| Total (Overall) | 6,993 (60.7%) | 4,530 (39.3%) |
Employment Industries by Sex in Maywood
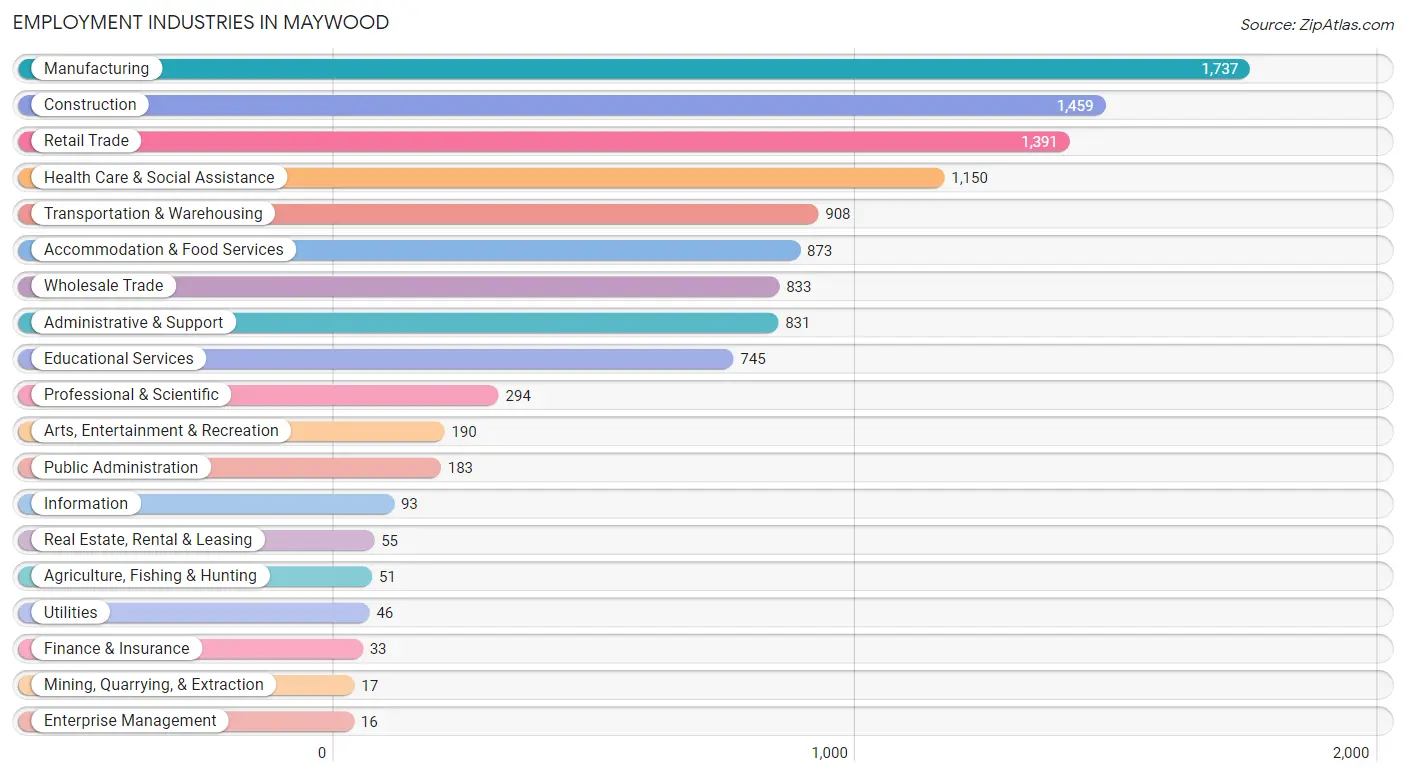
Employment Industries in Maywood
The major employment industries in Maywood include Manufacturing (1,737 | 15.1%), Construction (1,459 | 12.7%), Retail Trade (1,391 | 12.1%), Health Care & Social Assistance (1,150 | 10.0%), and Transportation & Warehousing (908 | 7.9%).
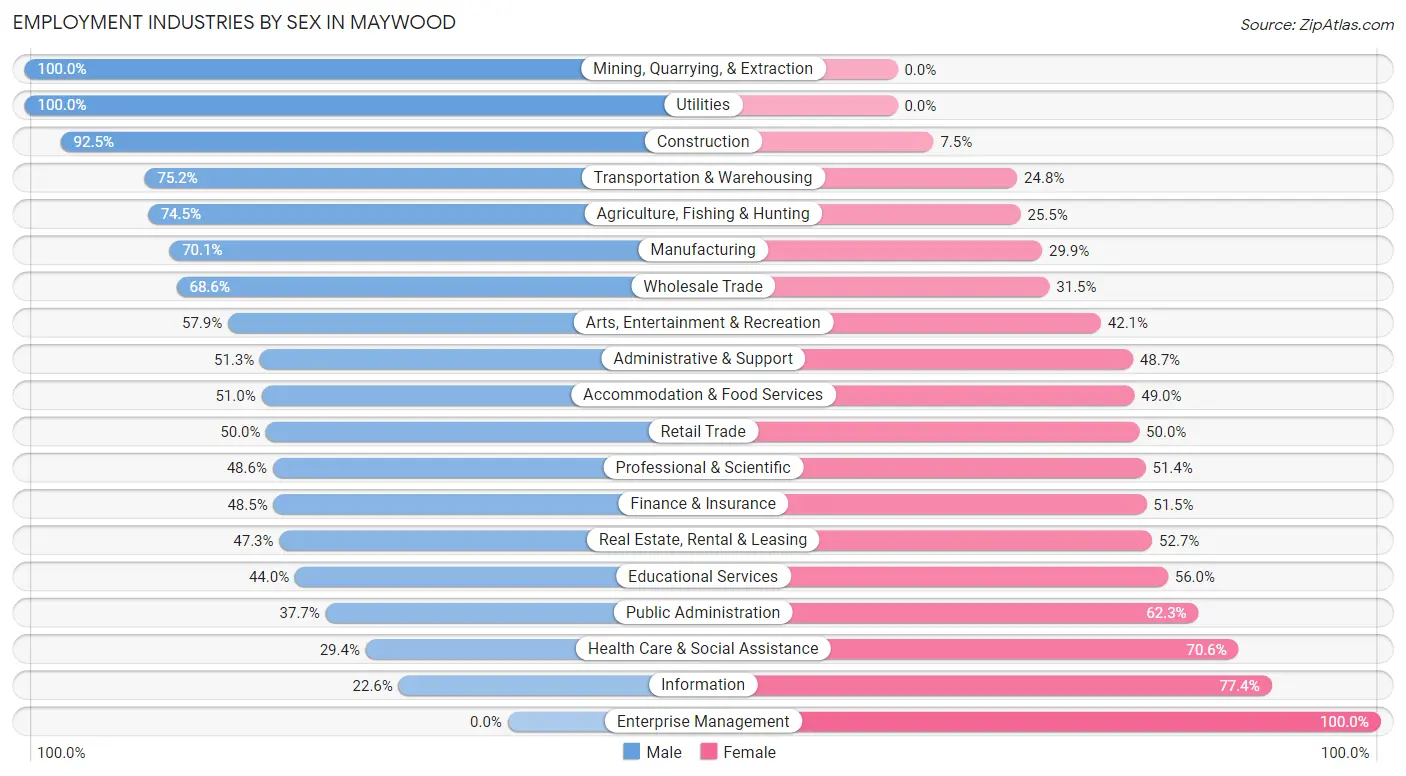
Employment Industries by Sex in Maywood
The Maywood industries that see more men than women are Mining, Quarrying, & Extraction (100.0%), Utilities (100.0%), and Construction (92.5%), whereas the industries that tend to have a higher number of women are Enterprise Management (100.0%), Information (77.4%), and Health Care & Social Assistance (70.6%).
| Industry | Male | Female |
| Agriculture, Fishing & Hunting | 38 (74.5%) | 13 (25.5%) |
| Mining, Quarrying, & Extraction | 17 (100.0%) | 0 (0.0%) |
| Construction | 1,350 (92.5%) | 109 (7.5%) |
| Manufacturing | 1,217 (70.1%) | 520 (29.9%) |
| Wholesale Trade | 571 (68.5%) | 262 (31.5%) |
| Retail Trade | 695 (50.0%) | 696 (50.0%) |
| Transportation & Warehousing | 683 (75.2%) | 225 (24.8%) |
| Utilities | 46 (100.0%) | 0 (0.0%) |
| Information | 21 (22.6%) | 72 (77.4%) |
| Finance & Insurance | 16 (48.5%) | 17 (51.5%) |
| Real Estate, Rental & Leasing | 26 (47.3%) | 29 (52.7%) |
| Professional & Scientific | 143 (48.6%) | 151 (51.4%) |
| Enterprise Management | 0 (0.0%) | 16 (100.0%) |
| Administrative & Support | 426 (51.3%) | 405 (48.7%) |
| Educational Services | 328 (44.0%) | 417 (56.0%) |
| Health Care & Social Assistance | 338 (29.4%) | 812 (70.6%) |
| Arts, Entertainment & Recreation | 110 (57.9%) | 80 (42.1%) |
| Accommodation & Food Services | 445 (51.0%) | 428 (49.0%) |
| Public Administration | 69 (37.7%) | 114 (62.3%) |
| Total | 6,993 (60.7%) | 4,530 (39.3%) |
Education in Maywood
School Enrollment in Maywood
The most common levels of schooling among the 7,256 students in Maywood are middle school (1,845 | 25.4%), elementary school (1,712 | 23.6%), and high school (1,572 | 21.7%).
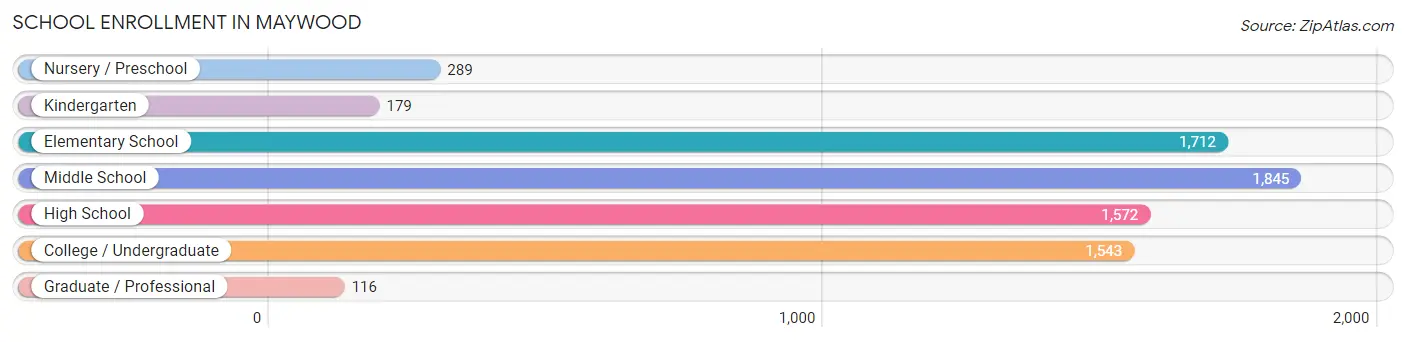
| School Level | # Students | % Students |
| Nursery / Preschool | 289 | 4.0% |
| Kindergarten | 179 | 2.5% |
| Elementary School | 1,712 | 23.6% |
| Middle School | 1,845 | 25.4% |
| High School | 1,572 | 21.7% |
| College / Undergraduate | 1,543 | 21.3% |
| Graduate / Professional | 116 | 1.6% |
| Total | 7,256 | 100.0% |
School Enrollment by Age by Funding Source in Maywood
Out of a total of 7,256 students who are enrolled in schools in Maywood, 370 (5.1%) attend a private institution, while the remaining 6,886 (94.9%) are enrolled in public schools. The age group of 35 years and over has the highest likelihood of being enrolled in private schools, with 74 (35.1% in the age bracket) enrolled. Conversely, the age group of 5 to 9 year old has the lowest likelihood of being enrolled in a private school, with 1,806 (98.9% in the age bracket) attending a public institution.
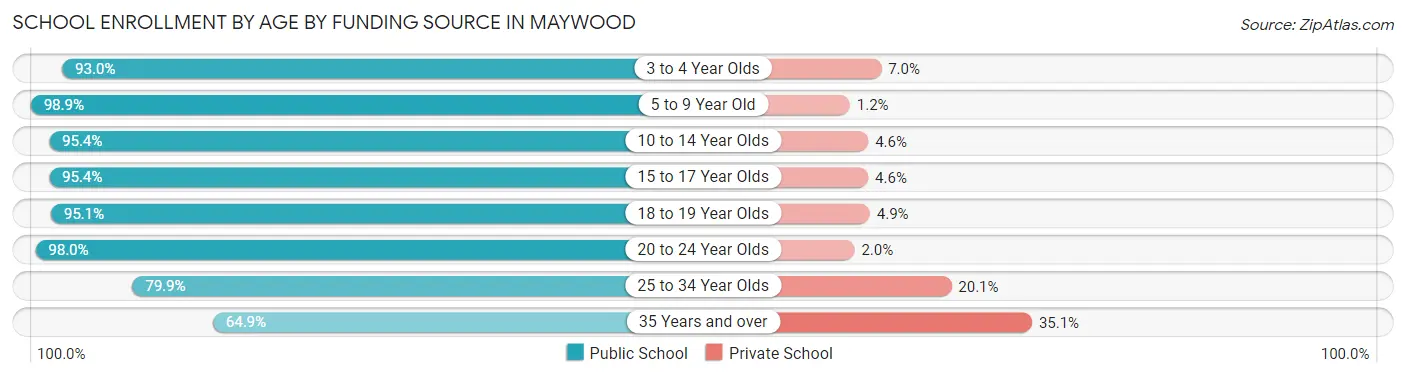
| Age Bracket | Public School | Private School |
| 3 to 4 Year Olds | 253 (93.0%) | 19 (7.0%) |
| 5 to 9 Year Old | 1,806 (98.9%) | 21 (1.1%) |
| 10 to 14 Year Olds | 2,111 (95.4%) | 101 (4.6%) |
| 15 to 17 Year Olds | 1,026 (95.4%) | 49 (4.6%) |
| 18 to 19 Year Olds | 409 (95.1%) | 21 (4.9%) |
| 20 to 24 Year Olds | 877 (98.0%) | 18 (2.0%) |
| 25 to 34 Year Olds | 267 (79.9%) | 67 (20.1%) |
| 35 Years and over | 137 (64.9%) | 74 (35.1%) |
| Total | 6,886 (94.9%) | 370 (5.1%) |
Educational Attainment by Field of Study in Maywood
Education (229 | 15.8%), social sciences (226 | 15.5%), physical & health sciences (169 | 11.6%), arts & humanities (158 | 10.9%), and bio, nature & agricultural (144 | 9.9%) are the most common fields of study among 1,454 individuals in Maywood who have obtained a bachelor's degree or higher.
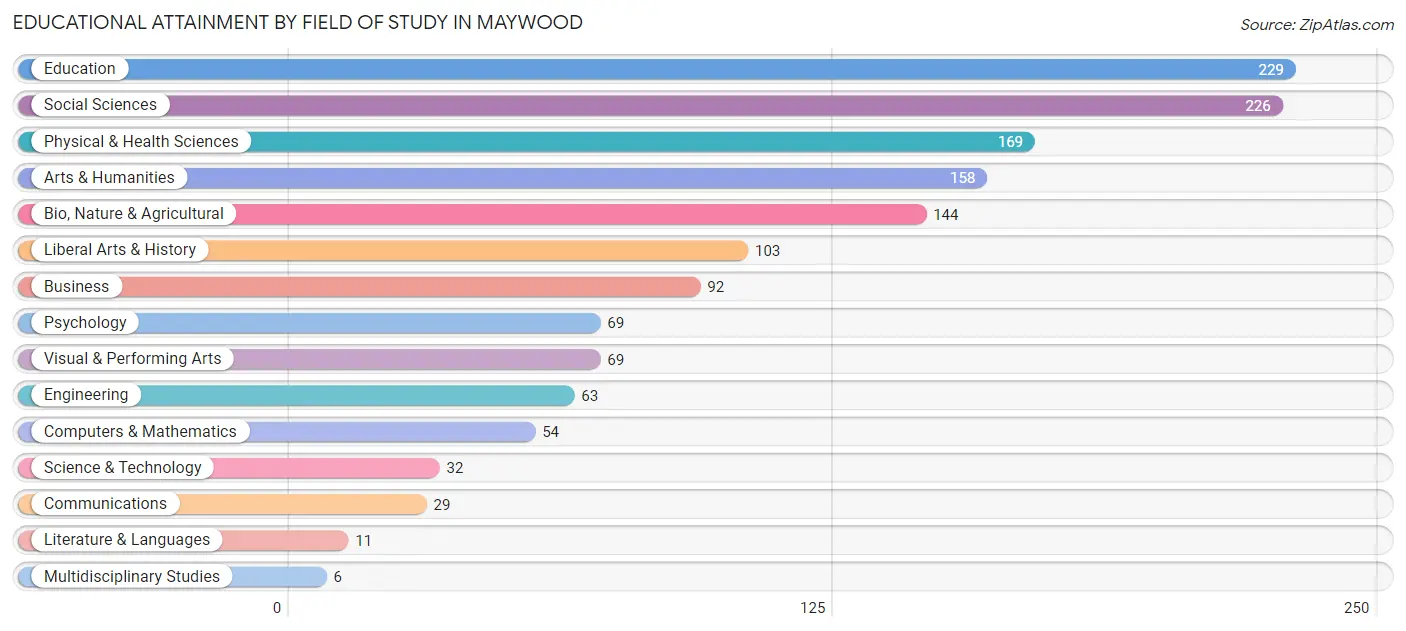
| Field of Study | # Graduates | % Graduates |
| Computers & Mathematics | 54 | 3.7% |
| Bio, Nature & Agricultural | 144 | 9.9% |
| Physical & Health Sciences | 169 | 11.6% |
| Psychology | 69 | 4.8% |
| Social Sciences | 226 | 15.5% |
| Engineering | 63 | 4.3% |
| Multidisciplinary Studies | 6 | 0.4% |
| Science & Technology | 32 | 2.2% |
| Business | 92 | 6.3% |
| Education | 229 | 15.8% |
| Literature & Languages | 11 | 0.8% |
| Liberal Arts & History | 103 | 7.1% |
| Visual & Performing Arts | 69 | 4.8% |
| Communications | 29 | 2.0% |
| Arts & Humanities | 158 | 10.9% |
| Total | 1,454 | 100.0% |
Transportation & Commute in Maywood
Vehicle Availability by Sex in Maywood
The most prevalent vehicle ownership categories in Maywood are males with 2 vehicles (2,478, accounting for 36.4%) and females with 2 vehicles (1,405, making up 56.4%).
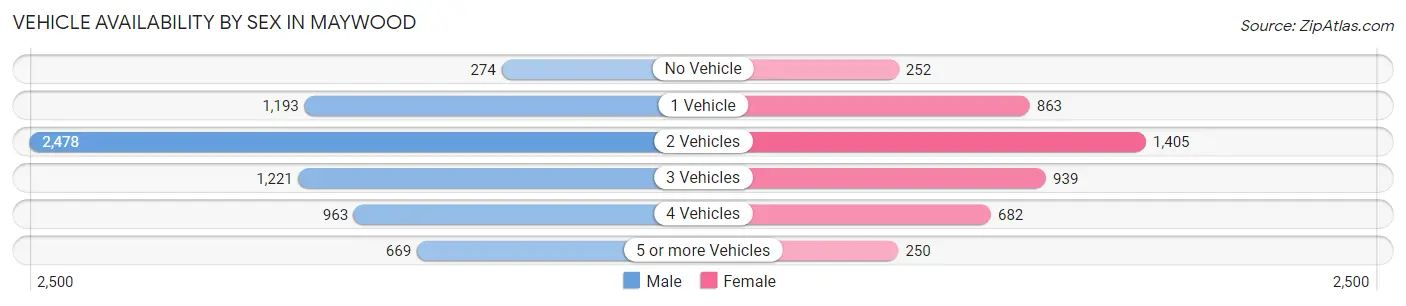
| Vehicles Available | Male | Female |
| No Vehicle | 274 (4.0%) | 252 (5.7%) |
| 1 Vehicle | 1,193 (17.5%) | 863 (19.7%) |
| 2 Vehicles | 2,478 (36.4%) | 1,405 (32.0%) |
| 3 Vehicles | 1,221 (18.0%) | 939 (21.4%) |
| 4 Vehicles | 963 (14.2%) | 682 (15.5%) |
| 5 or more Vehicles | 669 (9.8%) | 250 (5.7%) |
| Total | 6,798 (100.0%) | 4,391 (100.0%) |
Commute Time in Maywood
The most frequently occuring commute durations in Maywood are 30 to 34 minutes (2,073 commuters, 19.4%), 15 to 19 minutes (1,478 commuters, 13.8%), and 20 to 24 minutes (1,462 commuters, 13.7%).
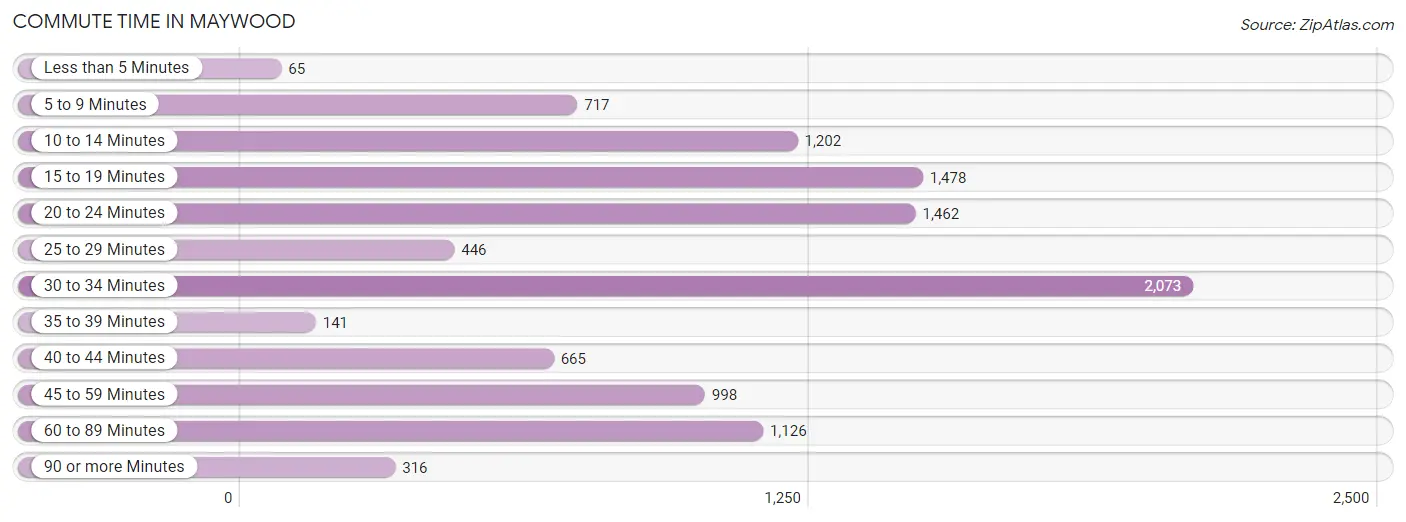
| Commute Time | # Commuters | % Commuters |
| Less than 5 Minutes | 65 | 0.6% |
| 5 to 9 Minutes | 717 | 6.7% |
| 10 to 14 Minutes | 1,202 | 11.3% |
| 15 to 19 Minutes | 1,478 | 13.8% |
| 20 to 24 Minutes | 1,462 | 13.7% |
| 25 to 29 Minutes | 446 | 4.2% |
| 30 to 34 Minutes | 2,073 | 19.4% |
| 35 to 39 Minutes | 141 | 1.3% |
| 40 to 44 Minutes | 665 | 6.2% |
| 45 to 59 Minutes | 998 | 9.3% |
| 60 to 89 Minutes | 1,126 | 10.5% |
| 90 or more Minutes | 316 | 3.0% |
Commute Time by Sex in Maywood
The most common commute times in Maywood are 30 to 34 minutes (1,443 commuters, 21.9%) for males and 20 to 24 minutes (688 commuters, 16.8%) for females.
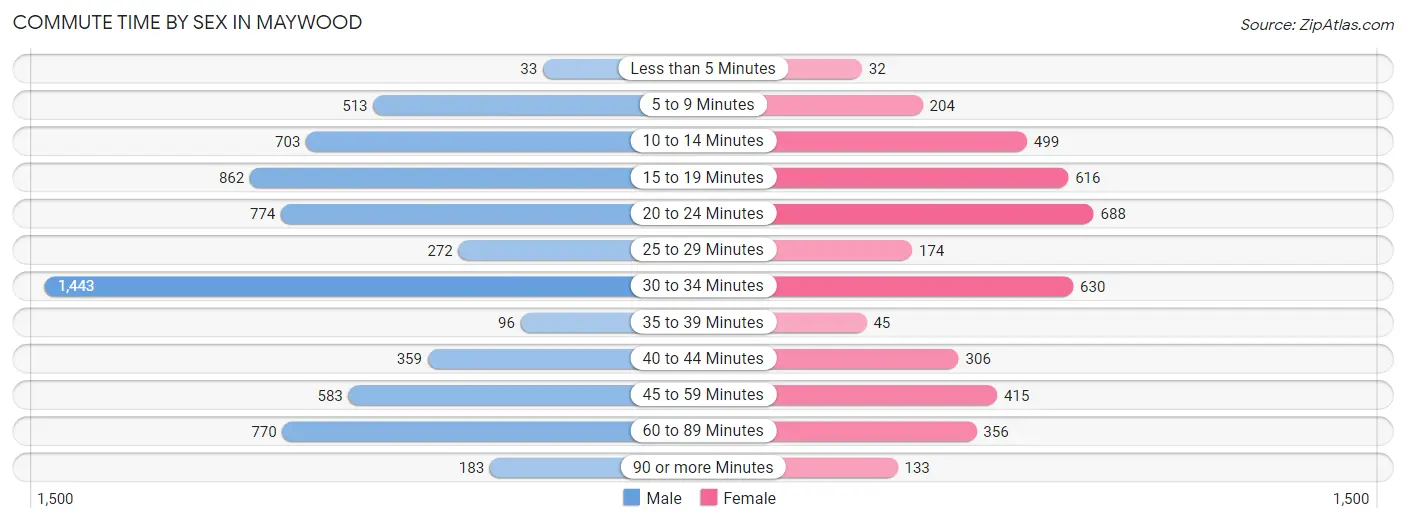
| Commute Time | Male | Female |
| Less than 5 Minutes | 33 (0.5%) | 32 (0.8%) |
| 5 to 9 Minutes | 513 (7.8%) | 204 (5.0%) |
| 10 to 14 Minutes | 703 (10.7%) | 499 (12.2%) |
| 15 to 19 Minutes | 862 (13.1%) | 616 (15.0%) |
| 20 to 24 Minutes | 774 (11.7%) | 688 (16.8%) |
| 25 to 29 Minutes | 272 (4.1%) | 174 (4.3%) |
| 30 to 34 Minutes | 1,443 (21.9%) | 630 (15.4%) |
| 35 to 39 Minutes | 96 (1.5%) | 45 (1.1%) |
| 40 to 44 Minutes | 359 (5.4%) | 306 (7.5%) |
| 45 to 59 Minutes | 583 (8.8%) | 415 (10.1%) |
| 60 to 89 Minutes | 770 (11.7%) | 356 (8.7%) |
| 90 or more Minutes | 183 (2.8%) | 133 (3.3%) |
Time of Departure to Work by Sex in Maywood
The most frequent times of departure to work in Maywood are 12:00 AM to 4:59 AM (1,229, 18.6%) for males and 7:00 AM to 7:29 AM (580, 14.1%) for females.
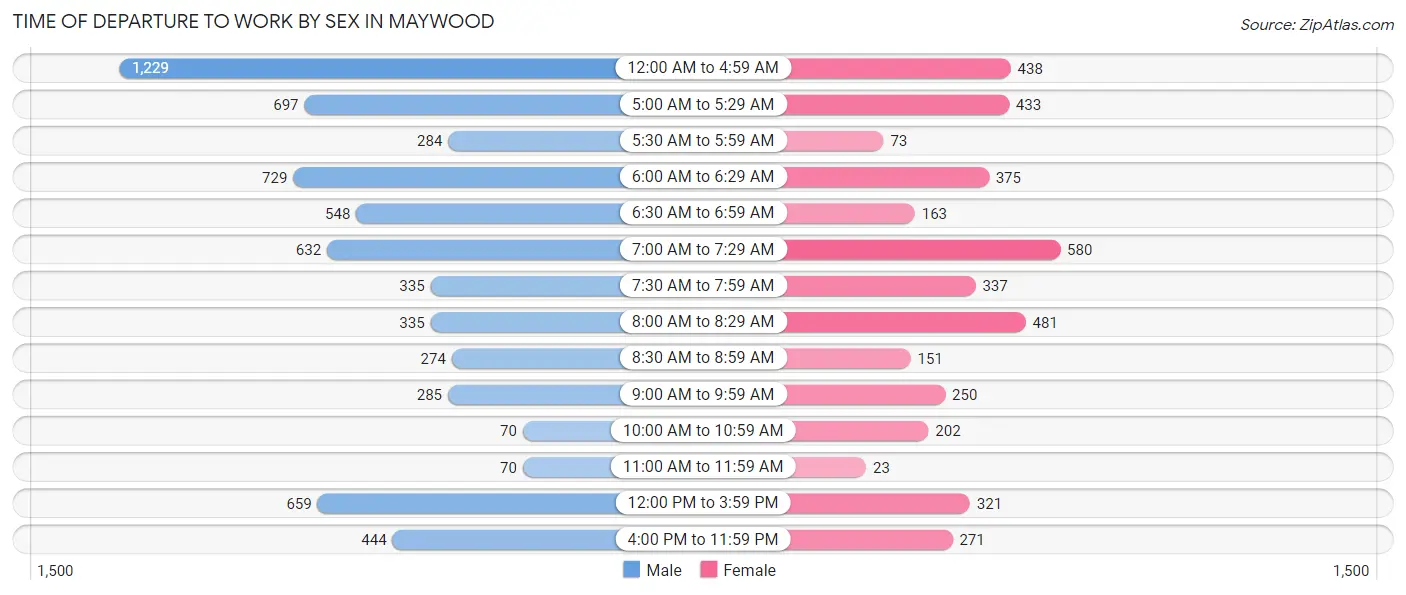
| Time of Departure | Male | Female |
| 12:00 AM to 4:59 AM | 1,229 (18.6%) | 438 (10.7%) |
| 5:00 AM to 5:29 AM | 697 (10.6%) | 433 (10.6%) |
| 5:30 AM to 5:59 AM | 284 (4.3%) | 73 (1.8%) |
| 6:00 AM to 6:29 AM | 729 (11.1%) | 375 (9.1%) |
| 6:30 AM to 6:59 AM | 548 (8.3%) | 163 (4.0%) |
| 7:00 AM to 7:29 AM | 632 (9.6%) | 580 (14.1%) |
| 7:30 AM to 7:59 AM | 335 (5.1%) | 337 (8.2%) |
| 8:00 AM to 8:29 AM | 335 (5.1%) | 481 (11.7%) |
| 8:30 AM to 8:59 AM | 274 (4.2%) | 151 (3.7%) |
| 9:00 AM to 9:59 AM | 285 (4.3%) | 250 (6.1%) |
| 10:00 AM to 10:59 AM | 70 (1.1%) | 202 (4.9%) |
| 11:00 AM to 11:59 AM | 70 (1.1%) | 23 (0.6%) |
| 12:00 PM to 3:59 PM | 659 (10.0%) | 321 (7.8%) |
| 4:00 PM to 11:59 PM | 444 (6.7%) | 271 (6.6%) |
| Total | 6,591 (100.0%) | 4,098 (100.0%) |
Housing Occupancy in Maywood
Occupancy by Ownership in Maywood
Of the total 6,358 dwellings in Maywood, owner-occupied units account for 1,918 (30.2%), while renter-occupied units make up 4,440 (69.8%).
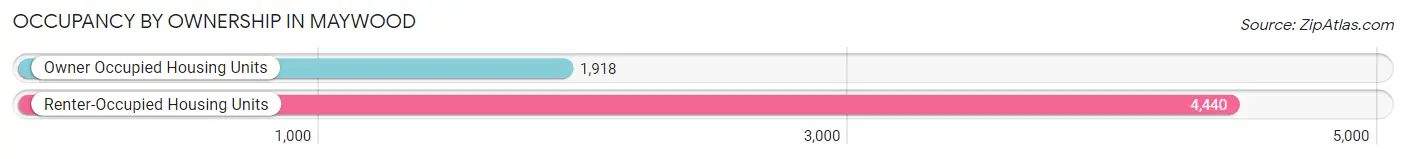
| Occupancy | # Housing Units | % Housing Units |
| Owner Occupied Housing Units | 1,918 | 30.2% |
| Renter-Occupied Housing Units | 4,440 | 69.8% |
| Total Occupied Housing Units | 6,358 | 100.0% |
Occupancy by Household Size in Maywood
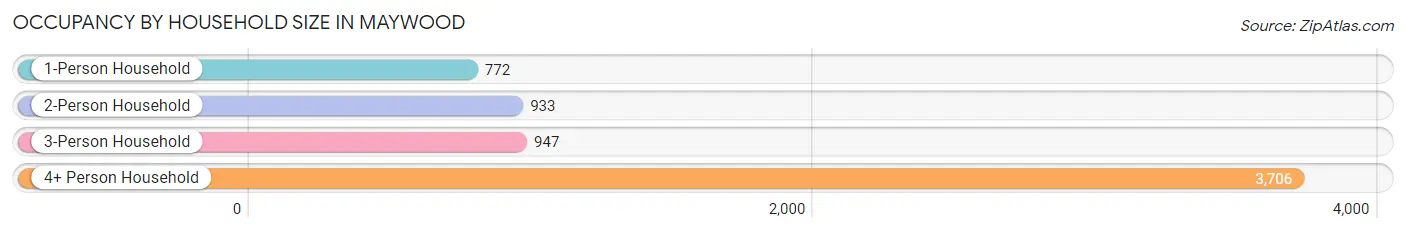
| Household Size | # Housing Units | % Housing Units |
| 1-Person Household | 772 | 12.1% |
| 2-Person Household | 933 | 14.7% |
| 3-Person Household | 947 | 14.9% |
| 4+ Person Household | 3,706 | 58.3% |
| Total Housing Units | 6,358 | 100.0% |
Occupancy by Ownership by Household Size in Maywood
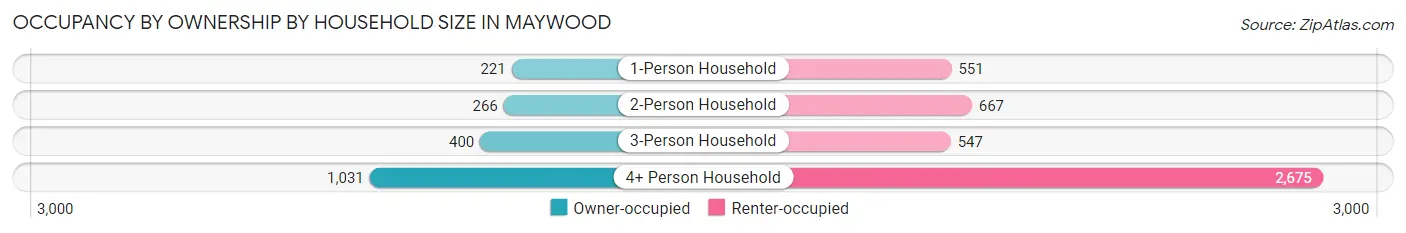
| Household Size | Owner-occupied | Renter-occupied |
| 1-Person Household | 221 (28.6%) | 551 (71.4%) |
| 2-Person Household | 266 (28.5%) | 667 (71.5%) |
| 3-Person Household | 400 (42.2%) | 547 (57.8%) |
| 4+ Person Household | 1,031 (27.8%) | 2,675 (72.2%) |
| Total Housing Units | 1,918 (30.2%) | 4,440 (69.8%) |
Occupancy by Educational Attainment in Maywood
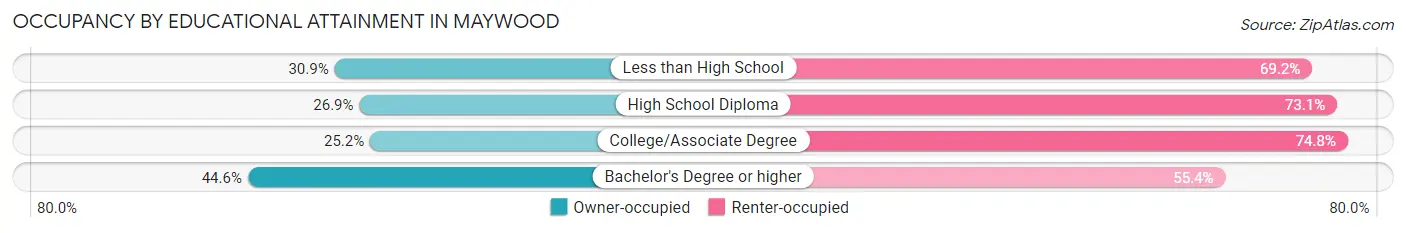
| Household Size | Owner-occupied | Renter-occupied |
| Less than High School | 1,015 (30.8%) | 2,275 (69.2%) |
| High School Diploma | 428 (26.9%) | 1,163 (73.1%) |
| College/Associate Degree | 239 (25.2%) | 709 (74.8%) |
| Bachelor's Degree or higher | 236 (44.6%) | 293 (55.4%) |
Occupancy by Age of Householder in Maywood
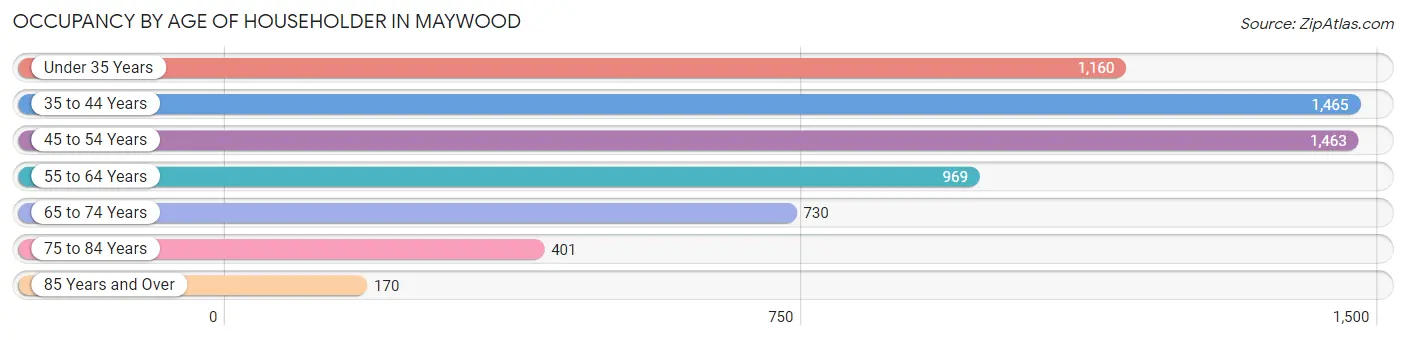
| Age Bracket | # Households | % Households |
| Under 35 Years | 1,160 | 18.2% |
| 35 to 44 Years | 1,465 | 23.0% |
| 45 to 54 Years | 1,463 | 23.0% |
| 55 to 64 Years | 969 | 15.2% |
| 65 to 74 Years | 730 | 11.5% |
| 75 to 84 Years | 401 | 6.3% |
| 85 Years and Over | 170 | 2.7% |
| Total | 6,358 | 100.0% |
Housing Finances in Maywood
Median Income by Occupancy in Maywood
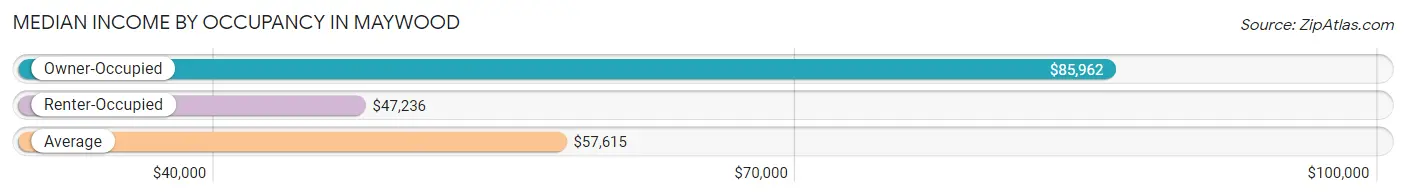
| Occupancy Type | # Households | Median Income |
| Owner-Occupied | 1,918 (30.2%) | $85,962 |
| Renter-Occupied | 4,440 (69.8%) | $47,236 |
| Average | 6,358 (100.0%) | $57,615 |
Occupancy by Householder Income Bracket in Maywood
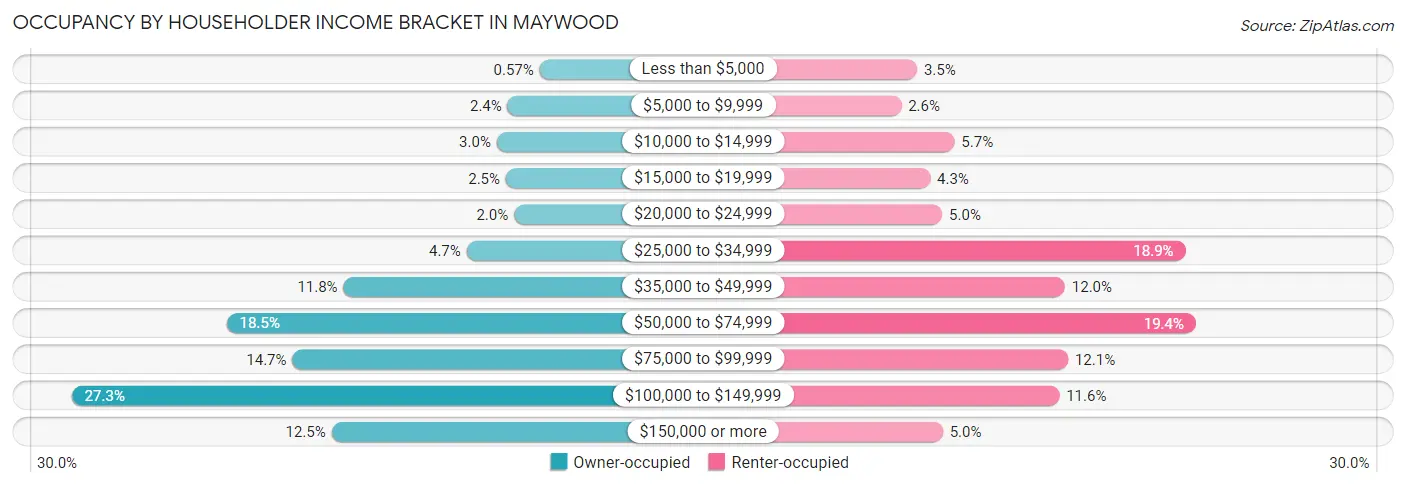
| Income Bracket | Owner-occupied | Renter-occupied |
| Less than $5,000 | 11 (0.6%) | 156 (3.5%) |
| $5,000 to $9,999 | 46 (2.4%) | 116 (2.6%) |
| $10,000 to $14,999 | 58 (3.0%) | 251 (5.7%) |
| $15,000 to $19,999 | 48 (2.5%) | 189 (4.3%) |
| $20,000 to $24,999 | 39 (2.0%) | 220 (5.0%) |
| $25,000 to $34,999 | 91 (4.7%) | 837 (18.9%) |
| $35,000 to $49,999 | 226 (11.8%) | 531 (12.0%) |
| $50,000 to $74,999 | 354 (18.5%) | 863 (19.4%) |
| $75,000 to $99,999 | 282 (14.7%) | 539 (12.1%) |
| $100,000 to $149,999 | 524 (27.3%) | 517 (11.6%) |
| $150,000 or more | 239 (12.5%) | 221 (5.0%) |
| Total | 1,918 (100.0%) | 4,440 (100.0%) |
Monthly Housing Cost Tiers in Maywood
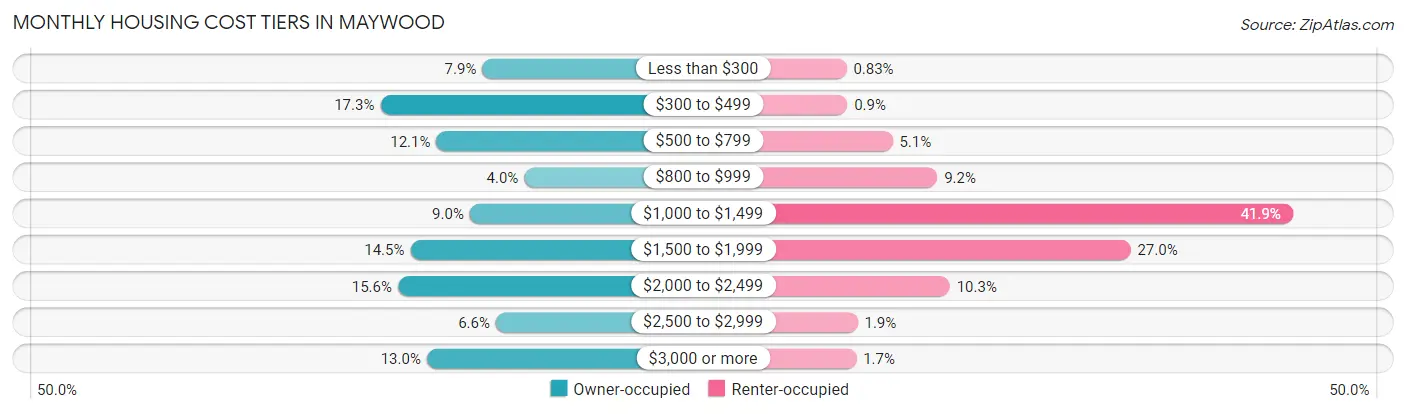
| Monthly Cost | Owner-occupied | Renter-occupied |
| Less than $300 | 151 (7.9%) | 37 (0.8%) |
| $300 to $499 | 331 (17.3%) | 40 (0.9%) |
| $500 to $799 | 232 (12.1%) | 225 (5.1%) |
| $800 to $999 | 77 (4.0%) | 408 (9.2%) |
| $1,000 to $1,499 | 173 (9.0%) | 1,861 (41.9%) |
| $1,500 to $1,999 | 278 (14.5%) | 1,198 (27.0%) |
| $2,000 to $2,499 | 300 (15.6%) | 459 (10.3%) |
| $2,500 to $2,999 | 127 (6.6%) | 82 (1.8%) |
| $3,000 or more | 249 (13.0%) | 77 (1.7%) |
| Total | 1,918 (100.0%) | 4,440 (100.0%) |
Physical Housing Characteristics in Maywood
Housing Structures in Maywood
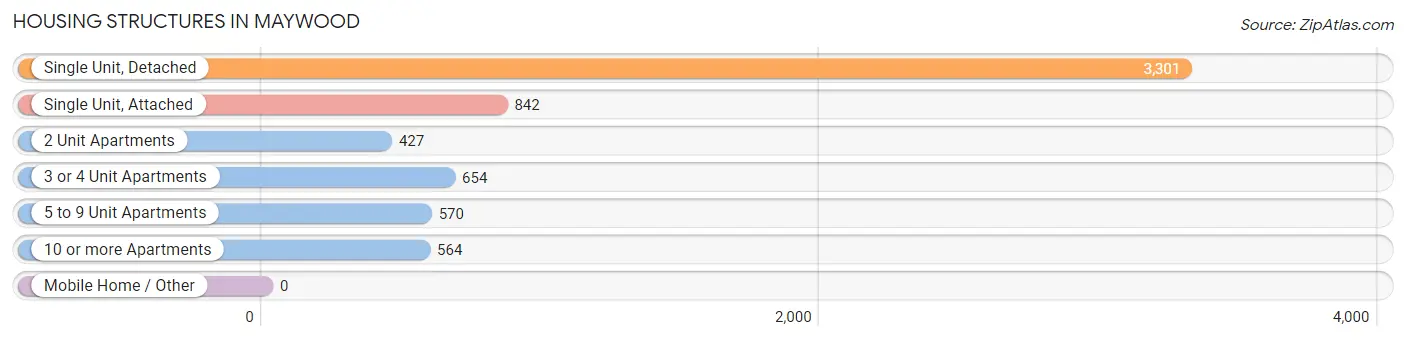
| Structure Type | # Housing Units | % Housing Units |
| Single Unit, Detached | 3,301 | 51.9% |
| Single Unit, Attached | 842 | 13.2% |
| 2 Unit Apartments | 427 | 6.7% |
| 3 or 4 Unit Apartments | 654 | 10.3% |
| 5 to 9 Unit Apartments | 570 | 9.0% |
| 10 or more Apartments | 564 | 8.9% |
| Mobile Home / Other | 0 | 0.0% |
| Total | 6,358 | 100.0% |
Housing Structures by Occupancy in Maywood
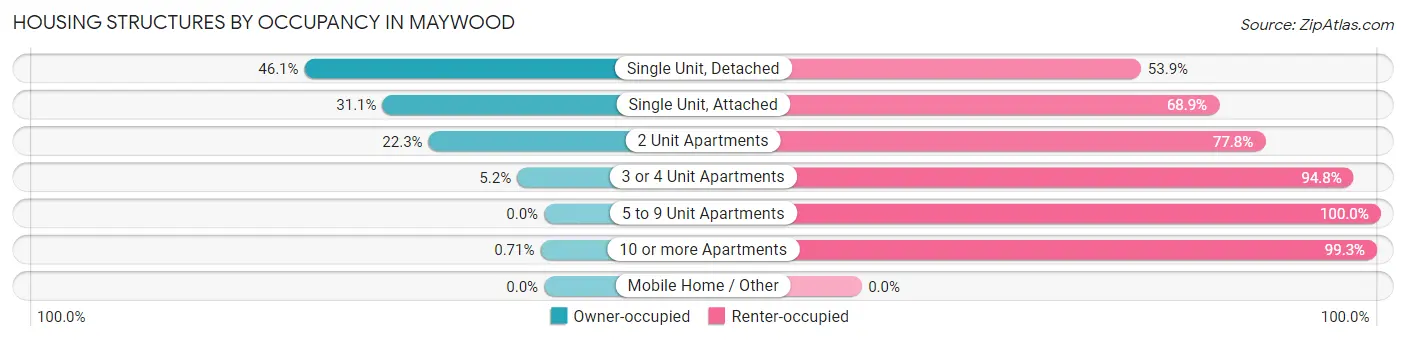
| Structure Type | Owner-occupied | Renter-occupied |
| Single Unit, Detached | 1,523 (46.1%) | 1,778 (53.9%) |
| Single Unit, Attached | 262 (31.1%) | 580 (68.9%) |
| 2 Unit Apartments | 95 (22.3%) | 332 (77.7%) |
| 3 or 4 Unit Apartments | 34 (5.2%) | 620 (94.8%) |
| 5 to 9 Unit Apartments | 0 (0.0%) | 570 (100.0%) |
| 10 or more Apartments | 4 (0.7%) | 560 (99.3%) |
| Mobile Home / Other | 0 (0.0%) | 0 (0.0%) |
| Total | 1,918 (30.2%) | 4,440 (69.8%) |
Housing Structures by Number of Rooms in Maywood
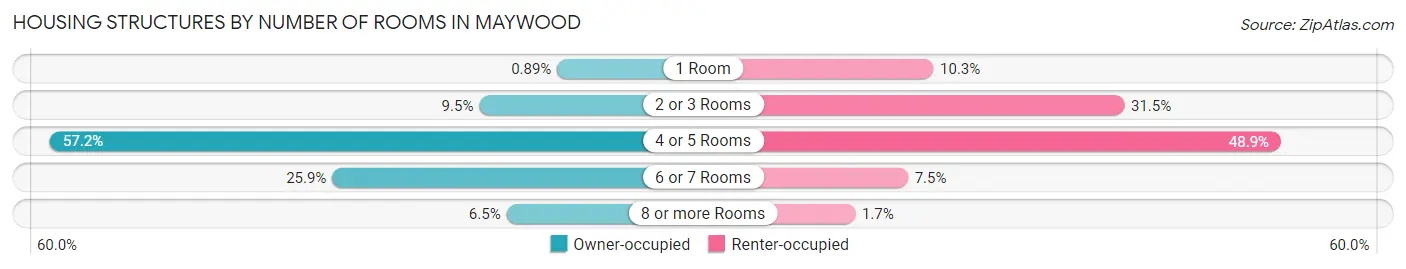
| Number of Rooms | Owner-occupied | Renter-occupied |
| 1 Room | 17 (0.9%) | 459 (10.3%) |
| 2 or 3 Rooms | 183 (9.5%) | 1,400 (31.5%) |
| 4 or 5 Rooms | 1,097 (57.2%) | 2,173 (48.9%) |
| 6 or 7 Rooms | 496 (25.9%) | 334 (7.5%) |
| 8 or more Rooms | 125 (6.5%) | 74 (1.7%) |
| Total | 1,918 (100.0%) | 4,440 (100.0%) |
Housing Structure by Heating Type in Maywood
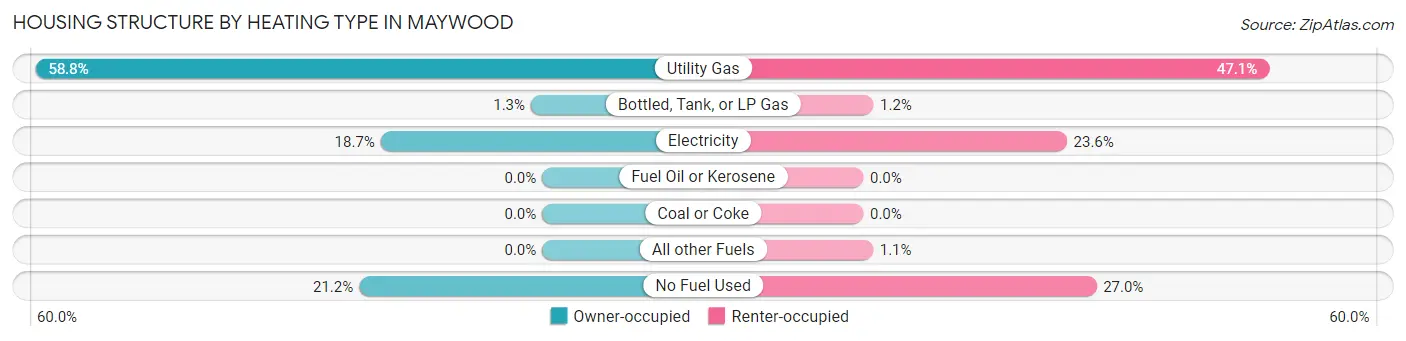
| Heating Type | Owner-occupied | Renter-occupied |
| Utility Gas | 1,127 (58.8%) | 2,090 (47.1%) |
| Bottled, Tank, or LP Gas | 25 (1.3%) | 52 (1.2%) |
| Electricity | 359 (18.7%) | 1,048 (23.6%) |
| Fuel Oil or Kerosene | 0 (0.0%) | 0 (0.0%) |
| Coal or Coke | 0 (0.0%) | 0 (0.0%) |
| All other Fuels | 0 (0.0%) | 50 (1.1%) |
| No Fuel Used | 407 (21.2%) | 1,200 (27.0%) |
| Total | 1,918 (100.0%) | 4,440 (100.0%) |
Household Vehicle Usage in Maywood
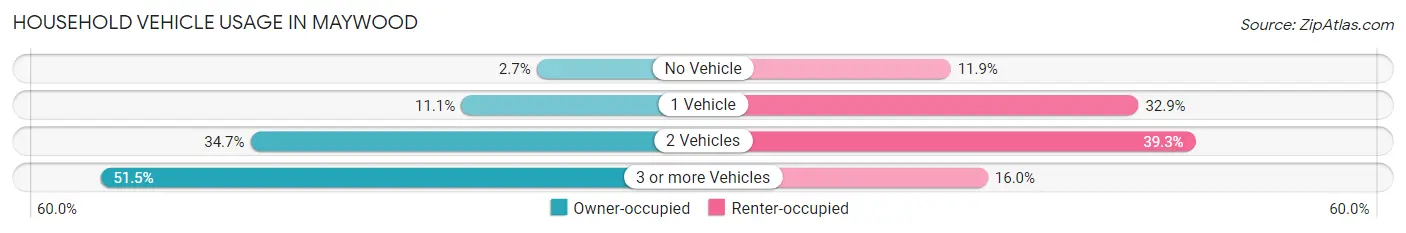
| Vehicles per Household | Owner-occupied | Renter-occupied |
| No Vehicle | 51 (2.7%) | 526 (11.8%) |
| 1 Vehicle | 213 (11.1%) | 1,460 (32.9%) |
| 2 Vehicles | 666 (34.7%) | 1,743 (39.3%) |
| 3 or more Vehicles | 988 (51.5%) | 711 (16.0%) |
| Total | 1,918 (100.0%) | 4,440 (100.0%) |
Real Estate & Mortgages in Maywood
Real Estate and Mortgage Overview in Maywood
| Characteristic | Without Mortgage | With Mortgage |
| Housing Units | 790 | 1,128 |
| Median Property Value | $540,700 | $581,500 |
| Median Household Income | $66,870 | $166 |
| Monthly Housing Costs | $464 | $249 |
| Real Estate Taxes | $3,359 | $21 |
Property Value by Mortgage Status in Maywood
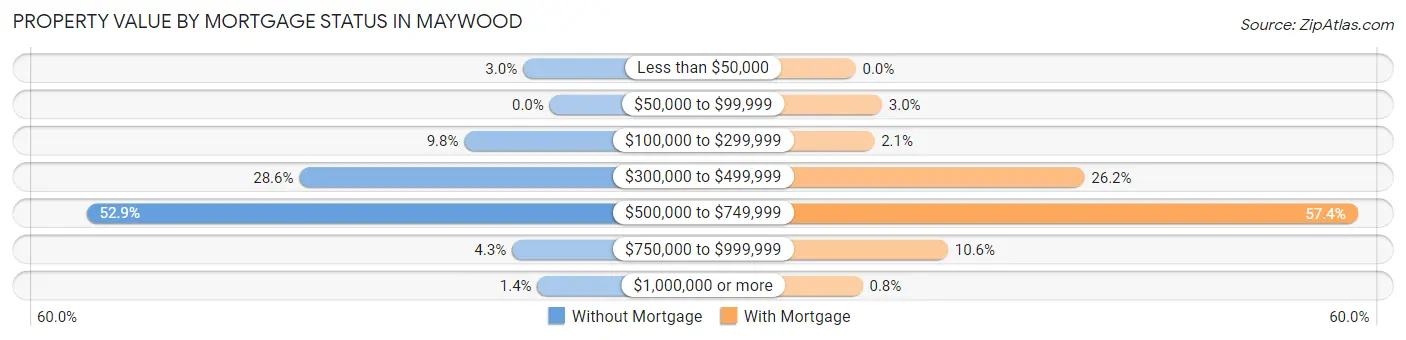
| Property Value | Without Mortgage | With Mortgage |
| Less than $50,000 | 24 (3.0%) | 0 (0.0%) |
| $50,000 to $99,999 | 0 (0.0%) | 34 (3.0%) |
| $100,000 to $299,999 | 77 (9.8%) | 24 (2.1%) |
| $300,000 to $499,999 | 226 (28.6%) | 295 (26.2%) |
| $500,000 to $749,999 | 418 (52.9%) | 647 (57.4%) |
| $750,000 to $999,999 | 34 (4.3%) | 119 (10.5%) |
| $1,000,000 or more | 11 (1.4%) | 9 (0.8%) |
| Total | 790 (100.0%) | 1,128 (100.0%) |
Household Income by Mortgage Status in Maywood
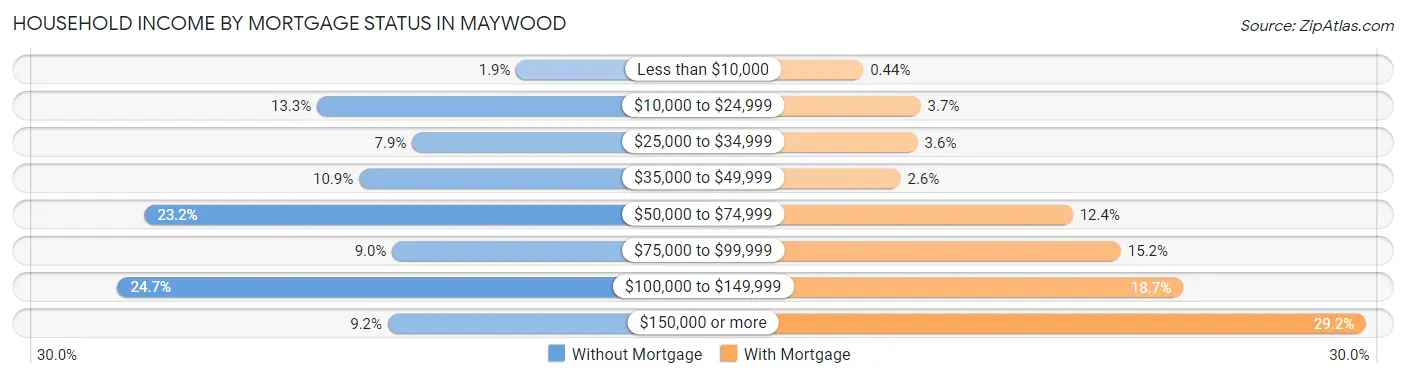
| Household Income | Without Mortgage | With Mortgage |
| Less than $10,000 | 15 (1.9%) | 5 (0.4%) |
| $10,000 to $24,999 | 105 (13.3%) | 42 (3.7%) |
| $25,000 to $34,999 | 62 (7.9%) | 40 (3.5%) |
| $35,000 to $49,999 | 86 (10.9%) | 29 (2.6%) |
| $50,000 to $74,999 | 183 (23.2%) | 140 (12.4%) |
| $75,000 to $99,999 | 71 (9.0%) | 171 (15.2%) |
| $100,000 to $149,999 | 195 (24.7%) | 211 (18.7%) |
| $150,000 or more | 73 (9.2%) | 329 (29.2%) |
| Total | 790 (100.0%) | 1,128 (100.0%) |
Property Value to Household Income Ratio in Maywood
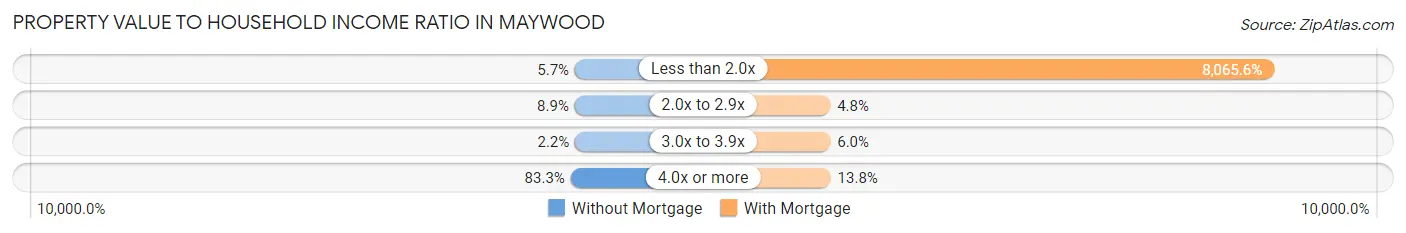
| Value-to-Income Ratio | Without Mortgage | With Mortgage |
| Less than 2.0x | 45 (5.7%) | 90,980 (8,065.6%) |
| 2.0x to 2.9x | 70 (8.9%) | 54 (4.8%) |
| 3.0x to 3.9x | 17 (2.1%) | 68 (6.0%) |
| 4.0x or more | 658 (83.3%) | 156 (13.8%) |
| Total | 790 (100.0%) | 1,128 (100.0%) |
Real Estate Taxes by Mortgage Status in Maywood
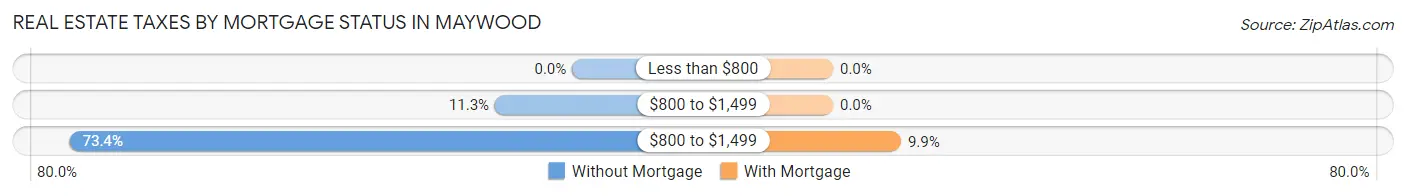
| Property Taxes | Without Mortgage | With Mortgage |
| Less than $800 | 0 (0.0%) | 0 (0.0%) |
| $800 to $1,499 | 89 (11.3%) | 0 (0.0%) |
| $800 to $1,499 | 580 (73.4%) | 112 (9.9%) |
| Total | 790 (100.0%) | 1,128 (100.0%) |
Health & Disability in Maywood
Health Insurance Coverage by Age in Maywood
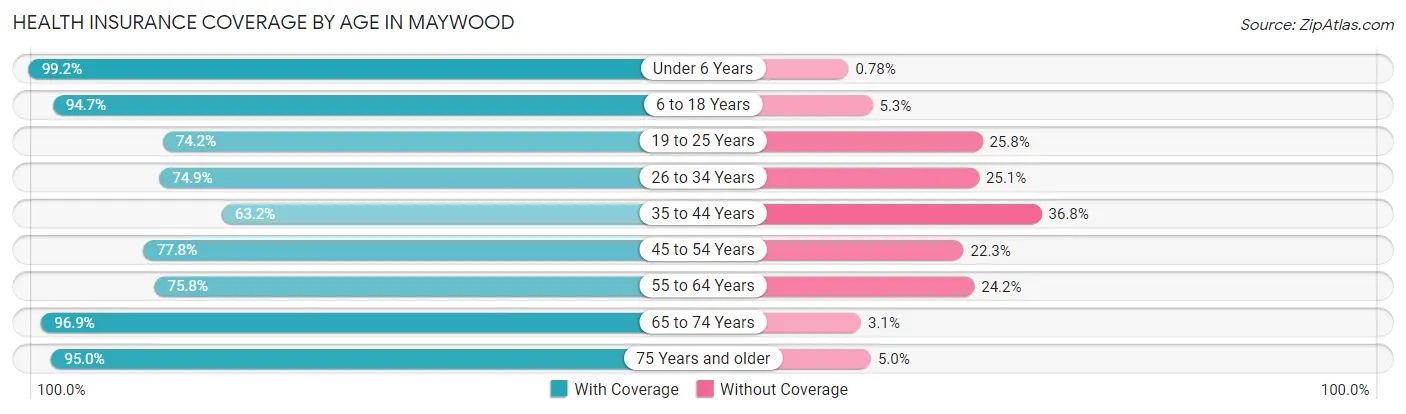
| Age Bracket | With Coverage | Without Coverage |
| Under 6 Years | 1,910 (99.2%) | 15 (0.8%) |
| 6 to 18 Years | 5,133 (94.7%) | 285 (5.3%) |
| 19 to 25 Years | 2,192 (74.2%) | 761 (25.8%) |
| 26 to 34 Years | 2,618 (74.9%) | 879 (25.1%) |
| 35 to 44 Years | 2,078 (63.2%) | 1,210 (36.8%) |
| 45 to 54 Years | 2,499 (77.7%) | 715 (22.3%) |
| 55 to 64 Years | 1,603 (75.8%) | 513 (24.2%) |
| 65 to 74 Years | 1,483 (96.9%) | 48 (3.1%) |
| 75 Years and older | 877 (95.0%) | 46 (5.0%) |
| Total | 20,393 (82.0%) | 4,472 (18.0%) |
Health Insurance Coverage by Citizenship Status in Maywood
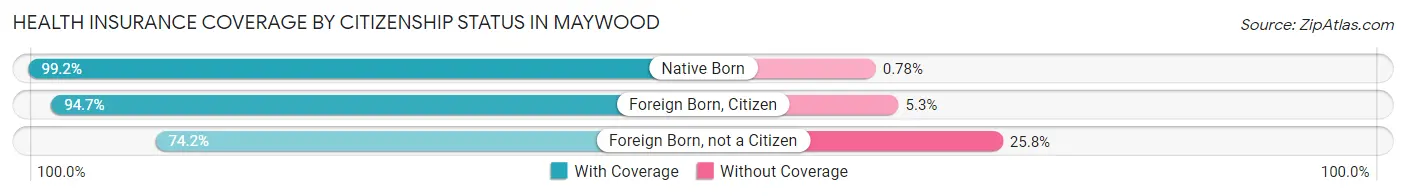
| Citizenship Status | With Coverage | Without Coverage |
| Native Born | 1,910 (99.2%) | 15 (0.8%) |
| Foreign Born, Citizen | 5,133 (94.7%) | 285 (5.3%) |
| Foreign Born, not a Citizen | 2,192 (74.2%) | 761 (25.8%) |
Health Insurance Coverage by Household Income in Maywood
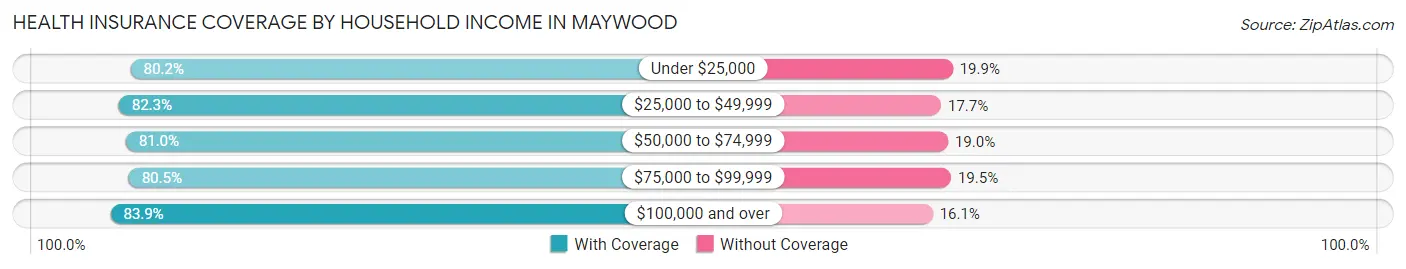
| Household Income | With Coverage | Without Coverage |
| Under $25,000 | 2,399 (80.1%) | 594 (19.9%) |
| $25,000 to $49,999 | 4,873 (82.3%) | 1,045 (17.7%) |
| $50,000 to $74,999 | 3,976 (81.0%) | 930 (19.0%) |
| $75,000 to $99,999 | 2,730 (80.5%) | 662 (19.5%) |
| $100,000 and over | 6,415 (83.9%) | 1,230 (16.1%) |
Public vs Private Health Insurance Coverage by Age in Maywood
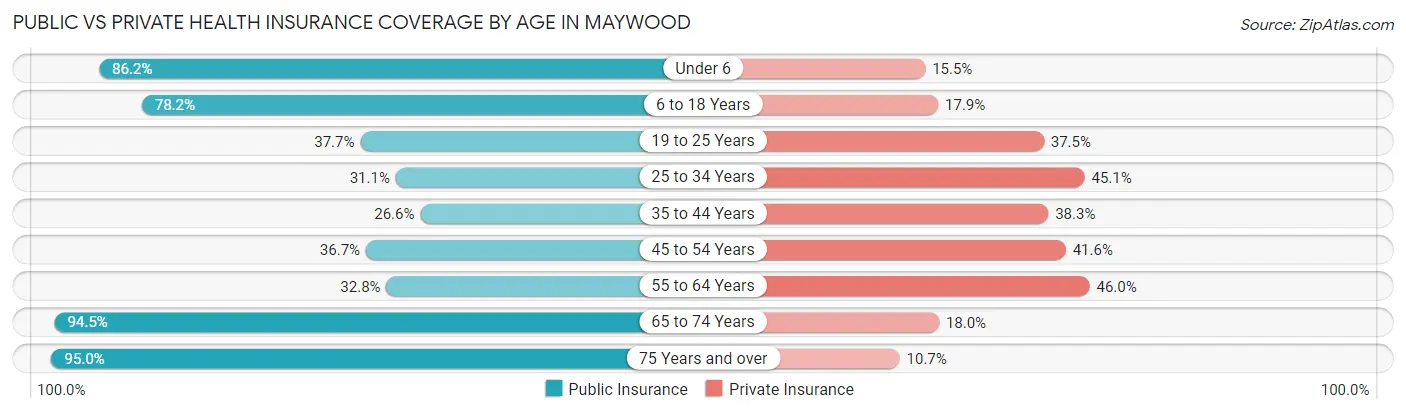
| Age Bracket | Public Insurance | Private Insurance |
| Under 6 | 1,659 (86.2%) | 298 (15.5%) |
| 6 to 18 Years | 4,239 (78.2%) | 969 (17.9%) |
| 19 to 25 Years | 1,113 (37.7%) | 1,107 (37.5%) |
| 25 to 34 Years | 1,088 (31.1%) | 1,576 (45.1%) |
| 35 to 44 Years | 873 (26.6%) | 1,260 (38.3%) |
| 45 to 54 Years | 1,178 (36.6%) | 1,336 (41.6%) |
| 55 to 64 Years | 695 (32.8%) | 973 (46.0%) |
| 65 to 74 Years | 1,446 (94.5%) | 276 (18.0%) |
| 75 Years and over | 877 (95.0%) | 99 (10.7%) |
| Total | 13,168 (53.0%) | 7,894 (31.8%) |
Disability Status by Sex by Age in Maywood
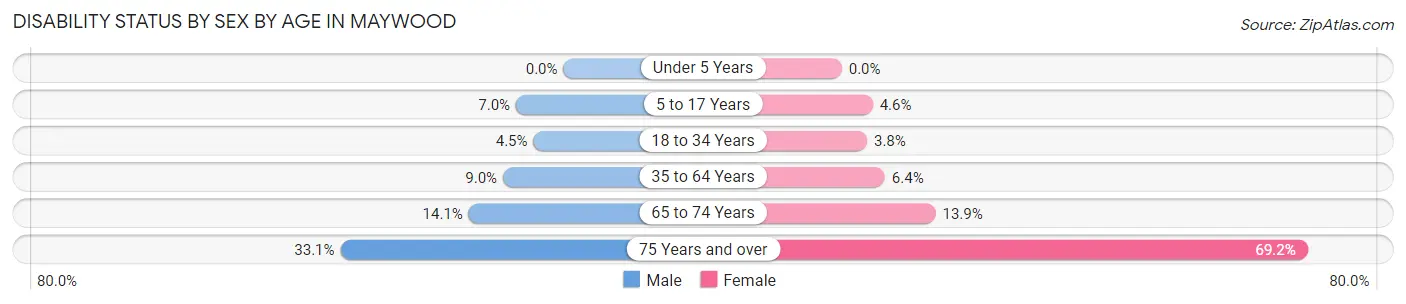
| Age Bracket | Male | Female |
| Under 5 Years | 0 (0.0%) | 0 (0.0%) |
| 5 to 17 Years | 209 (7.0%) | 103 (4.6%) |
| 18 to 34 Years | 159 (4.4%) | 124 (3.7%) |
| 35 to 64 Years | 399 (9.0%) | 267 (6.4%) |
| 65 to 74 Years | 90 (14.1%) | 124 (13.9%) |
| 75 Years and over | 151 (33.1%) | 323 (69.2%) |
Disability Class by Sex by Age in Maywood
Disability Class: Hearing Difficulty
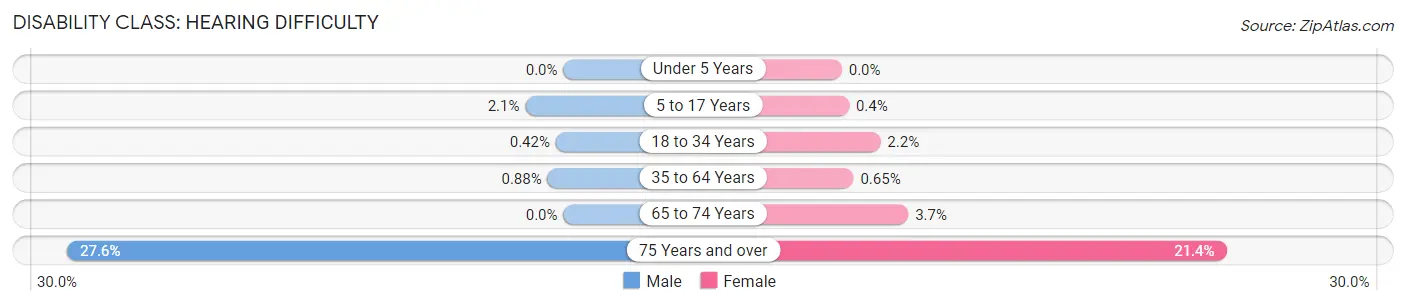
| Age Bracket | Male | Female |
| Under 5 Years | 0 (0.0%) | 0 (0.0%) |
| 5 to 17 Years | 63 (2.1%) | 9 (0.4%) |
| 18 to 34 Years | 15 (0.4%) | 71 (2.1%) |
| 35 to 64 Years | 39 (0.9%) | 27 (0.6%) |
| 65 to 74 Years | 0 (0.0%) | 33 (3.7%) |
| 75 Years and over | 126 (27.6%) | 100 (21.4%) |
Disability Class: Vision Difficulty
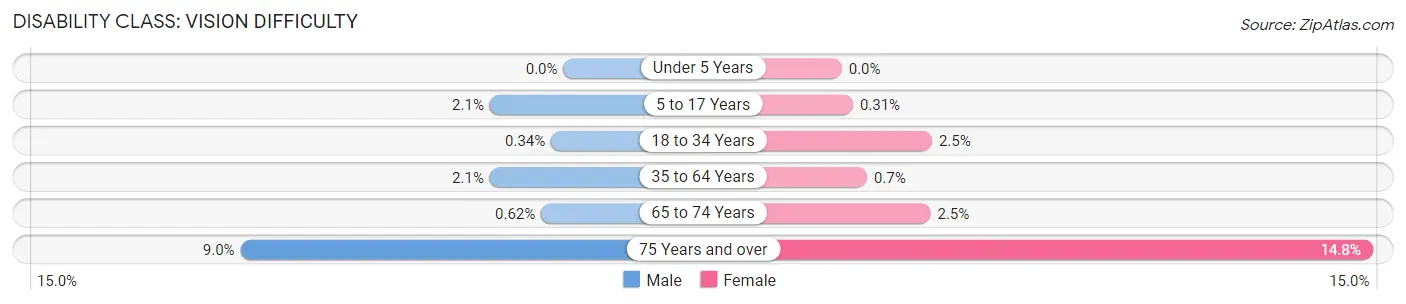
| Age Bracket | Male | Female |
| Under 5 Years | 0 (0.0%) | 0 (0.0%) |
| 5 to 17 Years | 61 (2.1%) | 7 (0.3%) |
| 18 to 34 Years | 12 (0.3%) | 83 (2.5%) |
| 35 to 64 Years | 91 (2.1%) | 29 (0.7%) |
| 65 to 74 Years | 4 (0.6%) | 22 (2.5%) |
| 75 Years and over | 41 (9.0%) | 69 (14.8%) |
Disability Class: Cognitive Difficulty
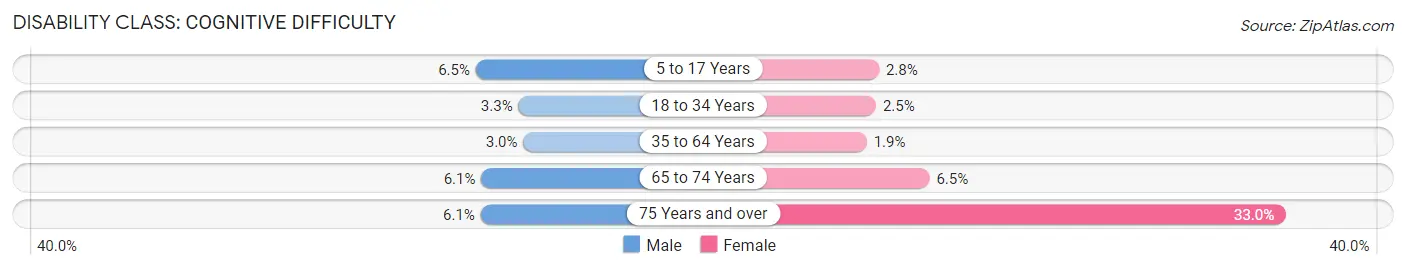
| Age Bracket | Male | Female |
| 5 to 17 Years | 193 (6.5%) | 62 (2.8%) |
| 18 to 34 Years | 119 (3.3%) | 84 (2.5%) |
| 35 to 64 Years | 132 (3.0%) | 77 (1.8%) |
| 65 to 74 Years | 39 (6.1%) | 58 (6.5%) |
| 75 Years and over | 28 (6.1%) | 154 (33.0%) |
Disability Class: Ambulatory Difficulty
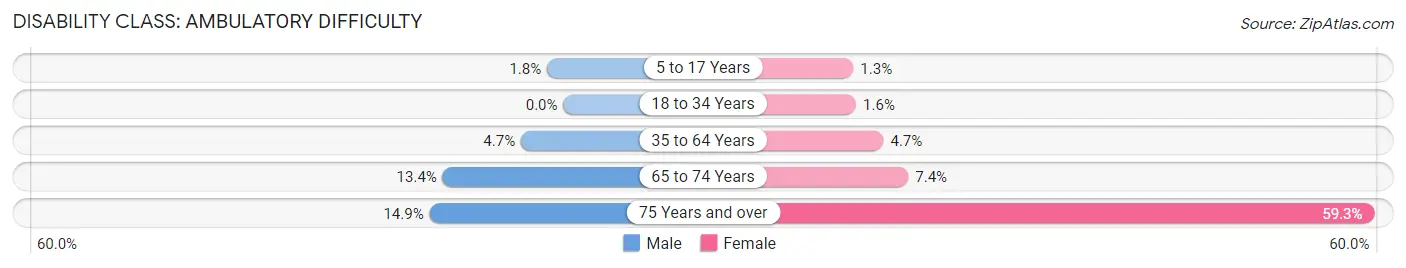
| Age Bracket | Male | Female |
| 5 to 17 Years | 54 (1.8%) | 29 (1.3%) |
| 18 to 34 Years | 0 (0.0%) | 53 (1.6%) |
| 35 to 64 Years | 210 (4.7%) | 194 (4.6%) |
| 65 to 74 Years | 86 (13.4%) | 66 (7.4%) |
| 75 Years and over | 68 (14.9%) | 277 (59.3%) |
Disability Class: Self-Care Difficulty
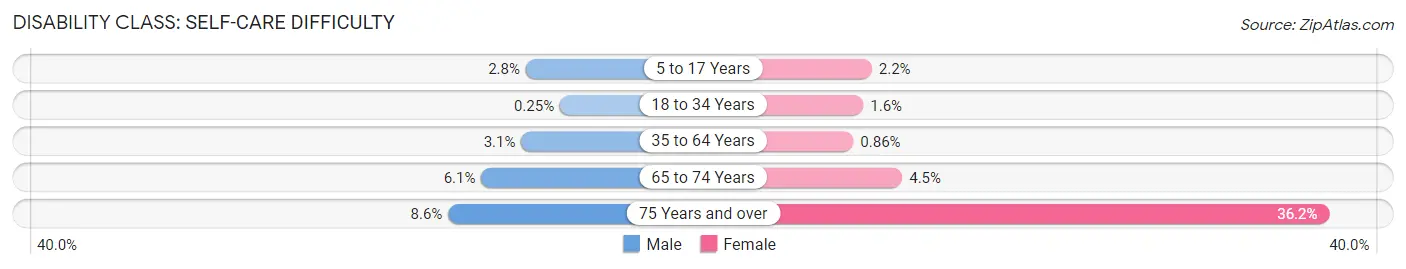
| Age Bracket | Male | Female |
| 5 to 17 Years | 83 (2.8%) | 50 (2.2%) |
| 18 to 34 Years | 9 (0.3%) | 53 (1.6%) |
| 35 to 64 Years | 139 (3.1%) | 36 (0.9%) |
| 65 to 74 Years | 39 (6.1%) | 40 (4.5%) |
| 75 Years and over | 39 (8.6%) | 169 (36.2%) |
Technology Access in Maywood
Computing Device Access in Maywood
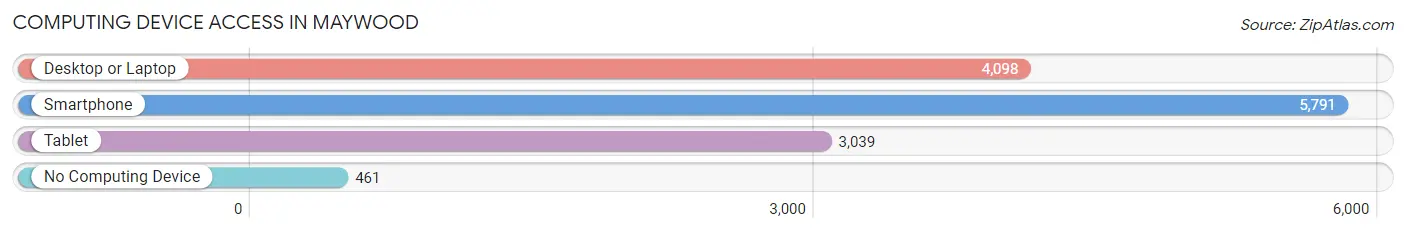
| Device Type | # Households | % Households |
| Desktop or Laptop | 4,098 | 64.4% |
| Smartphone | 5,791 | 91.1% |
| Tablet | 3,039 | 47.8% |
| No Computing Device | 461 | 7.2% |
| Total | 6,358 | 100.0% |
Internet Access in Maywood
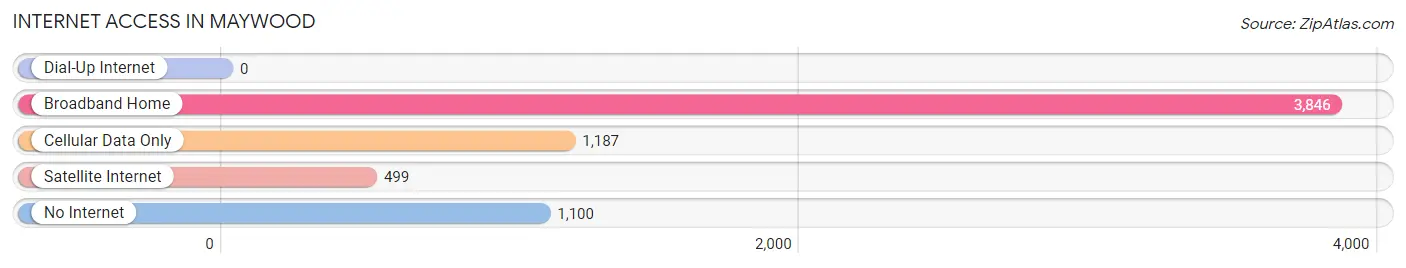
| Internet Type | # Households | % Households |
| Dial-Up Internet | 0 | 0.0% |
| Broadband Home | 3,846 | 60.5% |
| Cellular Data Only | 1,187 | 18.7% |
| Satellite Internet | 499 | 7.9% |
| No Internet | 1,100 | 17.3% |
| Total | 6,358 | 100.0% |
Maywood Summary
Maywood is a small city located in Los Angeles County, California. It is situated just south of the city of Bell and is bordered by the cities of Bell Gardens, Commerce, and Huntington Park. The population of Maywood was 27,395 at the 2010 census, making it the smallest incorporated city in Los Angeles County.
History
Maywood was founded in 1908 by the Maywood Land and Water Company. The company was formed by a group of investors who purchased the land from the Southern Pacific Railroad. The city was named after the Maywood Land and Water Company's president, J.W. May. The city was incorporated in 1924 and was the first city in Los Angeles County to have a mayor-council form of government.
Geography
Maywood is located at 33°58'N 118°13'W (33.967, -118.216). It is situated in the southeastern corner of Los Angeles County, just south of the city of Bell and is bordered by the cities of Bell Gardens, Commerce, and Huntington Park. According to the United States Census Bureau, the city has a total area of 1.9 square miles (4.9 km2), all of it land.
Economy
Maywood is a predominantly residential city, with a small commercial district located along Slauson Avenue. The city is home to several small businesses, including restaurants, auto repair shops, and a few retail stores. The city is also home to several industrial businesses, including a metal fabrication plant, a plastics factory, and a printing company.
Demographics
As of the 2010 census, there were 27,395 people, 8,845 households, and 6,717 families residing in the city. The population density was 14,521.3 people per square mile (5,619.2/km2). There were 9,541 housing units at an average density of 4,976.3 per square mile (1,917.2/km2). The racial makeup of the city was 63.2% White, 4.2% African American, 1.2% Native American, 1.3% Asian, 0.3% Pacific Islander, 27.2% from other races, and 3.6% from two or more races. Hispanic or Latino of any race were 81.7% of the population.
There were 8,845 households, out of which 44.2% had children under the age of 18 living with them, 47.2% were married couples living together, 20.2% had a female householder with no husband present, and 24.2% were non-families. 19.2% of all households were made up of individuals, and 7.2% had someone living alone who was 65 years of age or older. The average household size was 3.08 and the average family size was 3.54.
In the city, the population was spread out, with 30.2% under the age of 18, 11.2% from 18 to 24, 30.2% from 25 to 44, 17.7% from 45 to 64, and 10.7% who were 65 years of age or older. The median age was 30 years. For every 100 females, there were 97.2 males. For every 100 females age 18 and over, there were 94.2 males.
The median income for a household in the city was $33,945, and the median income for a family was $36,813. Males had a median income of $27,845 versus $25,835 for females. The per capita income for the city was $13,922. About 18.2% of families and 20.7% of the population were below the poverty line, including 28.2% of those under age 18 and 11.7% of those age 65 or over.
Common Questions
What is Per Capita Income in Maywood?
Per Capita income in Maywood is $19,236.
What is the Median Family Income in Maywood?
Median Family Income in Maywood is $59,691.
What is the Median Household income in Maywood?
Median Household Income in Maywood is $57,615.
What is Income or Wage Gap in Maywood?
Income or Wage Gap in Maywood is 24.1%.
Women in Maywood earn 75.9 cents for every dollar earned by a man.
What is Family Income Deficit in Maywood?
Family Income Deficit in Maywood is $10,900.
Families that are below poverty line in Maywood earn $10,900 less on average than the poverty threshold level.
What is Inequality or Gini Index in Maywood?
Inequality or Gini Index in Maywood is 0.42.
What is the Total Population of Maywood?
Total Population of Maywood is 25,009.
What is the Total Male Population of Maywood?
Total Male Population of Maywood is 12,952.
What is the Total Female Population of Maywood?
Total Female Population of Maywood is 12,057.
What is the Ratio of Males per 100 Females in Maywood?
There are 107.42 Males per 100 Females in Maywood.
What is the Ratio of Females per 100 Males in Maywood?
There are 93.09 Females per 100 Males in Maywood.
What is the Median Population Age in Maywood?
Median Population Age in Maywood is 31.8 Years.
What is the Average Family Size in Maywood
Average Family Size in Maywood is 4.2 People.
What is the Average Household Size in Maywood
Average Household Size in Maywood is 3.9 People.
How Large is the Labor Force in Maywood?
There are 12,212 People in the Labor Forcein in Maywood.
What is the Percentage of People in the Labor Force in Maywood?
65.0% of People are in the Labor Force in Maywood.
What is the Unemployment Rate in Maywood?
Unemployment Rate in Maywood is 5.6%.