Lee Vining, CA Map & Demographics
Lee Vining Map
Lee Vining Overview
$24,616
PER CAPITA INCOME
$135,017
AVG FAMILY INCOME
$135,017
AVG HOUSEHOLD INCOME
0.17
INEQUALITY / GINI INDEX
594
TOTAL POPULATION
376
MALE POPULATION
218
FEMALE POPULATION
172.48
MALES / 100 FEMALES
57.98
FEMALES / 100 MALES
16.0
MEDIAN AGE
4.0
AVG FAMILY SIZE
4.0
AVG HOUSEHOLD SIZE
261
LABOR FORCE [ PEOPLE ]
88.2%
PERCENT IN LABOR FORCE
12.6%
UNEMPLOYMENT RATE
Lee Vining Zip Codes
Income in Lee Vining
Income Overview in Lee Vining
Per Capita Income in Lee Vining is $24,616, while median incomes of families and households are $135,017 and $135,017 respectively.
| Characteristic | Number | Measure |
| Per Capita Income | 594 | $24,616 |
| Median Family Income | 149 | $135,017 |
| Mean Family Income | 149 | $110,441 |
| Median Household Income | 149 | $135,017 |
| Mean Household Income | 149 | $110,441 |
| Income Deficit | 149 | $0 |
| Wage / Income Gap (%) | 594 | 0.00% |
| Wage / Income Gap ($) | 594 | 100.00¢ per $1 |
| Gini / Inequality Index | 594 | 0.17 |
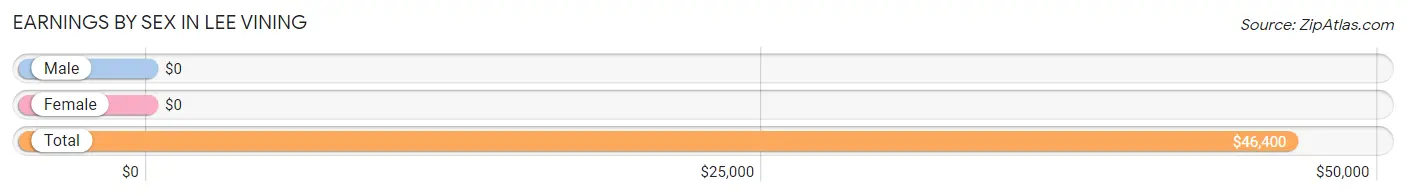
Earnings by Sex in Lee Vining
| Sex | Number | Average Earnings |
| Male | 147 (64.5%) | $0 |
| Female | 81 (35.5%) | $0 |
| Total | 228 (100.0%) | $46,400 |
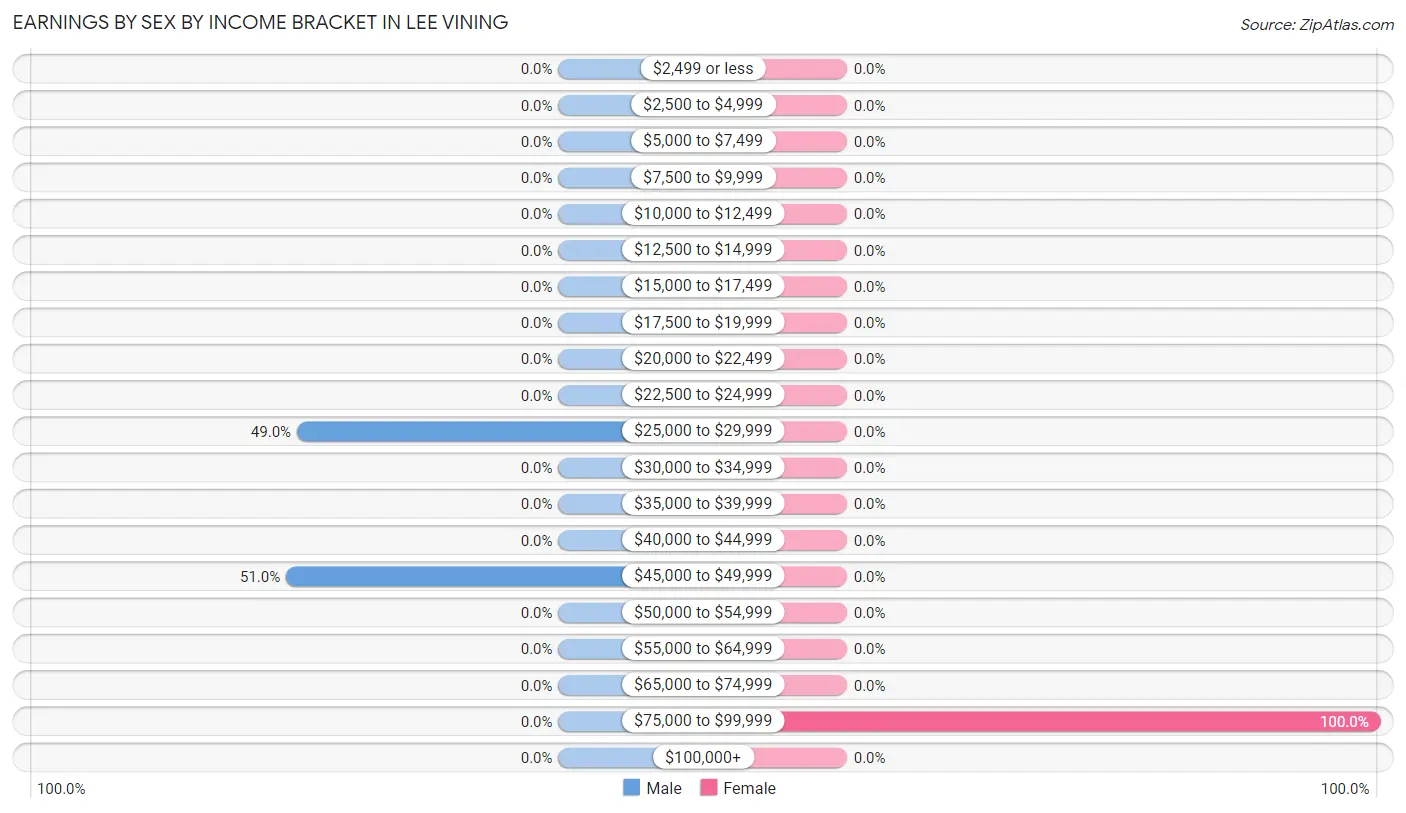
Earnings by Sex by Income Bracket in Lee Vining
The most common earnings brackets in Lee Vining are $45,000 to $49,999 for men (75 | 51.0%) and $75,000 to $99,999 for women (81 | 100.0%).
| Income | Male | Female |
| $2,499 or less | 0 (0.0%) | 0 (0.0%) |
| $2,500 to $4,999 | 0 (0.0%) | 0 (0.0%) |
| $5,000 to $7,499 | 0 (0.0%) | 0 (0.0%) |
| $7,500 to $9,999 | 0 (0.0%) | 0 (0.0%) |
| $10,000 to $12,499 | 0 (0.0%) | 0 (0.0%) |
| $12,500 to $14,999 | 0 (0.0%) | 0 (0.0%) |
| $15,000 to $17,499 | 0 (0.0%) | 0 (0.0%) |
| $17,500 to $19,999 | 0 (0.0%) | 0 (0.0%) |
| $20,000 to $22,499 | 0 (0.0%) | 0 (0.0%) |
| $22,500 to $24,999 | 0 (0.0%) | 0 (0.0%) |
| $25,000 to $29,999 | 72 (49.0%) | 0 (0.0%) |
| $30,000 to $34,999 | 0 (0.0%) | 0 (0.0%) |
| $35,000 to $39,999 | 0 (0.0%) | 0 (0.0%) |
| $40,000 to $44,999 | 0 (0.0%) | 0 (0.0%) |
| $45,000 to $49,999 | 75 (51.0%) | 0 (0.0%) |
| $50,000 to $54,999 | 0 (0.0%) | 0 (0.0%) |
| $55,000 to $64,999 | 0 (0.0%) | 0 (0.0%) |
| $65,000 to $74,999 | 0 (0.0%) | 0 (0.0%) |
| $75,000 to $99,999 | 0 (0.0%) | 81 (100.0%) |
| $100,000+ | 0 (0.0%) | 0 (0.0%) |
| Total | 147 (100.0%) | 81 (100.0%) |
Earnings by Sex by Educational Attainment in Lee Vining
| Educational Attainment | Male Income | Female Income |
| Less than High School | - | - |
| High School Diploma | - | - |
| College or Associate's Degree | - | - |
| Bachelor's Degree | - | - |
| Graduate Degree | - | - |
| Total | - | - |
Family Income in Lee Vining
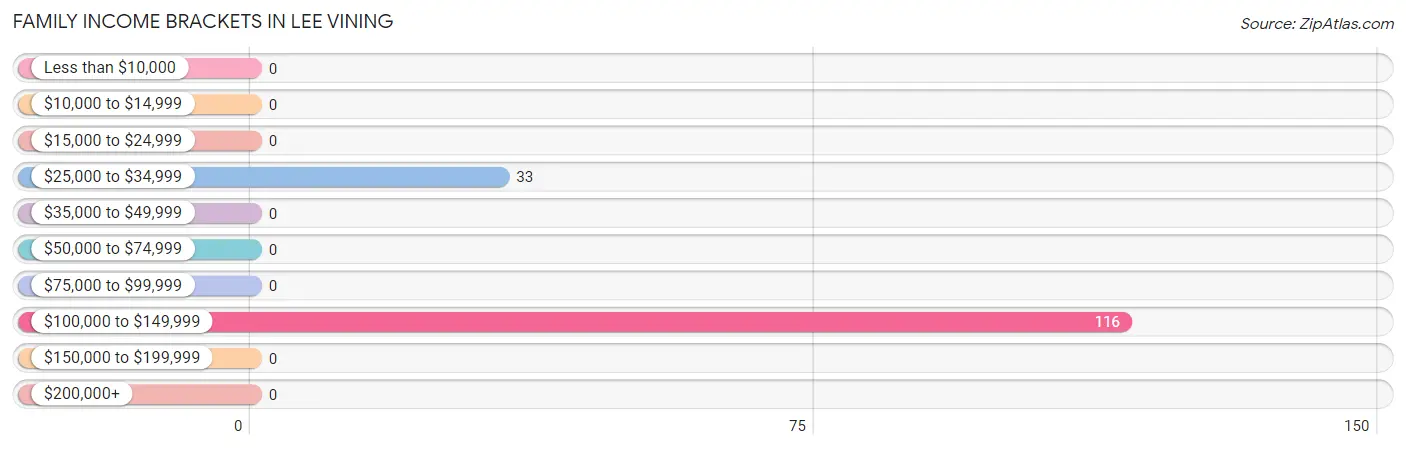
Family Income Brackets in Lee Vining
According to the Lee Vining family income data, there are 116 families falling into the $100,000 to $149,999 income range, which is the most common income bracket and makes up 77.8% of all families.
| Income Bracket | # Families | % Families |
| Less than $10,000 | 0 | 0.0% |
| $10,000 to $14,999 | 0 | 0.0% |
| $15,000 to $24,999 | 0 | 0.0% |
| $25,000 to $34,999 | 33 | 22.1% |
| $35,000 to $49,999 | 0 | 0.0% |
| $50,000 to $74,999 | 0 | 0.0% |
| $75,000 to $99,999 | 0 | 0.0% |
| $100,000 to $149,999 | 116 | 77.9% |
| $150,000 to $199,999 | 0 | 0.0% |
| $200,000+ | 0 | 0.0% |
Family Income by Famaliy Size in Lee Vining
| Income Bracket | # Families | Median Income |
| 2-Person Families | 33 (22.2%) | $0 |
| 3-Person Families | 0 (0.0%) | $0 |
| 4-Person Families | 0 (0.0%) | $0 |
| 5-Person Families | 116 (77.8%) | $0 |
| 6-Person Families | 0 (0.0%) | $0 |
| 7+ Person Families | 0 (0.0%) | $0 |
| Total | 149 (100.0%) | $135,017 |
Family Income by Number of Earners in Lee Vining
| Number of Earners | # Families | Median Income |
| No Earners | 33 (22.2%) | $0 |
| 1 Earner | 0 (0.0%) | $0 |
| 2 Earners | 116 (77.8%) | $0 |
| 3+ Earners | 0 (0.0%) | $0 |
| Total | 149 (100.0%) | $135,017 |
Household Income in Lee Vining
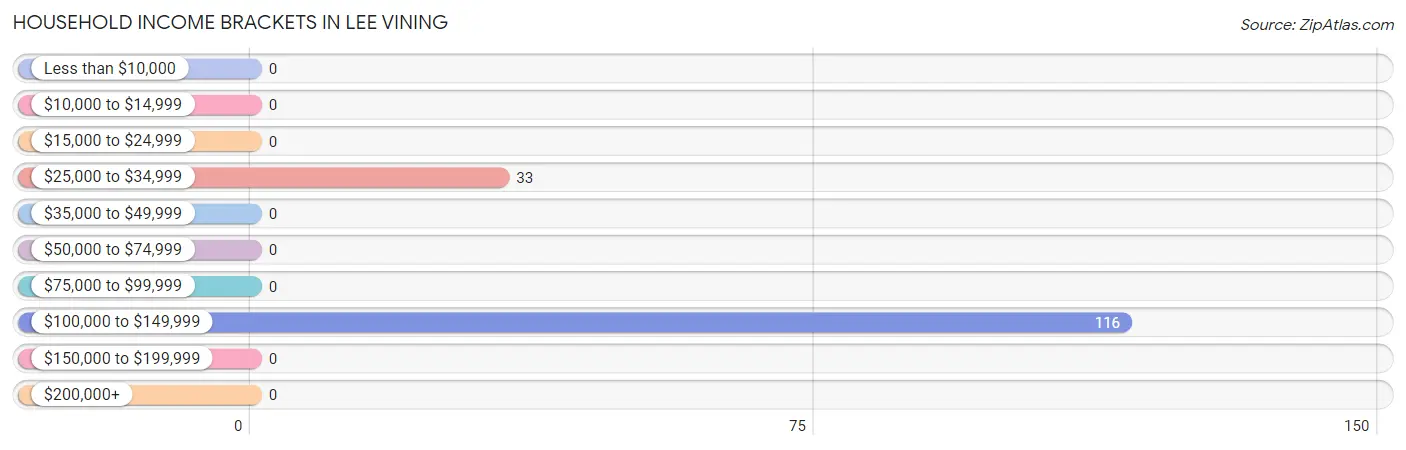
Household Income Brackets in Lee Vining
With 116 households falling in the category, the $100,000 to $149,999 income range is the most frequent in Lee Vining, accounting for 77.8% of all households.
| Income Bracket | # Households | % Households |
| Less than $10,000 | 0 | 0.0% |
| $10,000 to $14,999 | 0 | 0.0% |
| $15,000 to $24,999 | 0 | 0.0% |
| $25,000 to $34,999 | 33 | 22.1% |
| $35,000 to $49,999 | 0 | 0.0% |
| $50,000 to $74,999 | 0 | 0.0% |
| $75,000 to $99,999 | 0 | 0.0% |
| $100,000 to $149,999 | 116 | 77.9% |
| $150,000 to $199,999 | 0 | 0.0% |
| $200,000+ | 0 | 0.0% |
Household Income by Householder Age in Lee Vining
| Income Bracket | # Households | Median Income |
| 15 to 24 Years | 0 (0.0%) | $0 |
| 25 to 44 Years | 33 (22.2%) | $0 |
| 45 to 64 Years | 116 (77.8%) | $0 |
| 65+ Years | 0 (0.0%) | $0 |
| Total | 149 (100.0%) | $135,017 |
Poverty in Lee Vining
Income Below Poverty by Sex and Age in Lee Vining
| Age Bracket | Male | Female |
| Under 5 Years | 0 (0.0%) | 0 (0.0%) |
| 5 Years | 0 (0.0%) | 0 (0.0%) |
| 6 to 11 Years | 0 (0.0%) | 0 (0.0%) |
| 12 to 14 Years | 0 (0.0%) | 0 (0.0%) |
| 15 Years | 0 (0.0%) | 0 (0.0%) |
| 16 and 17 Years | 0 (0.0%) | 0 (0.0%) |
| 18 to 24 Years | 0 (0.0%) | 0 (0.0%) |
| 25 to 34 Years | 0 (0.0%) | 0 (0.0%) |
| 35 to 44 Years | 0 (0.0%) | 0 (0.0%) |
| 45 to 54 Years | 0 (0.0%) | 0 (0.0%) |
| 55 to 64 Years | 0 (0.0%) | 0 (0.0%) |
| 65 to 74 Years | 0 (0.0%) | 0 (0.0%) |
| 75 Years and over | 0 (0.0%) | 0 (0.0%) |
| Total | 0 (0.0%) | 0 (0.0%) |
Income Above Poverty by Sex and Age in Lee Vining
According to the poverty statistics in Lee Vining, males aged 12 to 14 years and females aged 6 to 11 years are the age groups that are most secure financially, with 100.0% of males and 100.0% of females in these age groups living above the poverty line.
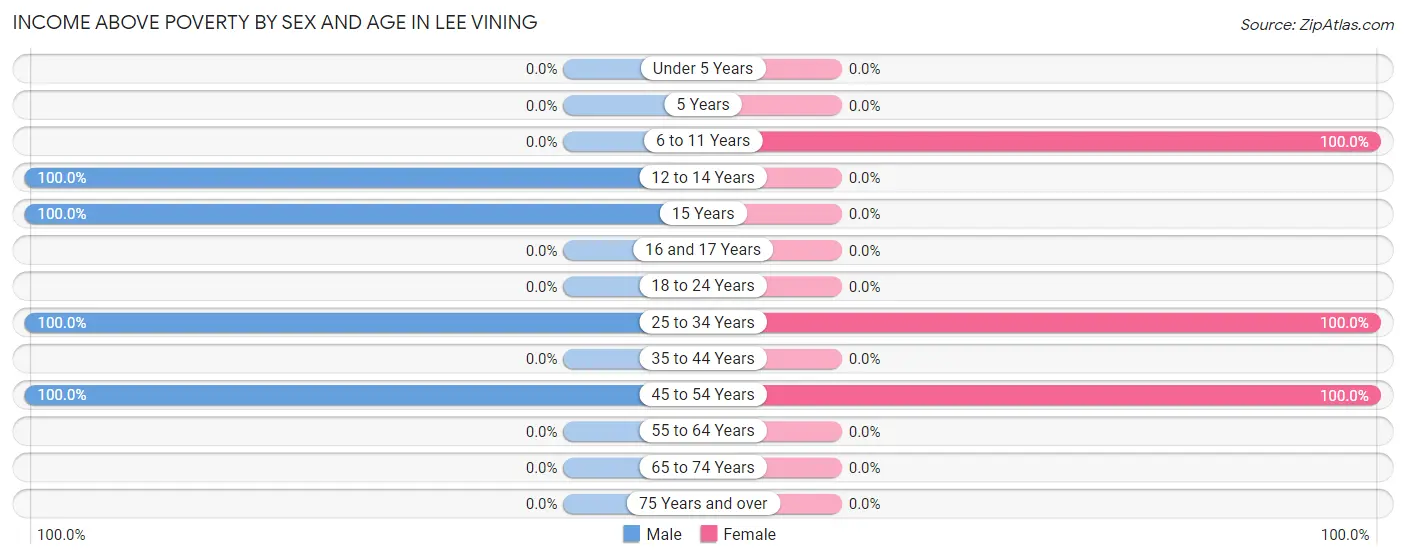
| Age Bracket | Male | Female |
| Under 5 Years | 0 (0.0%) | 0 (0.0%) |
| 5 Years | 0 (0.0%) | 0 (0.0%) |
| 6 to 11 Years | 0 (0.0%) | 102 (100.0%) |
| 12 to 14 Years | 143 (100.0%) | 0 (0.0%) |
| 15 Years | 53 (100.0%) | 0 (0.0%) |
| 16 and 17 Years | 0 (0.0%) | 0 (0.0%) |
| 18 to 24 Years | 0 (0.0%) | 0 (0.0%) |
| 25 to 34 Years | 33 (100.0%) | 35 (100.0%) |
| 35 to 44 Years | 0 (0.0%) | 0 (0.0%) |
| 45 to 54 Years | 147 (100.0%) | 81 (100.0%) |
| 55 to 64 Years | 0 (0.0%) | 0 (0.0%) |
| 65 to 74 Years | 0 (0.0%) | 0 (0.0%) |
| 75 Years and over | 0 (0.0%) | 0 (0.0%) |
| Total | 376 (100.0%) | 218 (100.0%) |
Income Below Poverty Among Married-Couple Families in Lee Vining
| Children | Above Poverty | Below Poverty |
| No Children | 33 (100.0%) | 0 (0.0%) |
| 1 or 2 Children | 0 (0.0%) | 0 (0.0%) |
| 3 or 4 Children | 116 (100.0%) | 0 (0.0%) |
| 5 or more Children | 0 (0.0%) | 0 (0.0%) |
| Total | 149 (100.0%) | 0 (0.0%) |
Income Below Poverty Among Single-Parent Households in Lee Vining
| Children | Single Father | Single Mother |
| No Children | 0 (0.0%) | 0 (0.0%) |
| 1 or 2 Children | 0 (0.0%) | 0 (0.0%) |
| 3 or 4 Children | 0 (0.0%) | 0 (0.0%) |
| 5 or more Children | 0 (0.0%) | 0 (0.0%) |
| Total | 0 (0.0%) | 0 (0.0%) |
Income Below Poverty Among Married-Couple vs Single-Parent Households in Lee Vining
| Children | Married-Couple Families | Single-Parent Households |
| No Children | 0 (0.0%) | 0 (0.0%) |
| 1 or 2 Children | 0 (0.0%) | 0 (0.0%) |
| 3 or 4 Children | 0 (0.0%) | 0 (0.0%) |
| 5 or more Children | 0 (0.0%) | 0 (0.0%) |
| Total | 0 (0.0%) | 0 (0.0%) |
Race in Lee Vining
The most populous races in Lee Vining are White / Caucasian (526 | 88.5%), Hispanic or Latino (281 | 47.3%), and Some other Race (68 | 11.5%).
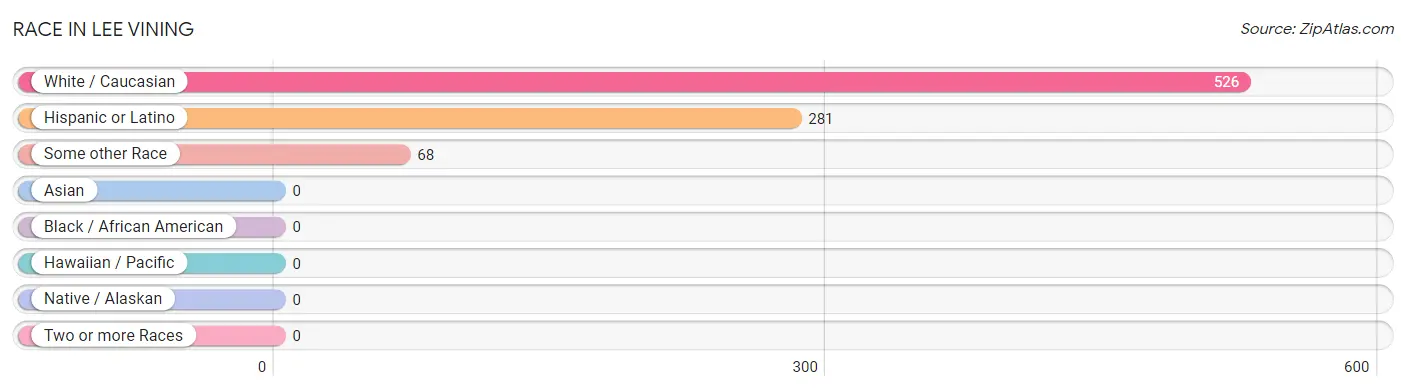
| Race | # Population | % Population |
| Asian | 0 | 0.0% |
| Black / African American | 0 | 0.0% |
| Hawaiian / Pacific | 0 | 0.0% |
| Hispanic or Latino | 281 | 47.3% |
| Native / Alaskan | 0 | 0.0% |
| White / Caucasian | 526 | 88.5% |
| Two or more Races | 0 | 0.0% |
| Some other Race | 68 | 11.5% |
| Total | 594 | 100.0% |
Ancestry in Lee Vining
The most populous ancestries reported in Lee Vining are Irish (319 | 53.7%), and Mexican (281 | 47.3%), together accounting for 101.0% of all Lee Vining residents.
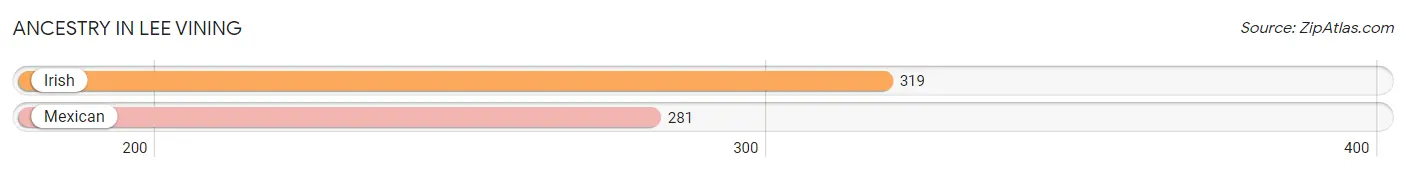
| Ancestry | # Population | % Population |
| Irish | 319 | 53.7% |
| Mexican | 281 | 47.3% | View All 2 Rows |
Immigrants in Lee Vining

| Immigration Origin | # Population | % Population | View All 0 Rows |
Sex and Age in Lee Vining
Sex and Age in Lee Vining
The most populous age groups in Lee Vining are 45 to 49 Years (147 | 39.1%) for men and 5 to 9 Years (102 | 46.8%) for women.
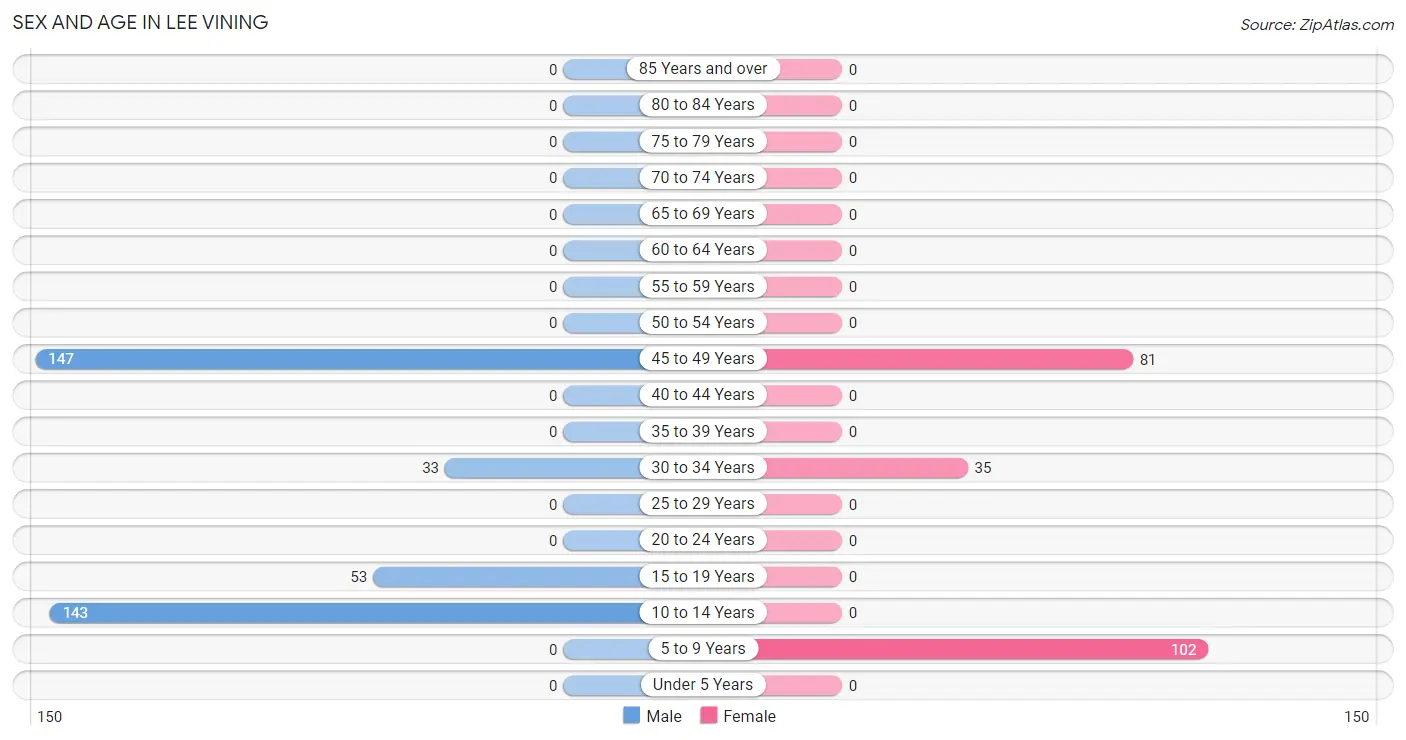
| Age Bracket | Male | Female |
| Under 5 Years | 0 (0.0%) | 0 (0.0%) |
| 5 to 9 Years | 0 (0.0%) | 102 (46.8%) |
| 10 to 14 Years | 143 (38.0%) | 0 (0.0%) |
| 15 to 19 Years | 53 (14.1%) | 0 (0.0%) |
| 20 to 24 Years | 0 (0.0%) | 0 (0.0%) |
| 25 to 29 Years | 0 (0.0%) | 0 (0.0%) |
| 30 to 34 Years | 33 (8.8%) | 35 (16.1%) |
| 35 to 39 Years | 0 (0.0%) | 0 (0.0%) |
| 40 to 44 Years | 0 (0.0%) | 0 (0.0%) |
| 45 to 49 Years | 147 (39.1%) | 81 (37.2%) |
| 50 to 54 Years | 0 (0.0%) | 0 (0.0%) |
| 55 to 59 Years | 0 (0.0%) | 0 (0.0%) |
| 60 to 64 Years | 0 (0.0%) | 0 (0.0%) |
| 65 to 69 Years | 0 (0.0%) | 0 (0.0%) |
| 70 to 74 Years | 0 (0.0%) | 0 (0.0%) |
| 75 to 79 Years | 0 (0.0%) | 0 (0.0%) |
| 80 to 84 Years | 0 (0.0%) | 0 (0.0%) |
| 85 Years and over | 0 (0.0%) | 0 (0.0%) |
| Total | 376 (100.0%) | 218 (100.0%) |
Families and Households in Lee Vining
Median Family Size in Lee Vining
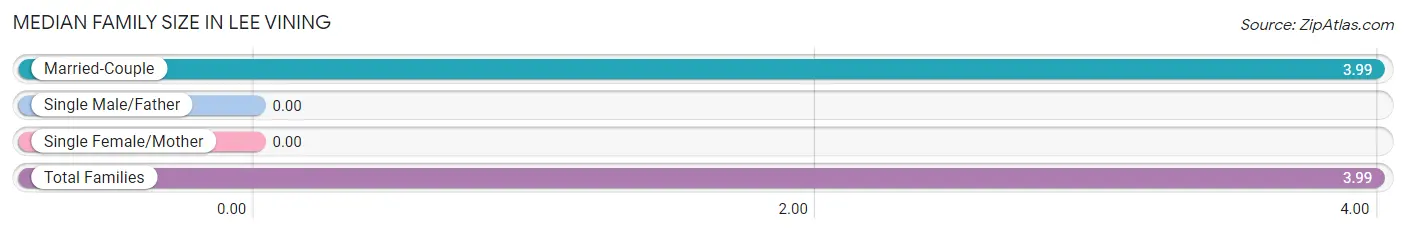
| Family Type | # Families | Family Size |
| Married-Couple | 149 (100.0%) | 3.99 |
| Single Male/Father | 0 (0.0%) | - |
| Single Female/Mother | 0 (0.0%) | - |
| Total Families | 149 (100.0%) | 3.99 |
Median Household Size in Lee Vining
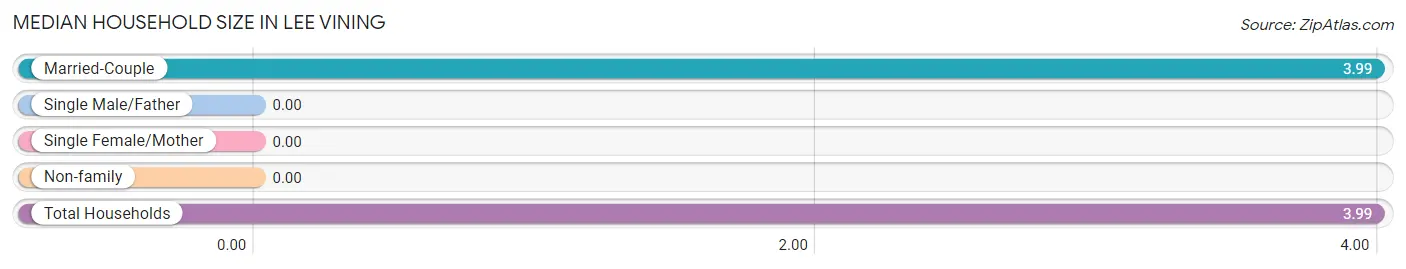
| Household Type | # Households | Household Size |
| Married-Couple | 149 (100.0%) | 3.99 |
| Single Male/Father | 0 (0.0%) | - |
| Single Female/Mother | 0 (0.0%) | - |
| Non-family | 0 (0.0%) | - |
| Total Households | 149 (100.0%) | 3.99 |
Household Size by Marriage Status in Lee Vining
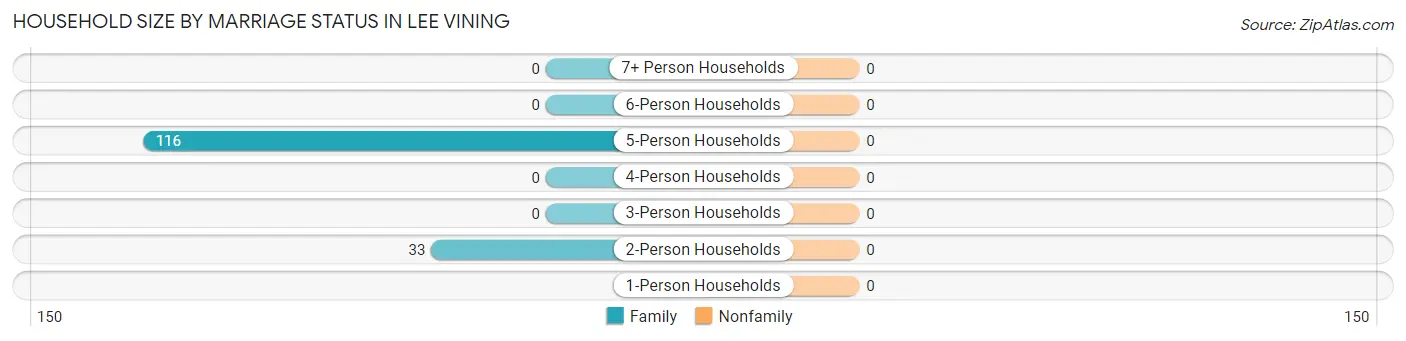
| Household Size | Family Households | Nonfamily Households |
| 1-Person Households | - | 0 (0.0%) |
| 2-Person Households | 33 (22.2%) | 0 (0.0%) |
| 3-Person Households | 0 (0.0%) | 0 (0.0%) |
| 4-Person Households | 0 (0.0%) | 0 (0.0%) |
| 5-Person Households | 116 (77.8%) | 0 (0.0%) |
| 6-Person Households | 0 (0.0%) | 0 (0.0%) |
| 7+ Person Households | 0 (0.0%) | 0 (0.0%) |
| Total | 149 (100.0%) | 0 (0.0%) |
Female Fertility in Lee Vining
Fertility by Age in Lee Vining
| Age Bracket | Women with Births | Births / 1,000 Women |
| 15 to 19 years | 0 (0.0%) | 0.0 |
| 20 to 34 years | 0 (0.0%) | 0.0 |
| 35 to 50 years | 0 (0.0%) | 0.0 |
| Total | 0 (0.0%) | 0.0 |
Fertility by Age by Marriage Status in Lee Vining
| Age Bracket | Married | Unmarried |
| 15 to 19 years | 0 (0.0%) | 0 (0.0%) |
| 20 to 34 years | 0 (0.0%) | 0 (0.0%) |
| 35 to 50 years | 0 (0.0%) | 0 (0.0%) |
| Total | 0 (0.0%) | 0 (0.0%) |
Fertility by Education in Lee Vining
| Educational Attainment | Women with Births | Births / 1,000 Women |
| Less than High School | 0 (0.0%) | 0.0 |
| High School Diploma | 0 (0.0%) | 0.0 |
| College or Associate's Degree | 0 (0.0%) | 0.0 |
| Bachelor's Degree | 0 (0.0%) | 0.0 |
| Graduate Degree | 0 (0.0%) | 0.0 |
| Total | 0 (0.0%) | 0.0 |
Fertility by Education by Marriage Status in Lee Vining
| Educational Attainment | Married | Unmarried |
| Less than High School | 0 (0.0%) | 0 (0.0%) |
| High School Diploma | 0 (0.0%) | 0 (0.0%) |
| College or Associate's Degree | 0 (0.0%) | 0 (0.0%) |
| Bachelor's Degree | 0 (0.0%) | 0 (0.0%) |
| Graduate Degree | 0 (0.0%) | 0 (0.0%) |
| Total | 0 (0.0%) | 0 (0.0%) |
Employment Characteristics in Lee Vining
Employment by Class of Employer in Lee Vining
Among the 228 employed individuals in Lee Vining, local government employees (153 | 67.1%), and self-employed (not incorporated) (75 | 32.9%) make up the most common classes of employment.
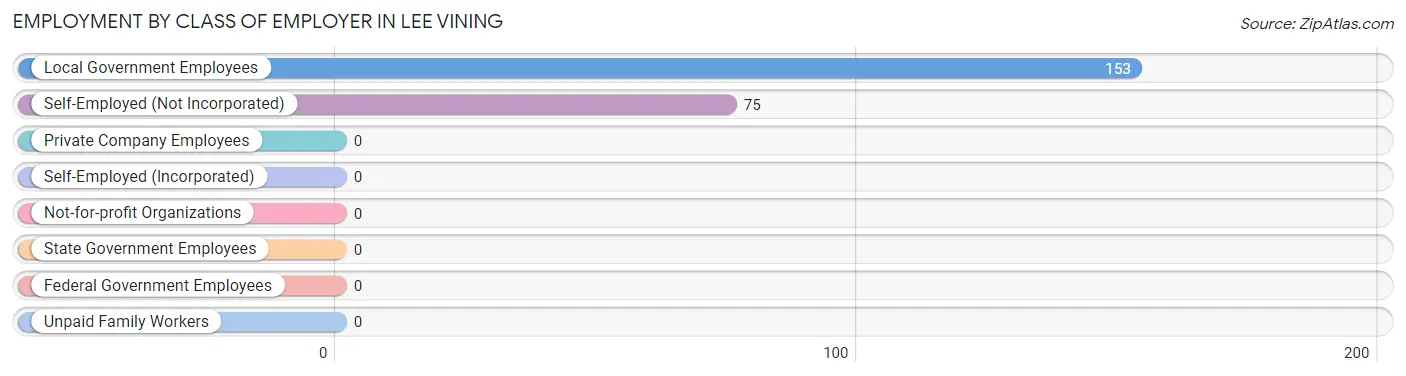
| Employer Class | # Employees | % Employees |
| Private Company Employees | 0 | 0.0% |
| Self-Employed (Incorporated) | 0 | 0.0% |
| Self-Employed (Not Incorporated) | 75 | 32.9% |
| Not-for-profit Organizations | 0 | 0.0% |
| Local Government Employees | 153 | 67.1% |
| State Government Employees | 0 | 0.0% |
| Federal Government Employees | 0 | 0.0% |
| Unpaid Family Workers | 0 | 0.0% |
| Total | 228 | 100.0% |
Employment Status by Age in Lee Vining
According to the labor force statistics for Lee Vining, out of the total population over 16 years of age (296), 88.2% or 261 individuals are in the labor force, with 12.6% or 33 of them unemployed. The age group with the highest labor force participation rate is 45 to 54 years, with 100.0% or 228 individuals in the labor force. Within the labor force, the 30 to 34 years age range has the highest percentage of unemployed individuals, with 100.0% or 33 of them being unemployed.
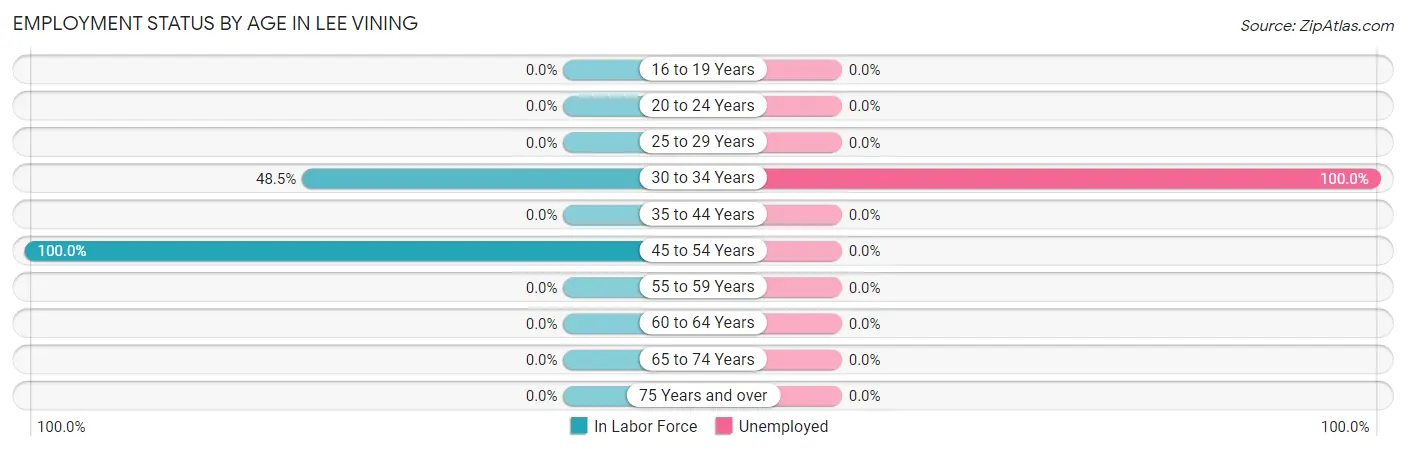
| Age Bracket | In Labor Force | Unemployed |
| 16 to 19 Years | 0 (0.0%) | 0 (0.0%) |
| 20 to 24 Years | 0 (0.0%) | 0 (0.0%) |
| 25 to 29 Years | 0 (0.0%) | 0 (0.0%) |
| 30 to 34 Years | 33 (48.5%) | 33 (100.0%) |
| 35 to 44 Years | 0 (0.0%) | 0 (0.0%) |
| 45 to 54 Years | 228 (100.0%) | 0 (0.0%) |
| 55 to 59 Years | 0 (0.0%) | 0 (0.0%) |
| 60 to 64 Years | 0 (0.0%) | 0 (0.0%) |
| 65 to 74 Years | 0 (0.0%) | 0 (0.0%) |
| 75 Years and over | 0 (0.0%) | 0 (0.0%) |
| Total | 261 (88.2%) | 33 (12.6%) |
Employment Status by Educational Attainment in Lee Vining
According to labor force statistics for Lee Vining, 88.2% of individuals (261) out of the total population between 25 and 64 years of age (296) are in the labor force, with 12.6% or 33 of them being unemployed. The group with the highest labor force participation rate are those with the educational attainment of bachelor's degree or higher, with 100.0% or 228 individuals in the labor force. Within the labor force, individuals with college / associate degree education have the highest percentage of unemployment, with 100.0% or 33 of them being unemployed.
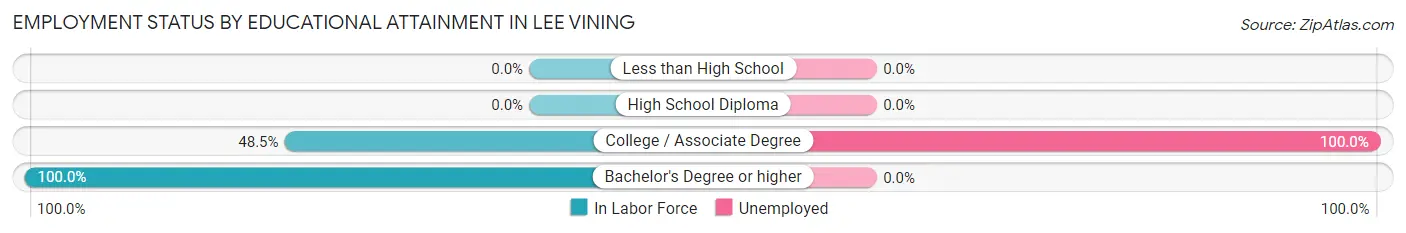
| Educational Attainment | In Labor Force | Unemployed |
| Less than High School | 0 (0.0%) | 0 (0.0%) |
| High School Diploma | 0 (0.0%) | 0 (0.0%) |
| College / Associate Degree | 33 (48.5%) | 68 (100.0%) |
| Bachelor's Degree or higher | 228 (100.0%) | 0 (0.0%) |
| Total | 261 (88.2%) | 37 (12.6%) |
Employment Occupations by Sex in Lee Vining
Management, Business, Science and Arts Occupations
The most common Management, Business, Science and Arts occupations in Lee Vining are Community & Social Service (81 | 35.5%), Education Instruction & Library (81 | 35.5%), and Management (75 | 32.9%).
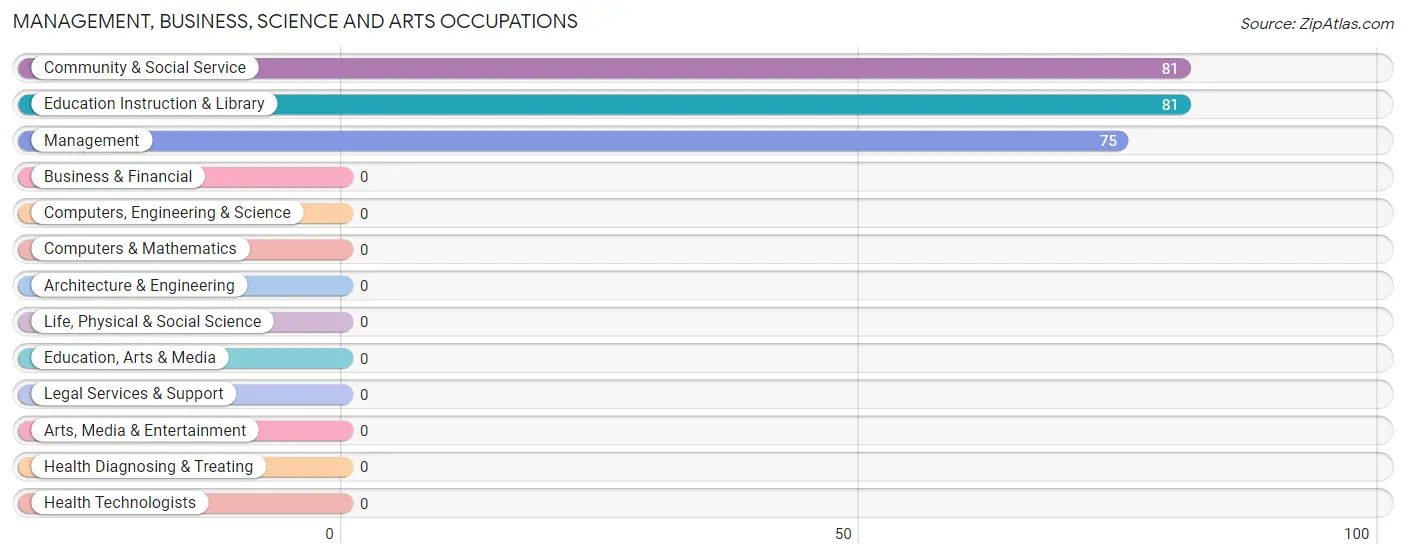
Management, Business, Science and Arts Occupations by Sex
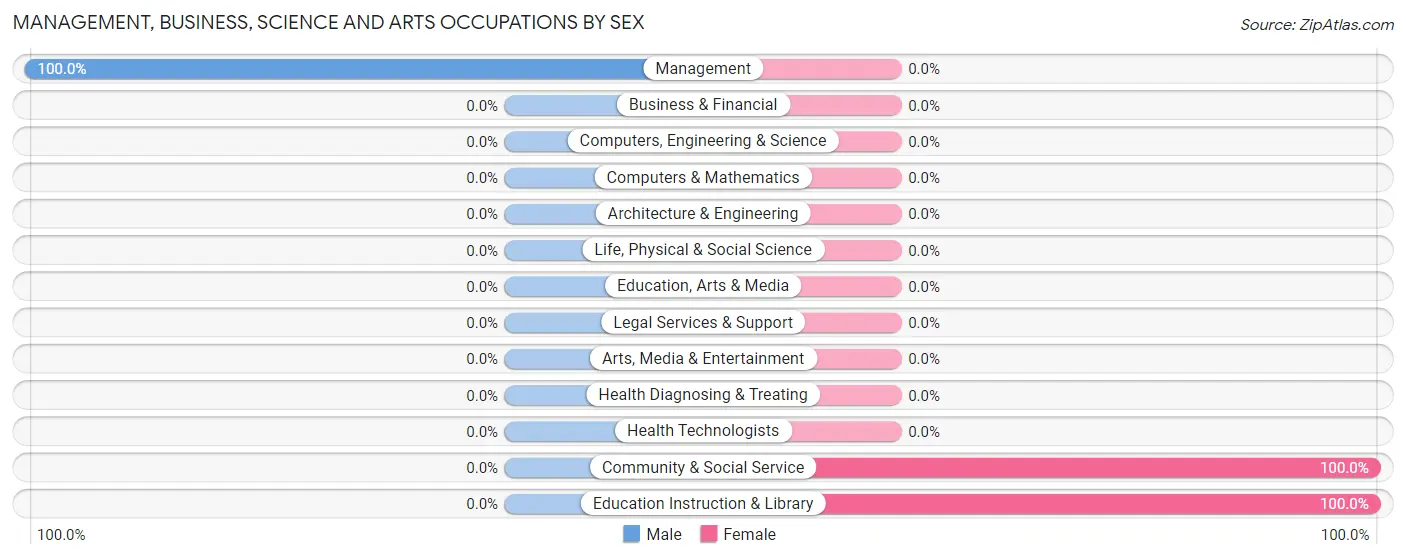
| Occupation | Male | Female |
| Management | 75 (100.0%) | 0 (0.0%) |
| Business & Financial | 0 (0.0%) | 0 (0.0%) |
| Computers, Engineering & Science | 0 (0.0%) | 0 (0.0%) |
| Computers & Mathematics | 0 (0.0%) | 0 (0.0%) |
| Architecture & Engineering | 0 (0.0%) | 0 (0.0%) |
| Life, Physical & Social Science | 0 (0.0%) | 0 (0.0%) |
| Community & Social Service | 0 (0.0%) | 81 (100.0%) |
| Education, Arts & Media | 0 (0.0%) | 0 (0.0%) |
| Legal Services & Support | 0 (0.0%) | 0 (0.0%) |
| Education Instruction & Library | 0 (0.0%) | 81 (100.0%) |
| Arts, Media & Entertainment | 0 (0.0%) | 0 (0.0%) |
| Health Diagnosing & Treating | 0 (0.0%) | 0 (0.0%) |
| Health Technologists | 0 (0.0%) | 0 (0.0%) |
| Total (Category) | 75 (48.1%) | 81 (51.9%) |
| Total (Overall) | 147 (64.5%) | 81 (35.5%) |
Services Occupations
The most common Services occupations in Lee Vining are , and Personal Care & Service (72 | 31.6%).
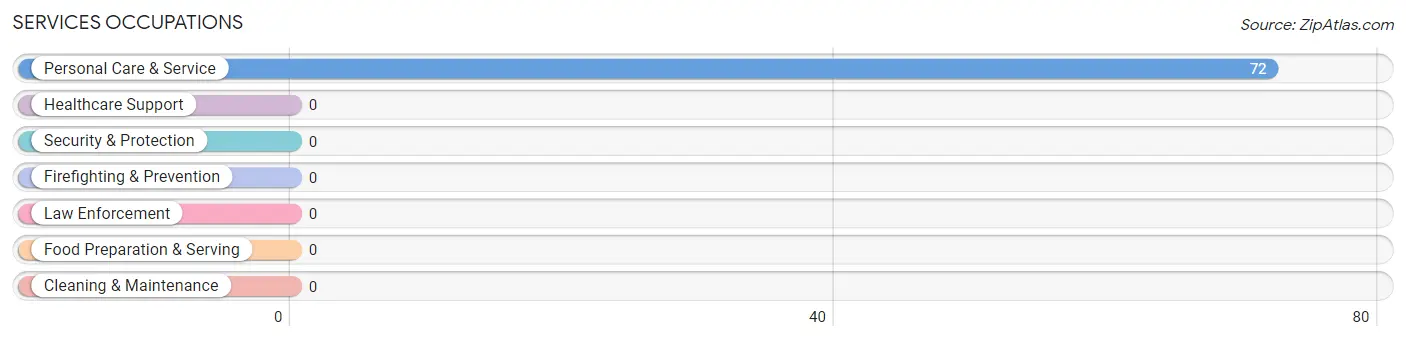
Services Occupations by Sex
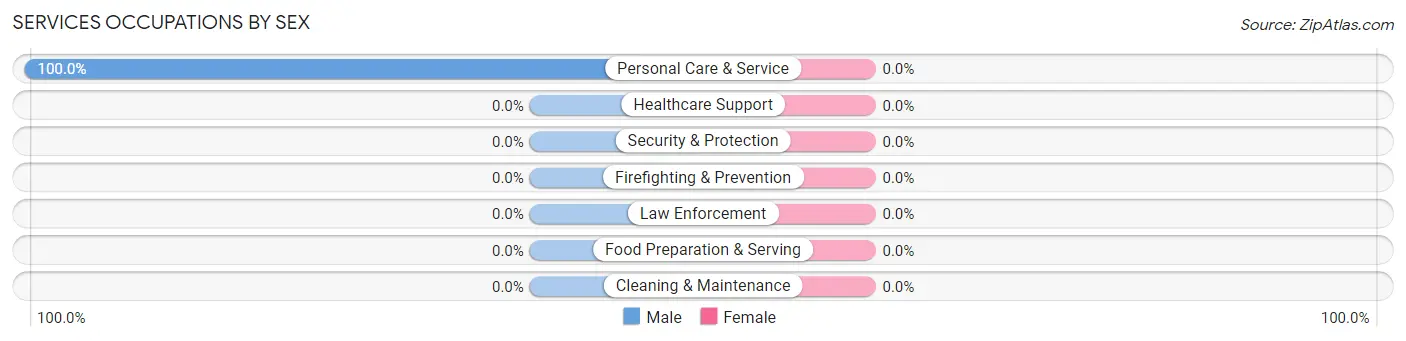
| Occupation | Male | Female |
| Healthcare Support | 0 (0.0%) | 0 (0.0%) |
| Security & Protection | 0 (0.0%) | 0 (0.0%) |
| Firefighting & Prevention | 0 (0.0%) | 0 (0.0%) |
| Law Enforcement | 0 (0.0%) | 0 (0.0%) |
| Food Preparation & Serving | 0 (0.0%) | 0 (0.0%) |
| Cleaning & Maintenance | 0 (0.0%) | 0 (0.0%) |
| Personal Care & Service | 72 (100.0%) | 0 (0.0%) |
| Total (Category) | 72 (100.0%) | 0 (0.0%) |
| Total (Overall) | 147 (64.5%) | 81 (35.5%) |
Sales and Office Occupations
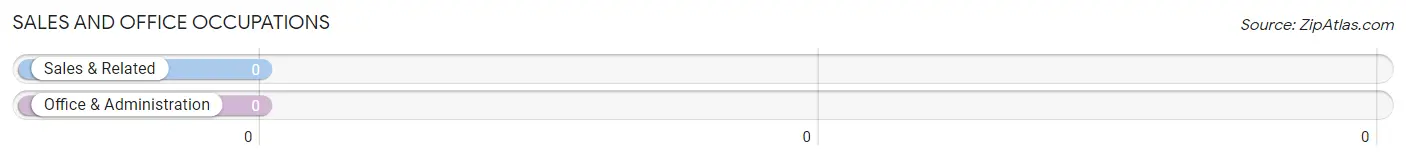
Sales and Office Occupations by Sex
| Occupation | Male | Female |
| Sales & Related | 0 (0.0%) | 0 (0.0%) |
| Office & Administration | 0 (0.0%) | 0 (0.0%) |
| Total (Category) | 0 (0.0%) | 0 (0.0%) |
| Total (Overall) | 147 (64.5%) | 81 (35.5%) |
Natural Resources, Construction and Maintenance Occupations
Natural Resources, Construction and Maintenance Occupations by Sex
| Occupation | Male | Female |
| Farming, Fishing & Forestry | 0 (0.0%) | 0 (0.0%) |
| Construction & Extraction | 0 (0.0%) | 0 (0.0%) |
| Installation, Maintenance & Repair | 0 (0.0%) | 0 (0.0%) |
| Total (Category) | 0 (0.0%) | 0 (0.0%) |
| Total (Overall) | 147 (64.5%) | 81 (35.5%) |
Production, Transportation and Moving Occupations
Production, Transportation and Moving Occupations by Sex
| Occupation | Male | Female |
| Production | 0 (0.0%) | 0 (0.0%) |
| Transportation | 0 (0.0%) | 0 (0.0%) |
| Material Moving | 0 (0.0%) | 0 (0.0%) |
| Total (Category) | 0 (0.0%) | 0 (0.0%) |
| Total (Overall) | 147 (64.5%) | 81 (35.5%) |
Employment Industries by Sex in Lee Vining
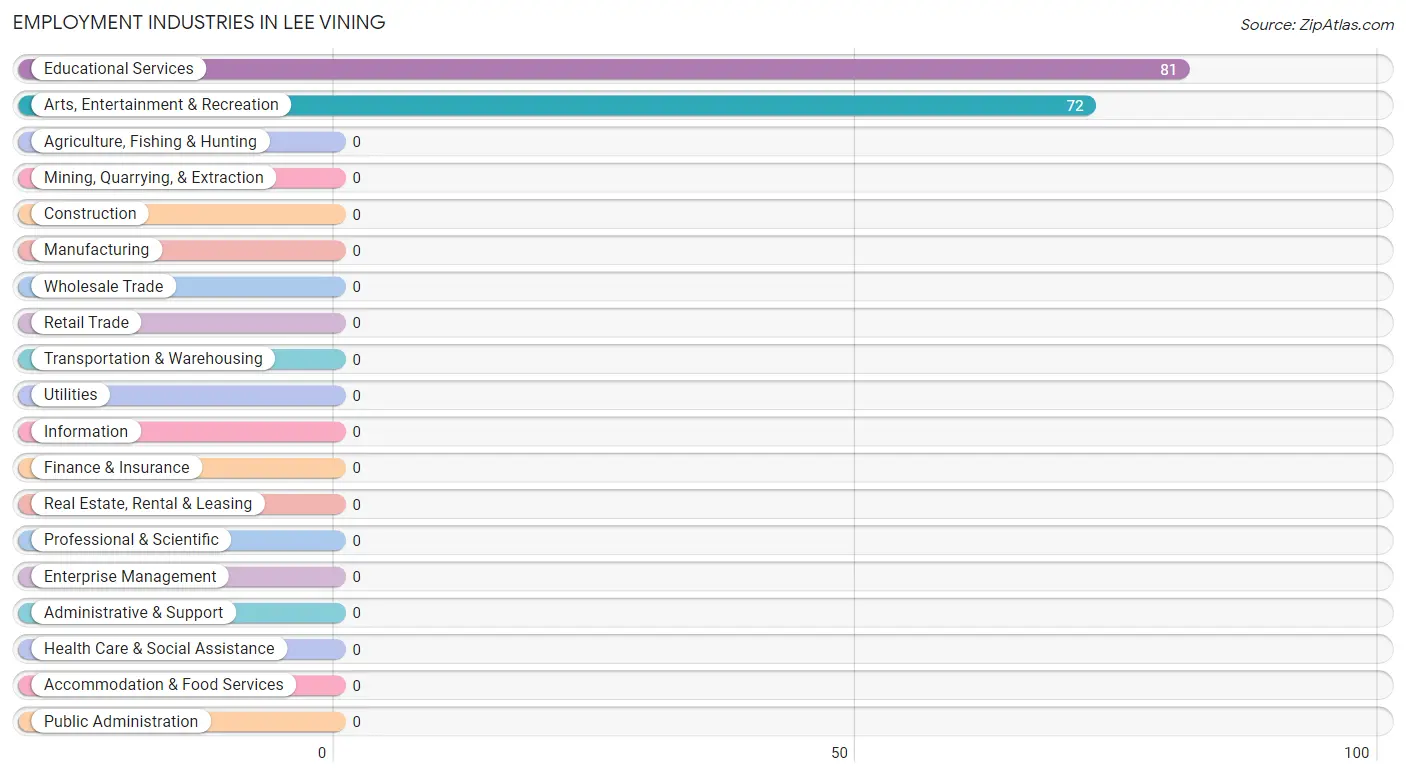
Employment Industries in Lee Vining
The major employment industries in Lee Vining include Educational Services (81 | 35.5%), and Arts, Entertainment & Recreation (72 | 31.6%).
Employment Industries by Sex in Lee Vining
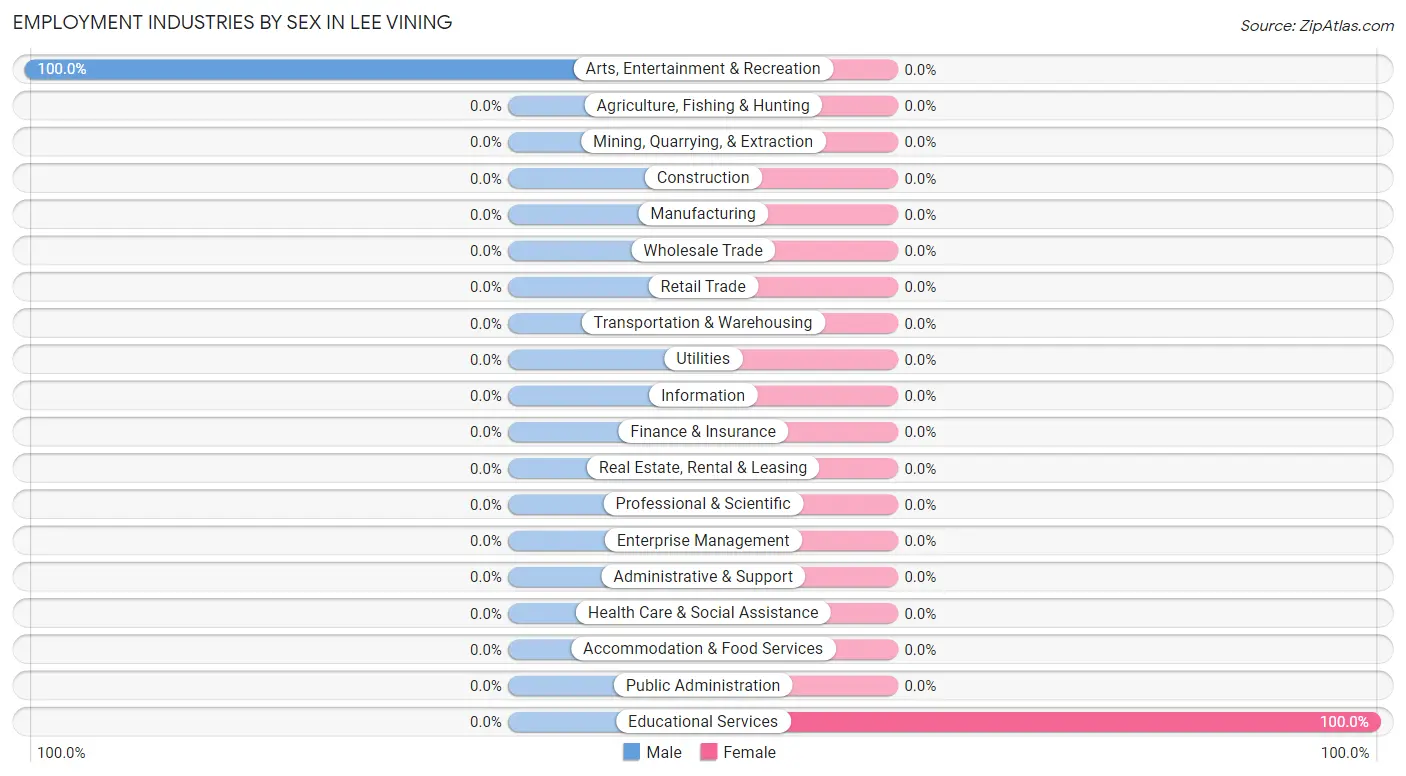
| Industry | Male | Female |
| Agriculture, Fishing & Hunting | 0 (0.0%) | 0 (0.0%) |
| Mining, Quarrying, & Extraction | 0 (0.0%) | 0 (0.0%) |
| Construction | 0 (0.0%) | 0 (0.0%) |
| Manufacturing | 0 (0.0%) | 0 (0.0%) |
| Wholesale Trade | 0 (0.0%) | 0 (0.0%) |
| Retail Trade | 0 (0.0%) | 0 (0.0%) |
| Transportation & Warehousing | 0 (0.0%) | 0 (0.0%) |
| Utilities | 0 (0.0%) | 0 (0.0%) |
| Information | 0 (0.0%) | 0 (0.0%) |
| Finance & Insurance | 0 (0.0%) | 0 (0.0%) |
| Real Estate, Rental & Leasing | 0 (0.0%) | 0 (0.0%) |
| Professional & Scientific | 0 (0.0%) | 0 (0.0%) |
| Enterprise Management | 0 (0.0%) | 0 (0.0%) |
| Administrative & Support | 0 (0.0%) | 0 (0.0%) |
| Educational Services | 0 (0.0%) | 81 (100.0%) |
| Health Care & Social Assistance | 0 (0.0%) | 0 (0.0%) |
| Arts, Entertainment & Recreation | 72 (100.0%) | 0 (0.0%) |
| Accommodation & Food Services | 0 (0.0%) | 0 (0.0%) |
| Public Administration | 0 (0.0%) | 0 (0.0%) |
| Total | 147 (64.5%) | 81 (35.5%) |
Education in Lee Vining
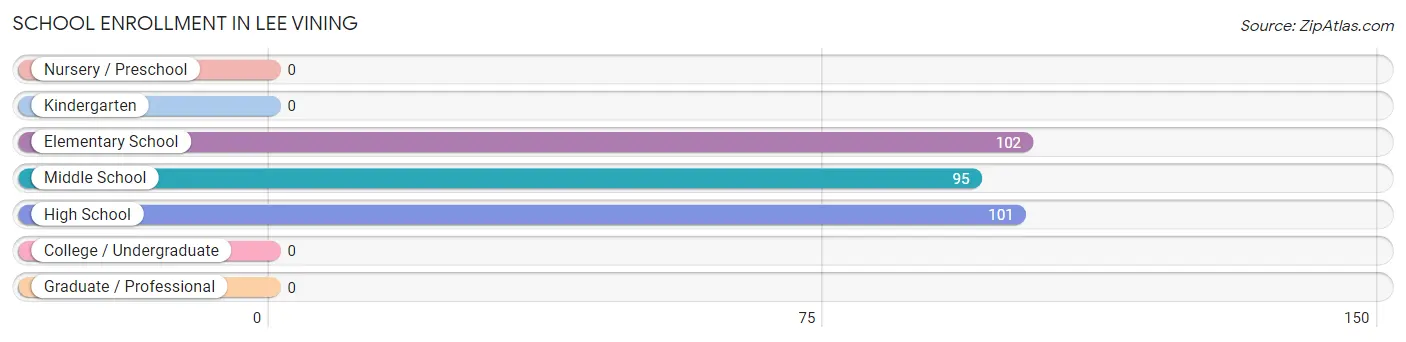
School Enrollment in Lee Vining
The most common levels of schooling among the 298 students in Lee Vining are elementary school (102 | 34.2%), high school (101 | 33.9%), and middle school (95 | 31.9%).
| School Level | # Students | % Students |
| Nursery / Preschool | 0 | 0.0% |
| Kindergarten | 0 | 0.0% |
| Elementary School | 102 | 34.2% |
| Middle School | 95 | 31.9% |
| High School | 101 | 33.9% |
| College / Undergraduate | 0 | 0.0% |
| Graduate / Professional | 0 | 0.0% |
| Total | 298 | 100.0% |
School Enrollment by Age by Funding Source in Lee Vining
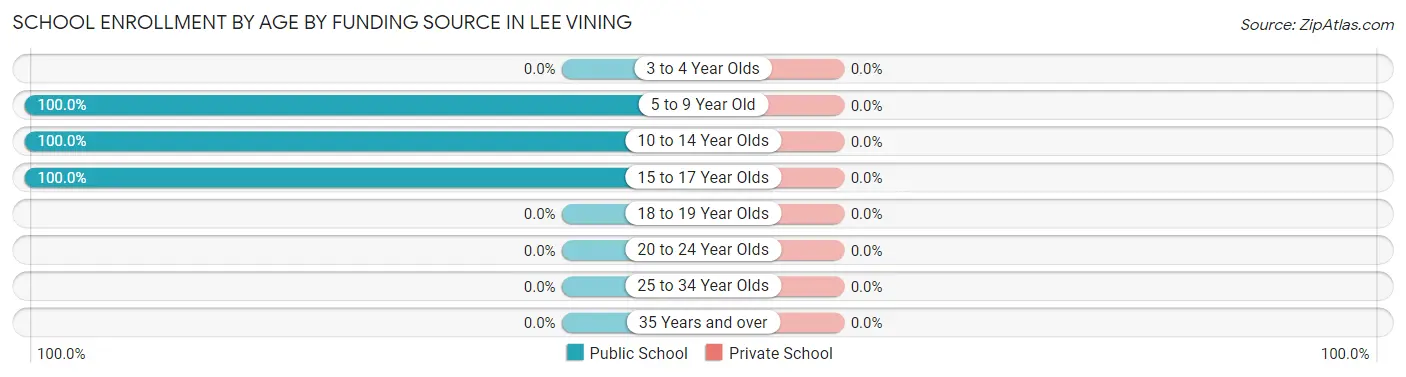
| Age Bracket | Public School | Private School |
| 3 to 4 Year Olds | 0 (0.0%) | 0 (0.0%) |
| 5 to 9 Year Old | 102 (100.0%) | 0 (0.0%) |
| 10 to 14 Year Olds | 143 (100.0%) | 0 (0.0%) |
| 15 to 17 Year Olds | 53 (100.0%) | 0 (0.0%) |
| 18 to 19 Year Olds | 0 (0.0%) | 0 (0.0%) |
| 20 to 24 Year Olds | 0 (0.0%) | 0 (0.0%) |
| 25 to 34 Year Olds | 0 (0.0%) | 0 (0.0%) |
| 35 Years and over | 0 (0.0%) | 0 (0.0%) |
| Total | 298 (100.0%) | 0 (0.0%) |
Educational Attainment by Field of Study in Lee Vining
Physical & health sciences (147 | 64.5%), bio, nature & agricultural (41 | 18.0%), and education (40 | 17.5%) are the most common fields of study among 228 individuals in Lee Vining who have obtained a bachelor's degree or higher.
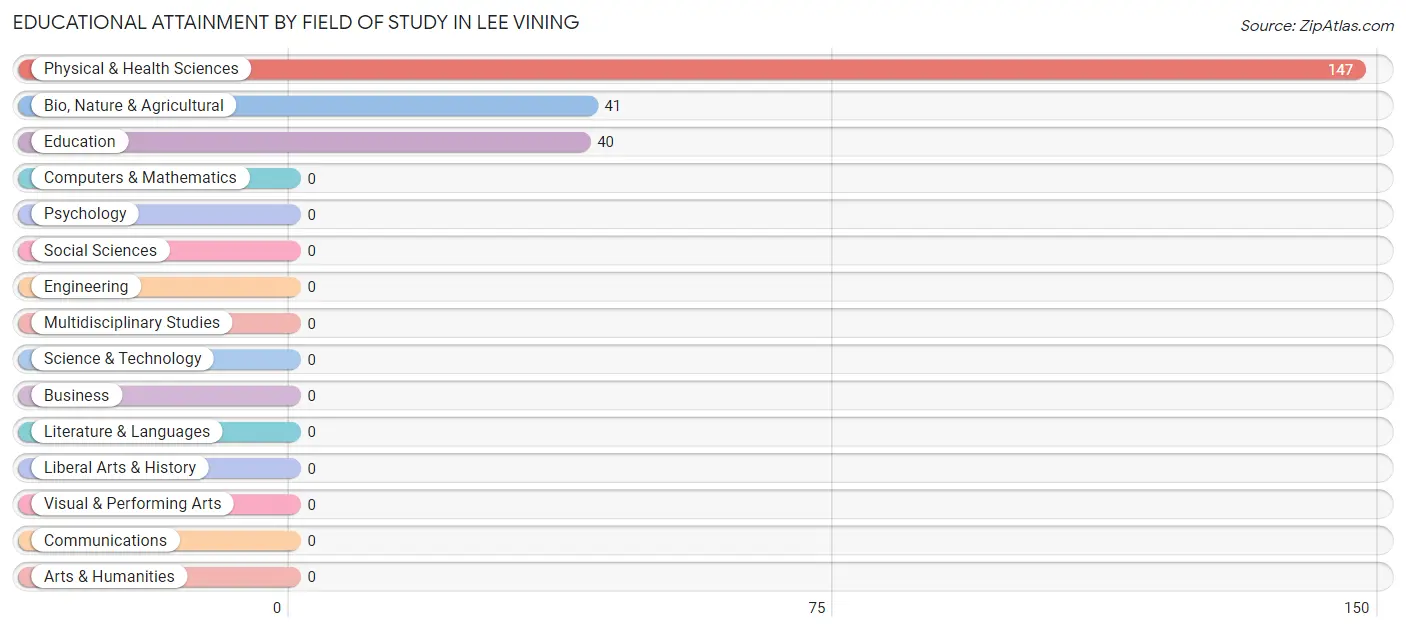
| Field of Study | # Graduates | % Graduates |
| Computers & Mathematics | 0 | 0.0% |
| Bio, Nature & Agricultural | 41 | 18.0% |
| Physical & Health Sciences | 147 | 64.5% |
| Psychology | 0 | 0.0% |
| Social Sciences | 0 | 0.0% |
| Engineering | 0 | 0.0% |
| Multidisciplinary Studies | 0 | 0.0% |
| Science & Technology | 0 | 0.0% |
| Business | 0 | 0.0% |
| Education | 40 | 17.5% |
| Literature & Languages | 0 | 0.0% |
| Liberal Arts & History | 0 | 0.0% |
| Visual & Performing Arts | 0 | 0.0% |
| Communications | 0 | 0.0% |
| Arts & Humanities | 0 | 0.0% |
| Total | 228 | 100.0% |
Transportation & Commute in Lee Vining
Vehicle Availability by Sex in Lee Vining
The most prevalent vehicle ownership categories in Lee Vining are males with 3 vehicles (147, accounting for 100.0%) and females with 3 vehicles (81, making up 181.5%).
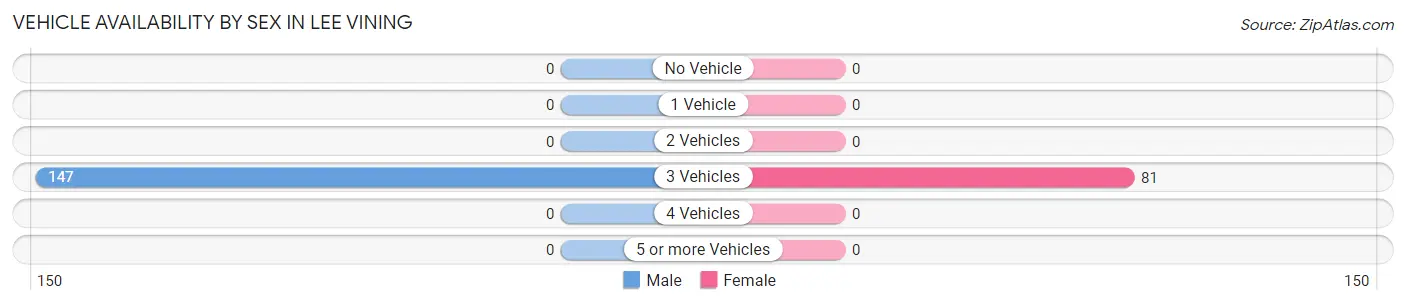
| Vehicles Available | Male | Female |
| No Vehicle | 0 (0.0%) | 0 (0.0%) |
| 1 Vehicle | 0 (0.0%) | 0 (0.0%) |
| 2 Vehicles | 0 (0.0%) | 0 (0.0%) |
| 3 Vehicles | 147 (100.0%) | 81 (100.0%) |
| 4 Vehicles | 0 (0.0%) | 0 (0.0%) |
| 5 or more Vehicles | 0 (0.0%) | 0 (0.0%) |
| Total | 147 (100.0%) | 81 (100.0%) |
Commute Time in Lee Vining
The most frequently occuring commute durations in Lee Vining are 5 to 9 minutes (81 commuters, 100.0%), less than 5 minutes (0 commuters, 0.0%), and 10 to 14 minutes (0 commuters, 0.0%).
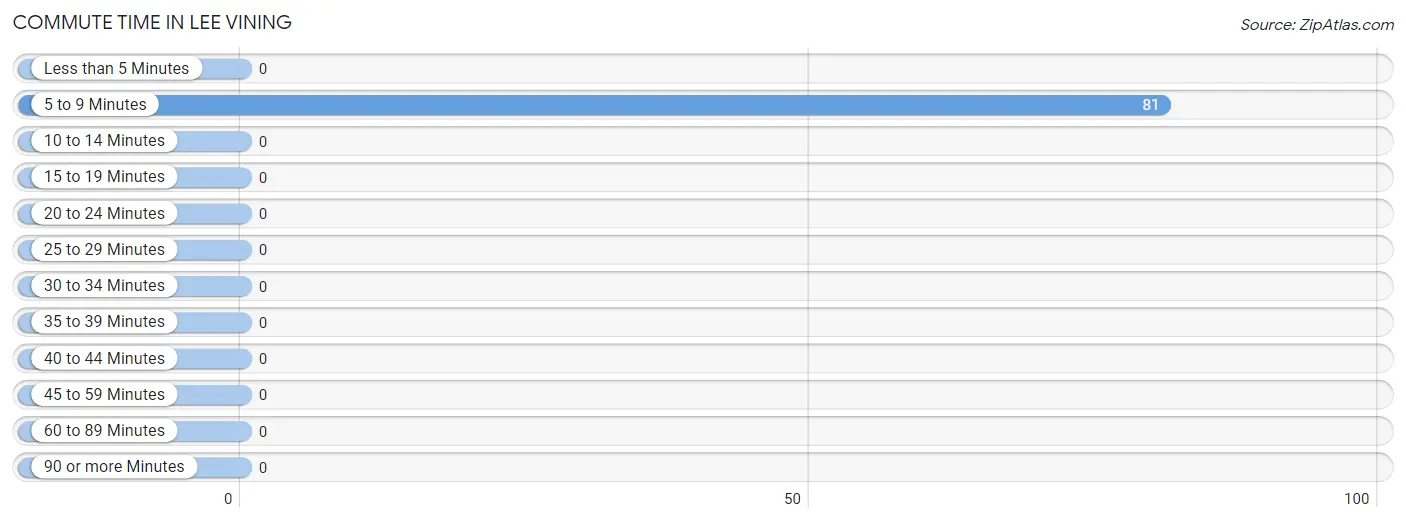
| Commute Time | # Commuters | % Commuters |
| Less than 5 Minutes | 0 | 0.0% |
| 5 to 9 Minutes | 81 | 100.0% |
| 10 to 14 Minutes | 0 | 0.0% |
| 15 to 19 Minutes | 0 | 0.0% |
| 20 to 24 Minutes | 0 | 0.0% |
| 25 to 29 Minutes | 0 | 0.0% |
| 30 to 34 Minutes | 0 | 0.0% |
| 35 to 39 Minutes | 0 | 0.0% |
| 40 to 44 Minutes | 0 | 0.0% |
| 45 to 59 Minutes | 0 | 0.0% |
| 60 to 89 Minutes | 0 | 0.0% |
| 90 or more Minutes | 0 | 0.0% |
Commute Time by Sex in Lee Vining
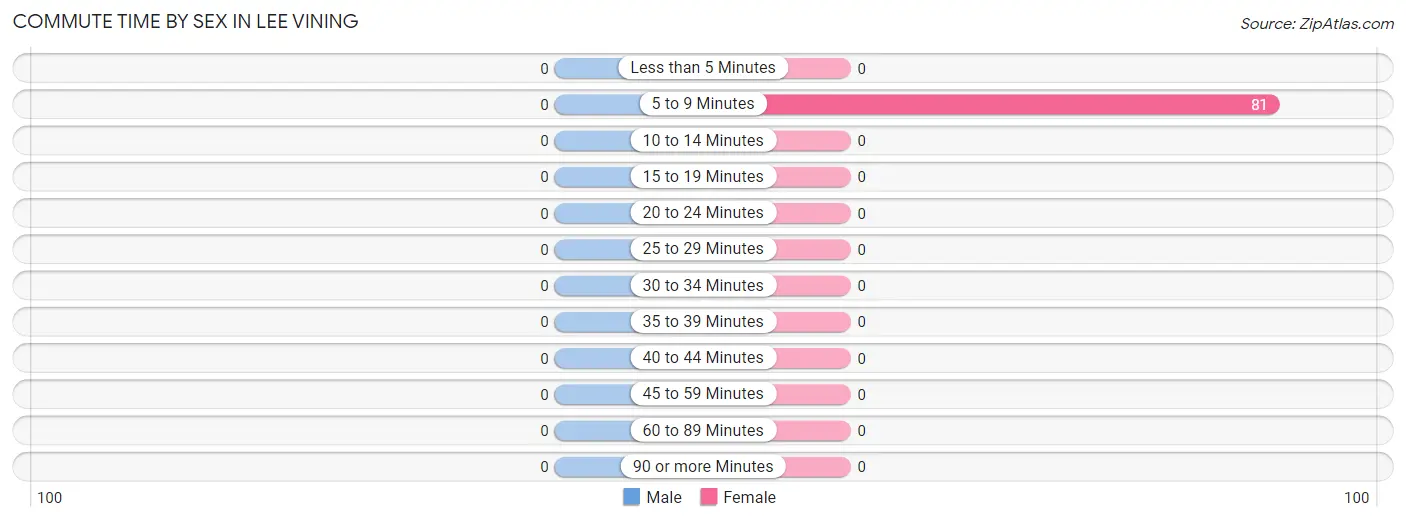
| Commute Time | Male | Female |
| Less than 5 Minutes | 0 (0.0%) | 0 (0.0%) |
| 5 to 9 Minutes | 0 (0.0%) | 81 (100.0%) |
| 10 to 14 Minutes | 0 (0.0%) | 0 (0.0%) |
| 15 to 19 Minutes | 0 (0.0%) | 0 (0.0%) |
| 20 to 24 Minutes | 0 (0.0%) | 0 (0.0%) |
| 25 to 29 Minutes | 0 (0.0%) | 0 (0.0%) |
| 30 to 34 Minutes | 0 (0.0%) | 0 (0.0%) |
| 35 to 39 Minutes | 0 (0.0%) | 0 (0.0%) |
| 40 to 44 Minutes | 0 (0.0%) | 0 (0.0%) |
| 45 to 59 Minutes | 0 (0.0%) | 0 (0.0%) |
| 60 to 89 Minutes | 0 (0.0%) | 0 (0.0%) |
| 90 or more Minutes | 0 (0.0%) | 0 (0.0%) |
Time of Departure to Work by Sex in Lee Vining
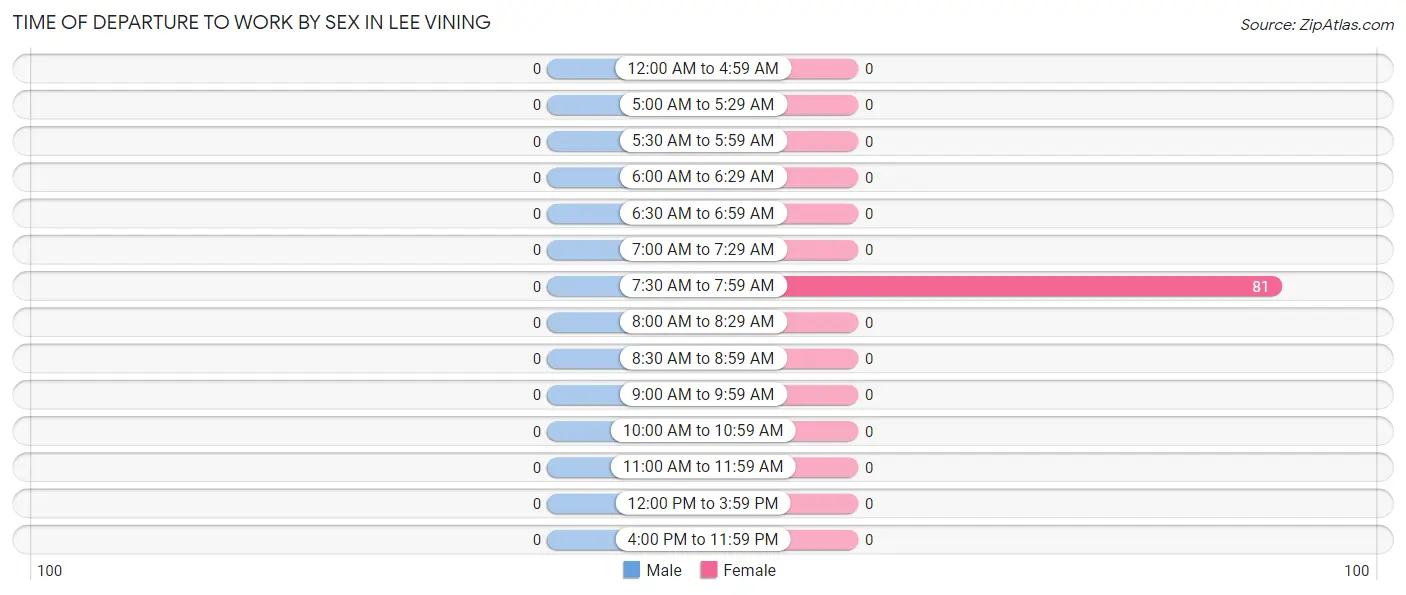
| Time of Departure | Male | Female |
| 12:00 AM to 4:59 AM | 0 (0.0%) | 0 (0.0%) |
| 5:00 AM to 5:29 AM | 0 (0.0%) | 0 (0.0%) |
| 5:30 AM to 5:59 AM | 0 (0.0%) | 0 (0.0%) |
| 6:00 AM to 6:29 AM | 0 (0.0%) | 0 (0.0%) |
| 6:30 AM to 6:59 AM | 0 (0.0%) | 0 (0.0%) |
| 7:00 AM to 7:29 AM | 0 (0.0%) | 0 (0.0%) |
| 7:30 AM to 7:59 AM | 0 (0.0%) | 81 (100.0%) |
| 8:00 AM to 8:29 AM | 0 (0.0%) | 0 (0.0%) |
| 8:30 AM to 8:59 AM | 0 (0.0%) | 0 (0.0%) |
| 9:00 AM to 9:59 AM | 0 (0.0%) | 0 (0.0%) |
| 10:00 AM to 10:59 AM | 0 (0.0%) | 0 (0.0%) |
| 11:00 AM to 11:59 AM | 0 (0.0%) | 0 (0.0%) |
| 12:00 PM to 3:59 PM | 0 (0.0%) | 0 (0.0%) |
| 4:00 PM to 11:59 PM | 0 (0.0%) | 0 (0.0%) |
| Total | 0 (0.0%) | 81 (100.0%) |
Housing Occupancy in Lee Vining
Occupancy by Ownership in Lee Vining
Of the total 149 dwellings in Lee Vining, owner-occupied units account for 149 (100.0%), while renter-occupied units make up 0 (0.0%).
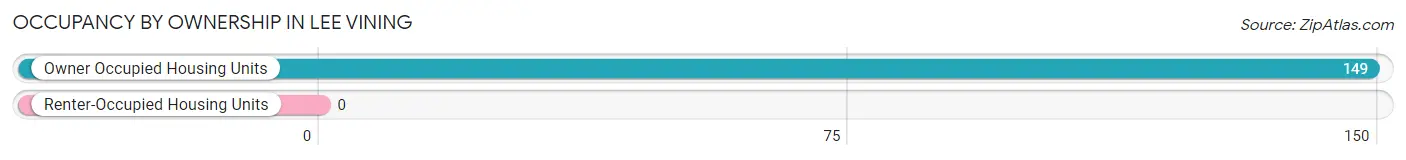
| Occupancy | # Housing Units | % Housing Units |
| Owner Occupied Housing Units | 149 | 100.0% |
| Renter-Occupied Housing Units | 0 | 0.0% |
| Total Occupied Housing Units | 149 | 100.0% |
Occupancy by Household Size in Lee Vining
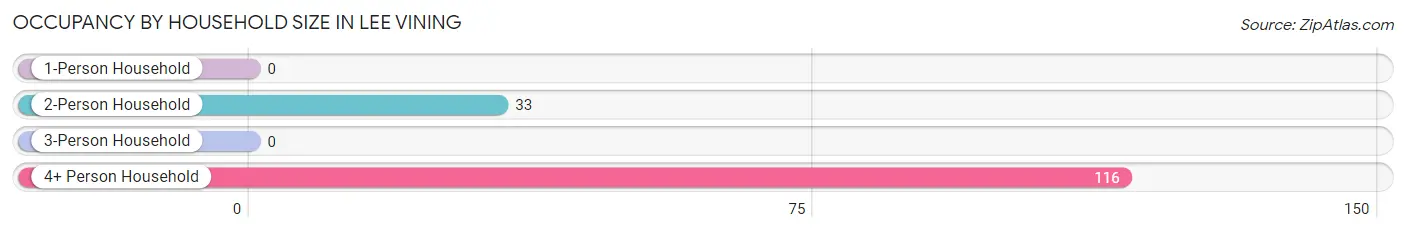
| Household Size | # Housing Units | % Housing Units |
| 1-Person Household | 0 | 0.0% |
| 2-Person Household | 33 | 22.2% |
| 3-Person Household | 0 | 0.0% |
| 4+ Person Household | 116 | 77.8% |
| Total Housing Units | 149 | 100.0% |
Occupancy by Ownership by Household Size in Lee Vining
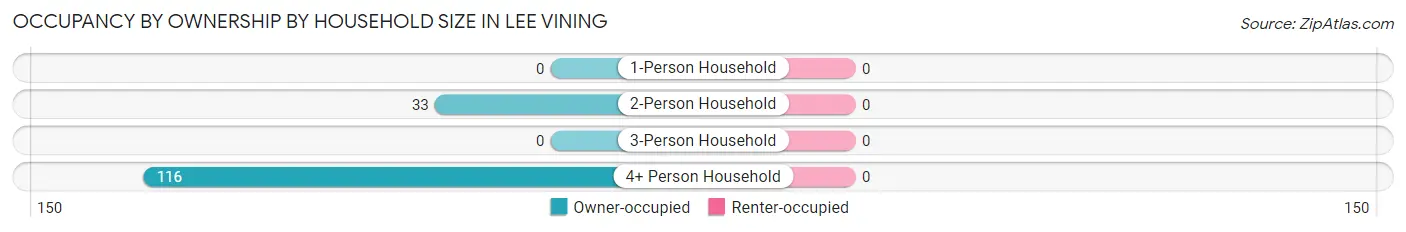
| Household Size | Owner-occupied | Renter-occupied |
| 1-Person Household | 0 (0.0%) | 0 (0.0%) |
| 2-Person Household | 33 (100.0%) | 0 (0.0%) |
| 3-Person Household | 0 (0.0%) | 0 (0.0%) |
| 4+ Person Household | 116 (100.0%) | 0 (0.0%) |
| Total Housing Units | 149 (100.0%) | 0 (0.0%) |
Occupancy by Educational Attainment in Lee Vining
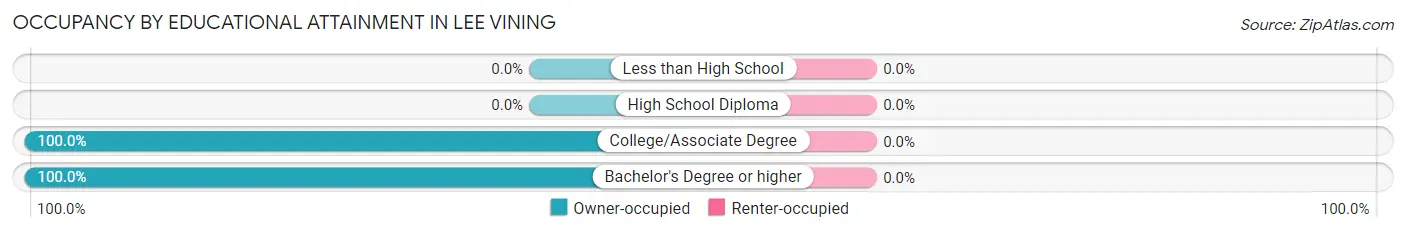
| Household Size | Owner-occupied | Renter-occupied |
| Less than High School | 0 (0.0%) | 0 (0.0%) |
| High School Diploma | 0 (0.0%) | 0 (0.0%) |
| College/Associate Degree | 33 (100.0%) | 0 (0.0%) |
| Bachelor's Degree or higher | 116 (100.0%) | 0 (0.0%) |
Occupancy by Age of Householder in Lee Vining
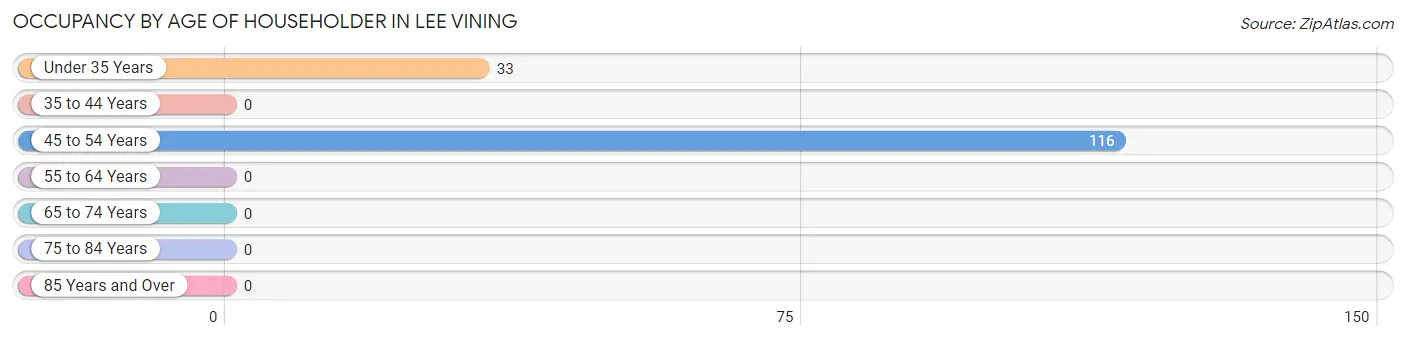
| Age Bracket | # Households | % Households |
| Under 35 Years | 33 | 22.2% |
| 35 to 44 Years | 0 | 0.0% |
| 45 to 54 Years | 116 | 77.8% |
| 55 to 64 Years | 0 | 0.0% |
| 65 to 74 Years | 0 | 0.0% |
| 75 to 84 Years | 0 | 0.0% |
| 85 Years and Over | 0 | 0.0% |
| Total | 149 | 100.0% |
Housing Finances in Lee Vining
Median Income by Occupancy in Lee Vining
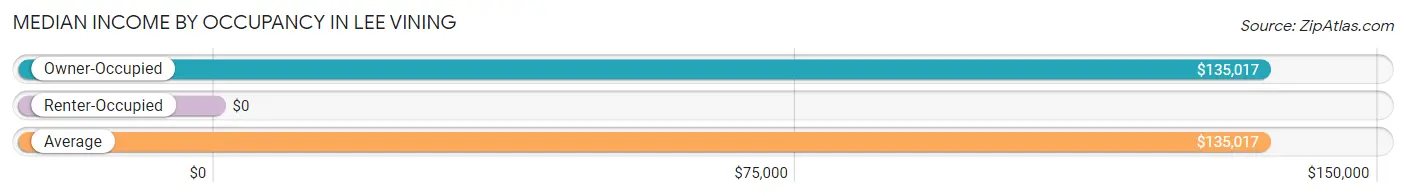
| Occupancy Type | # Households | Median Income |
| Owner-Occupied | 149 (100.0%) | $135,017 |
| Renter-Occupied | 0 (0.0%) | $0 |
| Average | 149 (100.0%) | $135,017 |
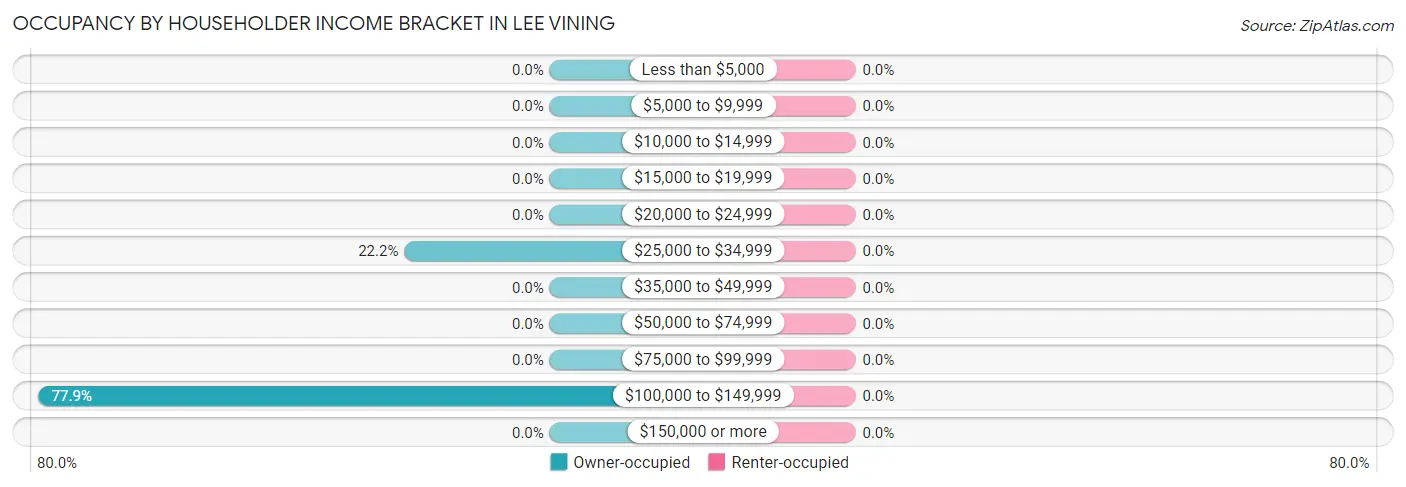
Occupancy by Householder Income Bracket in Lee Vining
| Income Bracket | Owner-occupied | Renter-occupied |
| Less than $5,000 | 0 (0.0%) | 0 (0.0%) |
| $5,000 to $9,999 | 0 (0.0%) | 0 (0.0%) |
| $10,000 to $14,999 | 0 (0.0%) | 0 (0.0%) |
| $15,000 to $19,999 | 0 (0.0%) | 0 (0.0%) |
| $20,000 to $24,999 | 0 (0.0%) | 0 (0.0%) |
| $25,000 to $34,999 | 33 (22.2%) | 0 (0.0%) |
| $35,000 to $49,999 | 0 (0.0%) | 0 (0.0%) |
| $50,000 to $74,999 | 0 (0.0%) | 0 (0.0%) |
| $75,000 to $99,999 | 0 (0.0%) | 0 (0.0%) |
| $100,000 to $149,999 | 116 (77.8%) | 0 (0.0%) |
| $150,000 or more | 0 (0.0%) | 0 (0.0%) |
| Total | 149 (100.0%) | 0 (0.0%) |
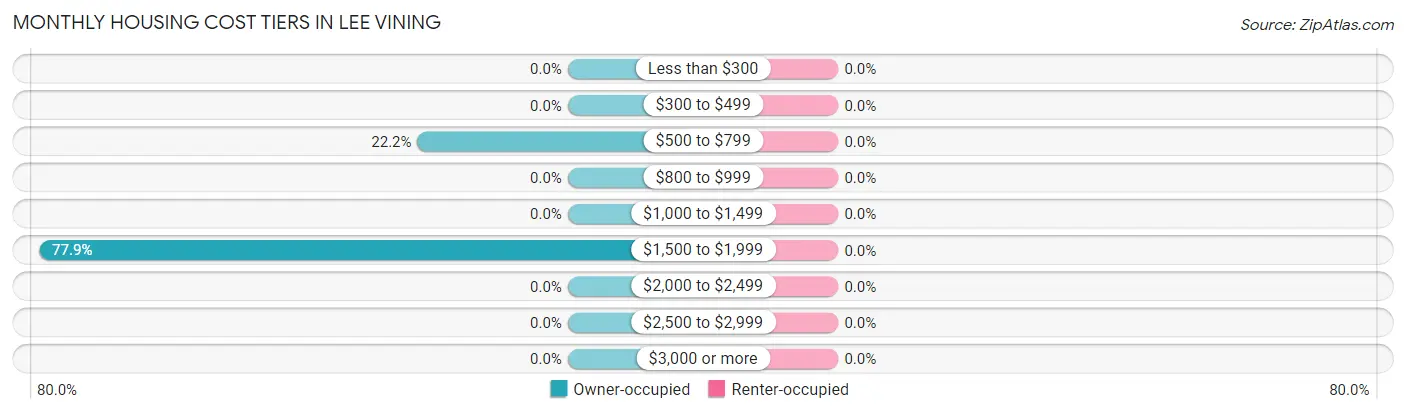
Monthly Housing Cost Tiers in Lee Vining
| Monthly Cost | Owner-occupied | Renter-occupied |
| Less than $300 | 0 (0.0%) | 0 (0.0%) |
| $300 to $499 | 0 (0.0%) | 0 (0.0%) |
| $500 to $799 | 33 (22.2%) | 0 (0.0%) |
| $800 to $999 | 0 (0.0%) | 0 (0.0%) |
| $1,000 to $1,499 | 0 (0.0%) | 0 (0.0%) |
| $1,500 to $1,999 | 116 (77.8%) | 0 (0.0%) |
| $2,000 to $2,499 | 0 (0.0%) | 0 (0.0%) |
| $2,500 to $2,999 | 0 (0.0%) | 0 (0.0%) |
| $3,000 or more | 0 (0.0%) | 0 (0.0%) |
| Total | 149 (100.0%) | 0 (0.0%) |
Physical Housing Characteristics in Lee Vining
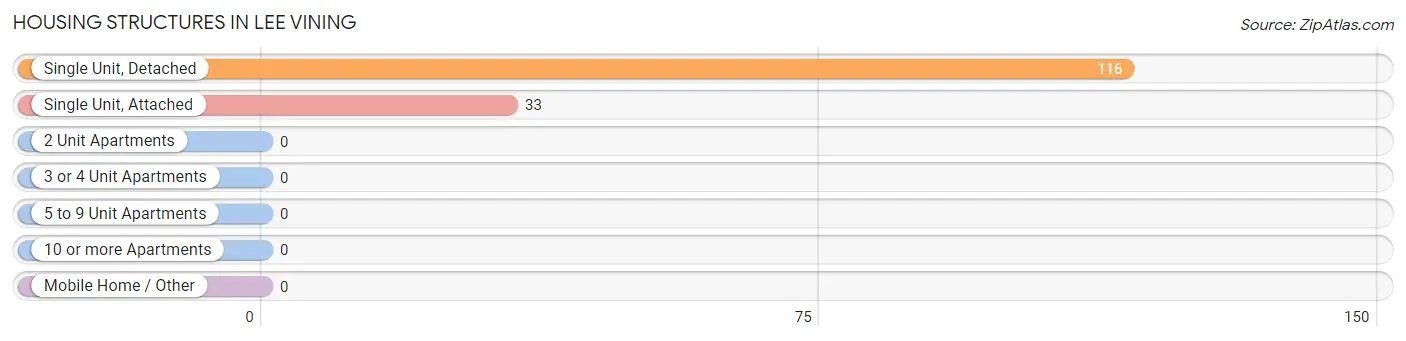
Housing Structures in Lee Vining
| Structure Type | # Housing Units | % Housing Units |
| Single Unit, Detached | 116 | 77.8% |
| Single Unit, Attached | 33 | 22.2% |
| 2 Unit Apartments | 0 | 0.0% |
| 3 or 4 Unit Apartments | 0 | 0.0% |
| 5 to 9 Unit Apartments | 0 | 0.0% |
| 10 or more Apartments | 0 | 0.0% |
| Mobile Home / Other | 0 | 0.0% |
| Total | 149 | 100.0% |
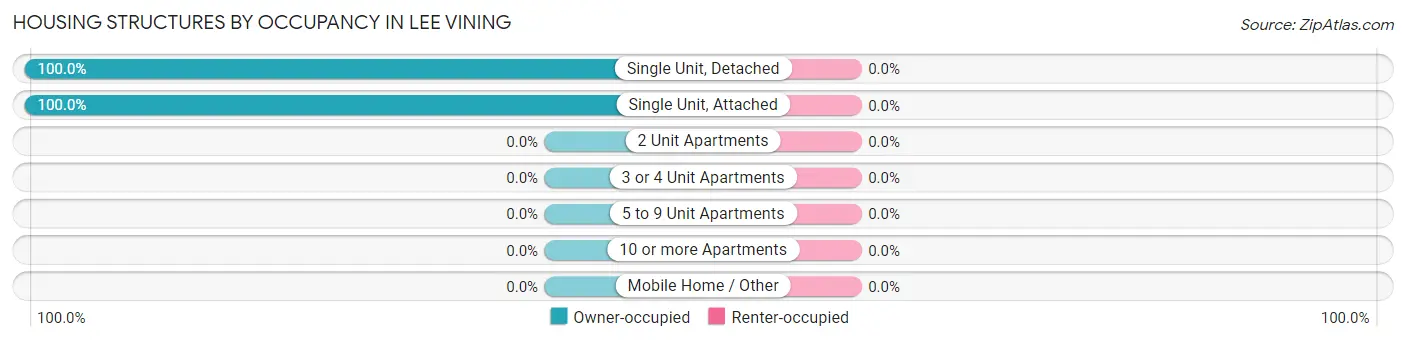
Housing Structures by Occupancy in Lee Vining
| Structure Type | Owner-occupied | Renter-occupied |
| Single Unit, Detached | 116 (100.0%) | 0 (0.0%) |
| Single Unit, Attached | 33 (100.0%) | 0 (0.0%) |
| 2 Unit Apartments | 0 (0.0%) | 0 (0.0%) |
| 3 or 4 Unit Apartments | 0 (0.0%) | 0 (0.0%) |
| 5 to 9 Unit Apartments | 0 (0.0%) | 0 (0.0%) |
| 10 or more Apartments | 0 (0.0%) | 0 (0.0%) |
| Mobile Home / Other | 0 (0.0%) | 0 (0.0%) |
| Total | 149 (100.0%) | 0 (0.0%) |
Housing Structures by Number of Rooms in Lee Vining
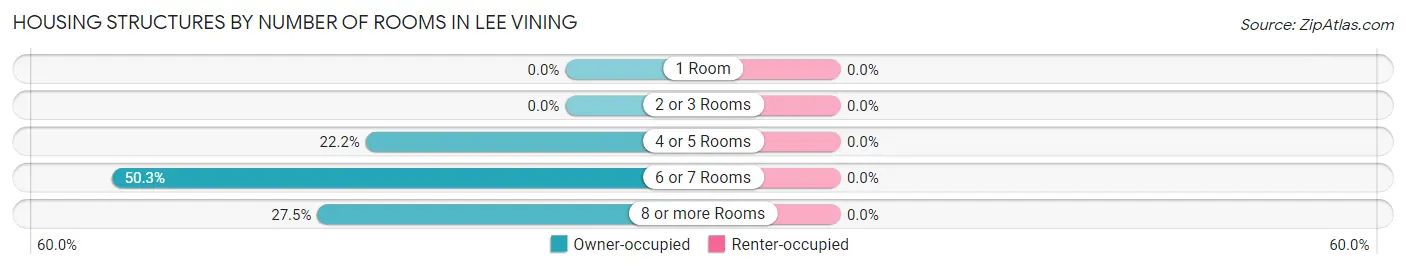
| Number of Rooms | Owner-occupied | Renter-occupied |
| 1 Room | 0 (0.0%) | 0 (0.0%) |
| 2 or 3 Rooms | 0 (0.0%) | 0 (0.0%) |
| 4 or 5 Rooms | 33 (22.2%) | 0 (0.0%) |
| 6 or 7 Rooms | 75 (50.3%) | 0 (0.0%) |
| 8 or more Rooms | 41 (27.5%) | 0 (0.0%) |
| Total | 149 (100.0%) | 0 (0.0%) |
Housing Structure by Heating Type in Lee Vining
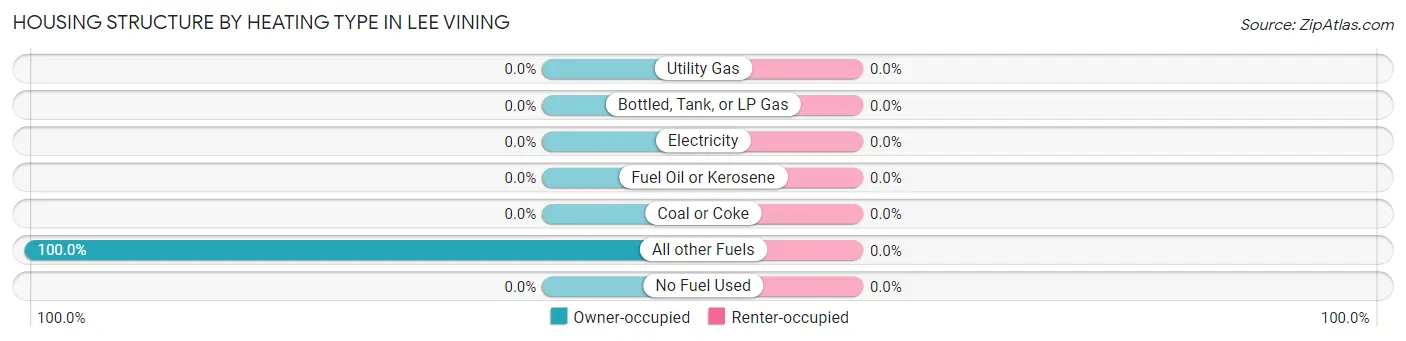
| Heating Type | Owner-occupied | Renter-occupied |
| Utility Gas | 0 (0.0%) | 0 (0.0%) |
| Bottled, Tank, or LP Gas | 0 (0.0%) | 0 (0.0%) |
| Electricity | 0 (0.0%) | 0 (0.0%) |
| Fuel Oil or Kerosene | 0 (0.0%) | 0 (0.0%) |
| Coal or Coke | 0 (0.0%) | 0 (0.0%) |
| All other Fuels | 149 (100.0%) | 0 (0.0%) |
| No Fuel Used | 0 (0.0%) | 0 (0.0%) |
| Total | 149 (100.0%) | 0 (0.0%) |
Household Vehicle Usage in Lee Vining
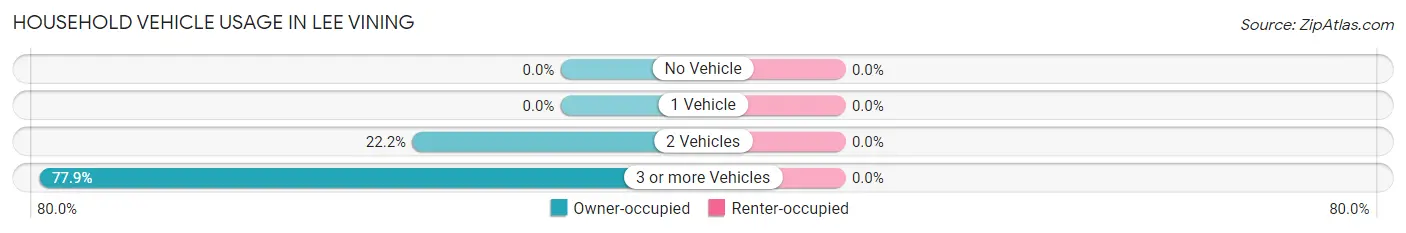
| Vehicles per Household | Owner-occupied | Renter-occupied |
| No Vehicle | 0 (0.0%) | 0 (0.0%) |
| 1 Vehicle | 0 (0.0%) | 0 (0.0%) |
| 2 Vehicles | 33 (22.2%) | 0 (0.0%) |
| 3 or more Vehicles | 116 (77.8%) | 0 (0.0%) |
| Total | 149 (100.0%) | 0 (0.0%) |
Real Estate & Mortgages in Lee Vining
Real Estate and Mortgage Overview in Lee Vining
| Characteristic | Without Mortgage | With Mortgage |
| Housing Units | 33 | 116 |
| Median Property Value | - | - |
| Median Household Income | - | - |
| Monthly Housing Costs | - | - |
| Real Estate Taxes | - | - |
Property Value by Mortgage Status in Lee Vining
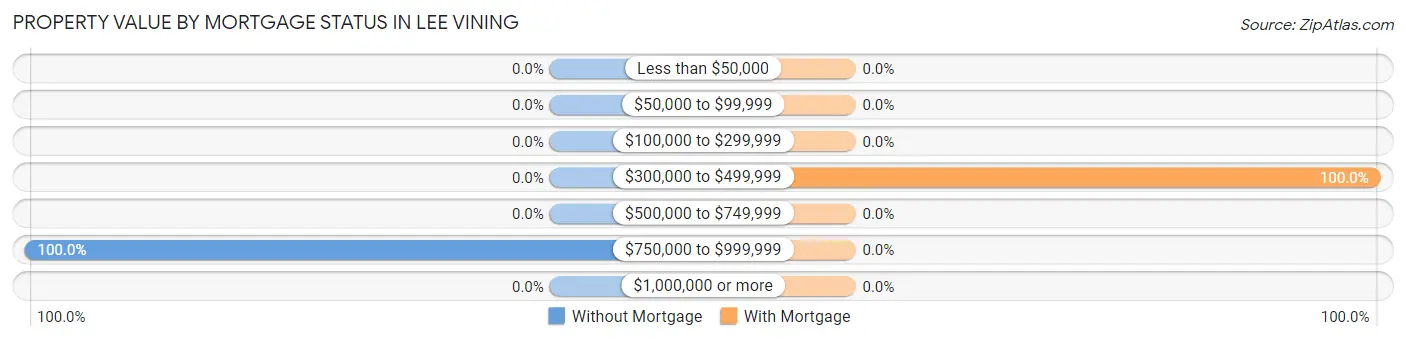
| Property Value | Without Mortgage | With Mortgage |
| Less than $50,000 | 0 (0.0%) | 0 (0.0%) |
| $50,000 to $99,999 | 0 (0.0%) | 0 (0.0%) |
| $100,000 to $299,999 | 0 (0.0%) | 0 (0.0%) |
| $300,000 to $499,999 | 0 (0.0%) | 116 (100.0%) |
| $500,000 to $749,999 | 0 (0.0%) | 0 (0.0%) |
| $750,000 to $999,999 | 33 (100.0%) | 0 (0.0%) |
| $1,000,000 or more | 0 (0.0%) | 0 (0.0%) |
| Total | 33 (100.0%) | 116 (100.0%) |
Household Income by Mortgage Status in Lee Vining
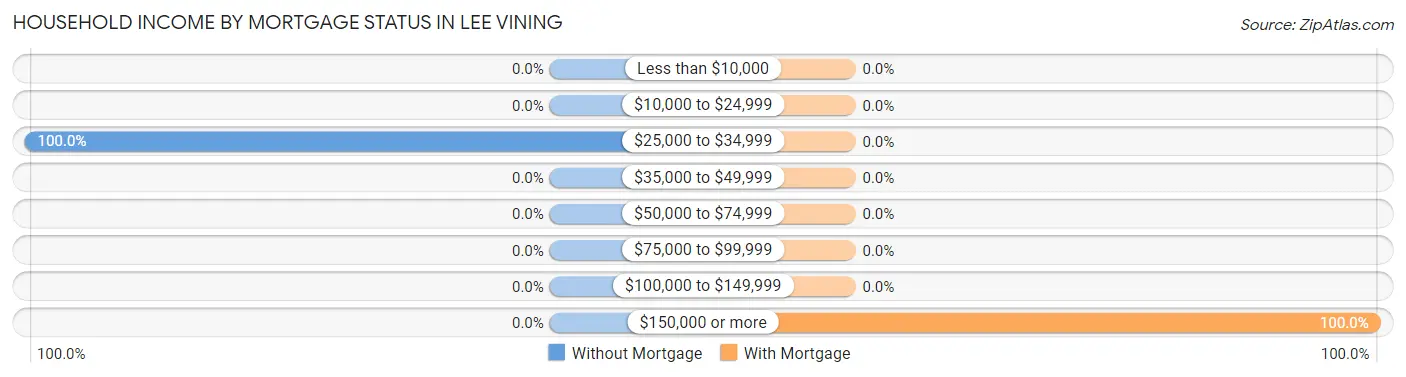
| Household Income | Without Mortgage | With Mortgage |
| Less than $10,000 | 0 (0.0%) | 0 (0.0%) |
| $10,000 to $24,999 | 0 (0.0%) | 0 (0.0%) |
| $25,000 to $34,999 | 33 (100.0%) | 0 (0.0%) |
| $35,000 to $49,999 | 0 (0.0%) | 0 (0.0%) |
| $50,000 to $74,999 | 0 (0.0%) | 0 (0.0%) |
| $75,000 to $99,999 | 0 (0.0%) | 0 (0.0%) |
| $100,000 to $149,999 | 0 (0.0%) | 0 (0.0%) |
| $150,000 or more | 0 (0.0%) | 116 (100.0%) |
| Total | 33 (100.0%) | 116 (100.0%) |
Property Value to Household Income Ratio in Lee Vining
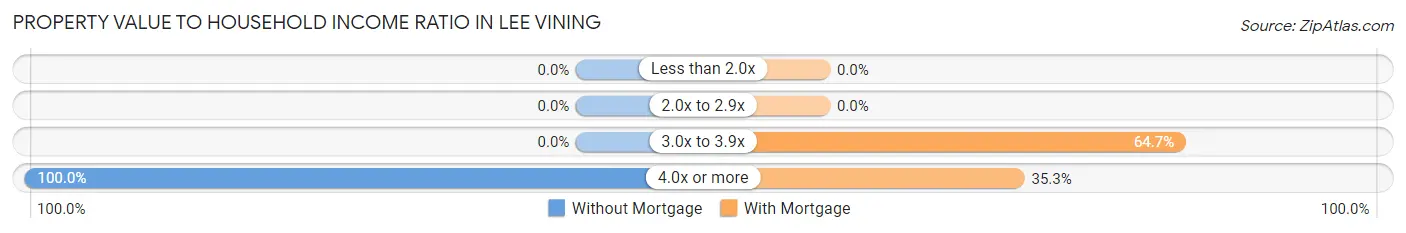
| Value-to-Income Ratio | Without Mortgage | With Mortgage |
| Less than 2.0x | 0 (0.0%) | 0 (0.0%) |
| 2.0x to 2.9x | 0 (0.0%) | 0 (0.0%) |
| 3.0x to 3.9x | 0 (0.0%) | 75 (64.7%) |
| 4.0x or more | 33 (100.0%) | 41 (35.3%) |
| Total | 33 (100.0%) | 116 (100.0%) |
Real Estate Taxes by Mortgage Status in Lee Vining
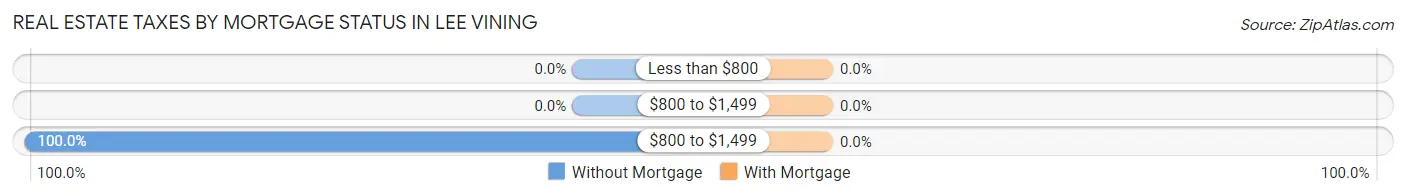
| Property Taxes | Without Mortgage | With Mortgage |
| Less than $800 | 0 (0.0%) | 0 (0.0%) |
| $800 to $1,499 | 0 (0.0%) | 0 (0.0%) |
| $800 to $1,499 | 33 (100.0%) | 0 (0.0%) |
| Total | 33 (100.0%) | 116 (100.0%) |
Health & Disability in Lee Vining
Health Insurance Coverage by Age in Lee Vining
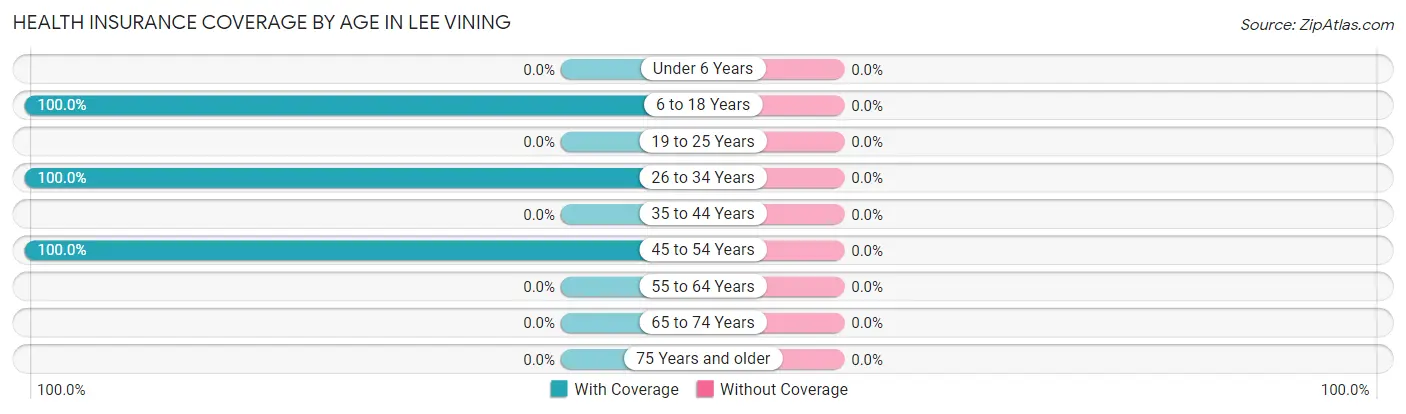
| Age Bracket | With Coverage | Without Coverage |
| Under 6 Years | 0 (0.0%) | 0 (0.0%) |
| 6 to 18 Years | 298 (100.0%) | 0 (0.0%) |
| 19 to 25 Years | 0 (0.0%) | 0 (0.0%) |
| 26 to 34 Years | 68 (100.0%) | 0 (0.0%) |
| 35 to 44 Years | 0 (0.0%) | 0 (0.0%) |
| 45 to 54 Years | 228 (100.0%) | 0 (0.0%) |
| 55 to 64 Years | 0 (0.0%) | 0 (0.0%) |
| 65 to 74 Years | 0 (0.0%) | 0 (0.0%) |
| 75 Years and older | 0 (0.0%) | 0 (0.0%) |
| Total | 594 (100.0%) | 0 (0.0%) |
Health Insurance Coverage by Citizenship Status in Lee Vining
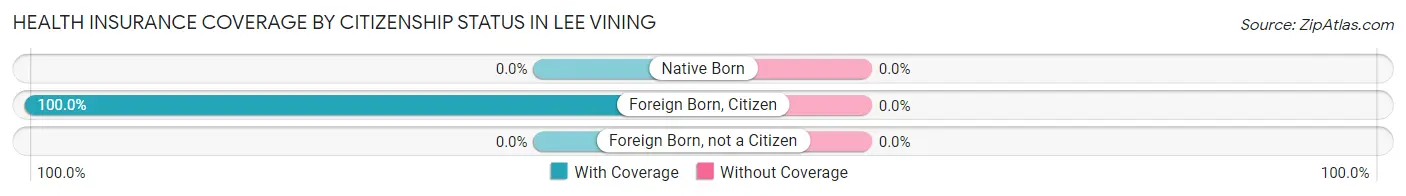
| Citizenship Status | With Coverage | Without Coverage |
| Native Born | 0 (0.0%) | 0 (0.0%) |
| Foreign Born, Citizen | 298 (100.0%) | 0 (0.0%) |
| Foreign Born, not a Citizen | 0 (0.0%) | 0 (0.0%) |
Health Insurance Coverage by Household Income in Lee Vining
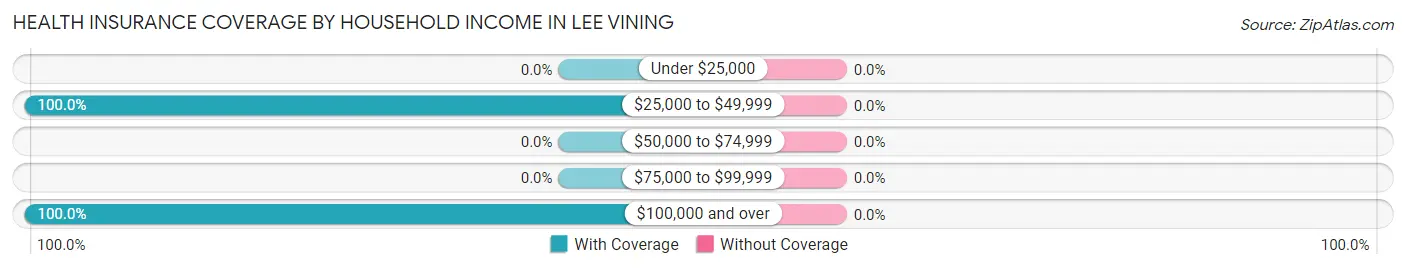
| Household Income | With Coverage | Without Coverage |
| Under $25,000 | 0 (0.0%) | 0 (0.0%) |
| $25,000 to $49,999 | 68 (100.0%) | 0 (0.0%) |
| $50,000 to $74,999 | 0 (0.0%) | 0 (0.0%) |
| $75,000 to $99,999 | 0 (0.0%) | 0 (0.0%) |
| $100,000 and over | 526 (100.0%) | 0 (0.0%) |
Public vs Private Health Insurance Coverage by Age in Lee Vining
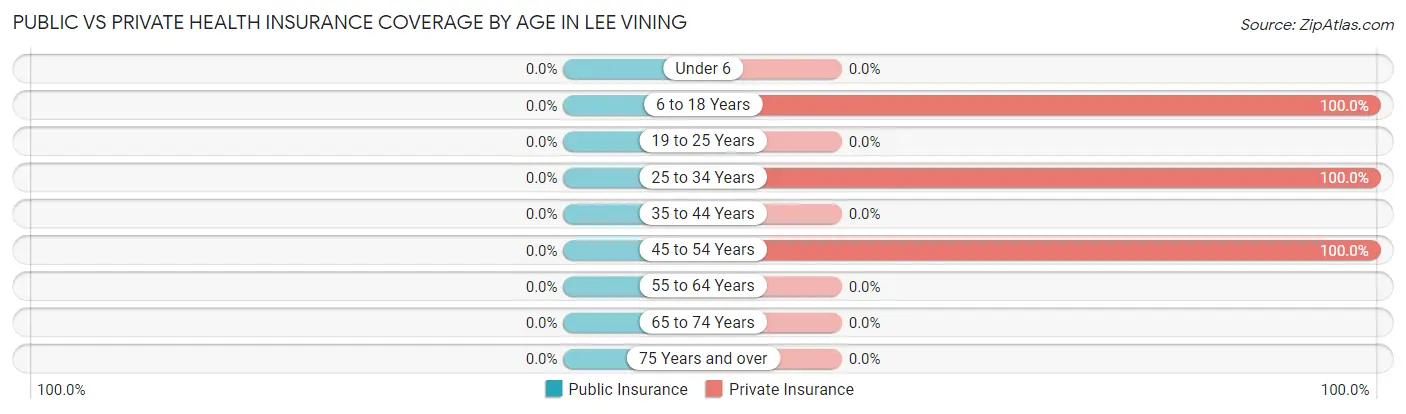
| Age Bracket | Public Insurance | Private Insurance |
| Under 6 | 0 (0.0%) | 0 (0.0%) |
| 6 to 18 Years | 0 (0.0%) | 298 (100.0%) |
| 19 to 25 Years | 0 (0.0%) | 0 (0.0%) |
| 25 to 34 Years | 0 (0.0%) | 68 (100.0%) |
| 35 to 44 Years | 0 (0.0%) | 0 (0.0%) |
| 45 to 54 Years | 0 (0.0%) | 228 (100.0%) |
| 55 to 64 Years | 0 (0.0%) | 0 (0.0%) |
| 65 to 74 Years | 0 (0.0%) | 0 (0.0%) |
| 75 Years and over | 0 (0.0%) | 0 (0.0%) |
| Total | 0 (0.0%) | 594 (100.0%) |
Disability Status by Sex by Age in Lee Vining
| Age Bracket | Male | Female |
| Under 5 Years | 0 (0.0%) | 0 (0.0%) |
| 5 to 17 Years | 0 (0.0%) | 0 (0.0%) |
| 18 to 34 Years | 0 (0.0%) | 0 (0.0%) |
| 35 to 64 Years | 0 (0.0%) | 0 (0.0%) |
| 65 to 74 Years | 0 (0.0%) | 0 (0.0%) |
| 75 Years and over | 0 (0.0%) | 0 (0.0%) |
Disability Class by Sex by Age in Lee Vining
Disability Class: Hearing Difficulty
| Age Bracket | Male | Female |
| Under 5 Years | 0 (0.0%) | 0 (0.0%) |
| 5 to 17 Years | 0 (0.0%) | 0 (0.0%) |
| 18 to 34 Years | 0 (0.0%) | 0 (0.0%) |
| 35 to 64 Years | 0 (0.0%) | 0 (0.0%) |
| 65 to 74 Years | 0 (0.0%) | 0 (0.0%) |
| 75 Years and over | 0 (0.0%) | 0 (0.0%) |
Disability Class: Vision Difficulty
| Age Bracket | Male | Female |
| Under 5 Years | 0 (0.0%) | 0 (0.0%) |
| 5 to 17 Years | 0 (0.0%) | 0 (0.0%) |
| 18 to 34 Years | 0 (0.0%) | 0 (0.0%) |
| 35 to 64 Years | 0 (0.0%) | 0 (0.0%) |
| 65 to 74 Years | 0 (0.0%) | 0 (0.0%) |
| 75 Years and over | 0 (0.0%) | 0 (0.0%) |
Disability Class: Cognitive Difficulty
| Age Bracket | Male | Female |
| 5 to 17 Years | 0 (0.0%) | 0 (0.0%) |
| 18 to 34 Years | 0 (0.0%) | 0 (0.0%) |
| 35 to 64 Years | 0 (0.0%) | 0 (0.0%) |
| 65 to 74 Years | 0 (0.0%) | 0 (0.0%) |
| 75 Years and over | 0 (0.0%) | 0 (0.0%) |
Disability Class: Ambulatory Difficulty
| Age Bracket | Male | Female |
| 5 to 17 Years | 0 (0.0%) | 0 (0.0%) |
| 18 to 34 Years | 0 (0.0%) | 0 (0.0%) |
| 35 to 64 Years | 0 (0.0%) | 0 (0.0%) |
| 65 to 74 Years | 0 (0.0%) | 0 (0.0%) |
| 75 Years and over | 0 (0.0%) | 0 (0.0%) |
Disability Class: Self-Care Difficulty
| Age Bracket | Male | Female |
| 5 to 17 Years | 0 (0.0%) | 0 (0.0%) |
| 18 to 34 Years | 0 (0.0%) | 0 (0.0%) |
| 35 to 64 Years | 0 (0.0%) | 0 (0.0%) |
| 65 to 74 Years | 0 (0.0%) | 0 (0.0%) |
| 75 Years and over | 0 (0.0%) | 0 (0.0%) |
Technology Access in Lee Vining
Computing Device Access in Lee Vining
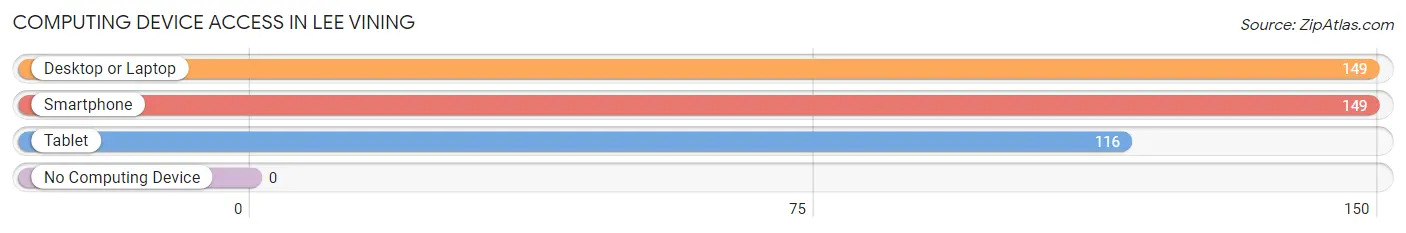
| Device Type | # Households | % Households |
| Desktop or Laptop | 149 | 100.0% |
| Smartphone | 149 | 100.0% |
| Tablet | 116 | 77.8% |
| No Computing Device | 0 | 0.0% |
| Total | 149 | 100.0% |
Internet Access in Lee Vining
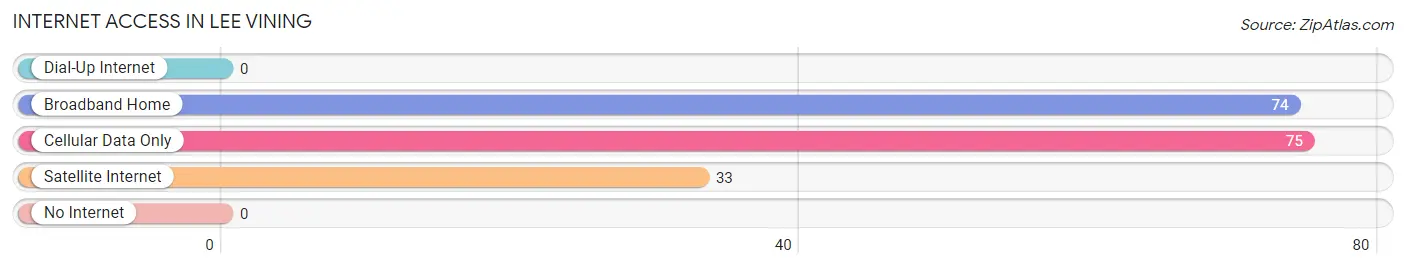
| Internet Type | # Households | % Households |
| Dial-Up Internet | 0 | 0.0% |
| Broadband Home | 74 | 49.7% |
| Cellular Data Only | 75 | 50.3% |
| Satellite Internet | 33 | 22.2% |
| No Internet | 0 | 0.0% |
| Total | 149 | 100.0% |
Lee Vining Summary
Lee Vining is a small town located in Mono County, California, United States. It is situated on the eastern side of the Sierra Nevada mountain range, at the base of the Mono Craters, and is the gateway to Yosemite National Park. The town is located on the south shore of Mono Lake, and is home to a population of approximately 200 people.
History
The area around Lee Vining has been inhabited by Native Americans for thousands of years. The Mono people, a branch of the Paiute tribe, were the first to settle in the area. They lived in the area for centuries, relying on the resources of the lake and the surrounding mountains for sustenance.
In the late 19th century, the area was settled by European-Americans, who established a small mining town. The town was named after John Lee, a miner who discovered gold in the area in 1864. The town grew quickly, and by the early 20th century, it had become a bustling center of commerce and industry.
The town was also home to a number of tourist attractions, including the Mono Lake Tufa State Natural Reserve, which was established in 1981. The reserve is home to a unique geological formation, created by the interaction of freshwater springs and the alkaline waters of Mono Lake.
Geography
Lee Vining is located in the Eastern Sierra Nevada mountain range, at the base of the Mono Craters. The town is situated on the south shore of Mono Lake, at an elevation of 6,741 feet (2,054 m). The town is surrounded by the Inyo National Forest, and is located approximately 25 miles (40 km) south of Yosemite National Park.
The town is located in a semi-arid climate, with hot summers and cold winters. The average annual temperature is 45°F (7°C), and the average annual precipitation is 8.5 inches (216 mm).
Economy
The economy of Lee Vining is largely based on tourism. The town is a popular destination for visitors to Yosemite National Park, and is home to a number of tourist attractions, including the Mono Lake Tufa State Natural Reserve. The town is also home to a number of restaurants, hotels, and other businesses catering to tourists.
In addition to tourism, the town is also home to a number of small businesses, including a gas station, a grocery store, and a post office. The town is also home to a number of artists and craftspeople, who sell their wares at local galleries and shops.
Demographics
As of the 2010 census, the population of Lee Vining was 200 people. The racial makeup of the town was 95.5% White, 0.5% African American, 0.5% Native American, 0.5% Asian, 0.5% Pacific Islander, and 2.0% from other races. The median household income was $37,500, and the median family income was $41,250.
Conclusion
Lee Vining is a small town located in Mono County, California, United States. It is situated on the eastern side of the Sierra Nevada mountain range, at the base of the Mono Craters, and is the gateway to Yosemite National Park. The town is home to a population of approximately 200 people, and is largely dependent on tourism for its economy. The town is also home to a number of small businesses, artists, and craftspeople, and is a popular destination for visitors to Yosemite National Park.
Common Questions
What is Per Capita Income in Lee Vining?
Per Capita income in Lee Vining is $24,616.
What is the Median Family Income in Lee Vining?
Median Family Income in Lee Vining is $135,017.
What is the Median Household income in Lee Vining?
Median Household Income in Lee Vining is $135,017.
What is Inequality or Gini Index in Lee Vining?
Inequality or Gini Index in Lee Vining is 0.17.
What is the Total Population of Lee Vining?
Total Population of Lee Vining is 594.
What is the Total Male Population of Lee Vining?
Total Male Population of Lee Vining is 376.
What is the Total Female Population of Lee Vining?
Total Female Population of Lee Vining is 218.
What is the Ratio of Males per 100 Females in Lee Vining?
There are 172.48 Males per 100 Females in Lee Vining.
What is the Ratio of Females per 100 Males in Lee Vining?
There are 57.98 Females per 100 Males in Lee Vining.
What is the Median Population Age in Lee Vining?
Median Population Age in Lee Vining is 16.0 Years.
What is the Average Family Size in Lee Vining
Average Family Size in Lee Vining is 4.0 People.
What is the Average Household Size in Lee Vining
Average Household Size in Lee Vining is 4.0 People.
How Large is the Labor Force in Lee Vining?
There are 261 People in the Labor Forcein in Lee Vining.
What is the Percentage of People in the Labor Force in Lee Vining?
88.2% of People are in the Labor Force in Lee Vining.
What is the Unemployment Rate in Lee Vining?
Unemployment Rate in Lee Vining is 12.6%.