Cities with the Highest Percentage of Population with a Degree in Physical and Health Sciences in South Dakota
RELATED REPORTS & OPTIONS
Physical and Health Sciences
South Dakota
Compare Cities
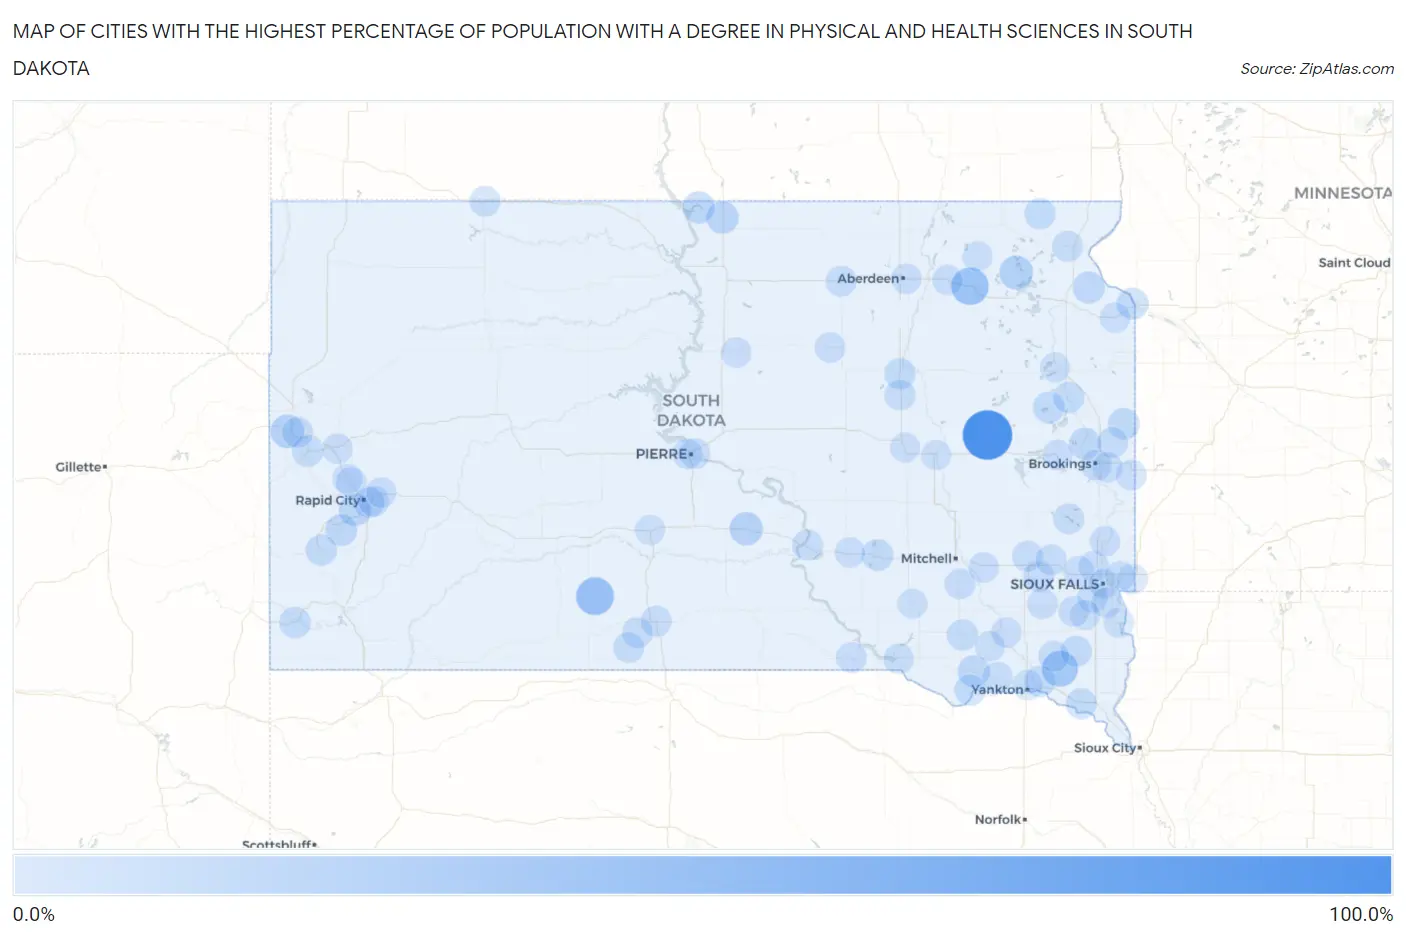
Map of Cities with the Highest Percentage of Population with a Degree in Physical and Health Sciences in South Dakota
0.0%
100.0%
Cities with the Highest Percentage of Population with a Degree in Physical and Health Sciences in South Dakota
| City | % Graduates | vs State | vs National | |
| 1. | Bancroft | 100.0% | 2.1%(+97.9)#1 | 3.1%(+96.9)#21 |
| 2. | Bridger | 50.0% | 2.1%(+47.9)#2 | 3.1%(+46.9)#95 |
| 3. | Norris | 38.5% | 2.1%(+36.3)#3 | 3.1%(+35.4)#160 |
| 4. | Andover | 36.4% | 2.1%(+34.2)#4 | 3.1%(+33.3)#181 |
| 5. | Wakonda | 28.8% | 2.1%(+26.7)#5 | 3.1%(+25.7)#282 |
| 6. | Roslyn | 17.9% | 2.1%(+15.7)#6 | 3.1%(+14.8)#651 |
| 7. | North Spearfish | 16.8% | 2.1%(+14.6)#7 | 3.1%(+13.7)#709 |
| 8. | Kennebec | 14.9% | 2.1%(+12.8)#8 | 3.1%(+11.8)#883 |
| 9. | Herreid | 10.8% | 2.1%(+8.71)#9 | 3.1%(+7.74)#1,405 |
| 10. | Colonial Pine Hills | 10.1% | 2.1%(+7.98)#10 | 3.1%(+7.02)#1,575 |
| 11. | Pollock | 9.5% | 2.1%(+7.39)#11 | 3.1%(+6.42)#1,725 |
| 12. | Tyndall | 9.4% | 2.1%(+7.27)#12 | 3.1%(+6.30)#1,754 |
| 13. | Wilmot | 9.1% | 2.1%(+6.96)#13 | 3.1%(+5.99)#1,848 |
| 14. | Bruce | 8.7% | 2.1%(+6.56)#14 | 3.1%(+5.60)#1,988 |
| 15. | Keystone | 8.5% | 2.1%(+6.38)#15 | 3.1%(+5.41)#2,050 |
| 16. | Astoria | 7.7% | 2.1%(+5.56)#16 | 3.1%(+4.59)#2,390 |
| 17. | Big Stone City | 7.3% | 2.1%(+5.14)#17 | 3.1%(+4.17)#2,600 |
| 18. | White Lake | 7.1% | 2.1%(+5.01)#18 | 3.1%(+4.04)#2,691 |
| 19. | Hayti | 7.0% | 2.1%(+4.88)#19 | 3.1%(+3.92)#2,776 |
| 20. | Oahe Acres | 6.9% | 2.1%(+4.80)#20 | 3.1%(+3.83)#2,818 |
| 21. | Edgemont | 6.1% | 2.1%(+3.95)#21 | 3.1%(+2.99)#3,386 |
| 22. | Redfield | 6.1% | 2.1%(+3.93)#22 | 3.1%(+2.96)#3,404 |
| 23. | Castlewood | 5.9% | 2.1%(+3.75)#23 | 3.1%(+2.78)#3,558 |
| 24. | Custer | 5.7% | 2.1%(+3.53)#24 | 3.1%(+2.57)#3,741 |
| 25. | Tripp | 5.5% | 2.1%(+3.33)#25 | 3.1%(+2.37)#3,929 |
| 26. | Springfield | 5.4% | 2.1%(+3.27)#26 | 3.1%(+2.31)#3,987 |
| 27. | Veblen | 4.9% | 2.1%(+2.78)#27 | 3.1%(+1.82)#4,547 |
| 28. | Deadwood | 4.8% | 2.1%(+2.64)#28 | 3.1%(+1.68)#4,725 |
| 29. | Mission Hill | 4.8% | 2.1%(+2.63)#29 | 3.1%(+1.66)#4,773 |
| 30. | Centerville | 4.7% | 2.1%(+2.56)#30 | 3.1%(+1.60)#4,851 |
| 31. | Vermillion | 4.5% | 2.1%(+2.38)#31 | 3.1%(+1.41)#5,139 |
| 32. | Chamberlain | 4.4% | 2.1%(+2.25)#32 | 3.1%(+1.28)#5,329 |
| 33. | Rapid City | 3.9% | 2.1%(+1.73)#33 | 3.1%(+0.762)#6,252 |
| 34. | Mission | 3.7% | 2.1%(+1.57)#34 | 3.1%(+0.604)#6,563 |
| 35. | Canistota | 3.7% | 2.1%(+1.57)#35 | 3.1%(+0.604)#6,569 |
| 36. | Salem | 3.5% | 2.1%(+1.40)#36 | 3.1%(+0.436)#6,947 |
| 37. | Montrose | 3.5% | 2.1%(+1.40)#37 | 3.1%(+0.430)#6,965 |
| 38. | Irene | 3.4% | 2.1%(+1.31)#38 | 3.1%(+0.349)#7,155 |
| 39. | Spearfish | 3.4% | 2.1%(+1.22)#39 | 3.1%(+0.258)#7,374 |
| 40. | Lake Madison | 3.3% | 2.1%(+1.21)#40 | 3.1%(+0.242)#7,408 |
| 41. | Rosebud | 3.3% | 2.1%(+1.20)#41 | 3.1%(+0.234)#7,429 |
| 42. | Sisseton | 3.3% | 2.1%(+1.14)#42 | 3.1%(+0.173)#7,590 |
| 43. | Brookings | 3.2% | 2.1%(+1.09)#43 | 3.1%(+0.129)#7,684 |
| 44. | Tabor | 3.2% | 2.1%(+1.09)#44 | 3.1%(+0.126)#7,708 |
| 45. | Ipswich | 3.2% | 2.1%(+1.04)#45 | 3.1%(+0.075)#7,826 |
| 46. | White | 3.2% | 2.1%(+1.04)#46 | 3.1%(+0.075)#7,830 |
| 47. | St Francis | 3.1% | 2.1%(+0.991)#47 | 3.1%(+0.025)#7,951 |
| 48. | Tulare | 3.1% | 2.1%(+0.991)#48 | 3.1%(+0.025)#7,956 |
| 49. | Ethan | 3.0% | 2.1%(+0.896)#49 | 3.1%(-0.069)#8,218 |
| 50. | Lemmon | 2.9% | 2.1%(+0.773)#50 | 3.1%(-0.193)#8,568 |
| 51. | Hartford | 2.8% | 2.1%(+0.658)#51 | 3.1%(-0.308)#8,910 |
| 52. | Chancellor | 2.7% | 2.1%(+0.569)#52 | 3.1%(-0.397)#9,201 |
| 53. | Bonesteel | 2.7% | 2.1%(+0.569)#53 | 3.1%(-0.397)#9,202 |
| 54. | Sturgis | 2.7% | 2.1%(+0.524)#54 | 3.1%(-0.442)#9,330 |
| 55. | Tea | 2.4% | 2.1%(+0.310)#55 | 3.1%(-0.656)#9,956 |
| 56. | Elkton | 2.4% | 2.1%(+0.285)#56 | 3.1%(-0.680)#10,031 |
| 57. | Summerset | 2.2% | 2.1%(+0.069)#57 | 3.1%(-0.897)#10,677 |
| 58. | Pierre | 2.2% | 2.1%(+0.054)#58 | 3.1%(-0.911)#10,723 |
| 59. | Crooks | 2.2% | 2.1%(+0.047)#59 | 3.1%(-0.919)#10,745 |
| 60. | Faulkton | 2.0% | 2.1%(-0.114)#60 | 3.1%(-1.08)#11,228 |
| 61. | Marion | 1.9% | 2.1%(-0.247)#61 | 3.1%(-1.21)#11,635 |
| 62. | Arlington | 1.9% | 2.1%(-0.247)#62 | 3.1%(-1.21)#11,636 |
| 63. | Dell Rapids | 1.9% | 2.1%(-0.272)#63 | 3.1%(-1.24)#11,702 |
| 64. | Aberdeen | 1.8% | 2.1%(-0.322)#64 | 3.1%(-1.29)#11,854 |
| 65. | Rapid Valley | 1.8% | 2.1%(-0.329)#65 | 3.1%(-1.29)#11,886 |
| 66. | Sioux Falls | 1.8% | 2.1%(-0.340)#66 | 3.1%(-1.31)#11,917 |
| 67. | Milbank | 1.7% | 2.1%(-0.459)#67 | 3.1%(-1.42)#12,256 |
| 68. | Gettysburg | 1.5% | 2.1%(-0.613)#68 | 3.1%(-1.58)#12,675 |
| 69. | Fort Pierre | 1.4% | 2.1%(-0.693)#69 | 3.1%(-1.66)#12,886 |
| 70. | Menno | 1.4% | 2.1%(-0.706)#70 | 3.1%(-1.67)#12,921 |
| 71. | Box Elder | 1.4% | 2.1%(-0.730)#71 | 3.1%(-1.70)#12,978 |
| 72. | Alexandria | 1.4% | 2.1%(-0.735)#72 | 3.1%(-1.70)#12,991 |
| 73. | Harrisburg | 1.3% | 2.1%(-0.817)#73 | 3.1%(-1.78)#13,194 |
| 74. | Aurora | 1.3% | 2.1%(-0.825)#74 | 3.1%(-1.79)#13,218 |
| 75. | Kimball | 1.3% | 2.1%(-0.835)#75 | 3.1%(-1.80)#13,249 |
| 76. | Groton | 1.2% | 2.1%(-0.892)#76 | 3.1%(-1.86)#13,386 |
| 77. | Pickstown | 1.2% | 2.1%(-0.929)#77 | 3.1%(-1.89)#13,477 |
| 78. | Lennox | 1.1% | 2.1%(-1.07)#78 | 3.1%(-2.03)#13,805 |
| 79. | Valley Springs | 1.0% | 2.1%(-1.09)#79 | 3.1%(-2.06)#13,877 |
| 80. | Scotland | 1.0% | 2.1%(-1.12)#80 | 3.1%(-2.09)#13,945 |
| 81. | Wolsey | 1.0% | 2.1%(-1.13)#81 | 3.1%(-2.10)#13,966 |
| 82. | Brandon | 0.95% | 2.1%(-1.18)#82 | 3.1%(-2.15)#14,085 |
| 83. | Canton | 0.94% | 2.1%(-1.20)#83 | 3.1%(-2.16)#14,110 |
| 84. | Langford | 0.90% | 2.1%(-1.23)#84 | 3.1%(-2.20)#14,184 |
| 85. | Corsica | 0.84% | 2.1%(-1.29)#85 | 3.1%(-2.26)#14,299 |
| 86. | Murdo | 0.75% | 2.1%(-1.39)#86 | 3.1%(-2.35)#14,472 |
| 87. | Piedmont | 0.58% | 2.1%(-1.55)#87 | 3.1%(-2.51)#14,674 |
| 88. | Watertown | 0.53% | 2.1%(-1.60)#88 | 3.1%(-2.57)#14,738 |
| 89. | Huron | 0.50% | 2.1%(-1.63)#89 | 3.1%(-2.60)#14,778 |
| 90. | Yankton | 0.34% | 2.1%(-1.79)#90 | 3.1%(-2.76)#14,928 |
Common Questions
What are the Top 10 Cities with the Highest Percentage of Population with a Degree in Physical and Health Sciences in South Dakota?
Top 10 Cities with the Highest Percentage of Population with a Degree in Physical and Health Sciences in South Dakota are:
#1
100.0%
#2
38.5%
#3
36.4%
#4
28.8%
#5
17.9%
#6
16.8%
#7
14.9%
#8
10.8%
#9
10.1%
#10
9.5%
What city has the Highest Percentage of Population with a Degree in Physical and Health Sciences in South Dakota?
Bancroft has the Highest Percentage of Population with a Degree in Physical and Health Sciences in South Dakota with 100.0%.
What is the Percentage of Population with a Degree in Physical and Health Sciences in the State of South Dakota?
Percentage of Population with a Degree in Physical and Health Sciences in South Dakota is 2.1%.
What is the Percentage of Population with a Degree in Physical and Health Sciences in the United States?
Percentage of Population with a Degree in Physical and Health Sciences in the United States is 3.1%.