Zip Codes with the Highest Percentage of Population with a Degree in Physical and Health Sciences in San Jose, CA
RELATED REPORTS & OPTIONS
Physical and Health Sciences
San Jose
Compare Zip Codes
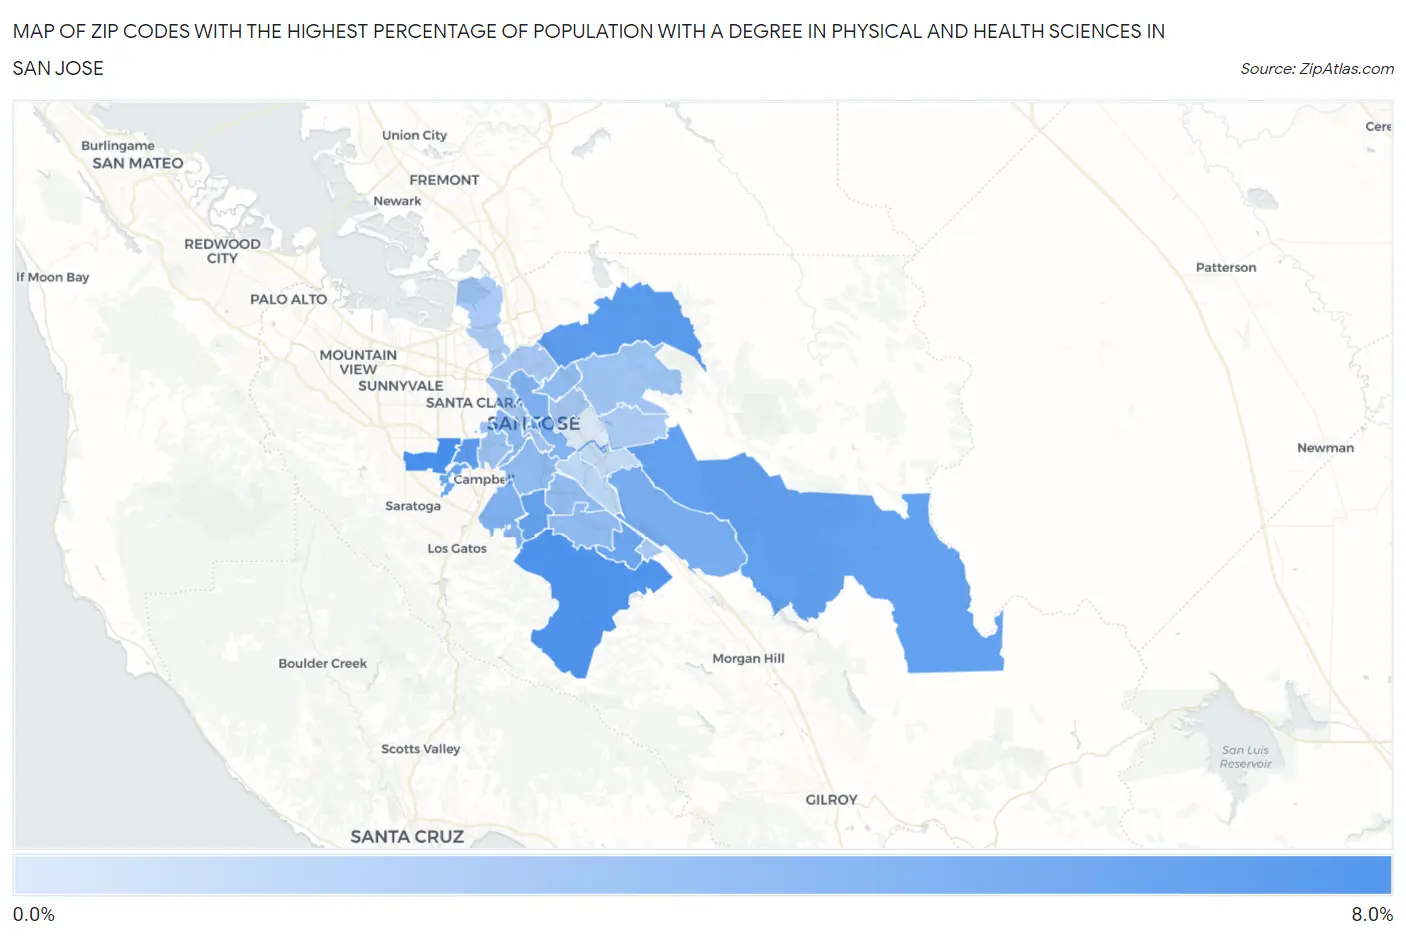
Map of Zip Codes with the Highest Percentage of Population with a Degree in Physical and Health Sciences in San Jose
1.5%
6.2%
Zip Codes with the Highest Percentage of Population with a Degree in Physical and Health Sciences in San Jose, CA
| Zip Code | % Graduates | vs State | vs National | |
| 1. | 95129 | 6.2% | 3.1%(+3.07)#150 | 3.1%(+3.08)#3,096 |
| 2. | 95120 | 6.0% | 3.1%(+2.86)#159 | 3.1%(+2.88)#3,292 |
| 3. | 95132 | 5.5% | 3.1%(+2.42)#190 | 3.1%(+2.44)#3,779 |
| 4. | 95113 | 5.5% | 3.1%(+2.37)#193 | 3.1%(+2.38)#3,851 |
| 5. | 95117 | 5.5% | 3.1%(+2.37)#194 | 3.1%(+2.38)#3,852 |
| 6. | 95135 | 5.3% | 3.1%(+2.16)#206 | 3.1%(+2.18)#4,112 |
| 7. | 95118 | 5.2% | 3.1%(+2.13)#208 | 3.1%(+2.15)#4,159 |
| 8. | 95130 | 5.1% | 3.1%(+1.97)#218 | 3.1%(+1.99)#4,404 |
| 9. | 95119 | 5.0% | 3.1%(+1.89)#230 | 3.1%(+1.91)#4,528 |
| 10. | 95138 | 4.7% | 3.1%(+1.57)#259 | 3.1%(+1.59)#5,139 |
| 11. | 95124 | 4.4% | 3.1%(+1.27)#294 | 3.1%(+1.28)#5,791 |
| 12. | 95112 | 4.3% | 3.1%(+1.22)#304 | 3.1%(+1.24)#5,888 |
| 13. | 95126 | 3.9% | 3.1%(+0.799)#371 | 3.1%(+0.815)#6,999 |
| 14. | 95123 | 3.9% | 3.1%(+0.777)#377 | 3.1%(+0.792)#7,067 |
| 15. | 95133 | 3.9% | 3.1%(+0.769)#381 | 3.1%(+0.785)#7,093 |
| 16. | 95125 | 3.9% | 3.1%(+0.767)#382 | 3.1%(+0.782)#7,104 |
| 17. | 95136 | 3.8% | 3.1%(+0.702)#400 | 3.1%(+0.717)#7,298 |
| 18. | 95128 | 3.6% | 3.1%(+0.453)#457 | 3.1%(+0.469)#8,182 |
| 19. | 95127 | 3.4% | 3.1%(+0.276)#498 | 3.1%(+0.292)#8,831 |
| 20. | 95116 | 3.3% | 3.1%(+0.205)#522 | 3.1%(+0.221)#9,118 |
| 21. | 95110 | 3.3% | 3.1%(+0.157)#534 | 3.1%(+0.172)#9,296 |
| 22. | 95131 | 3.2% | 3.1%(+0.126)#548 | 3.1%(+0.141)#9,427 |
| 23. | 95139 | 3.2% | 3.1%(+0.036)#575 | 3.1%(+0.052)#9,769 |
| 24. | 95148 | 3.1% | 3.1%(-0.021)#594 | 3.1%(-0.006)#10,003 |
| 25. | 95134 | 3.1% | 3.1%(-0.047)#603 | 3.1%(-0.032)#10,124 |
| 26. | 95111 | 2.4% | 3.1%(-0.696)#839 | 3.1%(-0.680)#13,082 |
| 27. | 95121 | 2.2% | 3.1%(-0.869)#919 | 3.1%(-0.853)#13,935 |
| 28. | 95122 | 1.5% | 3.1%(-1.57)#1,151 | 3.1%(-1.56)#17,132 |
1
Common Questions
What are the Top 10 Zip Codes with the Highest Percentage of Population with a Degree in Physical and Health Sciences in San Jose, CA?
Top 10 Zip Codes with the Highest Percentage of Population with a Degree in Physical and Health Sciences in San Jose, CA are:
What zip code has the Highest Percentage of Population with a Degree in Physical and Health Sciences in San Jose, CA?
95129 has the Highest Percentage of Population with a Degree in Physical and Health Sciences in San Jose, CA with 6.2%.
What is the Percentage of Population with a Degree in Physical and Health Sciences in San Jose, CA?
Percentage of Population with a Degree in Physical and Health Sciences in San Jose is 4.2%.
What is the Percentage of Population with a Degree in Physical and Health Sciences in California?
Percentage of Population with a Degree in Physical and Health Sciences in California is 3.1%.
What is the Percentage of Population with a Degree in Physical and Health Sciences in the United States?
Percentage of Population with a Degree in Physical and Health Sciences in the United States is 3.1%.