Patterson, CA Map & Demographics
Patterson Map
Patterson Overview
$29,091
PER CAPITA INCOME
$88,663
AVG FAMILY INCOME
$86,031
AVG HOUSEHOLD INCOME
35.9%
WAGE / INCOME GAP [ % ]
64.1¢/ $1
WAGE / INCOME GAP [ $ ]
$8,361
FAMILY INCOME DEFICIT
0.38
INEQUALITY / GINI INDEX
23,678
TOTAL POPULATION
12,201
MALE POPULATION
11,477
FEMALE POPULATION
106.31
MALES / 100 FEMALES
94.07
FEMALES / 100 MALES
30.4
MEDIAN AGE
4.1
AVG FAMILY SIZE
3.7
AVG HOUSEHOLD SIZE
10,986
LABOR FORCE [ PEOPLE ]
64.3%
PERCENT IN LABOR FORCE
7.4%
UNEMPLOYMENT RATE
Patterson Zip Codes
Patterson Area Codes
Income in Patterson
Income Overview in Patterson
Per Capita Income in Patterson is $29,091, while median incomes of families and households are $88,663 and $86,031 respectively.
| Characteristic | Number | Measure |
| Per Capita Income | 23,678 | $29,091 |
| Median Family Income | 5,321 | $88,663 |
| Mean Family Income | 5,321 | $105,938 |
| Median Household Income | 6,345 | $86,031 |
| Mean Household Income | 6,345 | $104,723 |
| Income Deficit | 5,321 | $8,361 |
| Wage / Income Gap (%) | 23,678 | 35.90% |
| Wage / Income Gap ($) | 23,678 | 64.10¢ per $1 |
| Gini / Inequality Index | 23,678 | 0.38 |
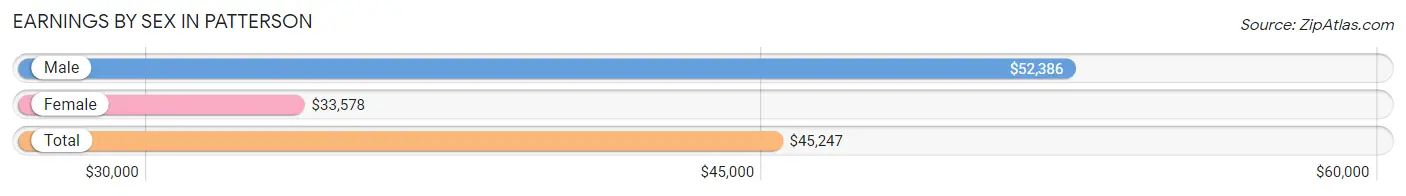
Earnings by Sex in Patterson
Average Earnings in Patterson are $45,247, $52,386 for men and $33,578 for women, a difference of 35.9%.
| Sex | Number | Average Earnings |
| Male | 6,557 (59.4%) | $52,386 |
| Female | 4,490 (40.6%) | $33,578 |
| Total | 11,047 (100.0%) | $45,247 |
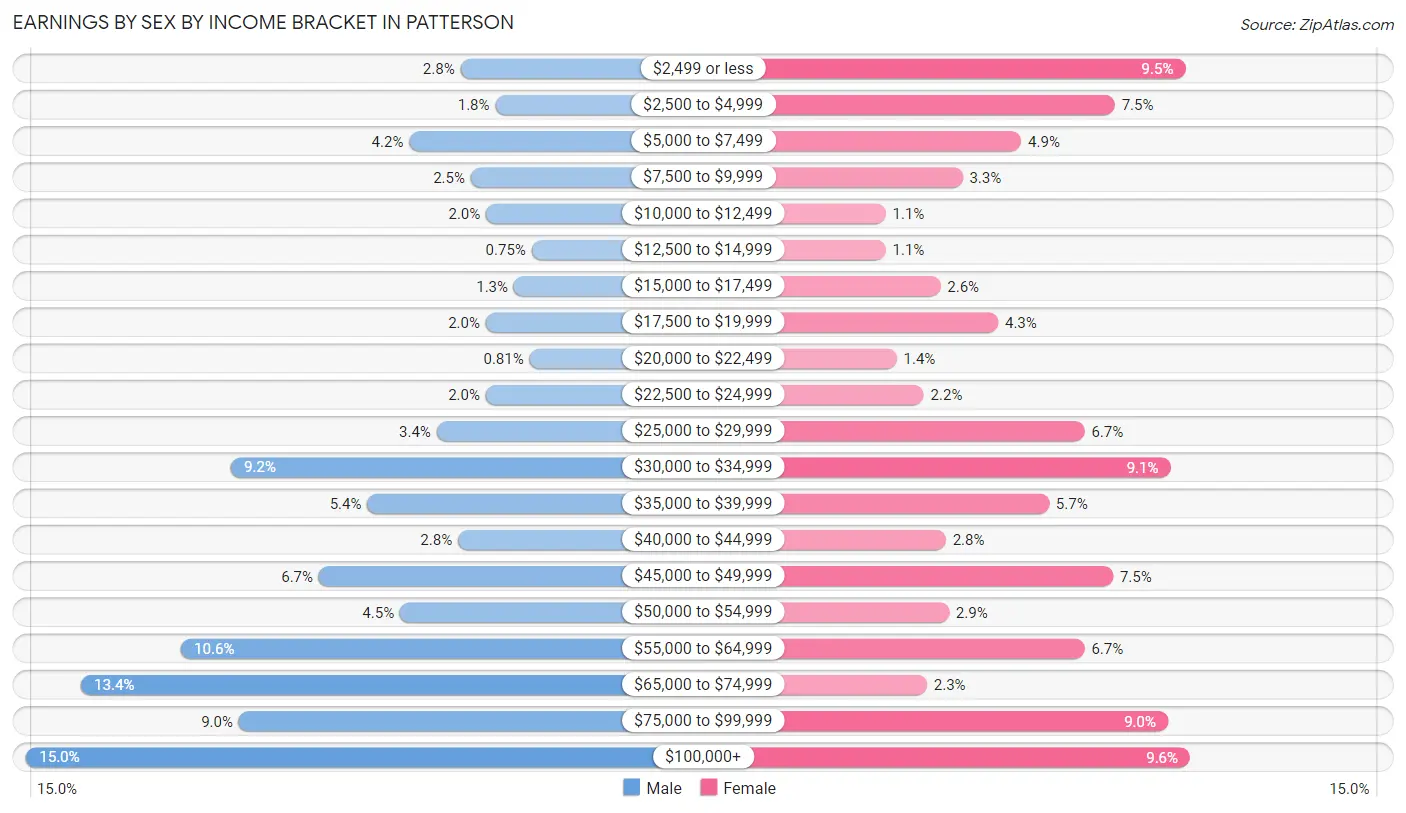
Earnings by Sex by Income Bracket in Patterson
The most common earnings brackets in Patterson are $100,000+ for men (980 | 14.9%) and $100,000+ for women (433 | 9.6%).
| Income | Male | Female |
| $2,499 or less | 180 (2.8%) | 427 (9.5%) |
| $2,500 to $4,999 | 116 (1.8%) | 338 (7.5%) |
| $5,000 to $7,499 | 275 (4.2%) | 220 (4.9%) |
| $7,500 to $9,999 | 161 (2.5%) | 146 (3.3%) |
| $10,000 to $12,499 | 133 (2.0%) | 49 (1.1%) |
| $12,500 to $14,999 | 49 (0.7%) | 49 (1.1%) |
| $15,000 to $17,499 | 82 (1.3%) | 118 (2.6%) |
| $17,500 to $19,999 | 134 (2.0%) | 191 (4.3%) |
| $20,000 to $22,499 | 53 (0.8%) | 63 (1.4%) |
| $22,500 to $24,999 | 134 (2.0%) | 97 (2.2%) |
| $25,000 to $29,999 | 224 (3.4%) | 300 (6.7%) |
| $30,000 to $34,999 | 603 (9.2%) | 408 (9.1%) |
| $35,000 to $39,999 | 352 (5.4%) | 255 (5.7%) |
| $40,000 to $44,999 | 185 (2.8%) | 125 (2.8%) |
| $45,000 to $49,999 | 441 (6.7%) | 336 (7.5%) |
| $50,000 to $54,999 | 292 (4.4%) | 129 (2.9%) |
| $55,000 to $64,999 | 695 (10.6%) | 300 (6.7%) |
| $65,000 to $74,999 | 879 (13.4%) | 101 (2.2%) |
| $75,000 to $99,999 | 589 (9.0%) | 405 (9.0%) |
| $100,000+ | 980 (14.9%) | 433 (9.6%) |
| Total | 6,557 (100.0%) | 4,490 (100.0%) |
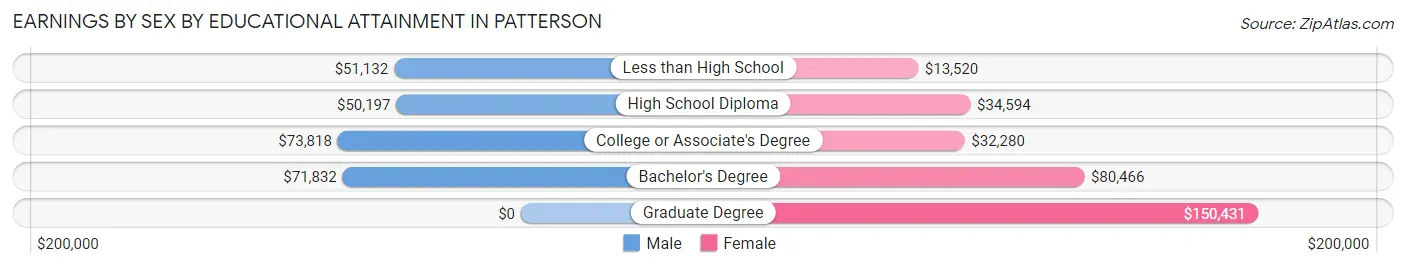
Earnings by Sex by Educational Attainment in Patterson
Average earnings in Patterson are $58,982 for men and $36,885 for women, a difference of 37.5%. Men with an educational attainment of college or associate's degree enjoy the highest average annual earnings of $73,818, while those with high school diploma education earn the least with $50,197. Women with an educational attainment of graduate degree earn the most with the average annual earnings of $150,431, while those with less than high school education have the smallest earnings of $13,520.
| Educational Attainment | Male Income | Female Income |
| Less than High School | $51,132 | $13,520 |
| High School Diploma | $50,197 | $34,594 |
| College or Associate's Degree | $73,818 | $32,280 |
| Bachelor's Degree | $71,832 | $80,466 |
| Graduate Degree | - | - |
| Total | $58,982 | $36,885 |
Family Income in Patterson
Family Income Brackets in Patterson
According to the Patterson family income data, there are 1,234 families falling into the $100,000 to $149,999 income range, which is the most common income bracket and makes up 23.2% of all families. Conversely, the less than $10,000 income bracket is the least frequent group with only 53 families (1.0%) belonging to this category.
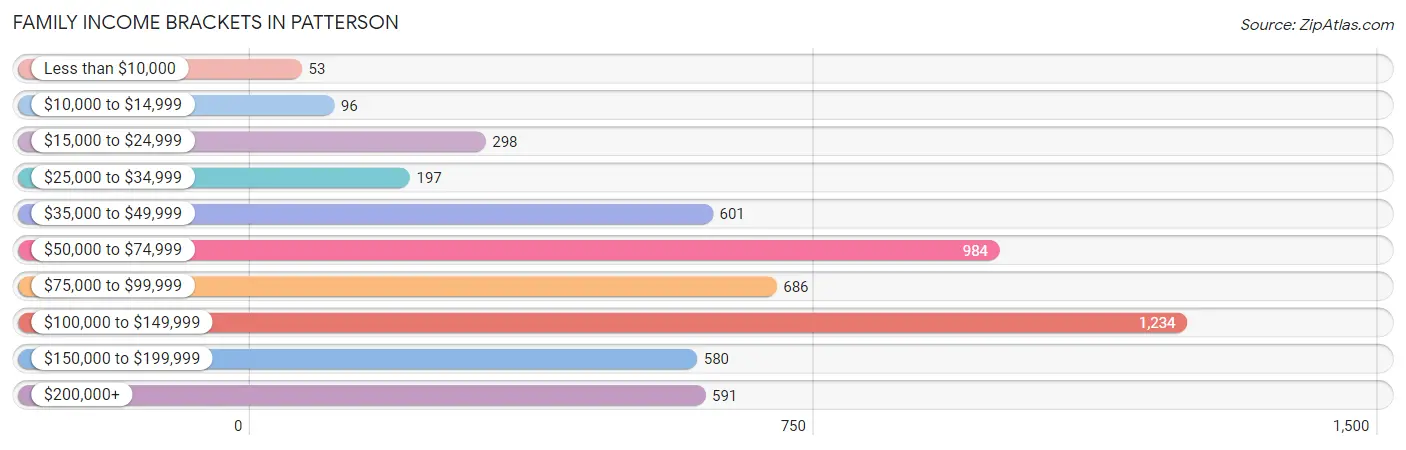
| Income Bracket | # Families | % Families |
| Less than $10,000 | 53 | 1.0% |
| $10,000 to $14,999 | 96 | 1.8% |
| $15,000 to $24,999 | 298 | 5.6% |
| $25,000 to $34,999 | 197 | 3.7% |
| $35,000 to $49,999 | 601 | 11.3% |
| $50,000 to $74,999 | 984 | 18.5% |
| $75,000 to $99,999 | 686 | 12.9% |
| $100,000 to $149,999 | 1,234 | 23.2% |
| $150,000 to $199,999 | 580 | 10.9% |
| $200,000+ | 591 | 11.1% |
Family Income by Famaliy Size in Patterson
7+ person families (227 | 4.3%) account for the highest median family income in Patterson with $160,677 per family, while 4-person families (1,464 | 27.5%) have the highest median income of $35,547 per family member.
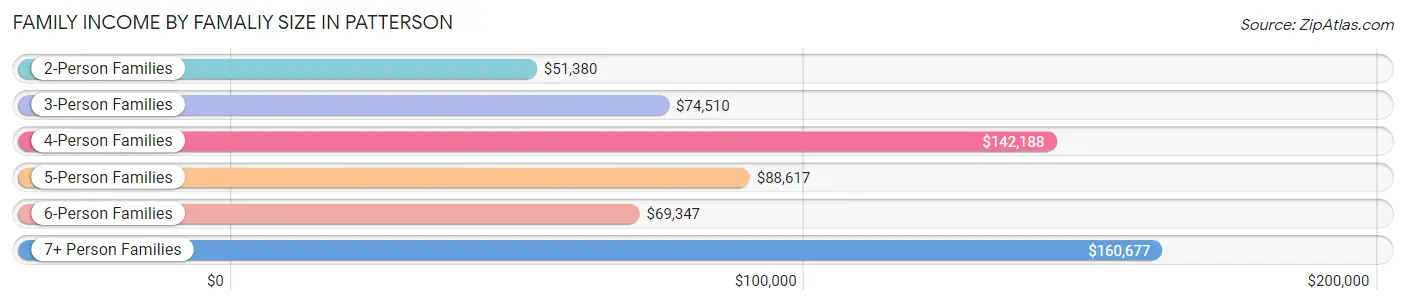
| Income Bracket | # Families | Median Income |
| 2-Person Families | 947 (17.8%) | $51,380 |
| 3-Person Families | 1,288 (24.2%) | $74,510 |
| 4-Person Families | 1,464 (27.5%) | $142,188 |
| 5-Person Families | 766 (14.4%) | $88,617 |
| 6-Person Families | 629 (11.8%) | $69,347 |
| 7+ Person Families | 227 (4.3%) | $160,677 |
| Total | 5,321 (100.0%) | $88,663 |
Family Income by Number of Earners in Patterson
The median family income in Patterson is $88,663, with families comprising 3+ earners (1,037) having the highest median family income of $139,886, while families with no earners (610) have the lowest median family income of $33,409, accounting for 19.5% and 11.5% of families, respectively.
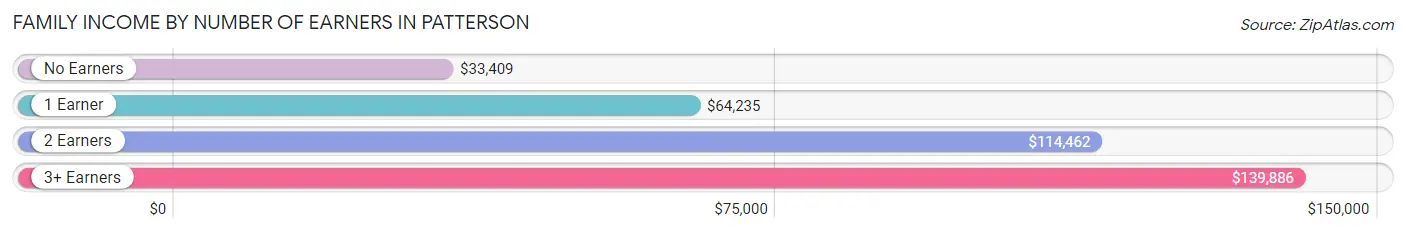
| Number of Earners | # Families | Median Income |
| No Earners | 610 (11.5%) | $33,409 |
| 1 Earner | 1,691 (31.8%) | $64,235 |
| 2 Earners | 1,983 (37.3%) | $114,462 |
| 3+ Earners | 1,037 (19.5%) | $139,886 |
| Total | 5,321 (100.0%) | $88,663 |
Household Income in Patterson
Household Income Brackets in Patterson
With 1,409 households falling in the category, the $100,000 to $149,999 income range is the most frequent in Patterson, accounting for 22.2% of all households. In contrast, only 133 households (2.1%) fall into the less than $10,000 income bracket, making it the least populous group.
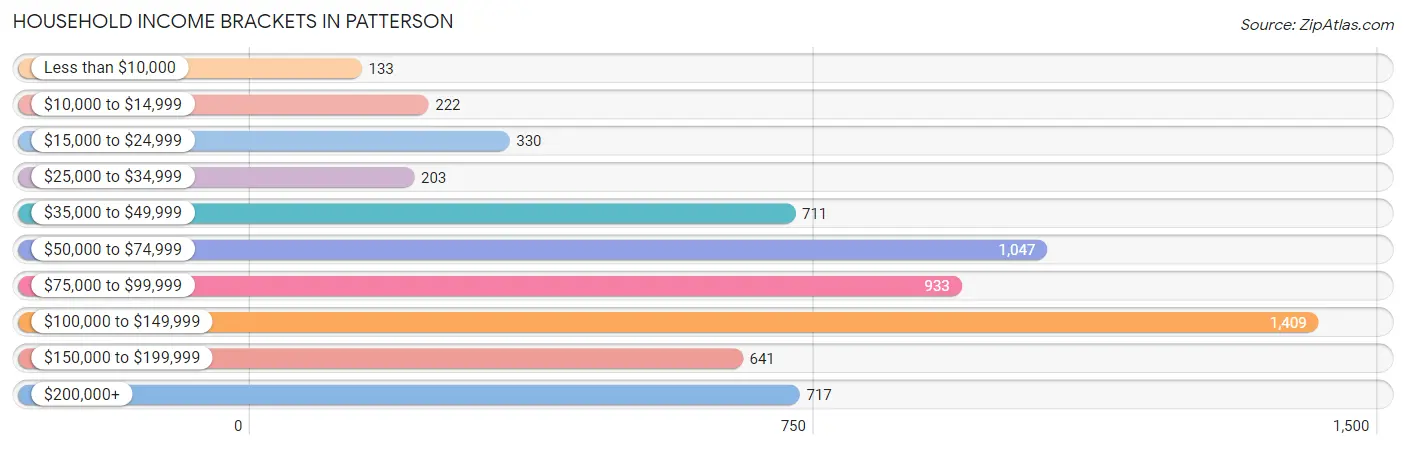
| Income Bracket | # Households | % Households |
| Less than $10,000 | 133 | 2.1% |
| $10,000 to $14,999 | 222 | 3.5% |
| $15,000 to $24,999 | 330 | 5.2% |
| $25,000 to $34,999 | 203 | 3.2% |
| $35,000 to $49,999 | 711 | 11.2% |
| $50,000 to $74,999 | 1,047 | 16.5% |
| $75,000 to $99,999 | 933 | 14.7% |
| $100,000 to $149,999 | 1,409 | 22.2% |
| $150,000 to $199,999 | 641 | 10.1% |
| $200,000+ | 717 | 11.3% |
Household Income by Householder Age in Patterson
The median household income in Patterson is $86,031, with the highest median household income of $108,432 found in the 45 to 64 years age bracket for the primary householder. A total of 2,437 households (38.4%) fall into this category. Meanwhile, the 65+ years age bracket for the primary householder has the lowest median household income of $44,516, with 868 households (13.7%) in this group.
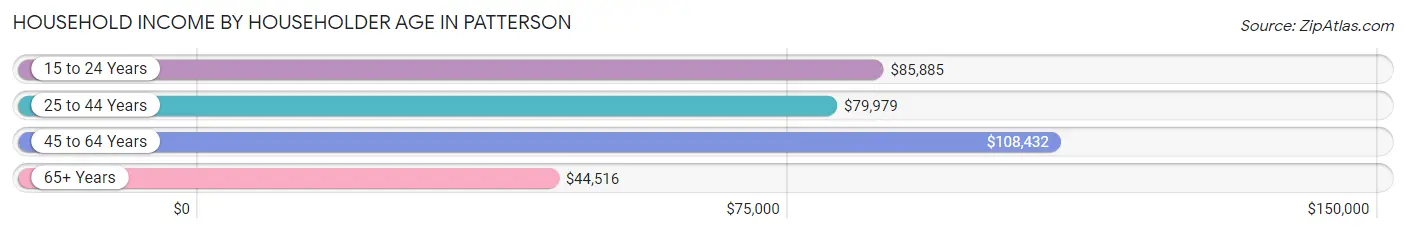
| Income Bracket | # Households | Median Income |
| 15 to 24 Years | 177 (2.8%) | $85,885 |
| 25 to 44 Years | 2,863 (45.1%) | $79,979 |
| 45 to 64 Years | 2,437 (38.4%) | $108,432 |
| 65+ Years | 868 (13.7%) | $44,516 |
| Total | 6,345 (100.0%) | $86,031 |
Poverty in Patterson
Income Below Poverty by Sex and Age in Patterson
With 6.1% poverty level for males and 9.7% for females among the residents of Patterson, 65 to 74 year old males and 65 to 74 year old females are the most vulnerable to poverty, with 104 males (27.4%) and 148 females (25.5%) in their respective age groups living below the poverty level.
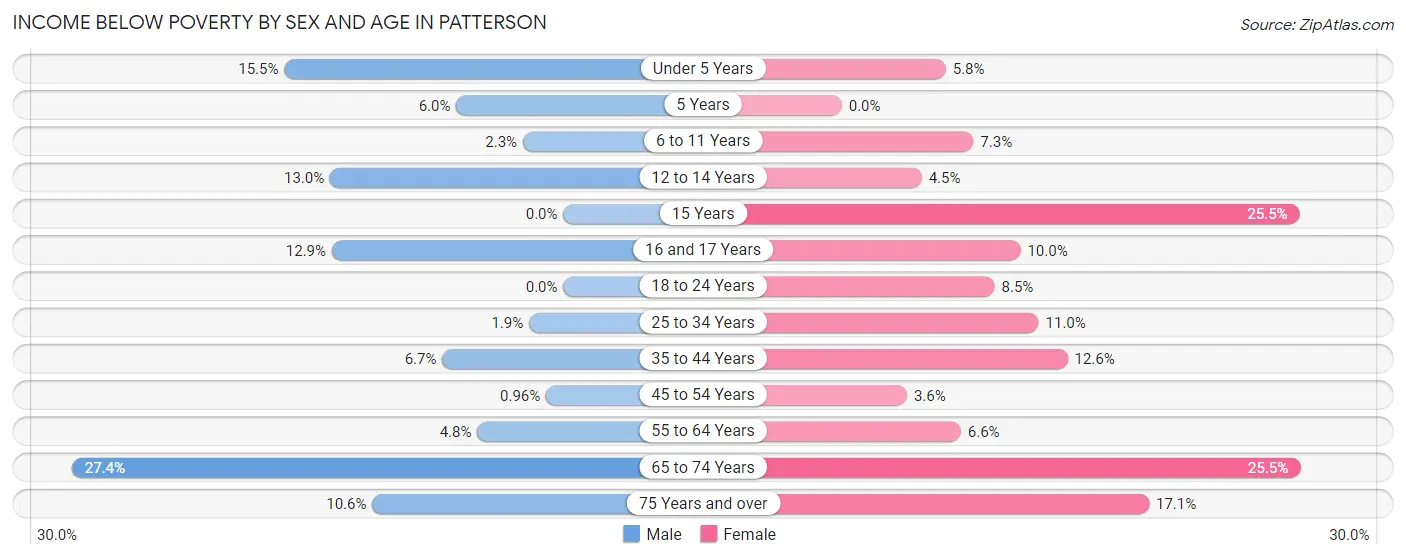
| Age Bracket | Male | Female |
| Under 5 Years | 182 (15.5%) | 58 (5.8%) |
| 5 Years | 19 (6.0%) | 0 (0.0%) |
| 6 to 11 Years | 22 (2.2%) | 96 (7.3%) |
| 12 to 14 Years | 73 (13.0%) | 26 (4.4%) |
| 15 Years | 0 (0.0%) | 40 (25.5%) |
| 16 and 17 Years | 74 (12.9%) | 38 (10.0%) |
| 18 to 24 Years | 0 (0.0%) | 94 (8.5%) |
| 25 to 34 Years | 26 (1.9%) | 173 (11.0%) |
| 35 to 44 Years | 138 (6.7%) | 218 (12.6%) |
| 45 to 54 Years | 13 (1.0%) | 51 (3.6%) |
| 55 to 64 Years | 56 (4.8%) | 60 (6.6%) |
| 65 to 74 Years | 104 (27.4%) | 148 (25.5%) |
| 75 Years and over | 40 (10.6%) | 103 (17.1%) |
| Total | 747 (6.1%) | 1,105 (9.7%) |
Income Above Poverty by Sex and Age in Patterson
According to the poverty statistics in Patterson, males aged 15 years and females aged 5 years are the age groups that are most secure financially, with 100.0% of males and 100.0% of females in these age groups living above the poverty line.
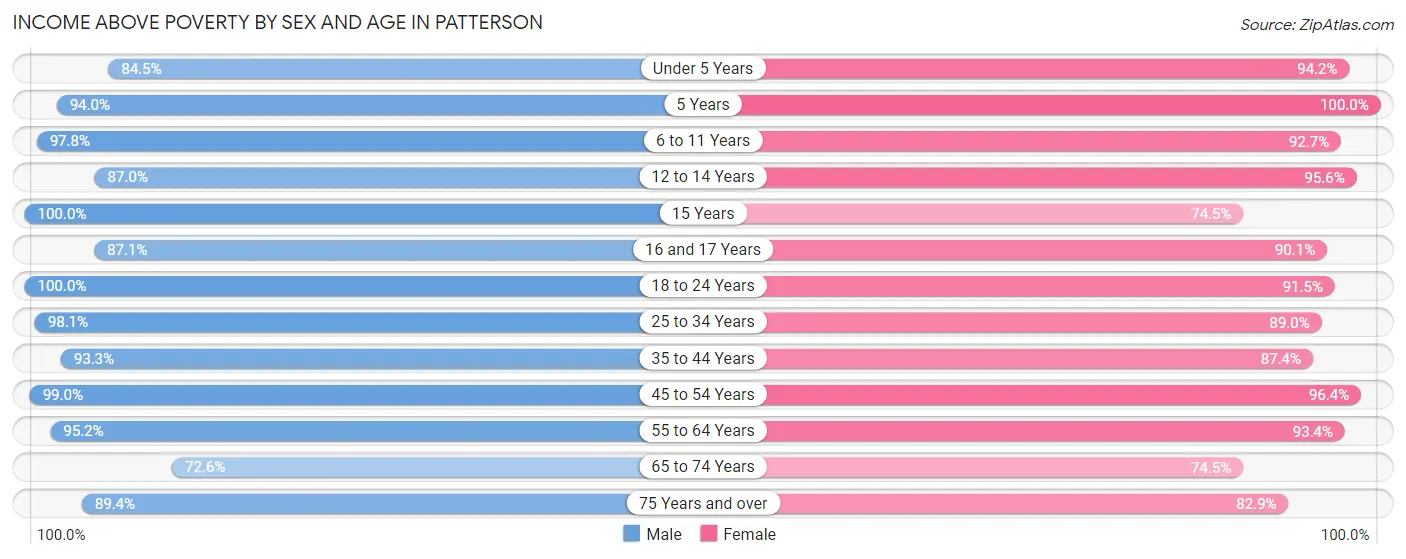
| Age Bracket | Male | Female |
| Under 5 Years | 989 (84.5%) | 943 (94.2%) |
| 5 Years | 300 (94.0%) | 81 (100.0%) |
| 6 to 11 Years | 955 (97.8%) | 1,213 (92.7%) |
| 12 to 14 Years | 489 (87.0%) | 558 (95.6%) |
| 15 Years | 376 (100.0%) | 117 (74.5%) |
| 16 and 17 Years | 500 (87.1%) | 344 (90.0%) |
| 18 to 24 Years | 1,539 (100.0%) | 1,011 (91.5%) |
| 25 to 34 Years | 1,336 (98.1%) | 1,405 (89.0%) |
| 35 to 44 Years | 1,909 (93.3%) | 1,516 (87.4%) |
| 45 to 54 Years | 1,336 (99.0%) | 1,354 (96.4%) |
| 55 to 64 Years | 1,112 (95.2%) | 845 (93.4%) |
| 65 to 74 Years | 276 (72.6%) | 432 (74.5%) |
| 75 Years and over | 336 (89.4%) | 499 (82.9%) |
| Total | 11,453 (93.9%) | 10,318 (90.3%) |
Income Below Poverty Among Married-Couple Families in Patterson
The poverty statistics for married-couple families in Patterson show that 5.1% or 200 of the total 3,923 families live below the poverty line. Families with 3 or 4 children have the highest poverty rate of 8.5%, comprising of 48 families. On the other hand, families with 5 or more children have the lowest poverty rate of 0.0%, which includes 0 families.
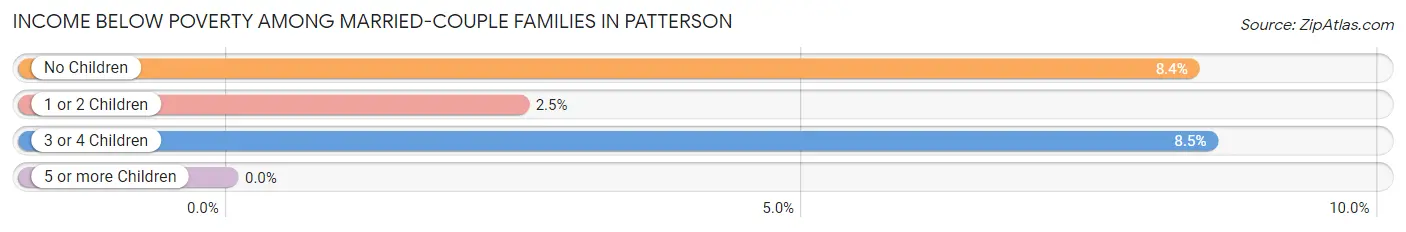
| Children | Above Poverty | Below Poverty |
| No Children | 1,095 (91.6%) | 100 (8.4%) |
| 1 or 2 Children | 2,004 (97.5%) | 52 (2.5%) |
| 3 or 4 Children | 515 (91.5%) | 48 (8.5%) |
| 5 or more Children | 109 (100.0%) | 0 (0.0%) |
| Total | 3,723 (94.9%) | 200 (5.1%) |
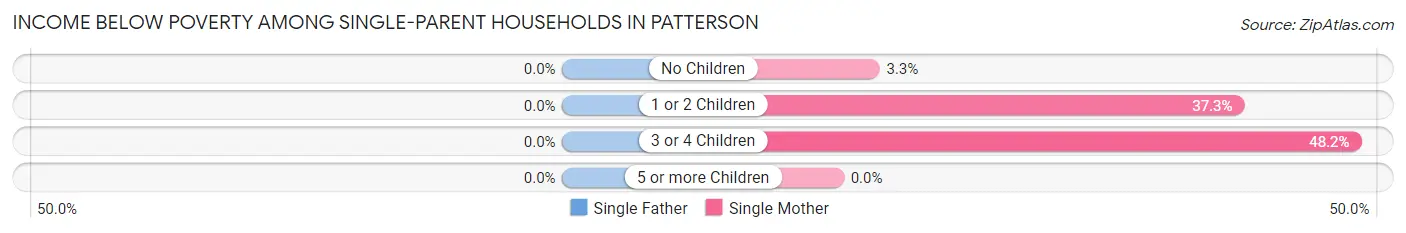
Income Below Poverty Among Single-Parent Households in Patterson
| Children | Single Father | Single Mother |
| No Children | 0 (0.0%) | 12 (3.3%) |
| 1 or 2 Children | 0 (0.0%) | 150 (37.3%) |
| 3 or 4 Children | 0 (0.0%) | 27 (48.2%) |
| 5 or more Children | 0 (0.0%) | 0 (0.0%) |
| Total | 0 (0.0%) | 189 (23.1%) |
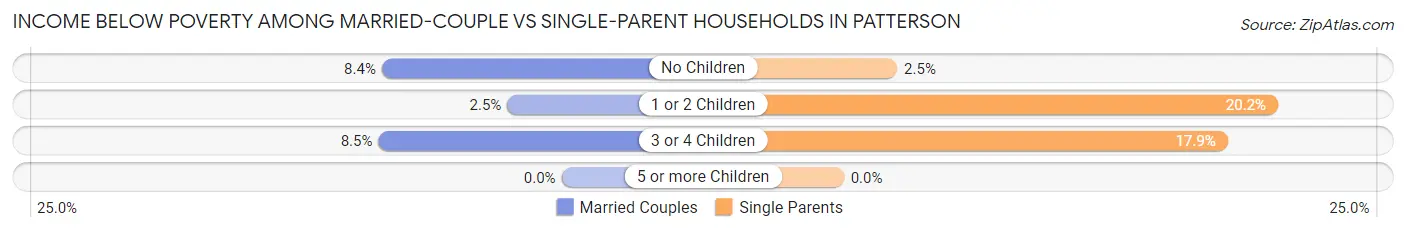
Income Below Poverty Among Married-Couple vs Single-Parent Households in Patterson
The poverty data for Patterson shows that 200 of the married-couple family households (5.1%) and 189 of the single-parent households (13.5%) are living below the poverty level. Within the married-couple family households, those with 3 or 4 children have the highest poverty rate, with 48 households (8.5%) falling below the poverty line. Among the single-parent households, those with 1 or 2 children have the highest poverty rate, with 150 household (20.2%) living below poverty.
| Children | Married-Couple Families | Single-Parent Households |
| No Children | 100 (8.4%) | 12 (2.5%) |
| 1 or 2 Children | 52 (2.5%) | 150 (20.2%) |
| 3 or 4 Children | 48 (8.5%) | 27 (17.9%) |
| 5 or more Children | 0 (0.0%) | 0 (0.0%) |
| Total | 200 (5.1%) | 189 (13.5%) |
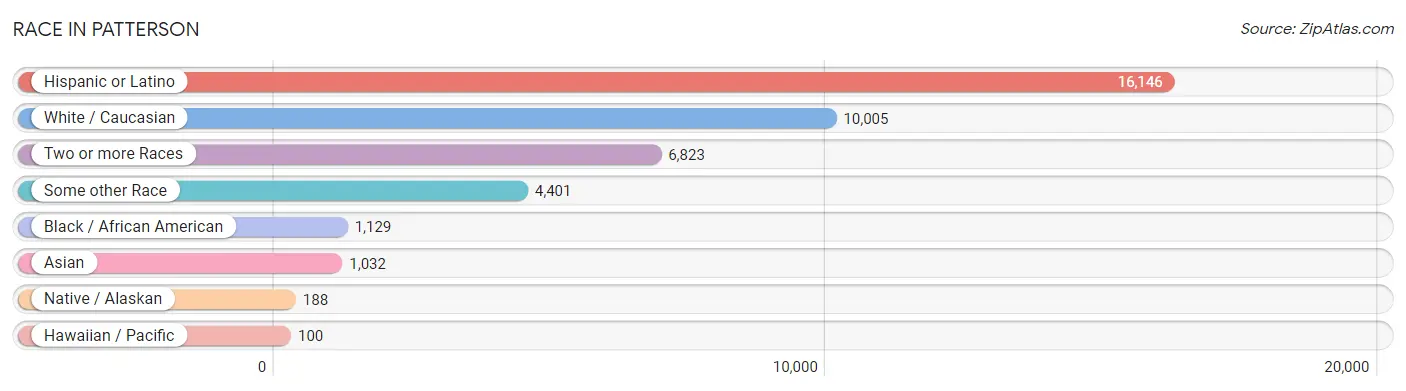
Race in Patterson
The most populous races in Patterson are Hispanic or Latino (16,146 | 68.2%), White / Caucasian (10,005 | 42.2%), and Two or more Races (6,823 | 28.8%).
| Race | # Population | % Population |
| Asian | 1,032 | 4.4% |
| Black / African American | 1,129 | 4.8% |
| Hawaiian / Pacific | 100 | 0.4% |
| Hispanic or Latino | 16,146 | 68.2% |
| Native / Alaskan | 188 | 0.8% |
| White / Caucasian | 10,005 | 42.2% |
| Two or more Races | 6,823 | 28.8% |
| Some other Race | 4,401 | 18.6% |
| Total | 23,678 | 100.0% |
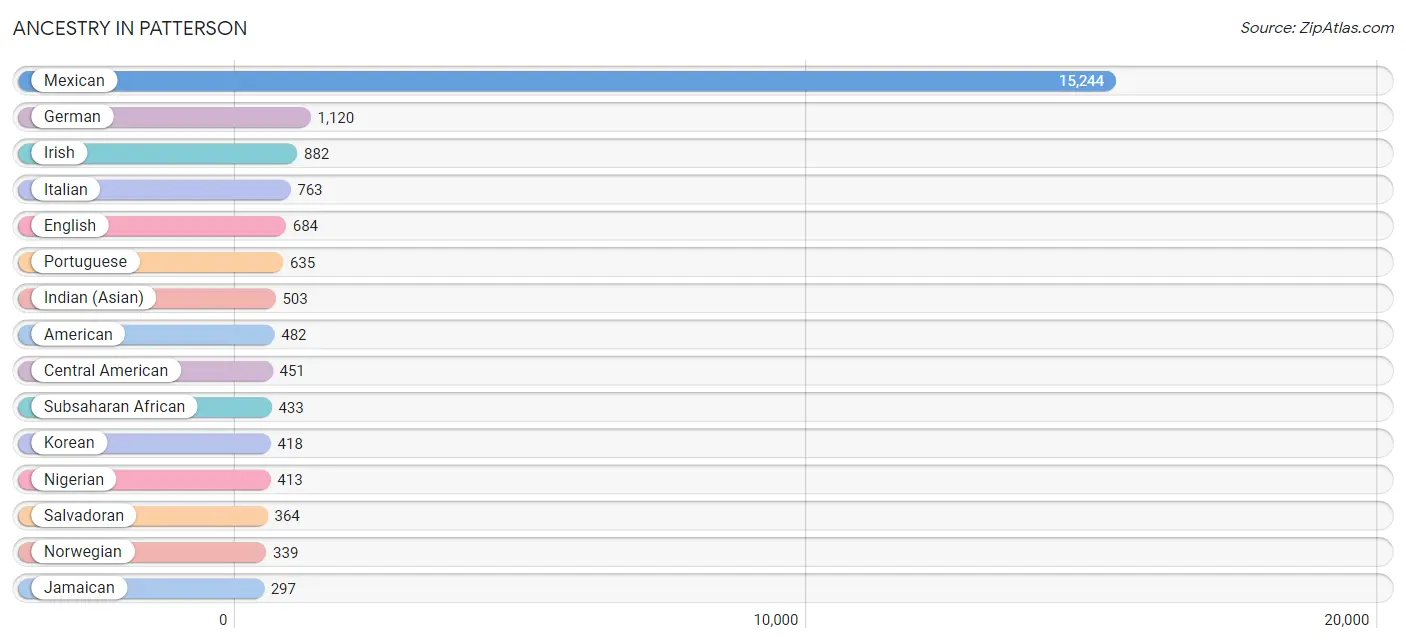
Ancestry in Patterson
The most populous ancestries reported in Patterson are Mexican (15,244 | 64.4%), German (1,120 | 4.7%), Irish (882 | 3.7%), Italian (763 | 3.2%), and English (684 | 2.9%), together accounting for 78.9% of all Patterson residents.
| Ancestry | # Population | % Population |
| American | 482 | 2.0% |
| Apache | 76 | 0.3% |
| Arab | 14 | 0.1% |
| Basque | 9 | 0.0% |
| Bhutanese | 15 | 0.1% |
| Brazilian | 205 | 0.9% |
| British | 171 | 0.7% |
| Burmese | 199 | 0.8% |
| Canadian | 31 | 0.1% |
| Central American | 451 | 1.9% |
| Central American Indian | 35 | 0.2% |
| Cherokee | 18 | 0.1% |
| Chilean | 38 | 0.2% |
| Choctaw | 18 | 0.1% |
| Cuban | 106 | 0.4% |
| Czech | 9 | 0.0% |
| Danish | 96 | 0.4% |
| Dutch | 21 | 0.1% |
| Eastern European | 10 | 0.0% |
| Ecuadorian | 37 | 0.2% |
| English | 684 | 2.9% |
| European | 271 | 1.1% |
| Filipino | 18 | 0.1% |
| French | 150 | 0.6% |
| German | 1,120 | 4.7% |
| Guatemalan | 39 | 0.2% |
| Icelander | 38 | 0.2% |
| Indian (Asian) | 503 | 2.1% |
| Irish | 882 | 3.7% |
| Italian | 763 | 3.2% |
| Jamaican | 297 | 1.3% |
| Japanese | 38 | 0.2% |
| Korean | 418 | 1.8% |
| Mexican | 15,244 | 64.4% |
| Mexican American Indian | 151 | 0.6% |
| Native Hawaiian | 209 | 0.9% |
| Nicaraguan | 48 | 0.2% |
| Nigerian | 413 | 1.7% |
| Northern European | 39 | 0.2% |
| Norwegian | 339 | 1.4% |
| Polish | 28 | 0.1% |
| Portuguese | 635 | 2.7% |
| Puerto Rican | 178 | 0.7% |
| Salvadoran | 364 | 1.5% |
| Samoan | 146 | 0.6% |
| Scotch-Irish | 126 | 0.5% |
| Scottish | 205 | 0.9% |
| South American | 75 | 0.3% |
| Spaniard | 30 | 0.1% |
| Spanish | 15 | 0.1% |
| Sri Lankan | 295 | 1.3% |
| Subsaharan African | 433 | 1.8% |
| Swedish | 123 | 0.5% |
| Thai | 70 | 0.3% |
| Tohono O'Odham | 48 | 0.2% |
| Turkish | 105 | 0.4% |
| Welsh | 7 | 0.0% | View All 57 Rows |
Immigrants in Patterson
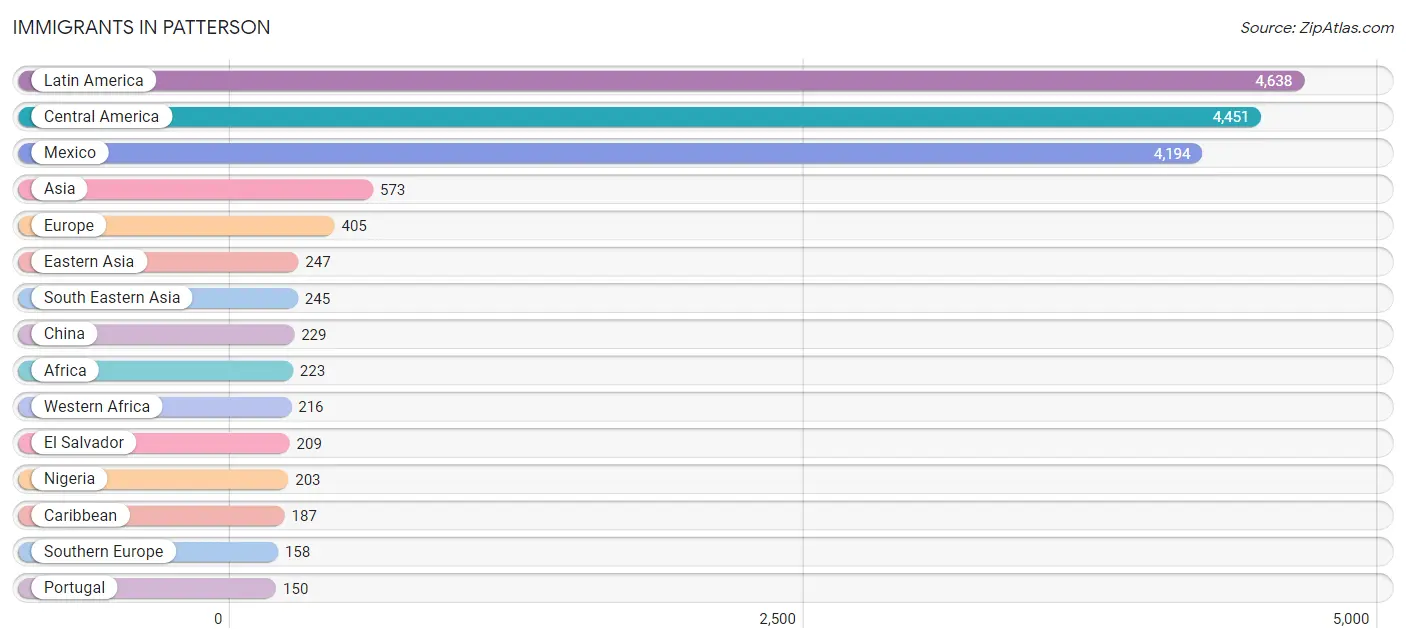
The most numerous immigrant groups reported in Patterson came from Latin America (4,638 | 19.6%), Central America (4,451 | 18.8%), Mexico (4,194 | 17.7%), Asia (573 | 2.4%), and Europe (405 | 1.7%), together accounting for 60.2% of all Patterson residents.
| Immigration Origin | # Population | % Population |
| Africa | 223 | 0.9% |
| Asia | 573 | 2.4% |
| Azores | 145 | 0.6% |
| Bulgaria | 105 | 0.4% |
| Cambodia | 9 | 0.0% |
| Canada | 24 | 0.1% |
| Caribbean | 187 | 0.8% |
| Central America | 4,451 | 18.8% |
| China | 229 | 1.0% |
| Cuba | 62 | 0.3% |
| Eastern Africa | 7 | 0.0% |
| Eastern Asia | 247 | 1.0% |
| Eastern Europe | 105 | 0.4% |
| El Salvador | 209 | 0.9% |
| Europe | 405 | 1.7% |
| France | 127 | 0.5% |
| Hong Kong | 11 | 0.1% |
| India | 39 | 0.2% |
| Indonesia | 27 | 0.1% |
| Jamaica | 125 | 0.5% |
| Japan | 15 | 0.1% |
| Korea | 3 | 0.0% |
| Latin America | 4,638 | 19.6% |
| Mexico | 4,194 | 17.7% |
| Netherlands | 15 | 0.1% |
| Nicaragua | 48 | 0.2% |
| Nigeria | 203 | 0.9% |
| Oceania | 14 | 0.1% |
| Philippines | 135 | 0.6% |
| Portugal | 150 | 0.6% |
| South Central Asia | 39 | 0.2% |
| South Eastern Asia | 245 | 1.0% |
| Southern Europe | 158 | 0.7% |
| Spain | 8 | 0.0% |
| Vietnam | 74 | 0.3% |
| Western Africa | 216 | 0.9% |
| Western Asia | 42 | 0.2% |
| Western Europe | 142 | 0.6% |
| Yemen | 42 | 0.2% | View All 39 Rows |
Sex and Age in Patterson
Sex and Age in Patterson
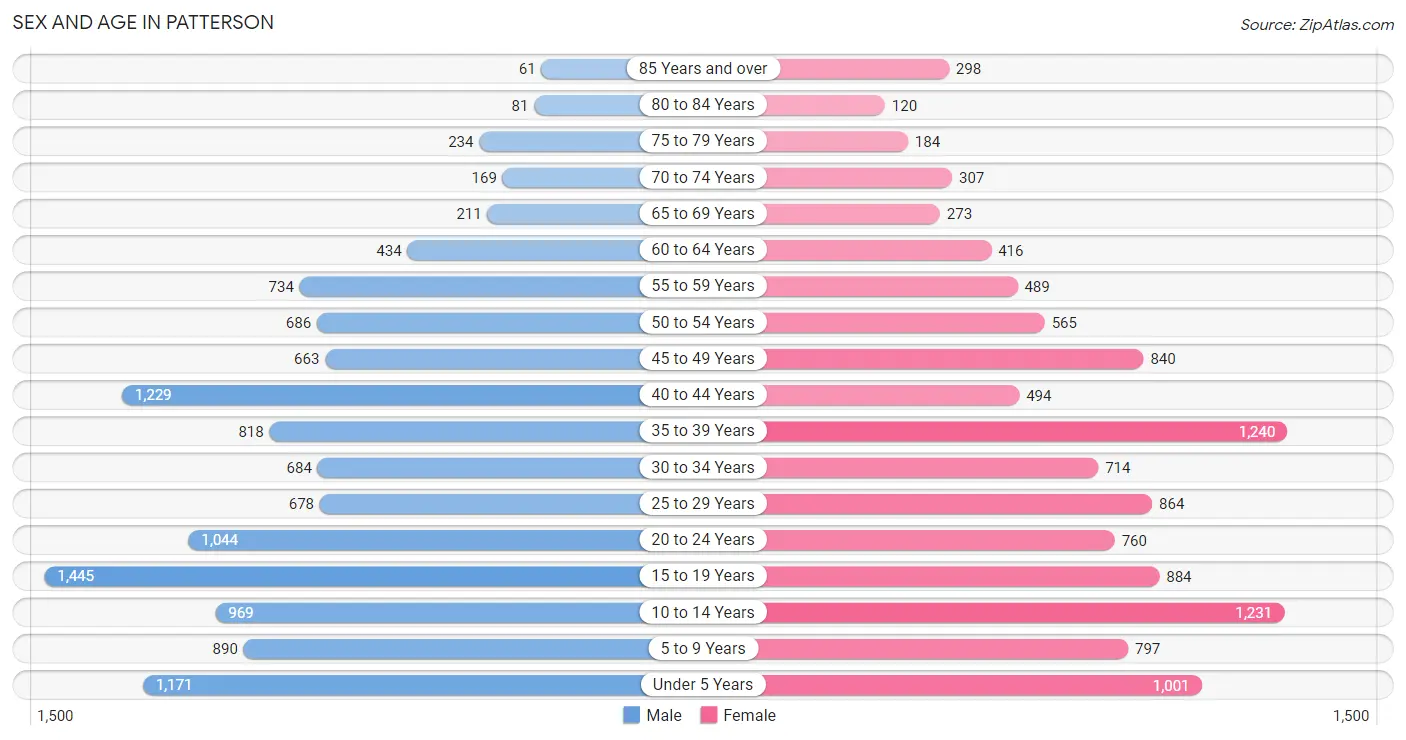
The most populous age groups in Patterson are 15 to 19 Years (1,445 | 11.8%) for men and 35 to 39 Years (1,240 | 10.8%) for women.
| Age Bracket | Male | Female |
| Under 5 Years | 1,171 (9.6%) | 1,001 (8.7%) |
| 5 to 9 Years | 890 (7.3%) | 797 (6.9%) |
| 10 to 14 Years | 969 (7.9%) | 1,231 (10.7%) |
| 15 to 19 Years | 1,445 (11.8%) | 884 (7.7%) |
| 20 to 24 Years | 1,044 (8.6%) | 760 (6.6%) |
| 25 to 29 Years | 678 (5.6%) | 864 (7.5%) |
| 30 to 34 Years | 684 (5.6%) | 714 (6.2%) |
| 35 to 39 Years | 818 (6.7%) | 1,240 (10.8%) |
| 40 to 44 Years | 1,229 (10.1%) | 494 (4.3%) |
| 45 to 49 Years | 663 (5.4%) | 840 (7.3%) |
| 50 to 54 Years | 686 (5.6%) | 565 (4.9%) |
| 55 to 59 Years | 734 (6.0%) | 489 (4.3%) |
| 60 to 64 Years | 434 (3.6%) | 416 (3.6%) |
| 65 to 69 Years | 211 (1.7%) | 273 (2.4%) |
| 70 to 74 Years | 169 (1.4%) | 307 (2.7%) |
| 75 to 79 Years | 234 (1.9%) | 184 (1.6%) |
| 80 to 84 Years | 81 (0.7%) | 120 (1.1%) |
| 85 Years and over | 61 (0.5%) | 298 (2.6%) |
| Total | 12,201 (100.0%) | 11,477 (100.0%) |
Families and Households in Patterson
Median Family Size in Patterson
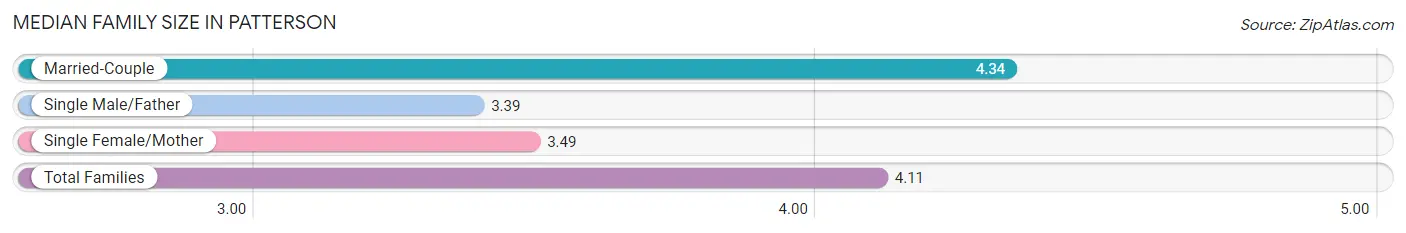
The median family size in Patterson is 4.11 persons per family, with married-couple families (3,923 | 73.7%) accounting for the largest median family size of 4.34 persons per family. On the other hand, single male/father families (581 | 10.9%) represent the smallest median family size with 3.39 persons per family.
| Family Type | # Families | Family Size |
| Married-Couple | 3,923 (73.7%) | 4.34 |
| Single Male/Father | 581 (10.9%) | 3.39 |
| Single Female/Mother | 817 (15.3%) | 3.49 |
| Total Families | 5,321 (100.0%) | 4.11 |
Median Household Size in Patterson
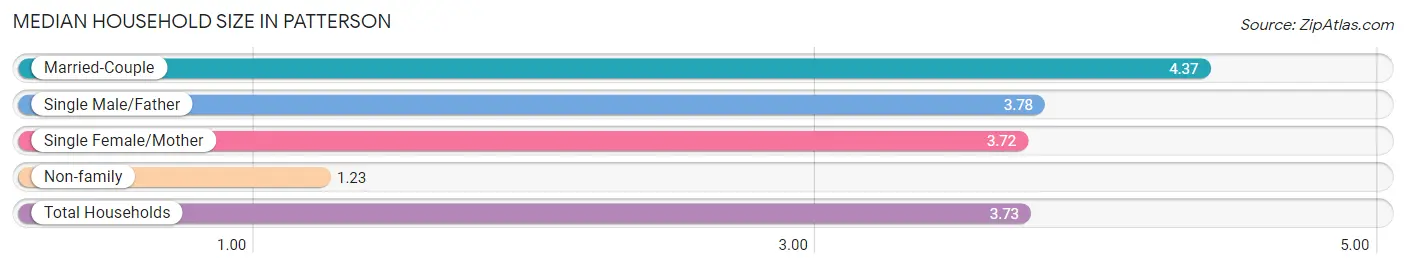
The median household size in Patterson is 3.73 persons per household, with married-couple households (3,923 | 61.8%) accounting for the largest median household size of 4.37 persons per household. non-family households (1,024 | 16.1%) represent the smallest median household size with 1.23 persons per household.
| Household Type | # Households | Household Size |
| Married-Couple | 3,923 (61.8%) | 4.37 |
| Single Male/Father | 581 (9.2%) | 3.78 |
| Single Female/Mother | 817 (12.9%) | 3.72 |
| Non-family | 1,024 (16.1%) | 1.23 |
| Total Households | 6,345 (100.0%) | 3.73 |
Household Size by Marriage Status in Patterson
Out of a total of 6,345 households in Patterson, 5,321 (83.9%) are family households, while 1,024 (16.1%) are nonfamily households. The most numerous type of family households are 4-person households, comprising 1,651, and the most common type of nonfamily households are 1-person households, comprising 889.
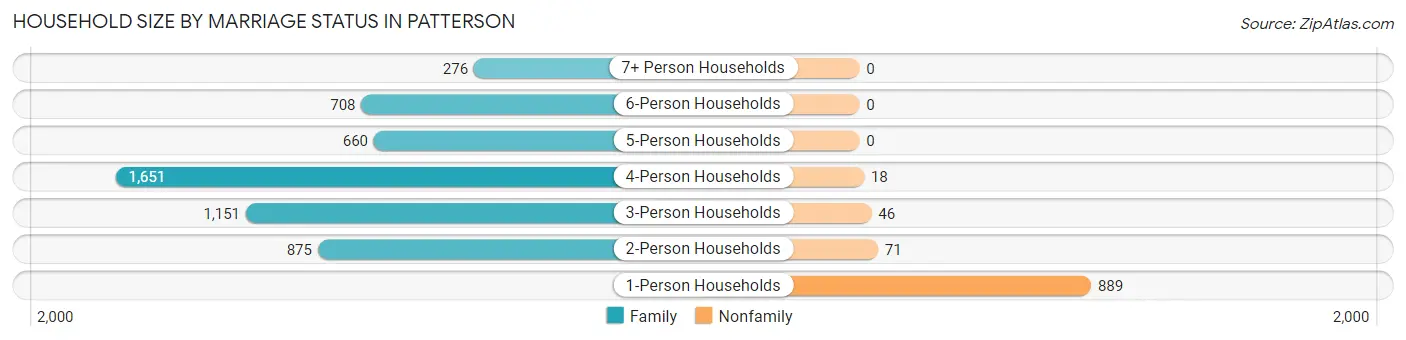
| Household Size | Family Households | Nonfamily Households |
| 1-Person Households | - | 889 (14.0%) |
| 2-Person Households | 875 (13.8%) | 71 (1.1%) |
| 3-Person Households | 1,151 (18.1%) | 46 (0.7%) |
| 4-Person Households | 1,651 (26.0%) | 18 (0.3%) |
| 5-Person Households | 660 (10.4%) | 0 (0.0%) |
| 6-Person Households | 708 (11.2%) | 0 (0.0%) |
| 7+ Person Households | 276 (4.3%) | 0 (0.0%) |
| Total | 5,321 (83.9%) | 1,024 (16.1%) |
Female Fertility in Patterson
Fertility by Age in Patterson
Average fertility rate in Patterson is 41.0 births per 1,000 women. Women in the age bracket of 20 to 34 years have the highest fertility rate with 90.0 births per 1,000 women. Women in the age bracket of 20 to 34 years acount for 87.9% of all women with births.
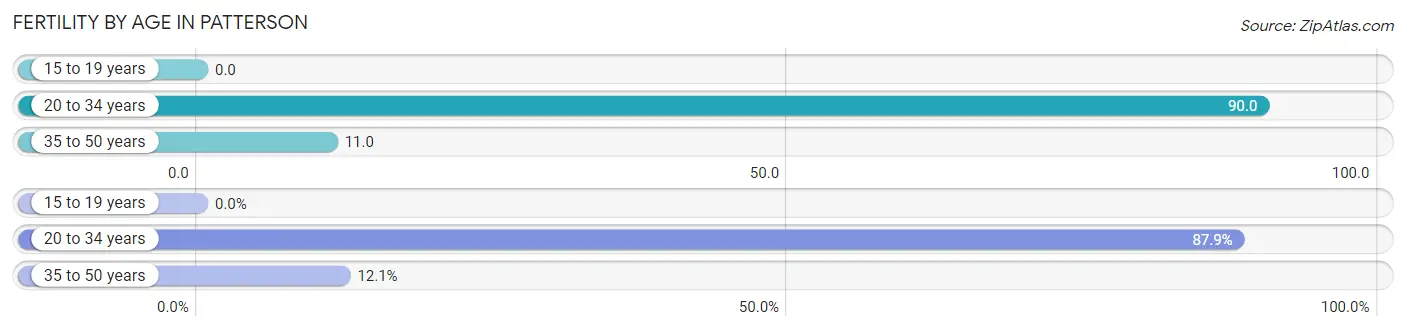
| Age Bracket | Women with Births | Births / 1,000 Women |
| 15 to 19 years | 0 (0.0%) | 0.0 |
| 20 to 34 years | 211 (87.9%) | 90.0 |
| 35 to 50 years | 29 (12.1%) | 11.0 |
| Total | 240 (100.0%) | 41.0 |
Fertility by Age by Marriage Status in Patterson
50.0% of women with births (240) in Patterson are married. The highest percentage of unmarried women with births falls into 20 to 34 years age bracket with 53.1% of them unmarried at the time of birth, while the lowest percentage of unmarried women with births belong to 35 to 50 years age bracket with 27.6% of them unmarried.
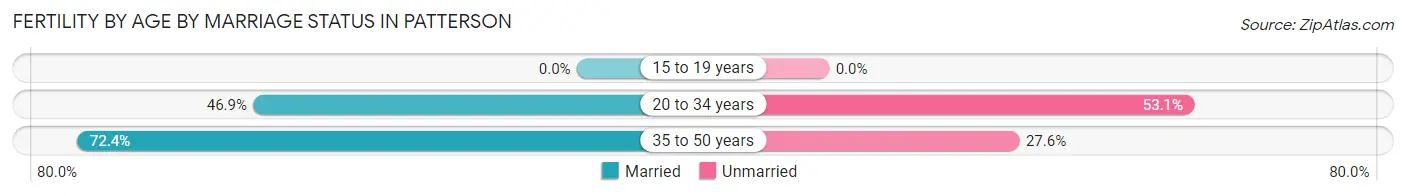
| Age Bracket | Married | Unmarried |
| 15 to 19 years | 0 (0.0%) | 0 (0.0%) |
| 20 to 34 years | 99 (46.9%) | 112 (53.1%) |
| 35 to 50 years | 21 (72.4%) | 8 (27.6%) |
| Total | 120 (50.0%) | 120 (50.0%) |
Fertility by Education in Patterson
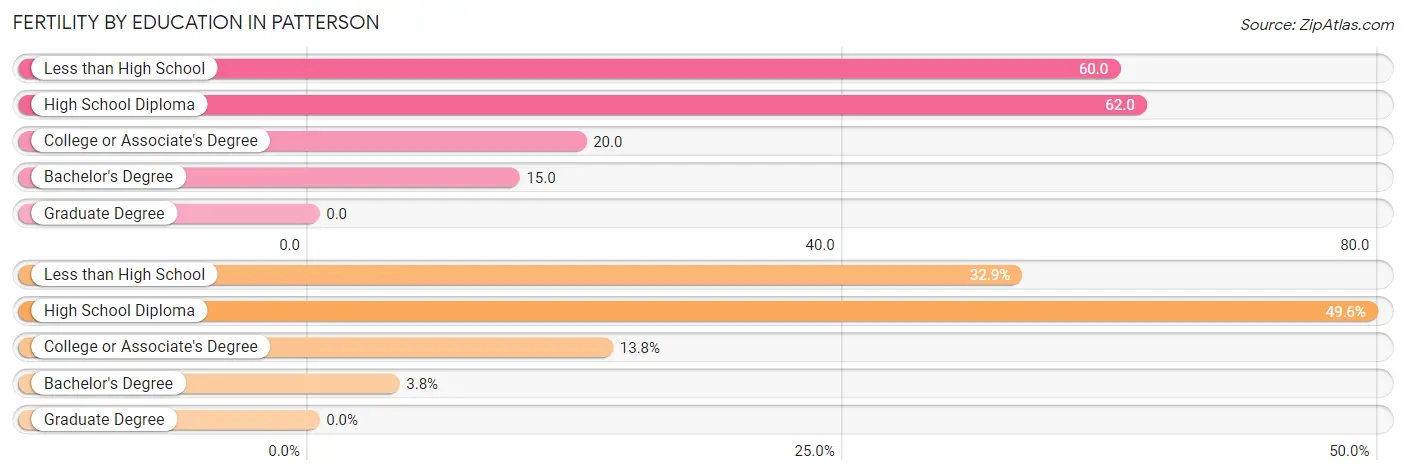
| Educational Attainment | Women with Births | Births / 1,000 Women |
| Less than High School | 79 (32.9%) | 60.0 |
| High School Diploma | 119 (49.6%) | 62.0 |
| College or Associate's Degree | 33 (13.8%) | 20.0 |
| Bachelor's Degree | 9 (3.7%) | 15.0 |
| Graduate Degree | 0 (0.0%) | 0.0 |
| Total | 240 (100.0%) | 41.0 |
Fertility by Education by Marriage Status in Patterson
50.0% of women with births in Patterson are unmarried. Women with the educational attainment of bachelor's degree are most likely to be married with 100.0% of them married at childbirth, while women with the educational attainment of high school diploma are least likely to be married with 74.8% of them unmarried at childbirth.
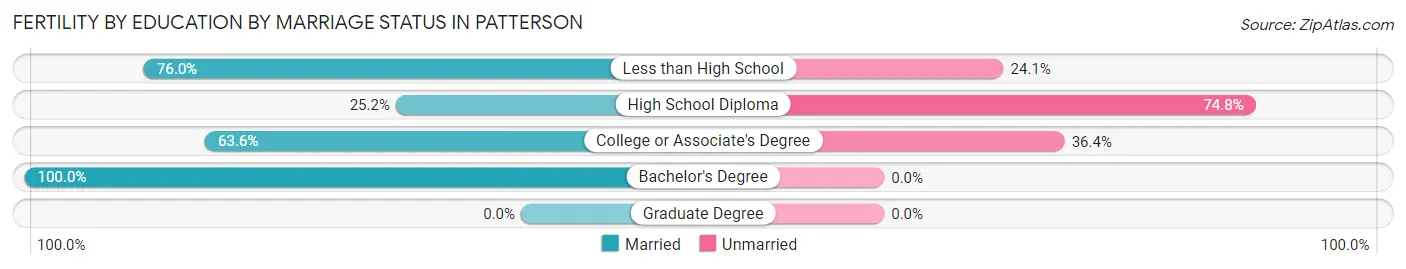
| Educational Attainment | Married | Unmarried |
| Less than High School | 60 (75.9%) | 19 (24.0%) |
| High School Diploma | 30 (25.2%) | 89 (74.8%) |
| College or Associate's Degree | 21 (63.6%) | 12 (36.4%) |
| Bachelor's Degree | 9 (100.0%) | 0 (0.0%) |
| Graduate Degree | 0 (0.0%) | 0 (0.0%) |
| Total | 120 (50.0%) | 120 (50.0%) |
Employment Characteristics in Patterson
Employment by Class of Employer in Patterson
Among the 9,740 employed individuals in Patterson, private company employees (7,213 | 74.1%), local government employees (868 | 8.9%), and not-for-profit organizations (581 | 6.0%) make up the most common classes of employment.
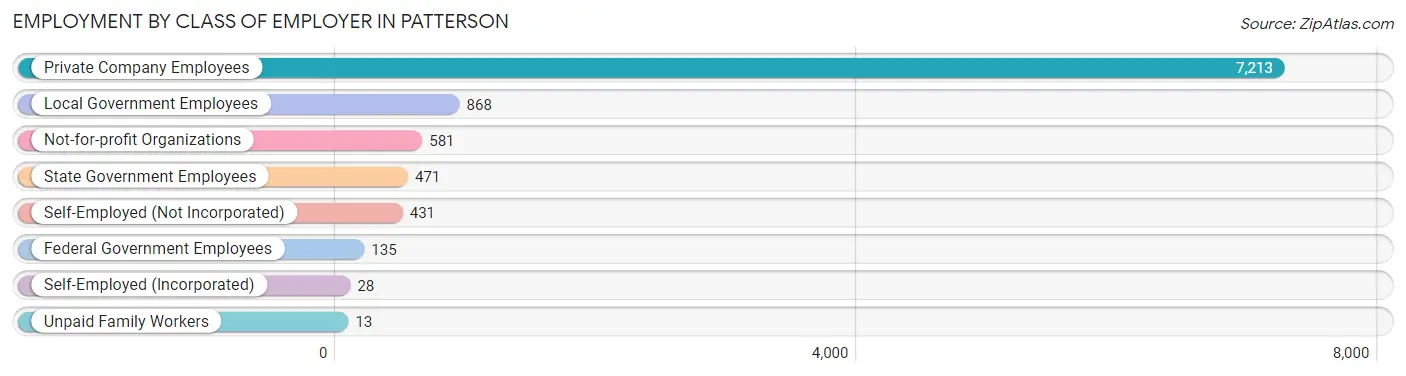
| Employer Class | # Employees | % Employees |
| Private Company Employees | 7,213 | 74.1% |
| Self-Employed (Incorporated) | 28 | 0.3% |
| Self-Employed (Not Incorporated) | 431 | 4.4% |
| Not-for-profit Organizations | 581 | 6.0% |
| Local Government Employees | 868 | 8.9% |
| State Government Employees | 471 | 4.8% |
| Federal Government Employees | 135 | 1.4% |
| Unpaid Family Workers | 13 | 0.1% |
| Total | 9,740 | 100.0% |
Employment Status by Age in Patterson
According to the labor force statistics for Patterson, out of the total population over 16 years of age (17,086), 64.3% or 10,986 individuals are in the labor force, with 7.4% or 813 of them unemployed. The age group with the highest labor force participation rate is 25 to 29 years, with 82.9% or 1,278 individuals in the labor force. Within the labor force, the 65 to 74 years age range has the highest percentage of unemployed individuals, with 75.8% or 113 of them being unemployed.
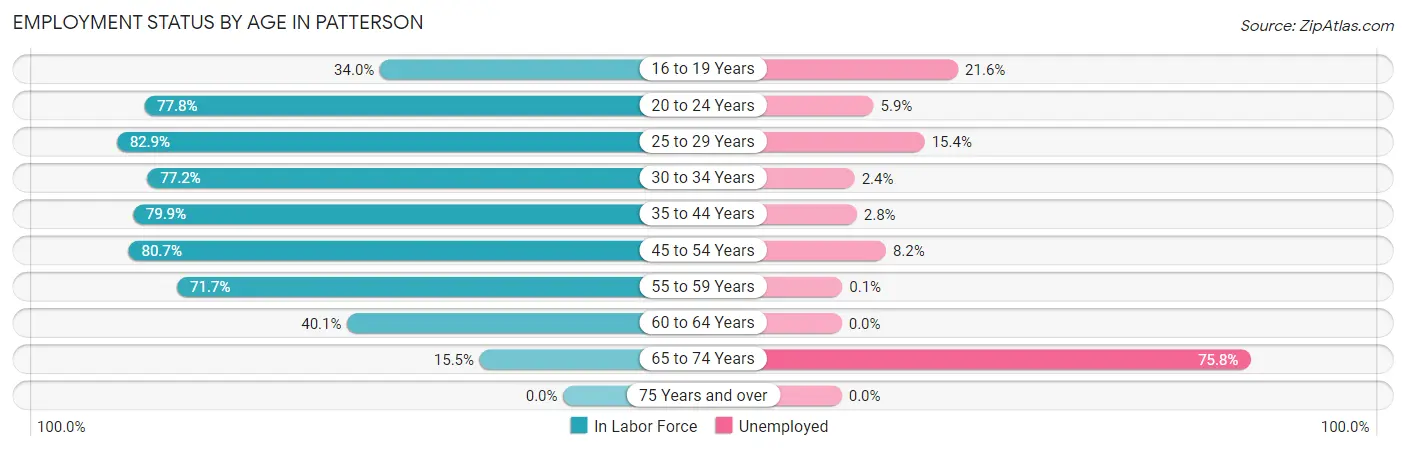
| Age Bracket | In Labor Force | Unemployed |
| 16 to 19 Years | 611 (34.0%) | 132 (21.6%) |
| 20 to 24 Years | 1,404 (77.8%) | 83 (5.9%) |
| 25 to 29 Years | 1,278 (82.9%) | 197 (15.4%) |
| 30 to 34 Years | 1,079 (77.2%) | 26 (2.4%) |
| 35 to 44 Years | 3,021 (79.9%) | 85 (2.8%) |
| 45 to 54 Years | 2,222 (80.7%) | 182 (8.2%) |
| 55 to 59 Years | 877 (71.7%) | 1 (0.1%) |
| 60 to 64 Years | 341 (40.1%) | 0 (0.0%) |
| 65 to 74 Years | 149 (15.5%) | 113 (75.8%) |
| 75 Years and over | 0 (0.0%) | 0 (0.0%) |
| Total | 10,986 (64.3%) | 813 (7.4%) |
Employment Status by Educational Attainment in Patterson
According to labor force statistics for Patterson, 76.4% of individuals (8,823) out of the total population between 25 and 64 years of age (11,548) are in the labor force, with 5.6% or 494 of them being unemployed. The group with the highest labor force participation rate are those with the educational attainment of bachelor's degree or higher, with 92.8% or 1,669 individuals in the labor force. Within the labor force, individuals with less than high school education have the highest percentage of unemployment, with 10.8% or 174 of them being unemployed.
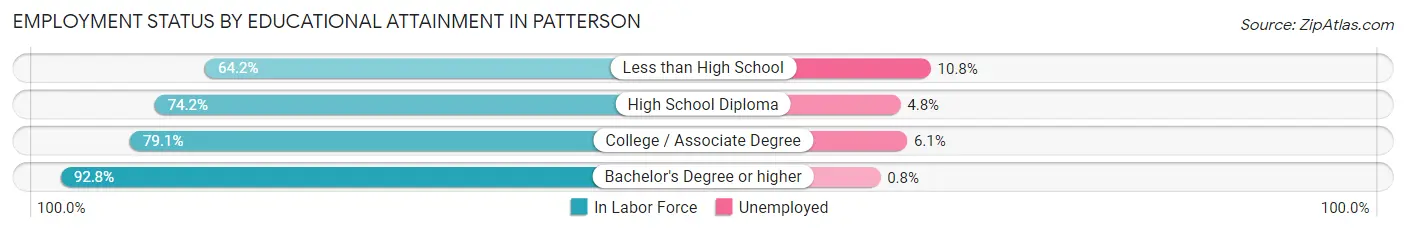
| Educational Attainment | In Labor Force | Unemployed |
| Less than High School | 1,614 (64.2%) | 272 (10.8%) |
| High School Diploma | 2,815 (74.2%) | 182 (4.8%) |
| College / Associate Degree | 2,722 (79.1%) | 210 (6.1%) |
| Bachelor's Degree or higher | 1,669 (92.8%) | 14 (0.8%) |
| Total | 8,823 (76.4%) | 647 (5.6%) |
Employment Occupations by Sex in Patterson
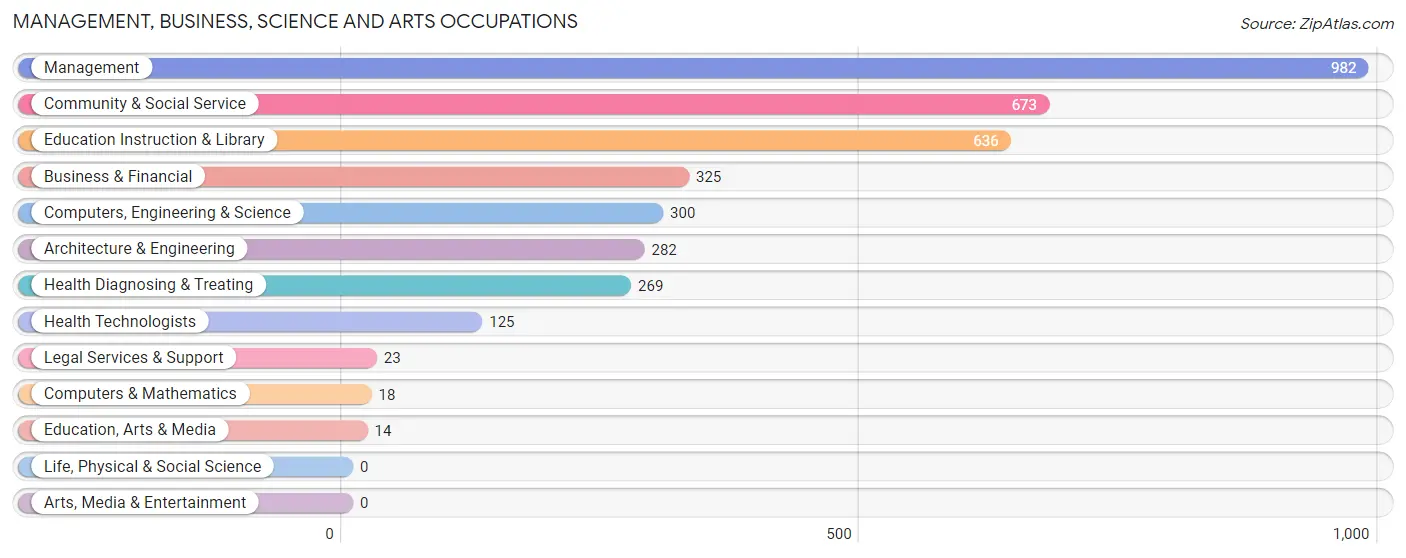
Management, Business, Science and Arts Occupations
The most common Management, Business, Science and Arts occupations in Patterson are Management (982 | 9.7%), Community & Social Service (673 | 6.6%), Education Instruction & Library (636 | 6.3%), Business & Financial (325 | 3.2%), and Computers, Engineering & Science (300 | 2.9%).
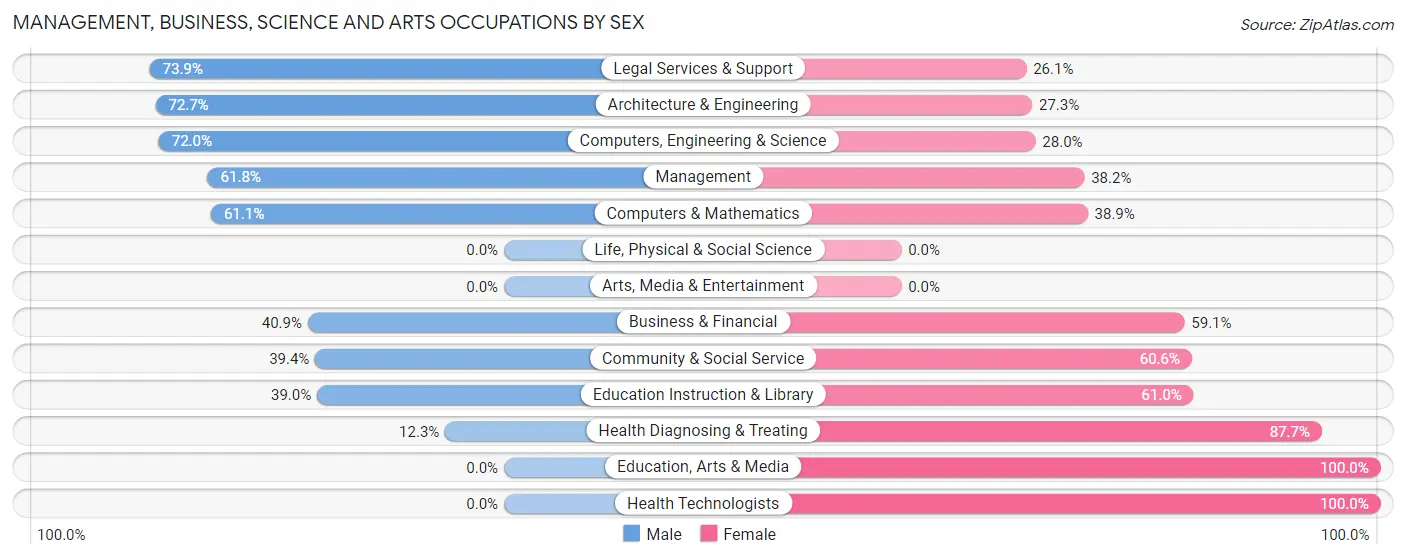
Management, Business, Science and Arts Occupations by Sex
Within the Management, Business, Science and Arts occupations in Patterson, the most male-oriented occupations are Legal Services & Support (73.9%), Architecture & Engineering (72.7%), and Computers, Engineering & Science (72.0%), while the most female-oriented occupations are Education, Arts & Media (100.0%), Health Technologists (100.0%), and Health Diagnosing & Treating (87.7%).
| Occupation | Male | Female |
| Management | 607 (61.8%) | 375 (38.2%) |
| Business & Financial | 133 (40.9%) | 192 (59.1%) |
| Computers, Engineering & Science | 216 (72.0%) | 84 (28.0%) |
| Computers & Mathematics | 11 (61.1%) | 7 (38.9%) |
| Architecture & Engineering | 205 (72.7%) | 77 (27.3%) |
| Life, Physical & Social Science | 0 (0.0%) | 0 (0.0%) |
| Community & Social Service | 265 (39.4%) | 408 (60.6%) |
| Education, Arts & Media | 0 (0.0%) | 14 (100.0%) |
| Legal Services & Support | 17 (73.9%) | 6 (26.1%) |
| Education Instruction & Library | 248 (39.0%) | 388 (61.0%) |
| Arts, Media & Entertainment | 0 (0.0%) | 0 (0.0%) |
| Health Diagnosing & Treating | 33 (12.3%) | 236 (87.7%) |
| Health Technologists | 0 (0.0%) | 125 (100.0%) |
| Total (Category) | 1,254 (49.2%) | 1,295 (50.8%) |
| Total (Overall) | 6,113 (60.1%) | 4,052 (39.9%) |
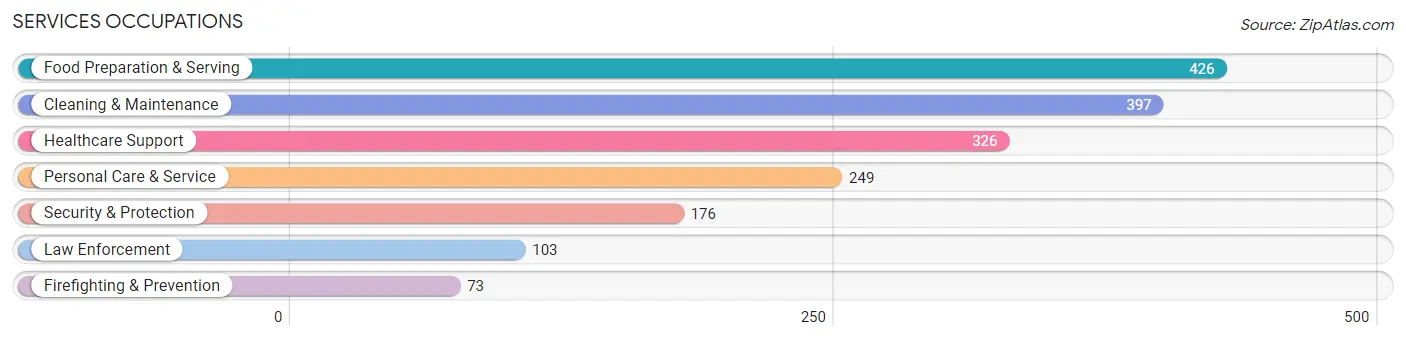
Services Occupations
The most common Services occupations in Patterson are Food Preparation & Serving (426 | 4.2%), Cleaning & Maintenance (397 | 3.9%), Healthcare Support (326 | 3.2%), Personal Care & Service (249 | 2.5%), and Security & Protection (176 | 1.7%).
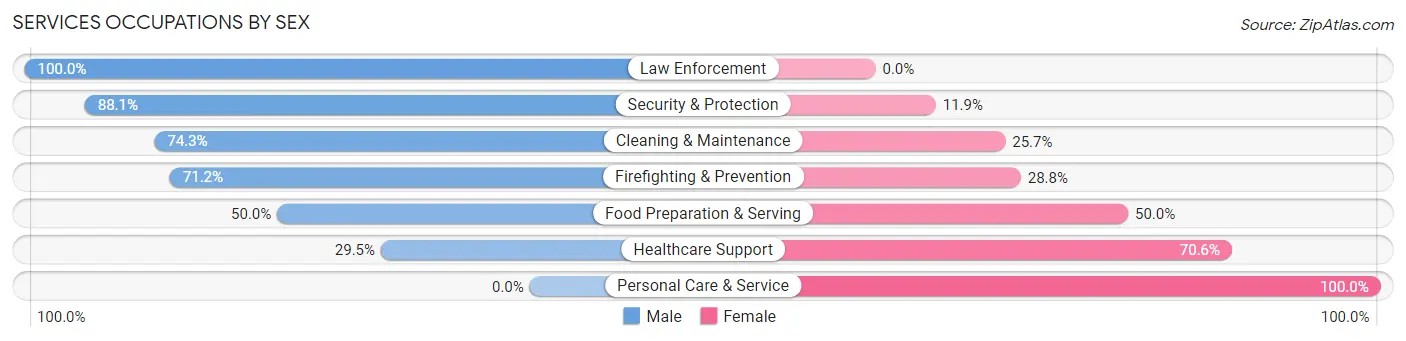
Services Occupations by Sex
Within the Services occupations in Patterson, the most male-oriented occupations are Law Enforcement (100.0%), Security & Protection (88.1%), and Cleaning & Maintenance (74.3%), while the most female-oriented occupations are Personal Care & Service (100.0%), Healthcare Support (70.6%), and Food Preparation & Serving (50.0%).
| Occupation | Male | Female |
| Healthcare Support | 96 (29.4%) | 230 (70.6%) |
| Security & Protection | 155 (88.1%) | 21 (11.9%) |
| Firefighting & Prevention | 52 (71.2%) | 21 (28.8%) |
| Law Enforcement | 103 (100.0%) | 0 (0.0%) |
| Food Preparation & Serving | 213 (50.0%) | 213 (50.0%) |
| Cleaning & Maintenance | 295 (74.3%) | 102 (25.7%) |
| Personal Care & Service | 0 (0.0%) | 249 (100.0%) |
| Total (Category) | 759 (48.2%) | 815 (51.8%) |
| Total (Overall) | 6,113 (60.1%) | 4,052 (39.9%) |
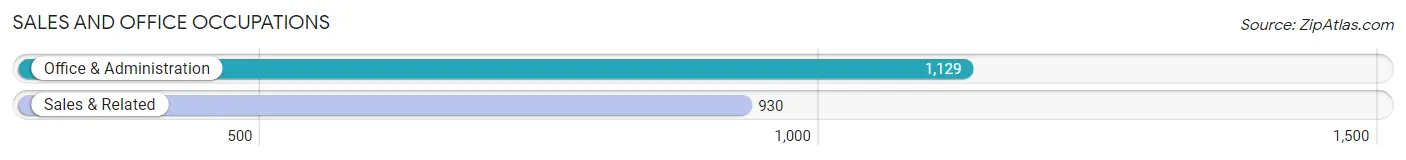
Sales and Office Occupations
The most common Sales and Office occupations in Patterson are Office & Administration (1,129 | 11.1%), and Sales & Related (930 | 9.1%).
Sales and Office Occupations by Sex
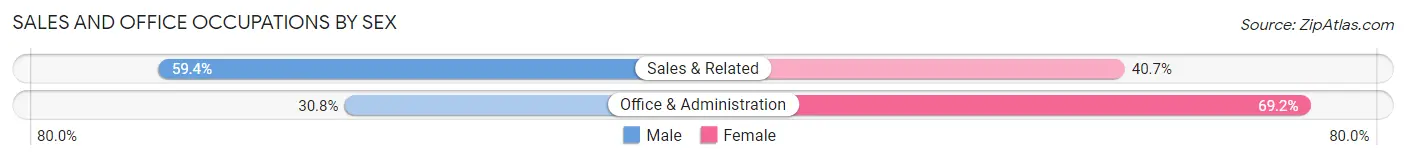
| Occupation | Male | Female |
| Sales & Related | 552 (59.4%) | 378 (40.6%) |
| Office & Administration | 348 (30.8%) | 781 (69.2%) |
| Total (Category) | 900 (43.7%) | 1,159 (56.3%) |
| Total (Overall) | 6,113 (60.1%) | 4,052 (39.9%) |
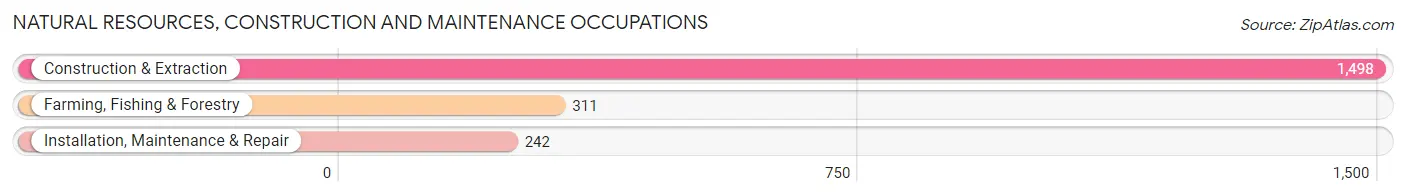
Natural Resources, Construction and Maintenance Occupations
The most common Natural Resources, Construction and Maintenance occupations in Patterson are Construction & Extraction (1,498 | 14.7%), Farming, Fishing & Forestry (311 | 3.1%), and Installation, Maintenance & Repair (242 | 2.4%).
Natural Resources, Construction and Maintenance Occupations by Sex
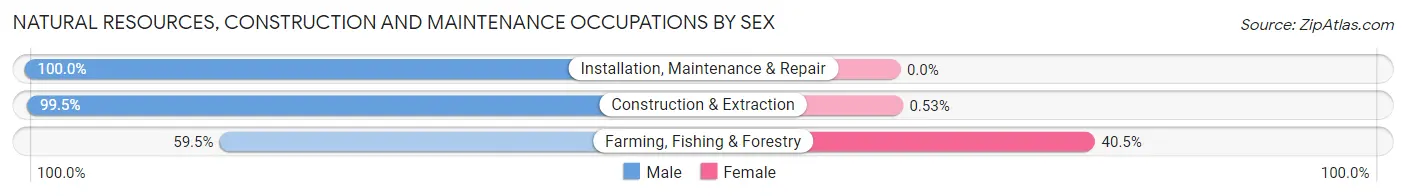
| Occupation | Male | Female |
| Farming, Fishing & Forestry | 185 (59.5%) | 126 (40.5%) |
| Construction & Extraction | 1,490 (99.5%) | 8 (0.5%) |
| Installation, Maintenance & Repair | 242 (100.0%) | 0 (0.0%) |
| Total (Category) | 1,917 (93.5%) | 134 (6.5%) |
| Total (Overall) | 6,113 (60.1%) | 4,052 (39.9%) |
Production, Transportation and Moving Occupations
The most common Production, Transportation and Moving occupations in Patterson are Material Moving (913 | 9.0%), Production (605 | 5.9%), and Transportation (414 | 4.1%).
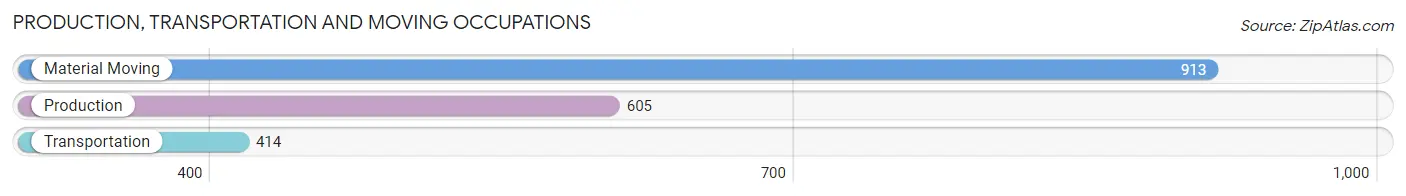
Production, Transportation and Moving Occupations by Sex
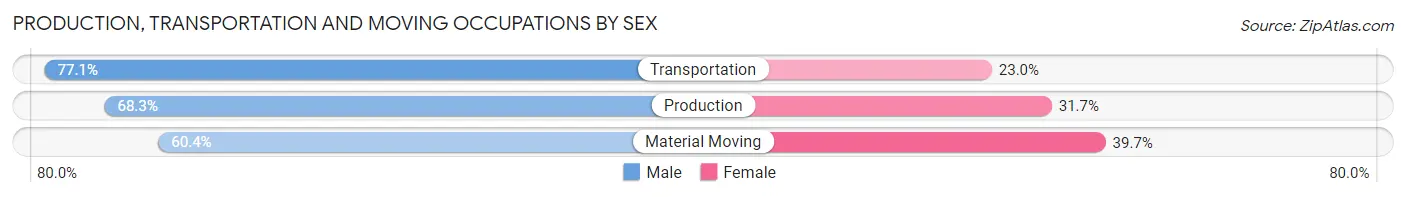
| Occupation | Male | Female |
| Production | 413 (68.3%) | 192 (31.7%) |
| Transportation | 319 (77.0%) | 95 (23.0%) |
| Material Moving | 551 (60.4%) | 362 (39.7%) |
| Total (Category) | 1,283 (66.4%) | 649 (33.6%) |
| Total (Overall) | 6,113 (60.1%) | 4,052 (39.9%) |
Employment Industries by Sex in Patterson
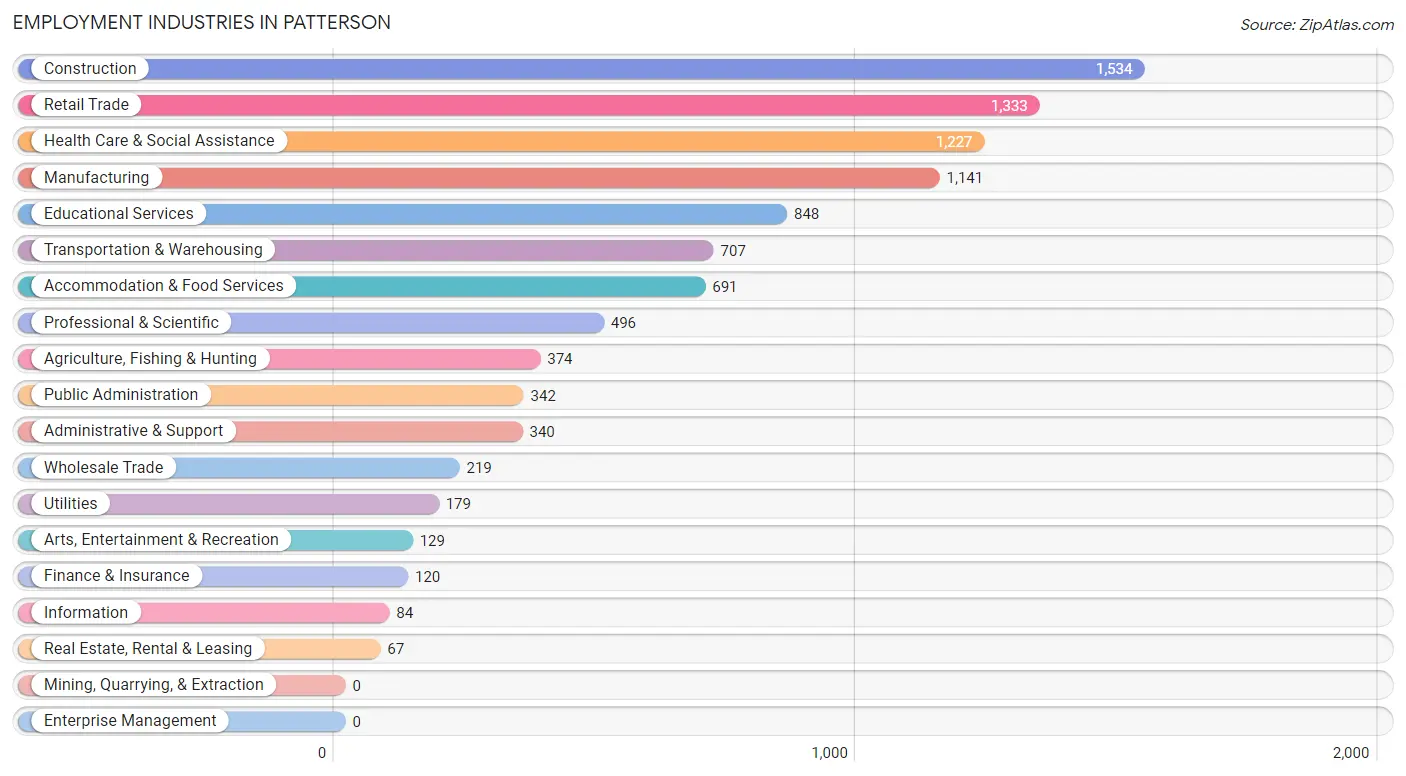
Employment Industries in Patterson
The major employment industries in Patterson include Construction (1,534 | 15.1%), Retail Trade (1,333 | 13.1%), Health Care & Social Assistance (1,227 | 12.1%), Manufacturing (1,141 | 11.2%), and Educational Services (848 | 8.3%).
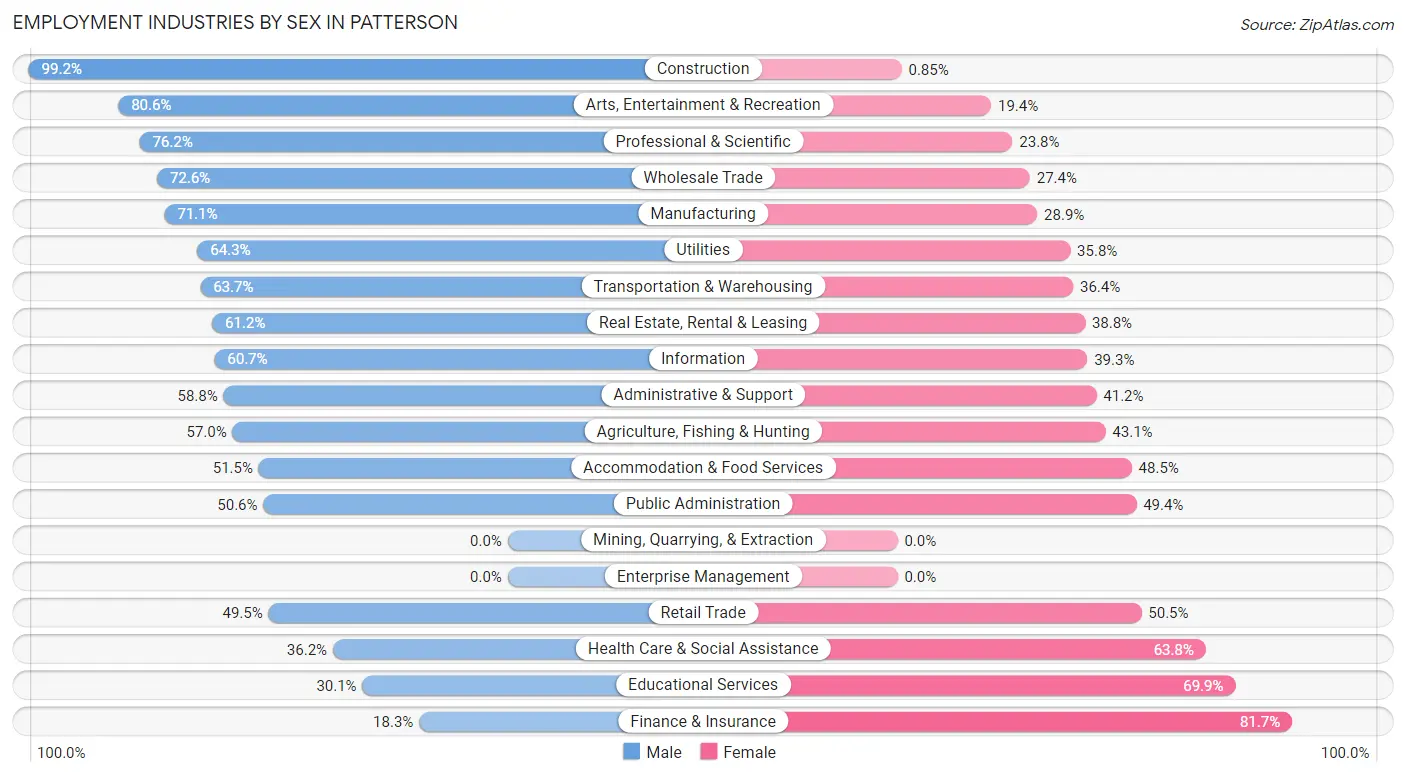
Employment Industries by Sex in Patterson
The Patterson industries that see more men than women are Construction (99.2%), Arts, Entertainment & Recreation (80.6%), and Professional & Scientific (76.2%), whereas the industries that tend to have a higher number of women are Finance & Insurance (81.7%), Educational Services (69.9%), and Health Care & Social Assistance (63.8%).
| Industry | Male | Female |
| Agriculture, Fishing & Hunting | 213 (57.0%) | 161 (43.0%) |
| Mining, Quarrying, & Extraction | 0 (0.0%) | 0 (0.0%) |
| Construction | 1,521 (99.2%) | 13 (0.9%) |
| Manufacturing | 811 (71.1%) | 330 (28.9%) |
| Wholesale Trade | 159 (72.6%) | 60 (27.4%) |
| Retail Trade | 660 (49.5%) | 673 (50.5%) |
| Transportation & Warehousing | 450 (63.6%) | 257 (36.3%) |
| Utilities | 115 (64.2%) | 64 (35.7%) |
| Information | 51 (60.7%) | 33 (39.3%) |
| Finance & Insurance | 22 (18.3%) | 98 (81.7%) |
| Real Estate, Rental & Leasing | 41 (61.2%) | 26 (38.8%) |
| Professional & Scientific | 378 (76.2%) | 118 (23.8%) |
| Enterprise Management | 0 (0.0%) | 0 (0.0%) |
| Administrative & Support | 200 (58.8%) | 140 (41.2%) |
| Educational Services | 255 (30.1%) | 593 (69.9%) |
| Health Care & Social Assistance | 444 (36.2%) | 783 (63.8%) |
| Arts, Entertainment & Recreation | 104 (80.6%) | 25 (19.4%) |
| Accommodation & Food Services | 356 (51.5%) | 335 (48.5%) |
| Public Administration | 173 (50.6%) | 169 (49.4%) |
| Total | 6,113 (60.1%) | 4,052 (39.9%) |
Education in Patterson
School Enrollment in Patterson
The most common levels of schooling among the 7,015 students in Patterson are high school (1,994 | 28.4%), college / undergraduate (1,568 | 22.4%), and middle school (1,296 | 18.5%).
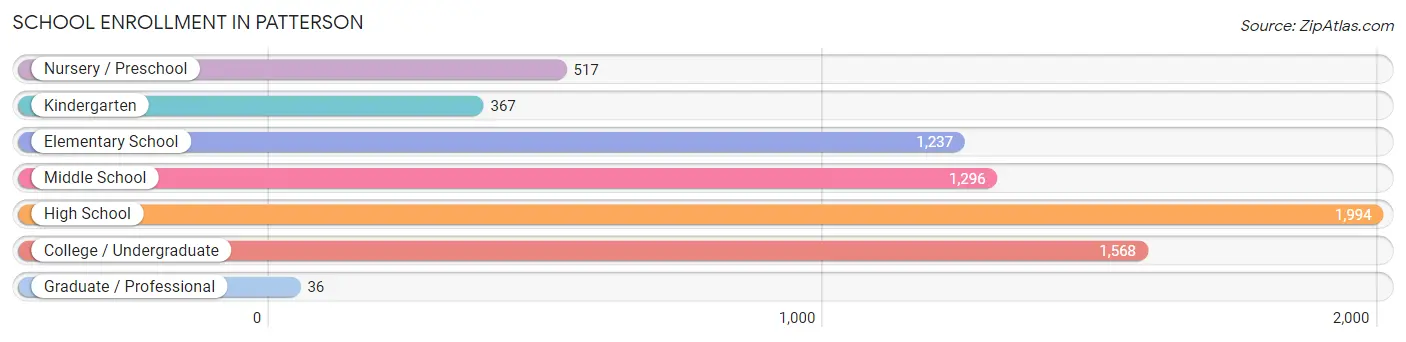
| School Level | # Students | % Students |
| Nursery / Preschool | 517 | 7.4% |
| Kindergarten | 367 | 5.2% |
| Elementary School | 1,237 | 17.6% |
| Middle School | 1,296 | 18.5% |
| High School | 1,994 | 28.4% |
| College / Undergraduate | 1,568 | 22.4% |
| Graduate / Professional | 36 | 0.5% |
| Total | 7,015 | 100.0% |
School Enrollment by Age by Funding Source in Patterson
Out of a total of 7,015 students who are enrolled in schools in Patterson, 737 (10.5%) attend a private institution, while the remaining 6,278 (89.5%) are enrolled in public schools. The age group of 35 years and over has the highest likelihood of being enrolled in private schools, with 137 (42.3% in the age bracket) enrolled. Conversely, the age group of 15 to 17 year olds has the lowest likelihood of being enrolled in a private school, with 1,469 (98.7% in the age bracket) attending a public institution.
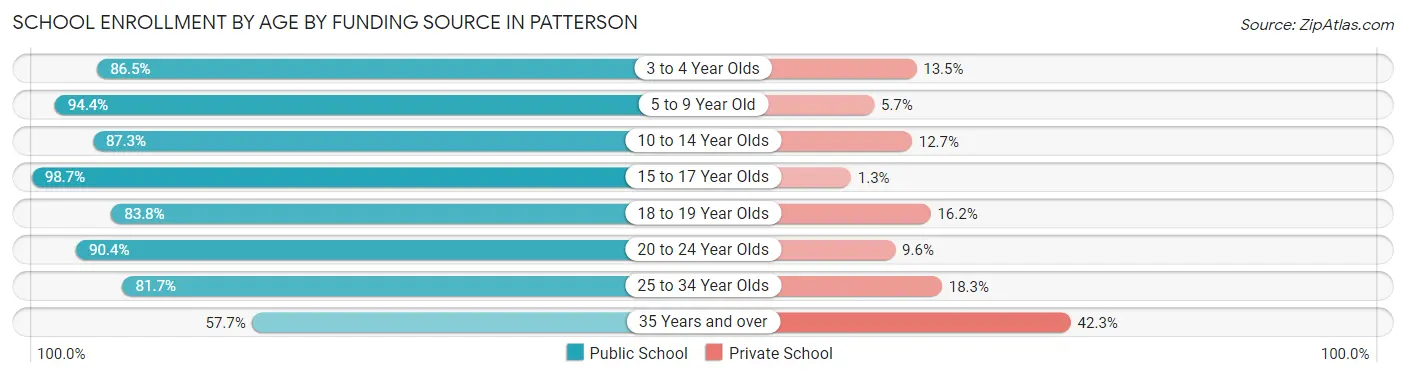
| Age Bracket | Public School | Private School |
| 3 to 4 Year Olds | 377 (86.5%) | 59 (13.5%) |
| 5 to 9 Year Old | 1,286 (94.4%) | 77 (5.7%) |
| 10 to 14 Year Olds | 1,527 (87.3%) | 222 (12.7%) |
| 15 to 17 Year Olds | 1,469 (98.7%) | 20 (1.3%) |
| 18 to 19 Year Olds | 425 (83.8%) | 82 (16.2%) |
| 20 to 24 Year Olds | 745 (90.4%) | 79 (9.6%) |
| 25 to 34 Year Olds | 264 (81.7%) | 59 (18.3%) |
| 35 Years and over | 187 (57.7%) | 137 (42.3%) |
| Total | 6,278 (89.5%) | 737 (10.5%) |
Educational Attainment by Field of Study in Patterson
Business (641 | 31.0%), physical & health sciences (240 | 11.6%), social sciences (187 | 9.0%), science & technology (150 | 7.2%), and liberal arts & history (130 | 6.3%) are the most common fields of study among 2,068 individuals in Patterson who have obtained a bachelor's degree or higher.
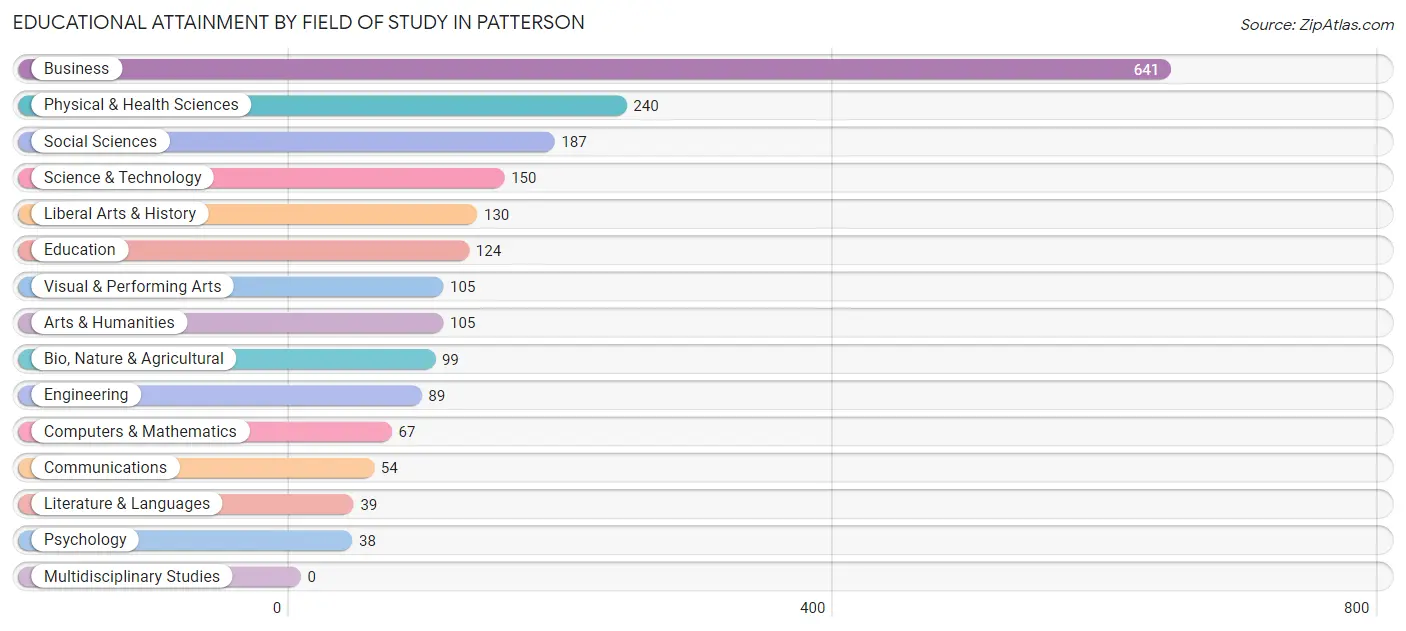
| Field of Study | # Graduates | % Graduates |
| Computers & Mathematics | 67 | 3.2% |
| Bio, Nature & Agricultural | 99 | 4.8% |
| Physical & Health Sciences | 240 | 11.6% |
| Psychology | 38 | 1.8% |
| Social Sciences | 187 | 9.0% |
| Engineering | 89 | 4.3% |
| Multidisciplinary Studies | 0 | 0.0% |
| Science & Technology | 150 | 7.2% |
| Business | 641 | 31.0% |
| Education | 124 | 6.0% |
| Literature & Languages | 39 | 1.9% |
| Liberal Arts & History | 130 | 6.3% |
| Visual & Performing Arts | 105 | 5.1% |
| Communications | 54 | 2.6% |
| Arts & Humanities | 105 | 5.1% |
| Total | 2,068 | 100.0% |
Transportation & Commute in Patterson
Vehicle Availability by Sex in Patterson
The most prevalent vehicle ownership categories in Patterson are males with 3 vehicles (2,072, accounting for 35.2%) and females with 3 vehicles (1,621, making up 53.9%).
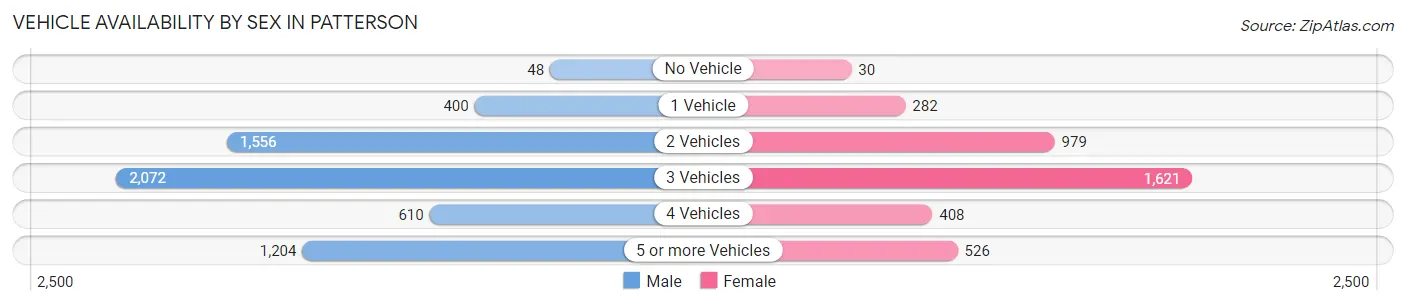
| Vehicles Available | Male | Female |
| No Vehicle | 48 (0.8%) | 30 (0.8%) |
| 1 Vehicle | 400 (6.8%) | 282 (7.3%) |
| 2 Vehicles | 1,556 (26.4%) | 979 (25.5%) |
| 3 Vehicles | 2,072 (35.2%) | 1,621 (42.1%) |
| 4 Vehicles | 610 (10.4%) | 408 (10.6%) |
| 5 or more Vehicles | 1,204 (20.4%) | 526 (13.7%) |
| Total | 5,890 (100.0%) | 3,846 (100.0%) |
Commute Time in Patterson
The most frequently occuring commute durations in Patterson are 90 or more minutes (1,717 commuters, 19.3%), 30 to 34 minutes (1,342 commuters, 15.1%), and 60 to 89 minutes (1,112 commuters, 12.5%).
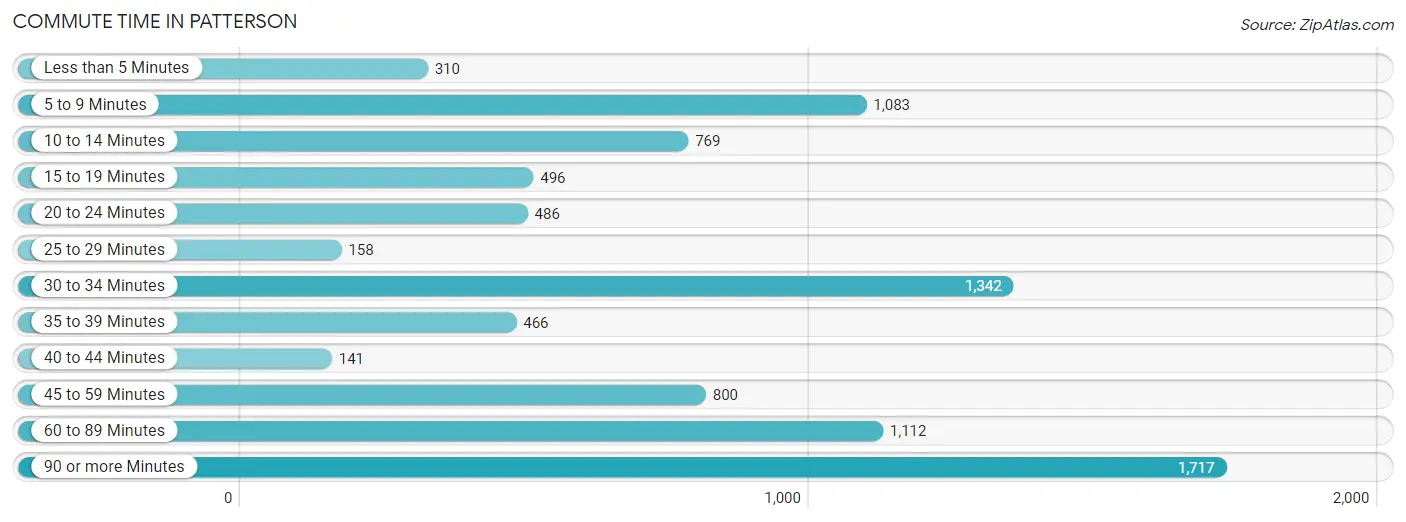
| Commute Time | # Commuters | % Commuters |
| Less than 5 Minutes | 310 | 3.5% |
| 5 to 9 Minutes | 1,083 | 12.2% |
| 10 to 14 Minutes | 769 | 8.7% |
| 15 to 19 Minutes | 496 | 5.6% |
| 20 to 24 Minutes | 486 | 5.5% |
| 25 to 29 Minutes | 158 | 1.8% |
| 30 to 34 Minutes | 1,342 | 15.1% |
| 35 to 39 Minutes | 466 | 5.2% |
| 40 to 44 Minutes | 141 | 1.6% |
| 45 to 59 Minutes | 800 | 9.0% |
| 60 to 89 Minutes | 1,112 | 12.5% |
| 90 or more Minutes | 1,717 | 19.3% |
Commute Time by Sex in Patterson
The most common commute times in Patterson are 90 or more minutes (1,258 commuters, 22.9%) for males and 5 to 9 minutes (647 commuters, 19.2%) for females.
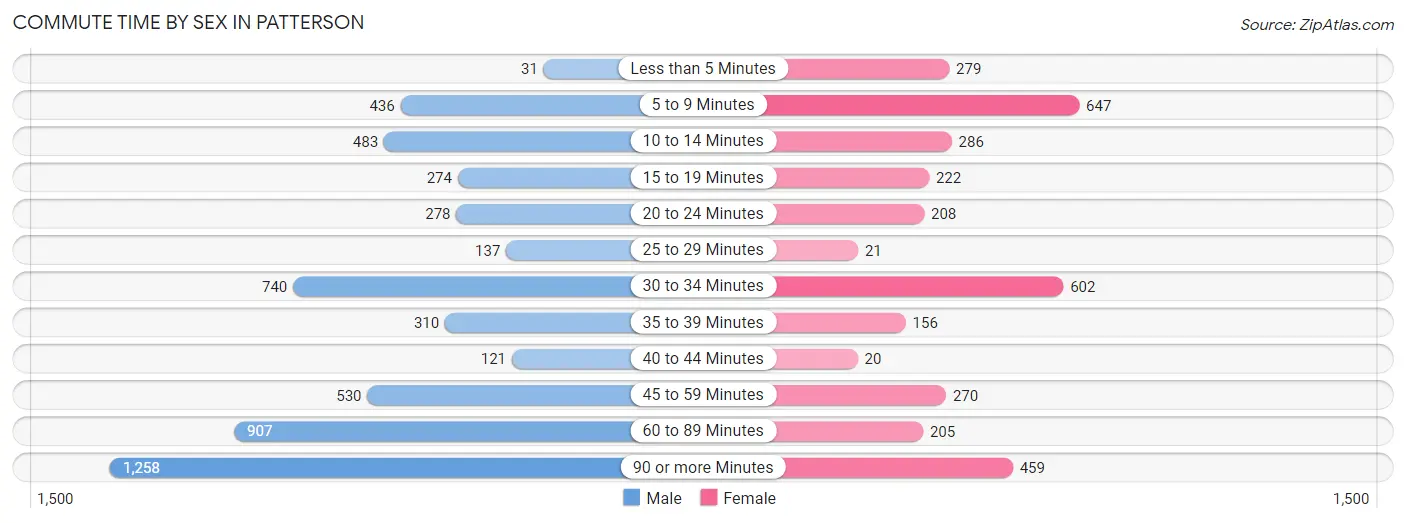
| Commute Time | Male | Female |
| Less than 5 Minutes | 31 (0.6%) | 279 (8.3%) |
| 5 to 9 Minutes | 436 (7.9%) | 647 (19.2%) |
| 10 to 14 Minutes | 483 (8.8%) | 286 (8.5%) |
| 15 to 19 Minutes | 274 (5.0%) | 222 (6.6%) |
| 20 to 24 Minutes | 278 (5.1%) | 208 (6.2%) |
| 25 to 29 Minutes | 137 (2.5%) | 21 (0.6%) |
| 30 to 34 Minutes | 740 (13.4%) | 602 (17.8%) |
| 35 to 39 Minutes | 310 (5.6%) | 156 (4.6%) |
| 40 to 44 Minutes | 121 (2.2%) | 20 (0.6%) |
| 45 to 59 Minutes | 530 (9.6%) | 270 (8.0%) |
| 60 to 89 Minutes | 907 (16.5%) | 205 (6.1%) |
| 90 or more Minutes | 1,258 (22.9%) | 459 (13.6%) |
Time of Departure to Work by Sex in Patterson
The most frequent times of departure to work in Patterson are 12:00 AM to 4:59 AM (1,091, 19.8%) for males and 5:30 AM to 5:59 AM (515, 15.3%) for females.
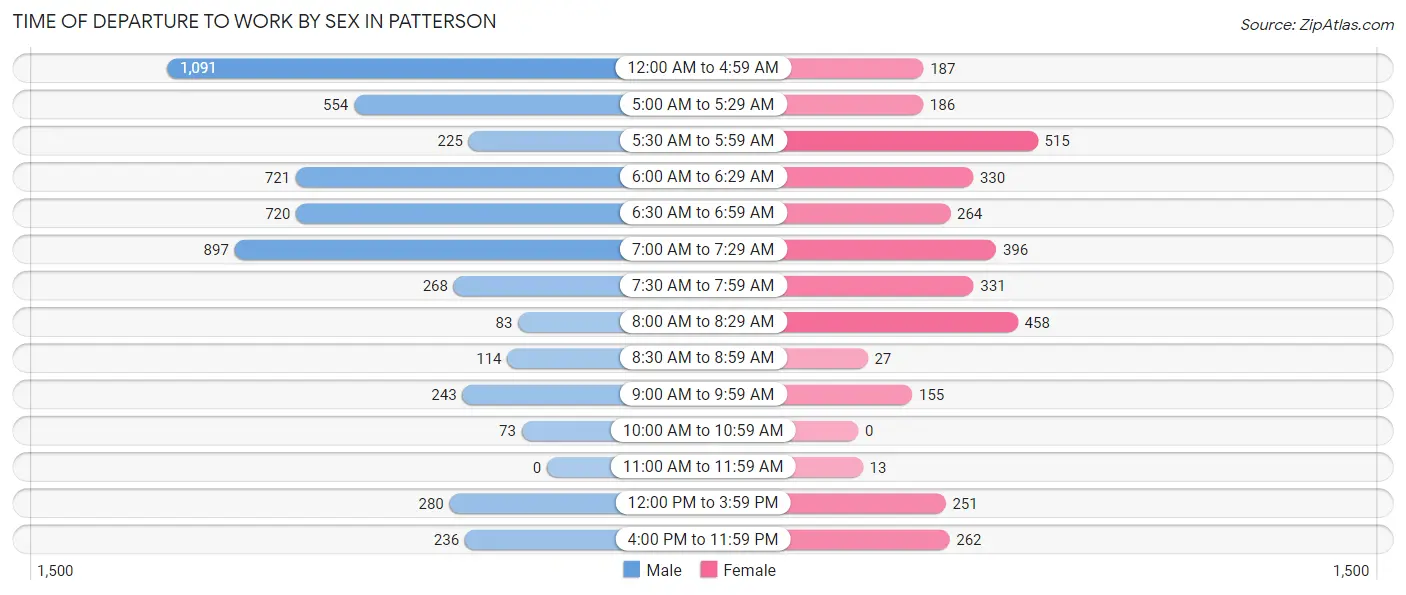
| Time of Departure | Male | Female |
| 12:00 AM to 4:59 AM | 1,091 (19.8%) | 187 (5.5%) |
| 5:00 AM to 5:29 AM | 554 (10.1%) | 186 (5.5%) |
| 5:30 AM to 5:59 AM | 225 (4.1%) | 515 (15.3%) |
| 6:00 AM to 6:29 AM | 721 (13.1%) | 330 (9.8%) |
| 6:30 AM to 6:59 AM | 720 (13.1%) | 264 (7.8%) |
| 7:00 AM to 7:29 AM | 897 (16.3%) | 396 (11.7%) |
| 7:30 AM to 7:59 AM | 268 (4.9%) | 331 (9.8%) |
| 8:00 AM to 8:29 AM | 83 (1.5%) | 458 (13.6%) |
| 8:30 AM to 8:59 AM | 114 (2.1%) | 27 (0.8%) |
| 9:00 AM to 9:59 AM | 243 (4.4%) | 155 (4.6%) |
| 10:00 AM to 10:59 AM | 73 (1.3%) | 0 (0.0%) |
| 11:00 AM to 11:59 AM | 0 (0.0%) | 13 (0.4%) |
| 12:00 PM to 3:59 PM | 280 (5.1%) | 251 (7.4%) |
| 4:00 PM to 11:59 PM | 236 (4.3%) | 262 (7.8%) |
| Total | 5,505 (100.0%) | 3,375 (100.0%) |
Housing Occupancy in Patterson
Occupancy by Ownership in Patterson
Of the total 6,345 dwellings in Patterson, owner-occupied units account for 4,657 (73.4%), while renter-occupied units make up 1,688 (26.6%).
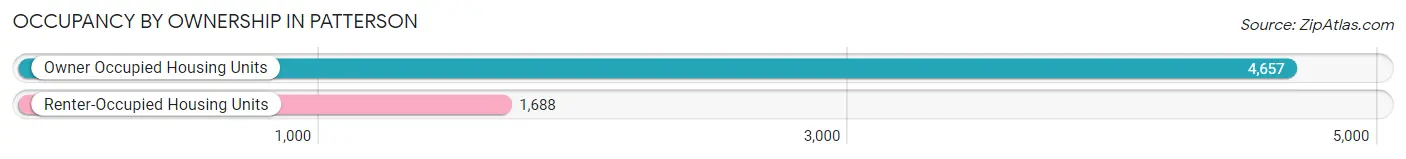
| Occupancy | # Housing Units | % Housing Units |
| Owner Occupied Housing Units | 4,657 | 73.4% |
| Renter-Occupied Housing Units | 1,688 | 26.6% |
| Total Occupied Housing Units | 6,345 | 100.0% |
Occupancy by Household Size in Patterson
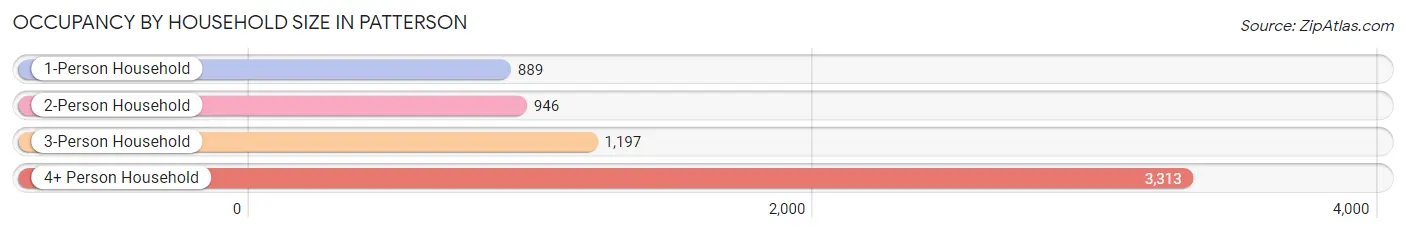
| Household Size | # Housing Units | % Housing Units |
| 1-Person Household | 889 | 14.0% |
| 2-Person Household | 946 | 14.9% |
| 3-Person Household | 1,197 | 18.9% |
| 4+ Person Household | 3,313 | 52.2% |
| Total Housing Units | 6,345 | 100.0% |
Occupancy by Ownership by Household Size in Patterson
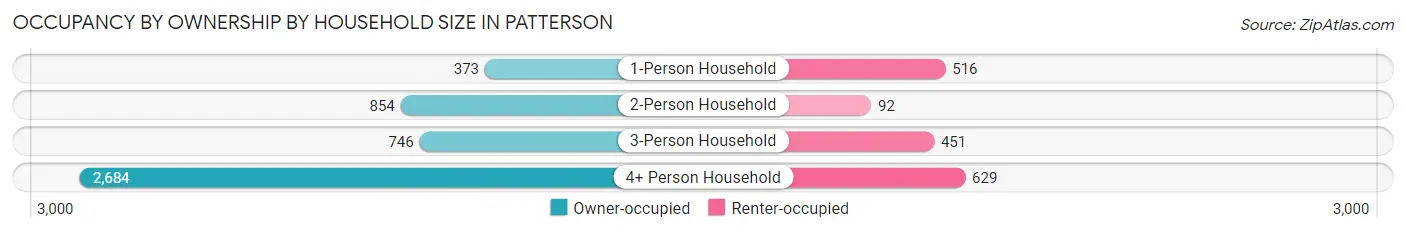
| Household Size | Owner-occupied | Renter-occupied |
| 1-Person Household | 373 (42.0%) | 516 (58.0%) |
| 2-Person Household | 854 (90.3%) | 92 (9.7%) |
| 3-Person Household | 746 (62.3%) | 451 (37.7%) |
| 4+ Person Household | 2,684 (81.0%) | 629 (19.0%) |
| Total Housing Units | 4,657 (73.4%) | 1,688 (26.6%) |
Occupancy by Educational Attainment in Patterson
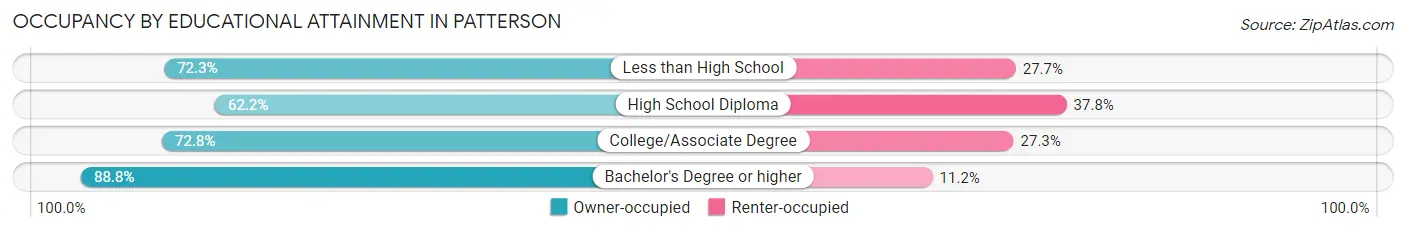
| Household Size | Owner-occupied | Renter-occupied |
| Less than High School | 1,097 (72.3%) | 420 (27.7%) |
| High School Diploma | 964 (62.2%) | 585 (37.8%) |
| College/Associate Degree | 1,431 (72.8%) | 536 (27.3%) |
| Bachelor's Degree or higher | 1,165 (88.8%) | 147 (11.2%) |
Occupancy by Age of Householder in Patterson
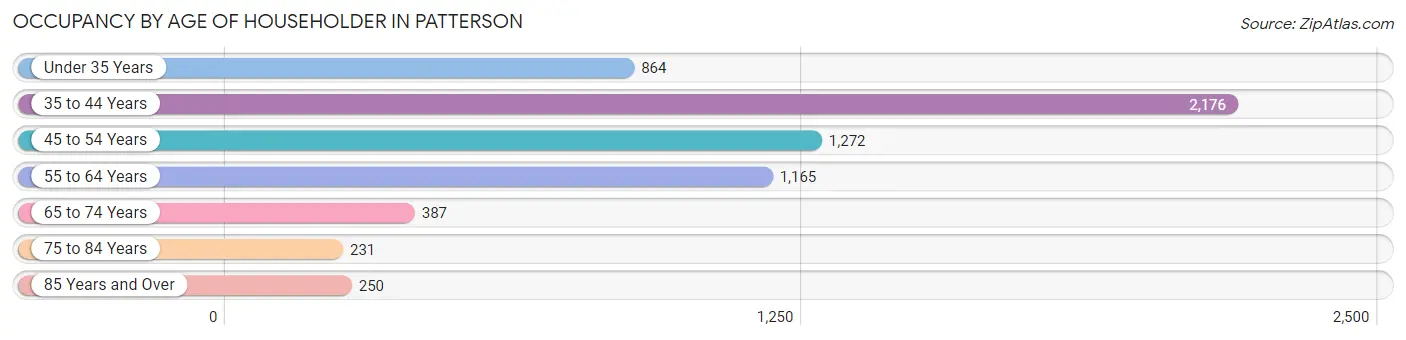
| Age Bracket | # Households | % Households |
| Under 35 Years | 864 | 13.6% |
| 35 to 44 Years | 2,176 | 34.3% |
| 45 to 54 Years | 1,272 | 20.1% |
| 55 to 64 Years | 1,165 | 18.4% |
| 65 to 74 Years | 387 | 6.1% |
| 75 to 84 Years | 231 | 3.6% |
| 85 Years and Over | 250 | 3.9% |
| Total | 6,345 | 100.0% |
Housing Finances in Patterson
Median Income by Occupancy in Patterson
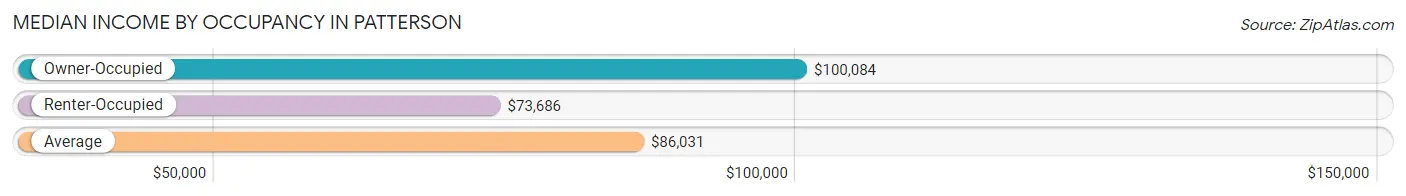
| Occupancy Type | # Households | Median Income |
| Owner-Occupied | 4,657 (73.4%) | $100,084 |
| Renter-Occupied | 1,688 (26.6%) | $73,686 |
| Average | 6,345 (100.0%) | $86,031 |
Occupancy by Householder Income Bracket in Patterson
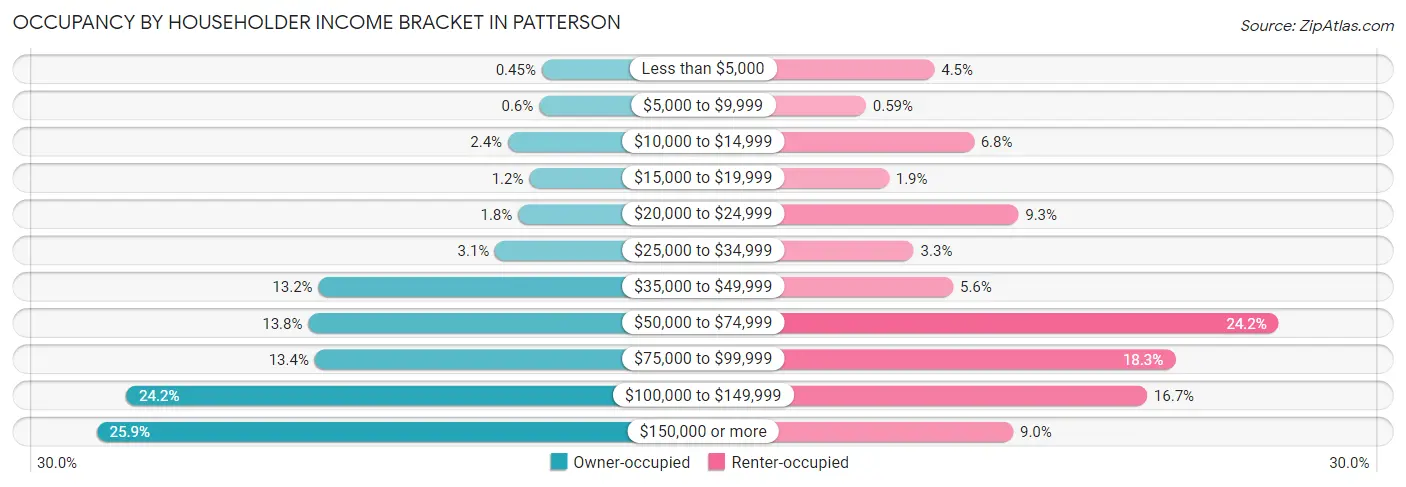
| Income Bracket | Owner-occupied | Renter-occupied |
| Less than $5,000 | 21 (0.4%) | 76 (4.5%) |
| $5,000 to $9,999 | 28 (0.6%) | 10 (0.6%) |
| $10,000 to $14,999 | 111 (2.4%) | 114 (6.8%) |
| $15,000 to $19,999 | 54 (1.2%) | 32 (1.9%) |
| $20,000 to $24,999 | 84 (1.8%) | 157 (9.3%) |
| $25,000 to $34,999 | 145 (3.1%) | 56 (3.3%) |
| $35,000 to $49,999 | 615 (13.2%) | 94 (5.6%) |
| $50,000 to $74,999 | 642 (13.8%) | 408 (24.2%) |
| $75,000 to $99,999 | 625 (13.4%) | 308 (18.2%) |
| $100,000 to $149,999 | 1,127 (24.2%) | 281 (16.7%) |
| $150,000 or more | 1,205 (25.9%) | 152 (9.0%) |
| Total | 4,657 (100.0%) | 1,688 (100.0%) |
Monthly Housing Cost Tiers in Patterson
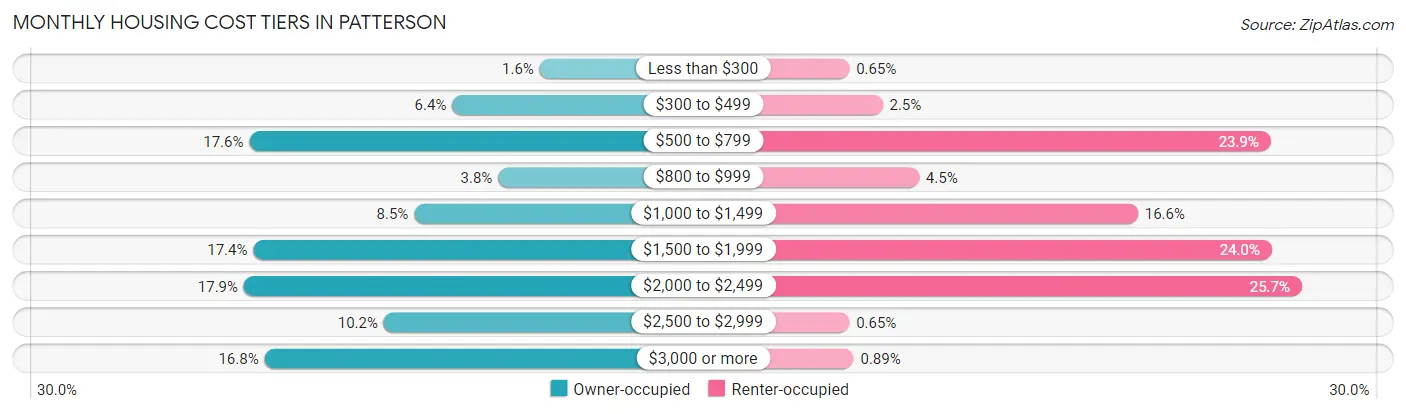
| Monthly Cost | Owner-occupied | Renter-occupied |
| Less than $300 | 72 (1.5%) | 11 (0.6%) |
| $300 to $499 | 297 (6.4%) | 42 (2.5%) |
| $500 to $799 | 819 (17.6%) | 404 (23.9%) |
| $800 to $999 | 179 (3.8%) | 76 (4.5%) |
| $1,000 to $1,499 | 395 (8.5%) | 280 (16.6%) |
| $1,500 to $1,999 | 809 (17.4%) | 405 (24.0%) |
| $2,000 to $2,499 | 833 (17.9%) | 433 (25.7%) |
| $2,500 to $2,999 | 473 (10.2%) | 11 (0.6%) |
| $3,000 or more | 780 (16.8%) | 15 (0.9%) |
| Total | 4,657 (100.0%) | 1,688 (100.0%) |
Physical Housing Characteristics in Patterson
Housing Structures in Patterson
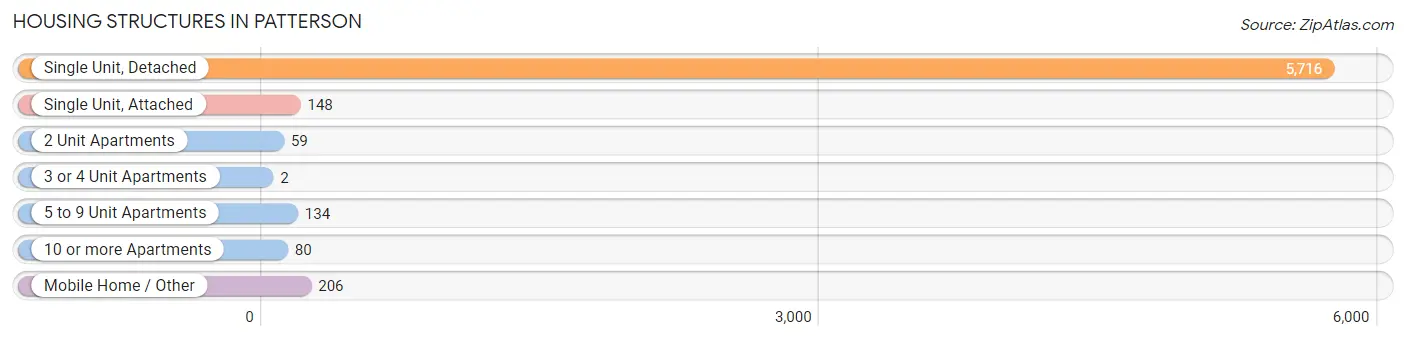
| Structure Type | # Housing Units | % Housing Units |
| Single Unit, Detached | 5,716 | 90.1% |
| Single Unit, Attached | 148 | 2.3% |
| 2 Unit Apartments | 59 | 0.9% |
| 3 or 4 Unit Apartments | 2 | 0.0% |
| 5 to 9 Unit Apartments | 134 | 2.1% |
| 10 or more Apartments | 80 | 1.3% |
| Mobile Home / Other | 206 | 3.3% |
| Total | 6,345 | 100.0% |
Housing Structures by Occupancy in Patterson
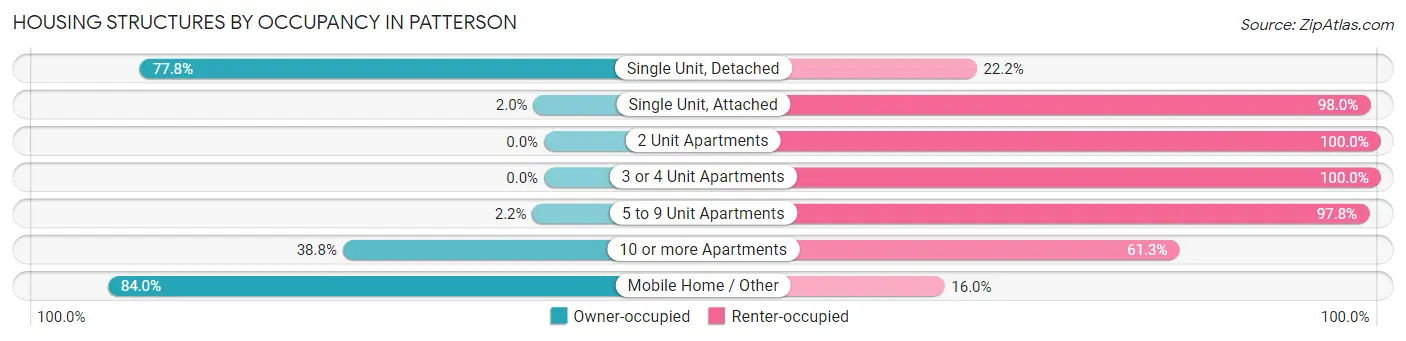
| Structure Type | Owner-occupied | Renter-occupied |
| Single Unit, Detached | 4,447 (77.8%) | 1,269 (22.2%) |
| Single Unit, Attached | 3 (2.0%) | 145 (98.0%) |
| 2 Unit Apartments | 0 (0.0%) | 59 (100.0%) |
| 3 or 4 Unit Apartments | 0 (0.0%) | 2 (100.0%) |
| 5 to 9 Unit Apartments | 3 (2.2%) | 131 (97.8%) |
| 10 or more Apartments | 31 (38.8%) | 49 (61.3%) |
| Mobile Home / Other | 173 (84.0%) | 33 (16.0%) |
| Total | 4,657 (73.4%) | 1,688 (26.6%) |
Housing Structures by Number of Rooms in Patterson
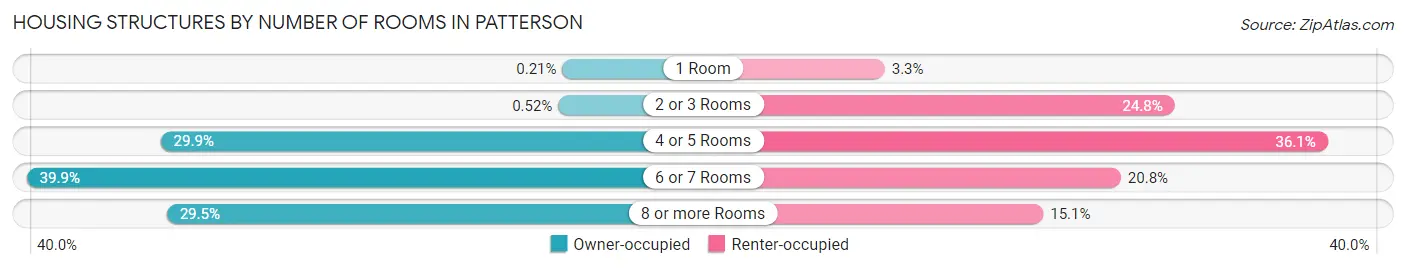
| Number of Rooms | Owner-occupied | Renter-occupied |
| 1 Room | 10 (0.2%) | 56 (3.3%) |
| 2 or 3 Rooms | 24 (0.5%) | 418 (24.8%) |
| 4 or 5 Rooms | 1,394 (29.9%) | 609 (36.1%) |
| 6 or 7 Rooms | 1,856 (39.9%) | 351 (20.8%) |
| 8 or more Rooms | 1,373 (29.5%) | 254 (15.0%) |
| Total | 4,657 (100.0%) | 1,688 (100.0%) |
Housing Structure by Heating Type in Patterson
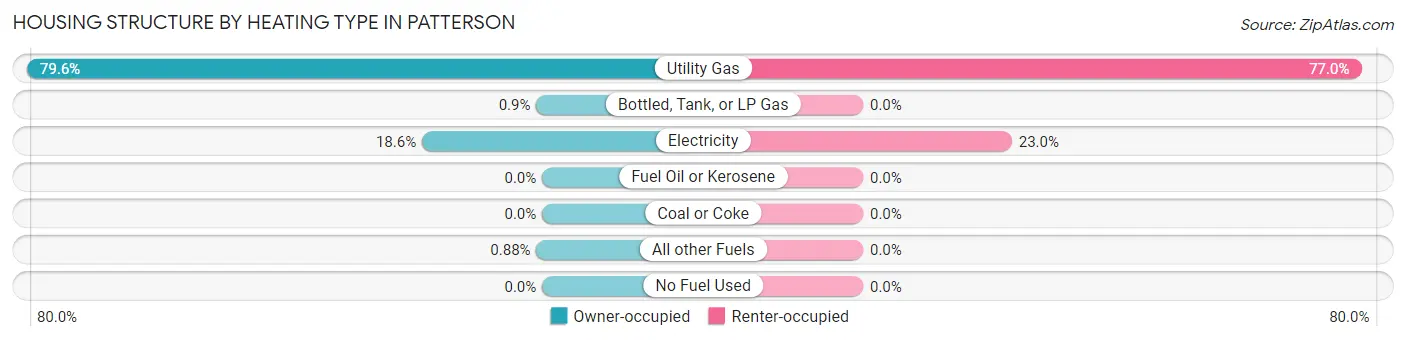
| Heating Type | Owner-occupied | Renter-occupied |
| Utility Gas | 3,709 (79.6%) | 1,300 (77.0%) |
| Bottled, Tank, or LP Gas | 42 (0.9%) | 0 (0.0%) |
| Electricity | 865 (18.6%) | 388 (23.0%) |
| Fuel Oil or Kerosene | 0 (0.0%) | 0 (0.0%) |
| Coal or Coke | 0 (0.0%) | 0 (0.0%) |
| All other Fuels | 41 (0.9%) | 0 (0.0%) |
| No Fuel Used | 0 (0.0%) | 0 (0.0%) |
| Total | 4,657 (100.0%) | 1,688 (100.0%) |
Household Vehicle Usage in Patterson
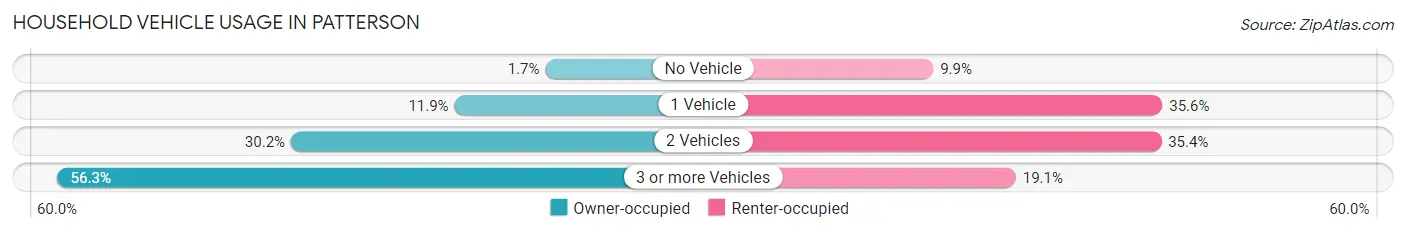
| Vehicles per Household | Owner-occupied | Renter-occupied |
| No Vehicle | 78 (1.7%) | 167 (9.9%) |
| 1 Vehicle | 552 (11.8%) | 600 (35.5%) |
| 2 Vehicles | 1,405 (30.2%) | 598 (35.4%) |
| 3 or more Vehicles | 2,622 (56.3%) | 323 (19.1%) |
| Total | 4,657 (100.0%) | 1,688 (100.0%) |
Real Estate & Mortgages in Patterson
Real Estate and Mortgage Overview in Patterson
| Characteristic | Without Mortgage | With Mortgage |
| Housing Units | 1,461 | 3,196 |
| Median Property Value | $422,800 | $416,000 |
| Median Household Income | $83,681 | $1,056 |
| Monthly Housing Costs | $632 | $726 |
| Real Estate Taxes | $2,692 | $63 |
Property Value by Mortgage Status in Patterson
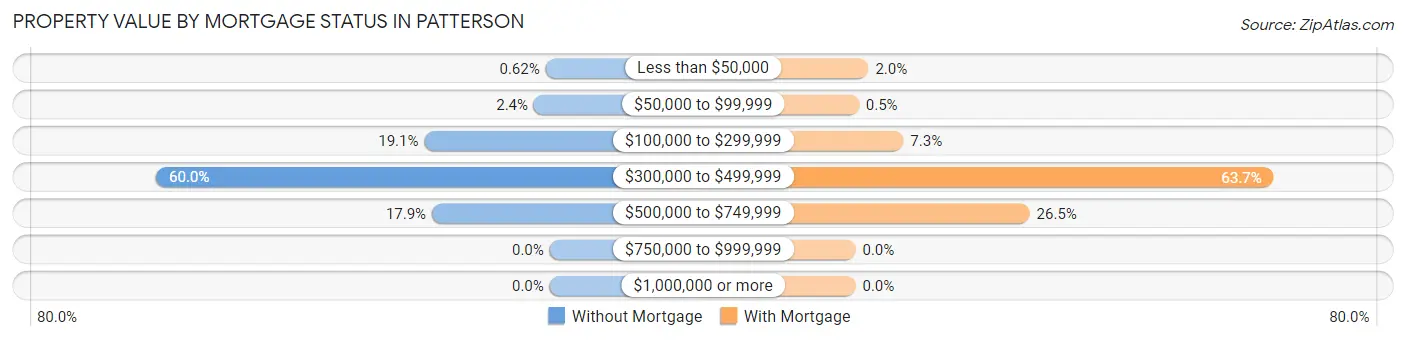
| Property Value | Without Mortgage | With Mortgage |
| Less than $50,000 | 9 (0.6%) | 63 (2.0%) |
| $50,000 to $99,999 | 35 (2.4%) | 16 (0.5%) |
| $100,000 to $299,999 | 279 (19.1%) | 233 (7.3%) |
| $300,000 to $499,999 | 876 (60.0%) | 2,036 (63.7%) |
| $500,000 to $749,999 | 262 (17.9%) | 848 (26.5%) |
| $750,000 to $999,999 | 0 (0.0%) | 0 (0.0%) |
| $1,000,000 or more | 0 (0.0%) | 0 (0.0%) |
| Total | 1,461 (100.0%) | 3,196 (100.0%) |
Household Income by Mortgage Status in Patterson
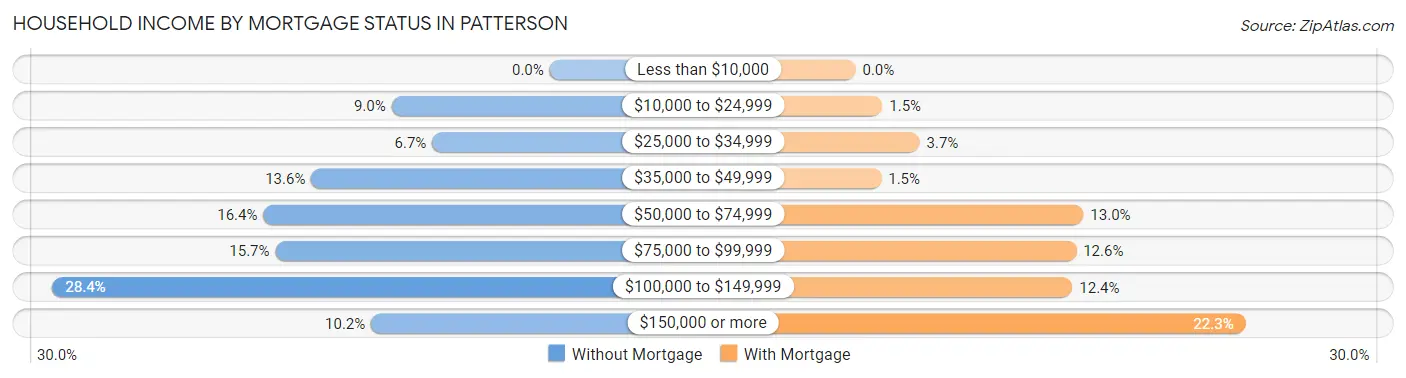
| Household Income | Without Mortgage | With Mortgage |
| Less than $10,000 | 0 (0.0%) | 0 (0.0%) |
| $10,000 to $24,999 | 132 (9.0%) | 49 (1.5%) |
| $25,000 to $34,999 | 98 (6.7%) | 117 (3.7%) |
| $35,000 to $49,999 | 199 (13.6%) | 47 (1.5%) |
| $50,000 to $74,999 | 239 (16.4%) | 416 (13.0%) |
| $75,000 to $99,999 | 229 (15.7%) | 403 (12.6%) |
| $100,000 to $149,999 | 415 (28.4%) | 396 (12.4%) |
| $150,000 or more | 149 (10.2%) | 712 (22.3%) |
| Total | 1,461 (100.0%) | 3,196 (100.0%) |
Property Value to Household Income Ratio in Patterson
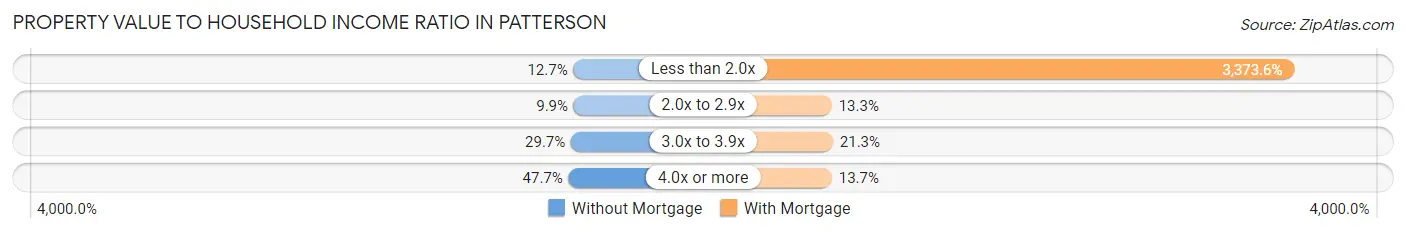
| Value-to-Income Ratio | Without Mortgage | With Mortgage |
| Less than 2.0x | 185 (12.7%) | 107,821 (3,373.6%) |
| 2.0x to 2.9x | 145 (9.9%) | 425 (13.3%) |
| 3.0x to 3.9x | 434 (29.7%) | 682 (21.3%) |
| 4.0x or more | 697 (47.7%) | 439 (13.7%) |
| Total | 1,461 (100.0%) | 3,196 (100.0%) |
Real Estate Taxes by Mortgage Status in Patterson
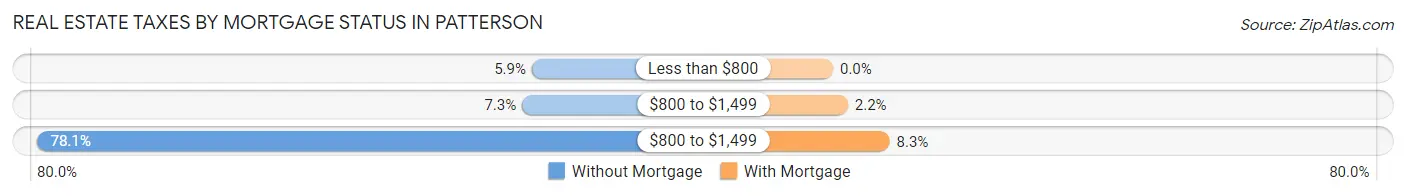
| Property Taxes | Without Mortgage | With Mortgage |
| Less than $800 | 86 (5.9%) | 0 (0.0%) |
| $800 to $1,499 | 107 (7.3%) | 69 (2.2%) |
| $800 to $1,499 | 1,141 (78.1%) | 264 (8.3%) |
| Total | 1,461 (100.0%) | 3,196 (100.0%) |
Health & Disability in Patterson
Health Insurance Coverage by Age in Patterson
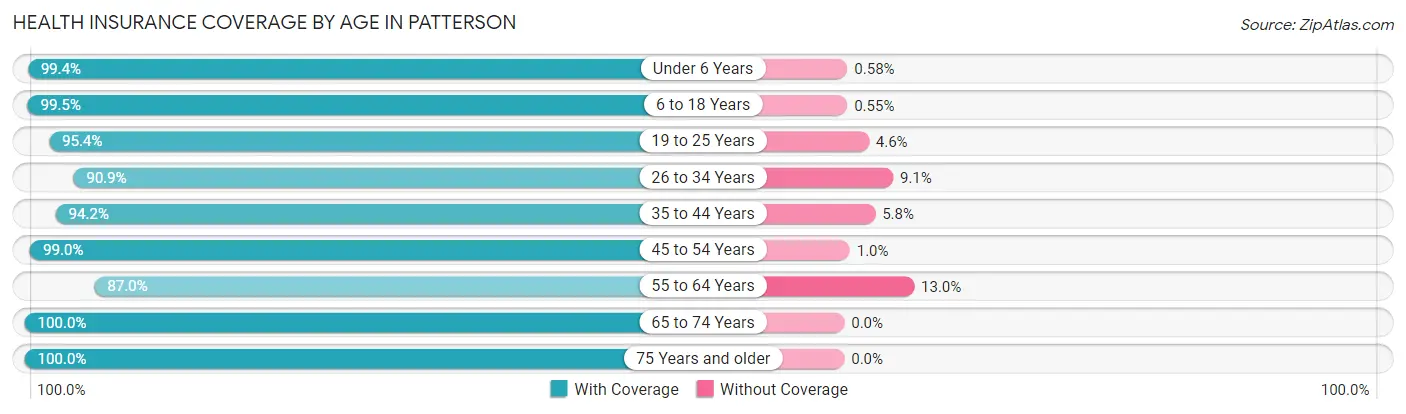
| Age Bracket | With Coverage | Without Coverage |
| Under 6 Years | 2,557 (99.4%) | 15 (0.6%) |
| 6 to 18 Years | 5,470 (99.5%) | 30 (0.5%) |
| 19 to 25 Years | 2,310 (95.4%) | 111 (4.6%) |
| 26 to 34 Years | 2,399 (90.9%) | 240 (9.1%) |
| 35 to 44 Years | 3,563 (94.2%) | 218 (5.8%) |
| 45 to 54 Years | 2,726 (99.0%) | 28 (1.0%) |
| 55 to 64 Years | 1,803 (87.0%) | 270 (13.0%) |
| 65 to 74 Years | 960 (100.0%) | 0 (0.0%) |
| 75 Years and older | 978 (100.0%) | 0 (0.0%) |
| Total | 22,766 (96.2%) | 912 (3.8%) |
Health Insurance Coverage by Citizenship Status in Patterson
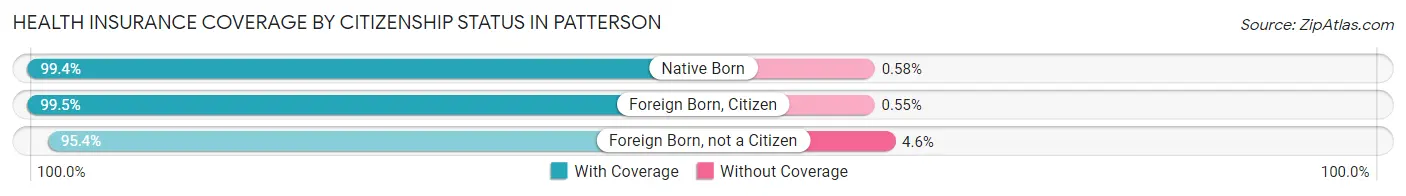
| Citizenship Status | With Coverage | Without Coverage |
| Native Born | 2,557 (99.4%) | 15 (0.6%) |
| Foreign Born, Citizen | 5,470 (99.5%) | 30 (0.5%) |
| Foreign Born, not a Citizen | 2,310 (95.4%) | 111 (4.6%) |
Health Insurance Coverage by Household Income in Patterson
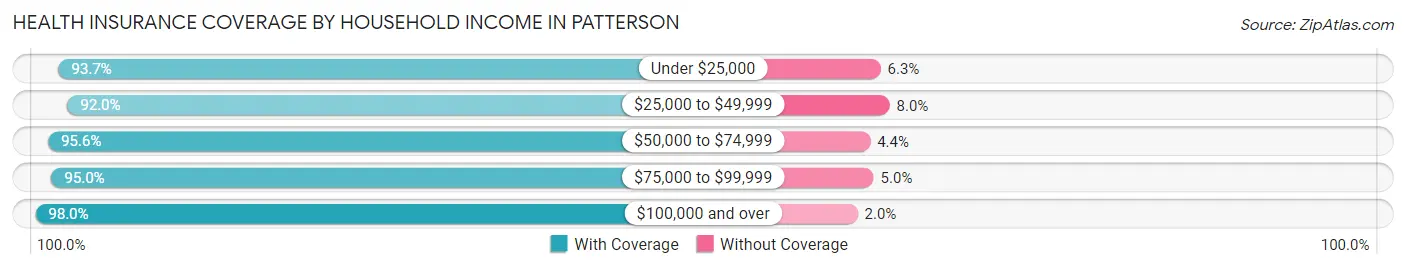
| Household Income | With Coverage | Without Coverage |
| Under $25,000 | 1,403 (93.7%) | 95 (6.3%) |
| $25,000 to $49,999 | 2,797 (92.0%) | 244 (8.0%) |
| $50,000 to $74,999 | 3,547 (95.6%) | 163 (4.4%) |
| $75,000 to $99,999 | 3,113 (95.0%) | 165 (5.0%) |
| $100,000 and over | 11,869 (98.0%) | 245 (2.0%) |
Public vs Private Health Insurance Coverage by Age in Patterson
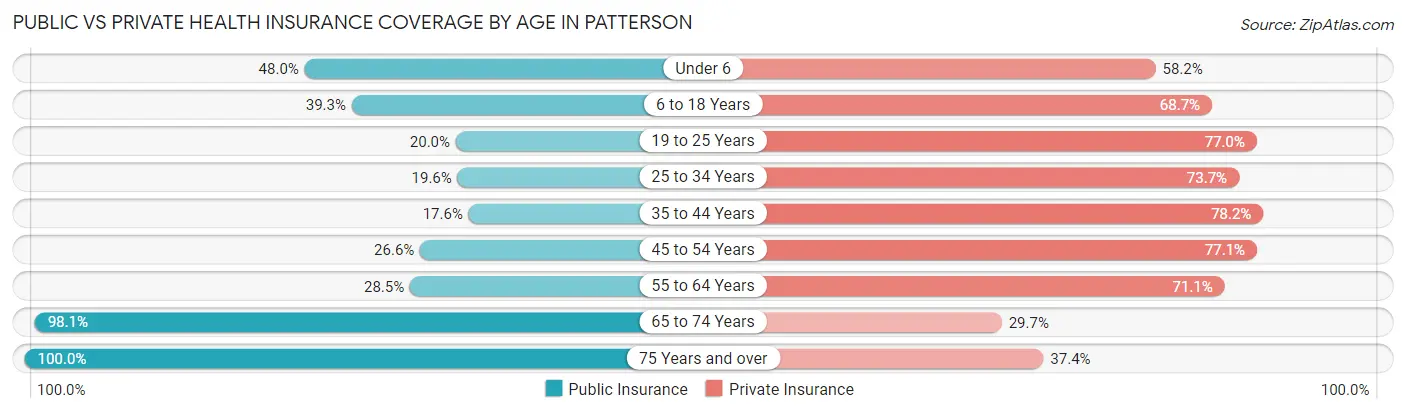
| Age Bracket | Public Insurance | Private Insurance |
| Under 6 | 1,235 (48.0%) | 1,498 (58.2%) |
| 6 to 18 Years | 2,160 (39.3%) | 3,778 (68.7%) |
| 19 to 25 Years | 483 (20.0%) | 1,865 (77.0%) |
| 25 to 34 Years | 518 (19.6%) | 1,945 (73.7%) |
| 35 to 44 Years | 664 (17.6%) | 2,957 (78.2%) |
| 45 to 54 Years | 732 (26.6%) | 2,122 (77.0%) |
| 55 to 64 Years | 590 (28.5%) | 1,473 (71.1%) |
| 65 to 74 Years | 942 (98.1%) | 285 (29.7%) |
| 75 Years and over | 978 (100.0%) | 366 (37.4%) |
| Total | 8,302 (35.1%) | 16,289 (68.8%) |
Disability Status by Sex by Age in Patterson
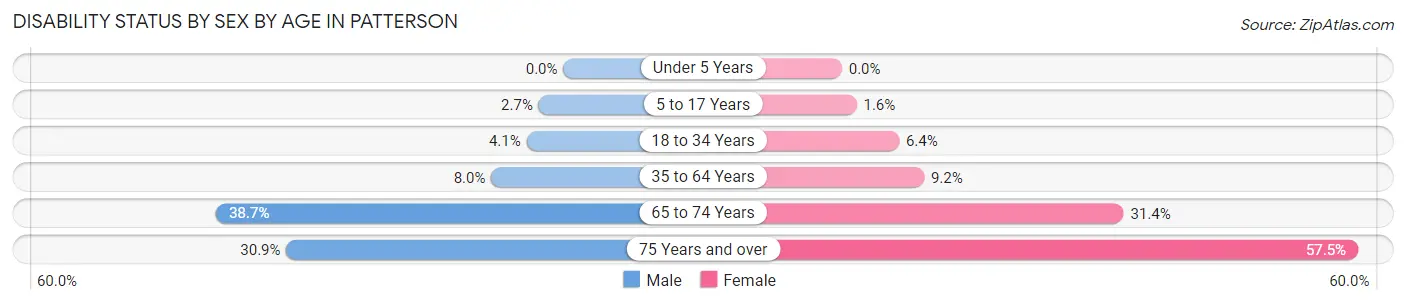
| Age Bracket | Male | Female |
| Under 5 Years | 0 (0.0%) | 0 (0.0%) |
| 5 to 17 Years | 77 (2.7%) | 42 (1.6%) |
| 18 to 34 Years | 119 (4.1%) | 171 (6.4%) |
| 35 to 64 Years | 366 (8.0%) | 370 (9.1%) |
| 65 to 74 Years | 147 (38.7%) | 182 (31.4%) |
| 75 Years and over | 116 (30.8%) | 346 (57.5%) |
Disability Class by Sex by Age in Patterson
Disability Class: Hearing Difficulty
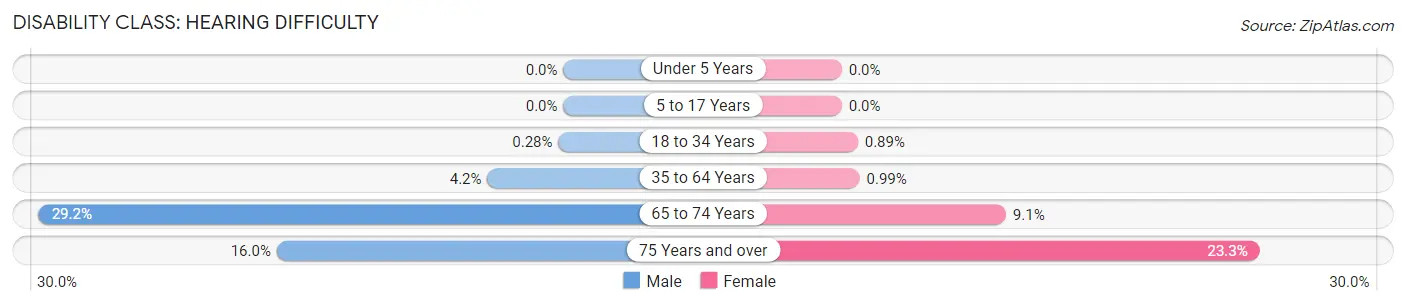
| Age Bracket | Male | Female |
| Under 5 Years | 0 (0.0%) | 0 (0.0%) |
| 5 to 17 Years | 0 (0.0%) | 0 (0.0%) |
| 18 to 34 Years | 8 (0.3%) | 24 (0.9%) |
| 35 to 64 Years | 193 (4.2%) | 40 (1.0%) |
| 65 to 74 Years | 111 (29.2%) | 53 (9.1%) |
| 75 Years and over | 60 (16.0%) | 140 (23.3%) |
Disability Class: Vision Difficulty
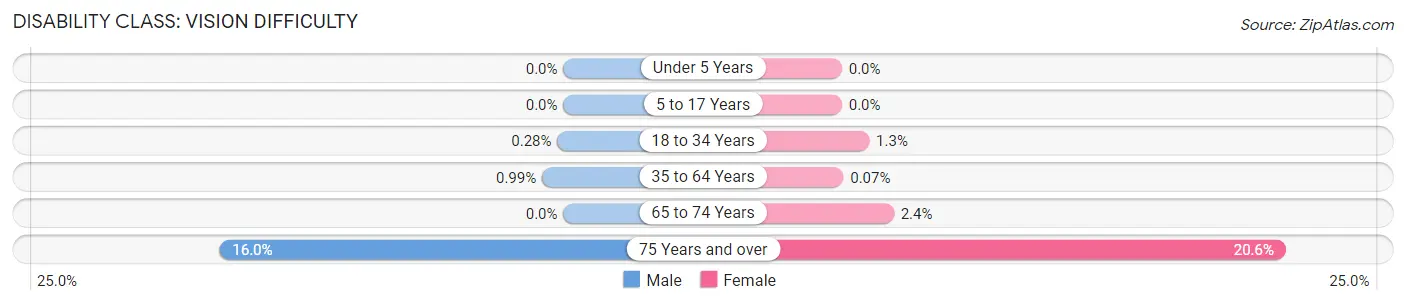
| Age Bracket | Male | Female |
| Under 5 Years | 0 (0.0%) | 0 (0.0%) |
| 5 to 17 Years | 0 (0.0%) | 0 (0.0%) |
| 18 to 34 Years | 8 (0.3%) | 34 (1.3%) |
| 35 to 64 Years | 45 (1.0%) | 3 (0.1%) |
| 65 to 74 Years | 0 (0.0%) | 14 (2.4%) |
| 75 Years and over | 60 (16.0%) | 124 (20.6%) |
Disability Class: Cognitive Difficulty
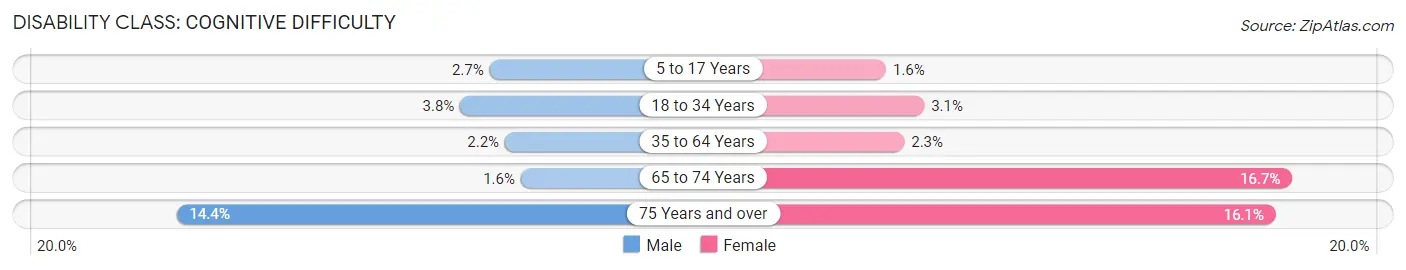
| Age Bracket | Male | Female |
| 5 to 17 Years | 77 (2.7%) | 42 (1.6%) |
| 18 to 34 Years | 111 (3.8%) | 82 (3.1%) |
| 35 to 64 Years | 99 (2.2%) | 94 (2.3%) |
| 65 to 74 Years | 6 (1.6%) | 97 (16.7%) |
| 75 Years and over | 54 (14.4%) | 97 (16.1%) |
Disability Class: Ambulatory Difficulty
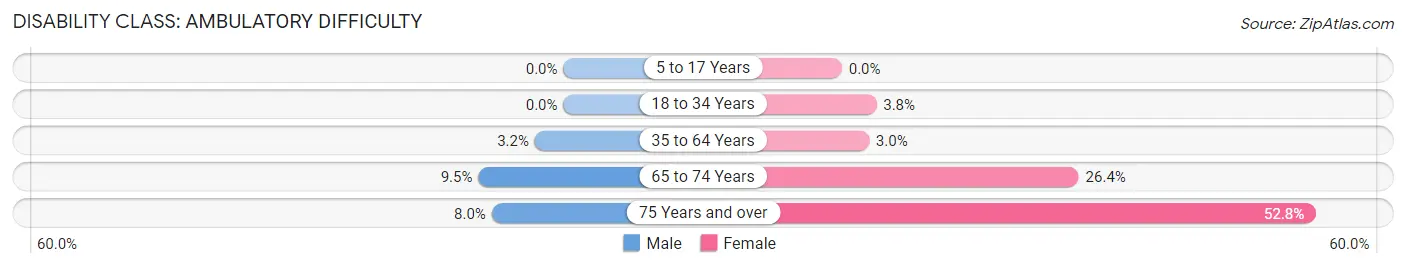
| Age Bracket | Male | Female |
| 5 to 17 Years | 0 (0.0%) | 0 (0.0%) |
| 18 to 34 Years | 0 (0.0%) | 103 (3.8%) |
| 35 to 64 Years | 145 (3.2%) | 122 (3.0%) |
| 65 to 74 Years | 36 (9.5%) | 153 (26.4%) |
| 75 Years and over | 30 (8.0%) | 318 (52.8%) |
Disability Class: Self-Care Difficulty
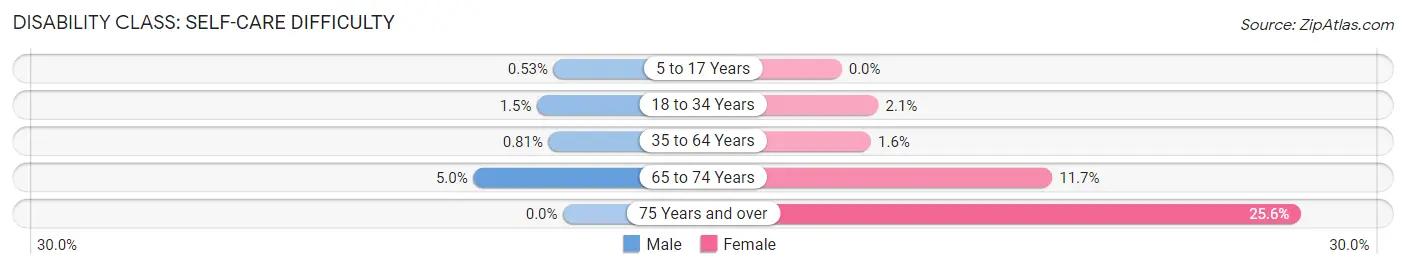
| Age Bracket | Male | Female |
| 5 to 17 Years | 15 (0.5%) | 0 (0.0%) |
| 18 to 34 Years | 42 (1.5%) | 55 (2.1%) |
| 35 to 64 Years | 37 (0.8%) | 66 (1.6%) |
| 65 to 74 Years | 19 (5.0%) | 68 (11.7%) |
| 75 Years and over | 0 (0.0%) | 154 (25.6%) |
Technology Access in Patterson
Computing Device Access in Patterson
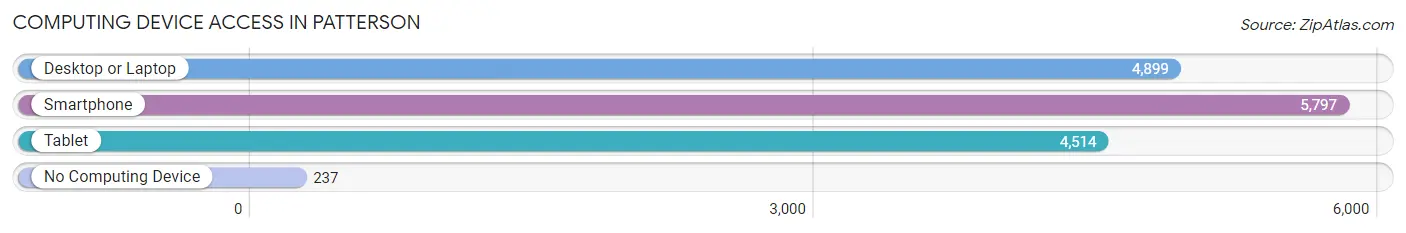
| Device Type | # Households | % Households |
| Desktop or Laptop | 4,899 | 77.2% |
| Smartphone | 5,797 | 91.4% |
| Tablet | 4,514 | 71.1% |
| No Computing Device | 237 | 3.7% |
| Total | 6,345 | 100.0% |
Internet Access in Patterson
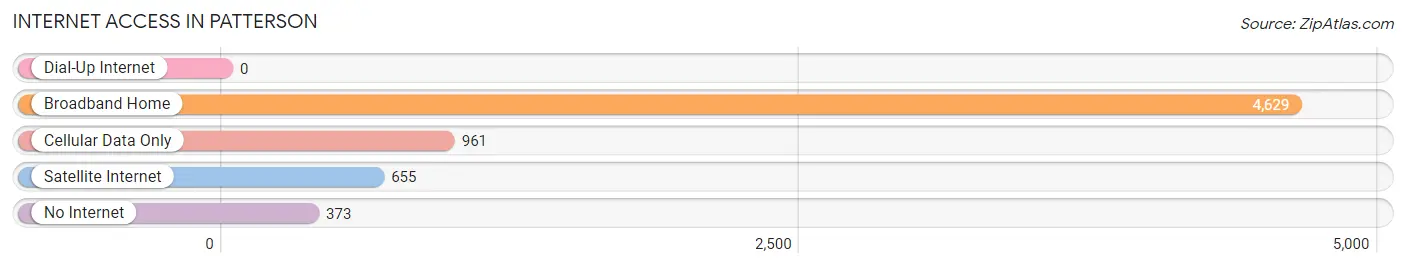
| Internet Type | # Households | % Households |
| Dial-Up Internet | 0 | 0.0% |
| Broadband Home | 4,629 | 73.0% |
| Cellular Data Only | 961 | 15.1% |
| Satellite Internet | 655 | 10.3% |
| No Internet | 373 | 5.9% |
| Total | 6,345 | 100.0% |
Patterson Summary
Patterson is a city located in Stanislaus County, California, United States. It is situated in the Central Valley, approximately 40 miles southeast of Modesto and 70 miles south of Sacramento. The population was estimated to be 22,717 in 2019.
History
Patterson was founded in 1856 by George W. Patterson, a settler from Illinois. He purchased land from the Mexican government and established a ranch and trading post. The town was originally called Patterson's Creek, but the name was changed to Patterson in 1874.
The town grew slowly until the arrival of the railroad in 1872. This brought an influx of settlers and businesses, and the town began to develop. The first post office was established in 1873, and the first school was built in 1876.
In the early 1900s, Patterson was a thriving agricultural community, with many farms and ranches in the area. The town was also home to several canneries, which processed the abundant fruit and vegetable crops grown in the area.
In the 1950s, Patterson began to experience rapid growth due to the influx of people from the San Francisco Bay Area. This growth continued into the 1960s and 1970s, and the population of the city increased from 2,000 in 1950 to over 10,000 by 1980.
Geography
Patterson is located in the Central Valley of California, approximately 40 miles southeast of Modesto and 70 miles south of Sacramento. The city is situated on the San Joaquin River, and is surrounded by rolling hills and farmland.
The climate in Patterson is mild and dry, with hot summers and cool winters. The average annual temperature is around 60°F, and the average annual precipitation is around 12 inches.
Economy
The economy of Patterson is largely based on agriculture. The city is home to many farms and ranches, and the surrounding area is known for its production of fruits, vegetables, and nuts.
The city is also home to several manufacturing and distribution companies, including Foster Farms, a poultry processing company, and Del Monte Foods, a food processing company.
Demographics
As of the 2019 census, the population of Patterson was estimated to be 22,717. The racial makeup of the city was 57.3% White, 2.3% African American, 0.7% Native American, 1.2% Asian, 0.1% Pacific Islander, and 37.4% from other races. Hispanic or Latino of any race were 64.2% of the population.
The median household income in Patterson was $50,945, and the median family income was $58,945. The per capita income was $20,945. About 17.3% of the population was below the poverty line.
Common Questions
What is Per Capita Income in Patterson?
Per Capita income in Patterson is $29,091.
What is the Median Family Income in Patterson?
Median Family Income in Patterson is $88,663.
What is the Median Household income in Patterson?
Median Household Income in Patterson is $86,031.
What is Income or Wage Gap in Patterson?
Income or Wage Gap in Patterson is 35.9%.
Women in Patterson earn 64.1 cents for every dollar earned by a man.
What is Family Income Deficit in Patterson?
Family Income Deficit in Patterson is $8,361.
Families that are below poverty line in Patterson earn $8,361 less on average than the poverty threshold level.
What is Inequality or Gini Index in Patterson?
Inequality or Gini Index in Patterson is 0.38.
What is the Total Population of Patterson?
Total Population of Patterson is 23,678.
What is the Total Male Population of Patterson?
Total Male Population of Patterson is 12,201.
What is the Total Female Population of Patterson?
Total Female Population of Patterson is 11,477.
What is the Ratio of Males per 100 Females in Patterson?
There are 106.31 Males per 100 Females in Patterson.
What is the Ratio of Females per 100 Males in Patterson?
There are 94.07 Females per 100 Males in Patterson.
What is the Median Population Age in Patterson?
Median Population Age in Patterson is 30.4 Years.
What is the Average Family Size in Patterson
Average Family Size in Patterson is 4.1 People.
What is the Average Household Size in Patterson
Average Household Size in Patterson is 3.7 People.
How Large is the Labor Force in Patterson?
There are 10,986 People in the Labor Forcein in Patterson.
What is the Percentage of People in the Labor Force in Patterson?
64.3% of People are in the Labor Force in Patterson.
What is the Unemployment Rate in Patterson?
Unemployment Rate in Patterson is 7.4%.