Summerland, CA Map & Demographics
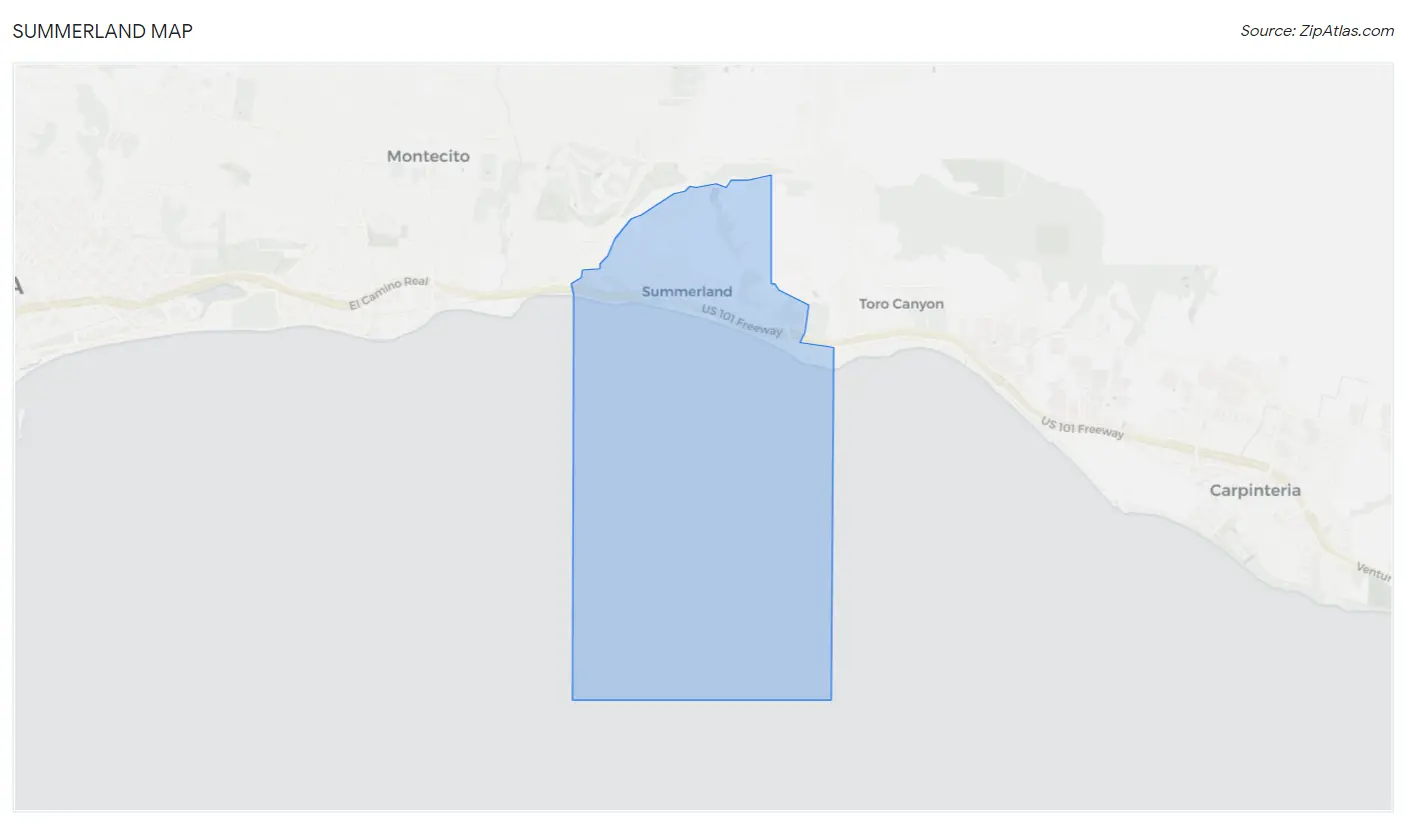
Summerland Map
Summerland Overview
$78,083
PER CAPITA INCOME
$179,107
AVG FAMILY INCOME
$128,311
AVG HOUSEHOLD INCOME
0.49
INEQUALITY / GINI INDEX
1,274
TOTAL POPULATION
778
MALE POPULATION
496
FEMALE POPULATION
156.85
MALES / 100 FEMALES
63.75
FEMALES / 100 MALES
53.4
MEDIAN AGE
2.7
AVG FAMILY SIZE
2.2
AVG HOUSEHOLD SIZE
560
LABOR FORCE [ PEOPLE ]
53.9%
PERCENT IN LABOR FORCE
12.3%
UNEMPLOYMENT RATE
Summerland Zip Codes
Income in Summerland
Income Overview in Summerland
Per Capita Income in Summerland is $78,083, while median incomes of families and households are $179,107 and $128,311 respectively.
| Characteristic | Number | Measure |
| Per Capita Income | 1,274 | $78,083 |
| Median Family Income | 351 | $179,107 |
| Mean Family Income | 351 | $239,252 |
| Median Household Income | 568 | $128,311 |
| Mean Household Income | 568 | $173,990 |
| Income Deficit | 351 | $0 |
| Wage / Income Gap (%) | 1,274 | 0.00% |
| Wage / Income Gap ($) | 1,274 | 100.00¢ per $1 |
| Gini / Inequality Index | 1,274 | 0.49 |
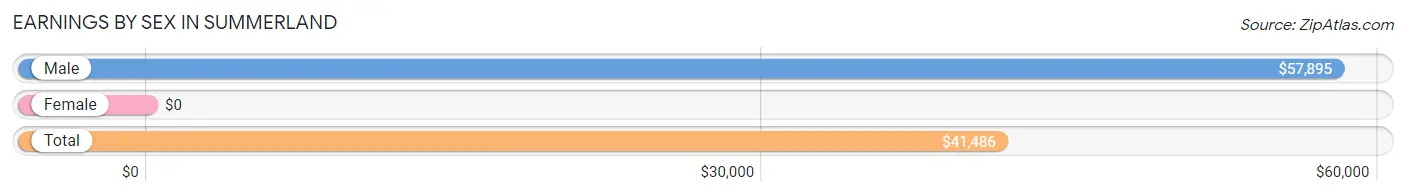
Earnings by Sex in Summerland
| Sex | Number | Average Earnings |
| Male | 438 (84.6%) | $57,895 |
| Female | 80 (15.4%) | $0 |
| Total | 518 (100.0%) | $41,486 |
Earnings by Sex by Income Bracket in Summerland
The most common earnings brackets in Summerland are $100,000+ for men (106 | 24.2%) and $2,500 to $4,999 for women (34 | 42.5%).

| Income | Male | Female |
| $2,499 or less | 0 (0.0%) | 0 (0.0%) |
| $2,500 to $4,999 | 59 (13.5%) | 34 (42.5%) |
| $5,000 to $7,499 | 0 (0.0%) | 0 (0.0%) |
| $7,500 to $9,999 | 0 (0.0%) | 0 (0.0%) |
| $10,000 to $12,499 | 0 (0.0%) | 0 (0.0%) |
| $12,500 to $14,999 | 28 (6.4%) | 0 (0.0%) |
| $15,000 to $17,499 | 0 (0.0%) | 0 (0.0%) |
| $17,500 to $19,999 | 0 (0.0%) | 0 (0.0%) |
| $20,000 to $22,499 | 0 (0.0%) | 0 (0.0%) |
| $22,500 to $24,999 | 0 (0.0%) | 0 (0.0%) |
| $25,000 to $29,999 | 27 (6.2%) | 0 (0.0%) |
| $30,000 to $34,999 | 59 (13.5%) | 0 (0.0%) |
| $35,000 to $39,999 | 0 (0.0%) | 30 (37.5%) |
| $40,000 to $44,999 | 37 (8.5%) | 0 (0.0%) |
| $45,000 to $49,999 | 0 (0.0%) | 0 (0.0%) |
| $50,000 to $54,999 | 0 (0.0%) | 0 (0.0%) |
| $55,000 to $64,999 | 85 (19.4%) | 12 (15.0%) |
| $65,000 to $74,999 | 0 (0.0%) | 0 (0.0%) |
| $75,000 to $99,999 | 37 (8.5%) | 0 (0.0%) |
| $100,000+ | 106 (24.2%) | 4 (5.0%) |
| Total | 438 (100.0%) | 80 (100.0%) |
Earnings by Sex by Educational Attainment in Summerland
| Educational Attainment | Male Income | Female Income |
| Less than High School | - | - |
| High School Diploma | - | - |
| College or Associate's Degree | - | - |
| Bachelor's Degree | - | - |
| Graduate Degree | - | - |
| Total | $59,189 | $0 |
Family Income in Summerland
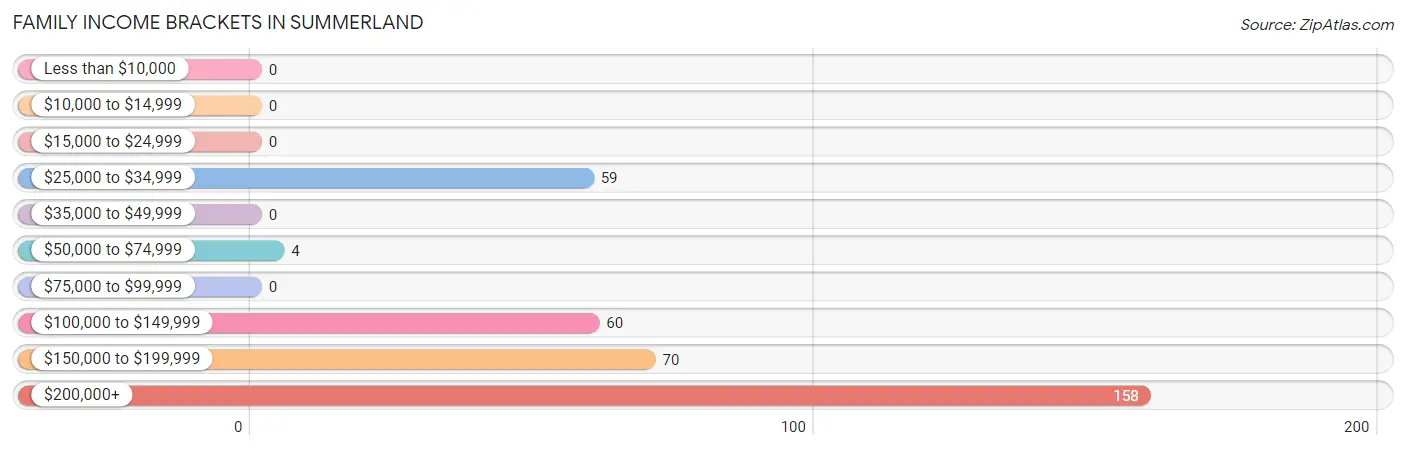
Family Income Brackets in Summerland
According to the Summerland family income data, there are 158 families falling into the $200,000+ income range, which is the most common income bracket and makes up 45.0% of all families.
| Income Bracket | # Families | % Families |
| Less than $10,000 | 0 | 0.0% |
| $10,000 to $14,999 | 0 | 0.0% |
| $15,000 to $24,999 | 0 | 0.0% |
| $25,000 to $34,999 | 59 | 16.8% |
| $35,000 to $49,999 | 0 | 0.0% |
| $50,000 to $74,999 | 4 | 1.1% |
| $75,000 to $99,999 | 0 | 0.0% |
| $100,000 to $149,999 | 60 | 17.1% |
| $150,000 to $199,999 | 70 | 19.9% |
| $200,000+ | 158 | 45.0% |
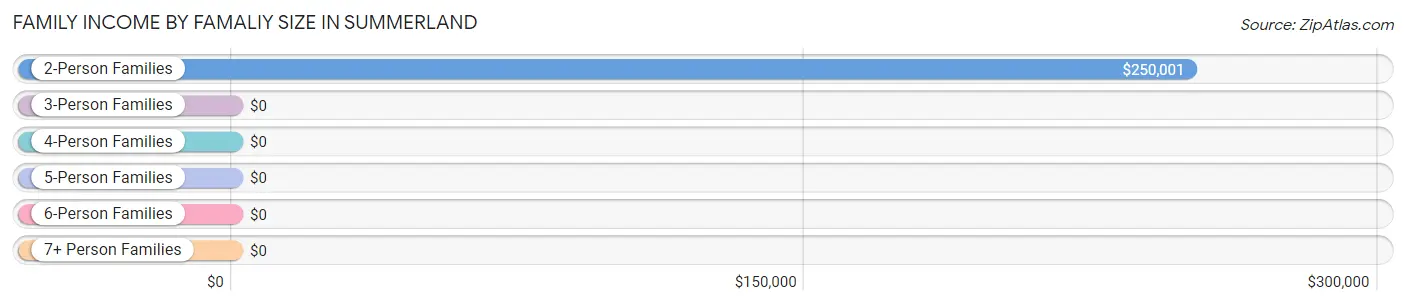
Family Income by Famaliy Size in Summerland
2-person families (193 | 55.0%) account for the highest median family income in Summerland with $250,001 per family, while 2-person families (193 | 55.0%) have the highest median income of $125,000 per family member.
| Income Bracket | # Families | Median Income |
| 2-Person Families | 193 (55.0%) | $250,001 |
| 3-Person Families | 72 (20.5%) | $0 |
| 4-Person Families | 86 (24.5%) | $0 |
| 5-Person Families | 0 (0.0%) | $0 |
| 6-Person Families | 0 (0.0%) | $0 |
| 7+ Person Families | 0 (0.0%) | $0 |
| Total | 351 (100.0%) | $179,107 |
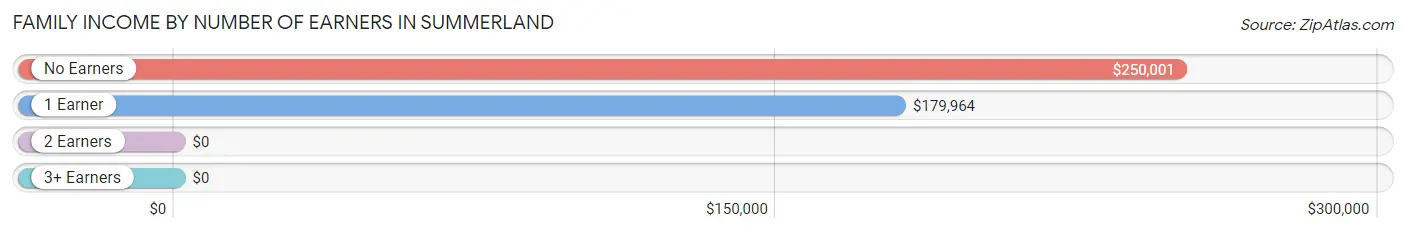
Family Income by Number of Earners in Summerland
| Number of Earners | # Families | Median Income |
| No Earners | 110 (31.3%) | $250,001 |
| 1 Earner | 129 (36.7%) | $179,964 |
| 2 Earners | 112 (31.9%) | $0 |
| 3+ Earners | 0 (0.0%) | $0 |
| Total | 351 (100.0%) | $179,107 |
Household Income in Summerland
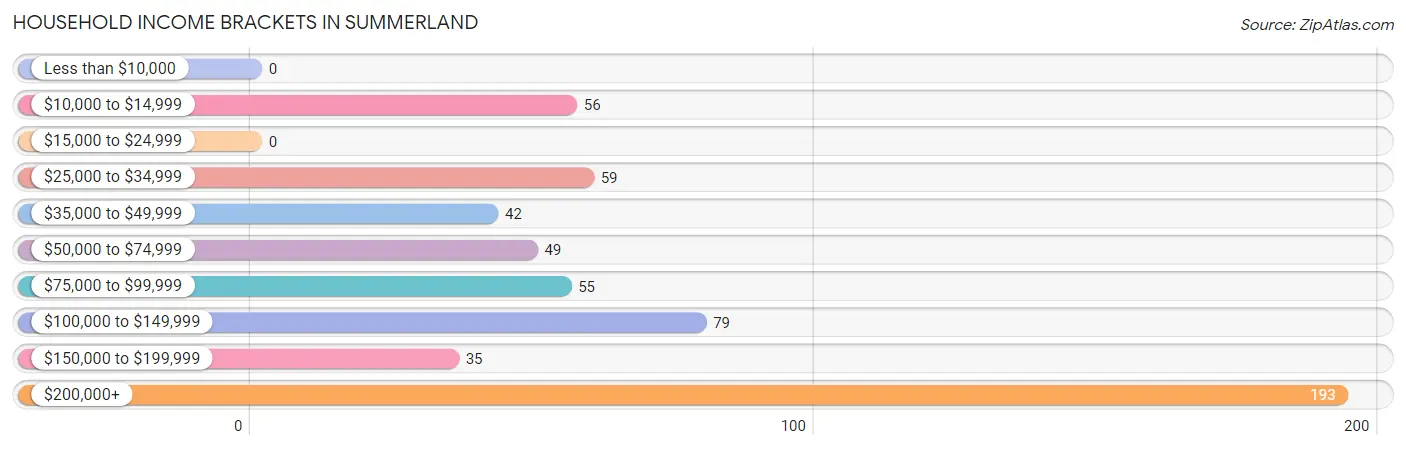
Household Income Brackets in Summerland
With 193 households falling in the category, the $200,000+ income range is the most frequent in Summerland, accounting for 34.0% of all households.
| Income Bracket | # Households | % Households |
| Less than $10,000 | 0 | 0.0% |
| $10,000 to $14,999 | 56 | 9.9% |
| $15,000 to $24,999 | 0 | 0.0% |
| $25,000 to $34,999 | 59 | 10.4% |
| $35,000 to $49,999 | 42 | 7.4% |
| $50,000 to $74,999 | 49 | 8.6% |
| $75,000 to $99,999 | 55 | 9.7% |
| $100,000 to $149,999 | 79 | 13.9% |
| $150,000 to $199,999 | 35 | 6.2% |
| $200,000+ | 193 | 34.0% |
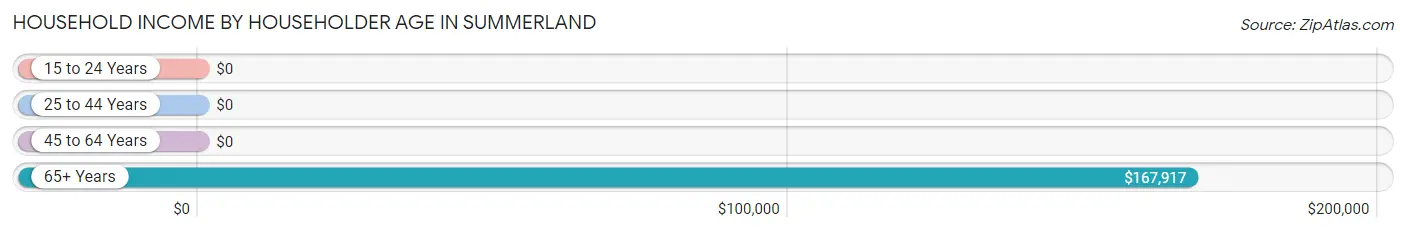
Household Income by Householder Age in Summerland
The median household income in Summerland is $128,311, with the highest median household income of $167,917 found in the 65+ years age bracket for the primary householder. A total of 248 households (43.7%) fall into this category.
| Income Bracket | # Households | Median Income |
| 15 to 24 Years | 0 (0.0%) | $0 |
| 25 to 44 Years | 72 (12.7%) | $0 |
| 45 to 64 Years | 248 (43.7%) | $0 |
| 65+ Years | 248 (43.7%) | $167,917 |
| Total | 568 (100.0%) | $128,311 |
Poverty in Summerland
Income Below Poverty by Sex and Age in Summerland
With 7.2% poverty level for males and 6.9% for females among the residents of Summerland, 75 year old and over males and 45 to 54 year old females are the most vulnerable to poverty, with 56 males (43.8%) and 34 females (26.2%) in their respective age groups living below the poverty level.
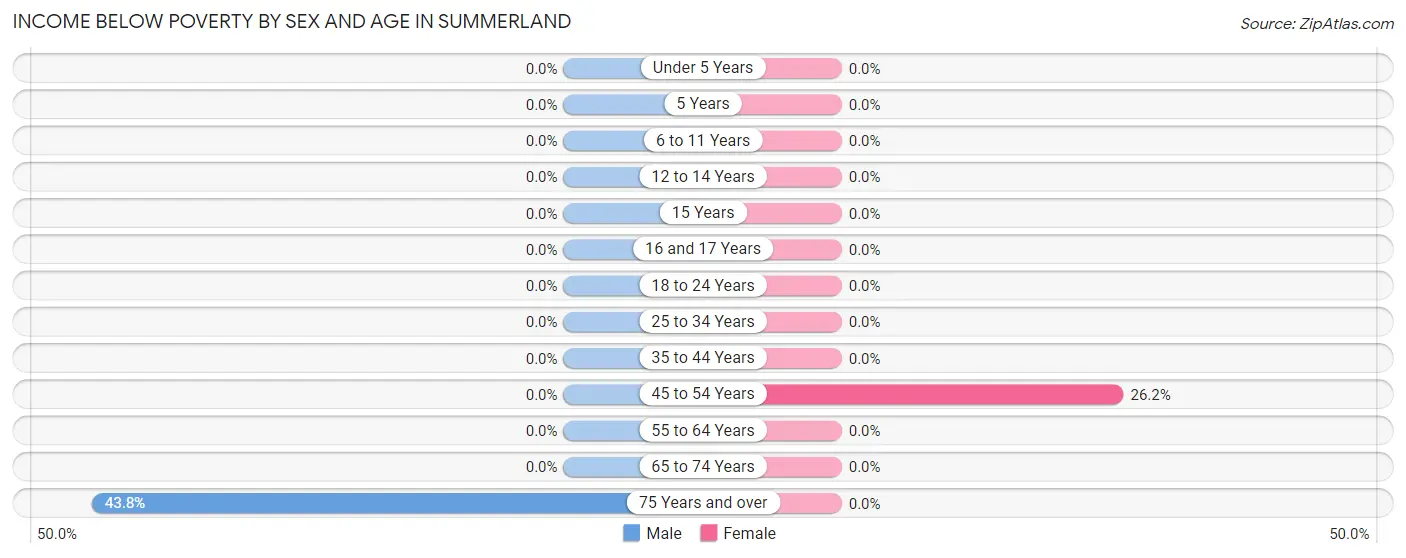
| Age Bracket | Male | Female |
| Under 5 Years | 0 (0.0%) | 0 (0.0%) |
| 5 Years | 0 (0.0%) | 0 (0.0%) |
| 6 to 11 Years | 0 (0.0%) | 0 (0.0%) |
| 12 to 14 Years | 0 (0.0%) | 0 (0.0%) |
| 15 Years | 0 (0.0%) | 0 (0.0%) |
| 16 and 17 Years | 0 (0.0%) | 0 (0.0%) |
| 18 to 24 Years | 0 (0.0%) | 0 (0.0%) |
| 25 to 34 Years | 0 (0.0%) | 0 (0.0%) |
| 35 to 44 Years | 0 (0.0%) | 0 (0.0%) |
| 45 to 54 Years | 0 (0.0%) | 34 (26.2%) |
| 55 to 64 Years | 0 (0.0%) | 0 (0.0%) |
| 65 to 74 Years | 0 (0.0%) | 0 (0.0%) |
| 75 Years and over | 56 (43.8%) | 0 (0.0%) |
| Total | 56 (7.2%) | 34 (6.9%) |
Income Above Poverty by Sex and Age in Summerland
According to the poverty statistics in Summerland, males aged under 5 years and females aged under 5 years are the age groups that are most secure financially, with 100.0% of males and 100.0% of females in these age groups living above the poverty line.
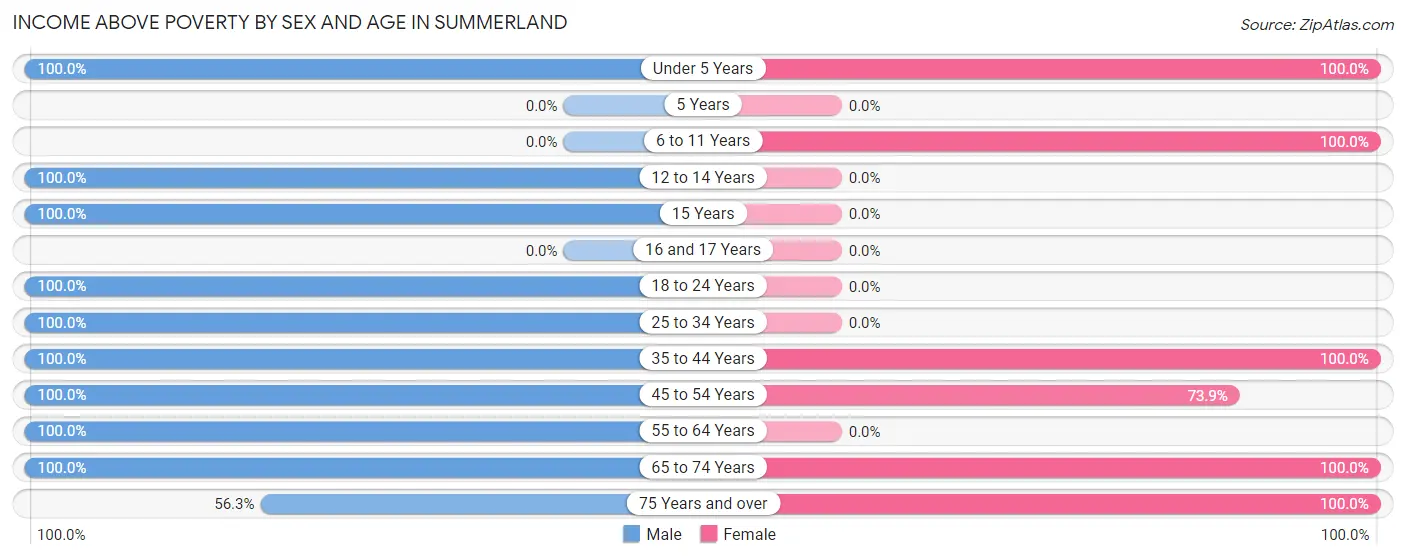
| Age Bracket | Male | Female |
| Under 5 Years | 41 (100.0%) | 73 (100.0%) |
| 5 Years | 0 (0.0%) | 0 (0.0%) |
| 6 to 11 Years | 0 (0.0%) | 31 (100.0%) |
| 12 to 14 Years | 30 (100.0%) | 0 (0.0%) |
| 15 Years | 60 (100.0%) | 0 (0.0%) |
| 16 and 17 Years | 0 (0.0%) | 0 (0.0%) |
| 18 to 24 Years | 59 (100.0%) | 0 (0.0%) |
| 25 to 34 Years | 45 (100.0%) | 0 (0.0%) |
| 35 to 44 Years | 58 (100.0%) | 27 (100.0%) |
| 45 to 54 Years | 161 (100.0%) | 96 (73.9%) |
| 55 to 64 Years | 141 (100.0%) | 0 (0.0%) |
| 65 to 74 Years | 55 (100.0%) | 108 (100.0%) |
| 75 Years and over | 72 (56.2%) | 127 (100.0%) |
| Total | 722 (92.8%) | 462 (93.1%) |
Income Below Poverty Among Married-Couple Families in Summerland
| Children | Above Poverty | Below Poverty |
| No Children | 152 (100.0%) | 0 (0.0%) |
| 1 or 2 Children | 123 (100.0%) | 0 (0.0%) |
| 3 or 4 Children | 0 (0.0%) | 0 (0.0%) |
| 5 or more Children | 0 (0.0%) | 0 (0.0%) |
| Total | 275 (100.0%) | 0 (0.0%) |
Income Below Poverty Among Single-Parent Households in Summerland
| Children | Single Father | Single Mother |
| No Children | 0 (0.0%) | 0 (0.0%) |
| 1 or 2 Children | 0 (0.0%) | 0 (0.0%) |
| 3 or 4 Children | 0 (0.0%) | 0 (0.0%) |
| 5 or more Children | 0 (0.0%) | 0 (0.0%) |
| Total | 0 (0.0%) | 0 (0.0%) |
Income Below Poverty Among Married-Couple vs Single-Parent Households in Summerland
| Children | Married-Couple Families | Single-Parent Households |
| No Children | 0 (0.0%) | 0 (0.0%) |
| 1 or 2 Children | 0 (0.0%) | 0 (0.0%) |
| 3 or 4 Children | 0 (0.0%) | 0 (0.0%) |
| 5 or more Children | 0 (0.0%) | 0 (0.0%) |
| Total | 0 (0.0%) | 0 (0.0%) |
Race in Summerland
The most populous races in Summerland are White / Caucasian (780 | 61.2%), Hispanic or Latino (314 | 24.6%), and Two or more Races (249 | 19.5%).
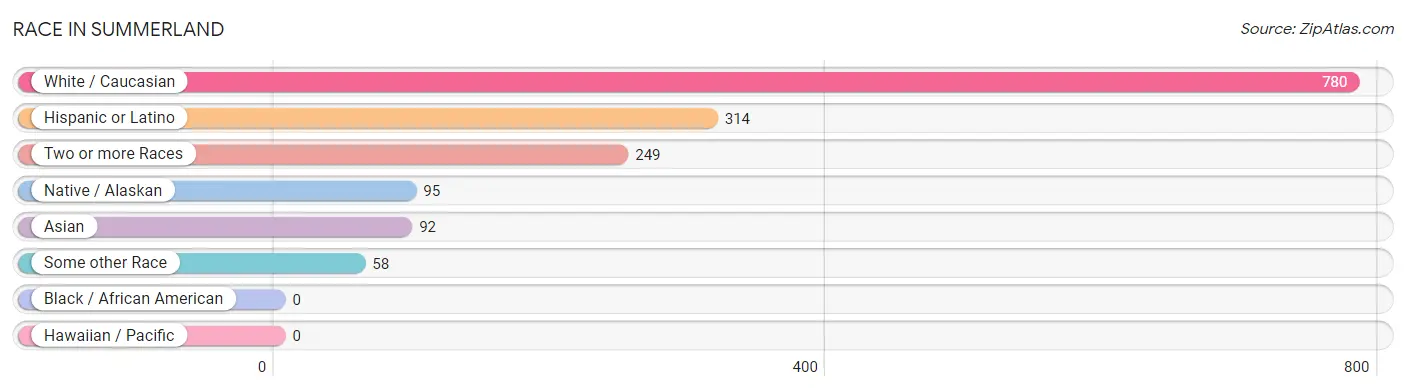
| Race | # Population | % Population |
| Asian | 92 | 7.2% |
| Black / African American | 0 | 0.0% |
| Hawaiian / Pacific | 0 | 0.0% |
| Hispanic or Latino | 314 | 24.6% |
| Native / Alaskan | 95 | 7.5% |
| White / Caucasian | 780 | 61.2% |
| Two or more Races | 249 | 19.5% |
| Some other Race | 58 | 4.5% |
| Total | 1,274 | 100.0% |
Ancestry in Summerland
The most populous ancestries reported in Summerland are Irish (306 | 24.0%), Central American (174 | 13.7%), Honduran (174 | 13.7%), German (169 | 13.3%), and Italian (161 | 12.6%), together accounting for 77.3% of all Summerland residents.
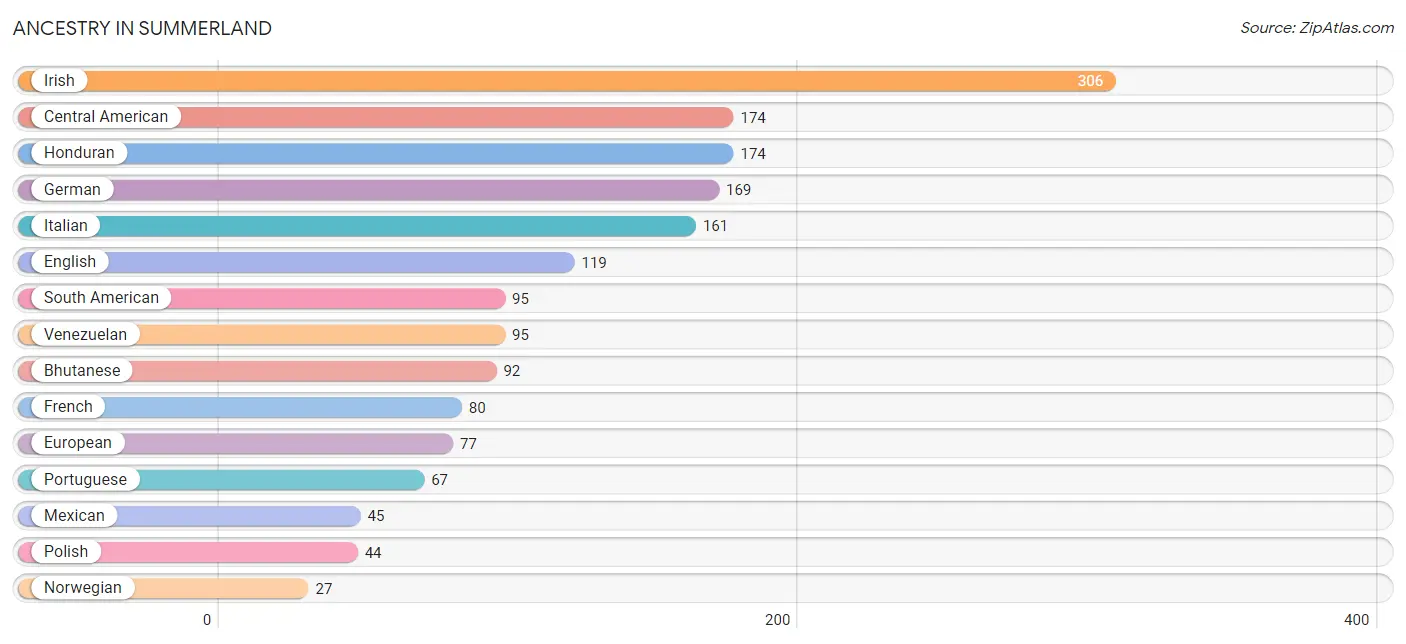
| Ancestry | # Population | % Population |
| American | 18 | 1.4% |
| Bhutanese | 92 | 7.2% |
| Central American | 174 | 13.7% |
| Czech | 19 | 1.5% |
| Eastern European | 11 | 0.9% |
| English | 119 | 9.3% |
| European | 77 | 6.0% |
| French | 80 | 6.3% |
| German | 169 | 13.3% |
| Honduran | 174 | 13.7% |
| Hungarian | 9 | 0.7% |
| Irish | 306 | 24.0% |
| Italian | 161 | 12.6% |
| Mexican | 45 | 3.5% |
| Norwegian | 27 | 2.1% |
| Polish | 44 | 3.5% |
| Portuguese | 67 | 5.3% |
| Scotch-Irish | 5 | 0.4% |
| Scottish | 13 | 1.0% |
| South American | 95 | 7.5% |
| Swedish | 4 | 0.3% |
| Venezuelan | 95 | 7.5% | View All 22 Rows |
Immigrants in Summerland
The most numerous immigrant groups reported in Summerland came from Latin America (27 | 2.1%), South America (27 | 2.1%), Venezuela (27 | 2.1%), Australia (24 | 1.9%), and Oceania (24 | 1.9%), together accounting for 10.1% of all Summerland residents.
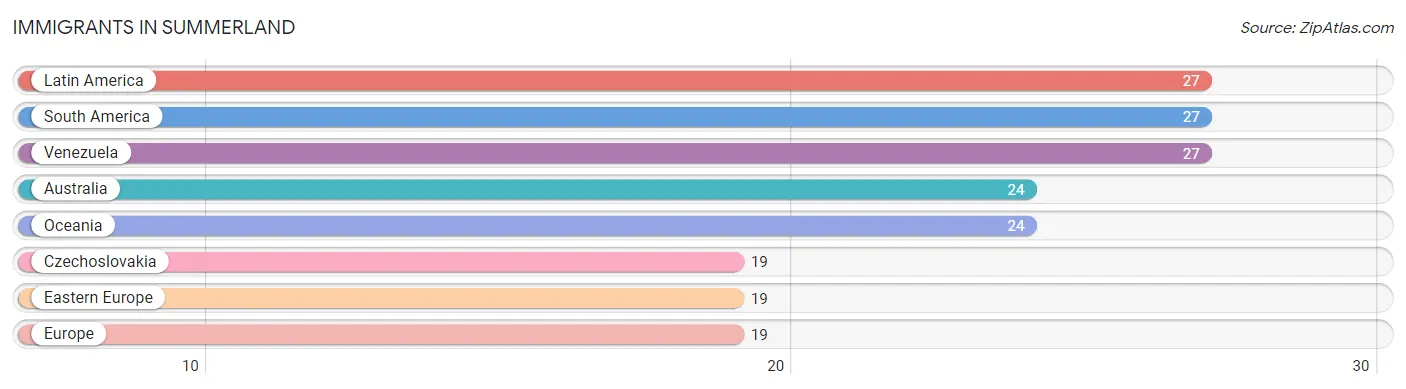
| Immigration Origin | # Population | % Population |
| Australia | 24 | 1.9% |
| Czechoslovakia | 19 | 1.5% |
| Eastern Europe | 19 | 1.5% |
| Europe | 19 | 1.5% |
| Latin America | 27 | 2.1% |
| Oceania | 24 | 1.9% |
| South America | 27 | 2.1% |
| Venezuela | 27 | 2.1% | View All 8 Rows |
Sex and Age in Summerland
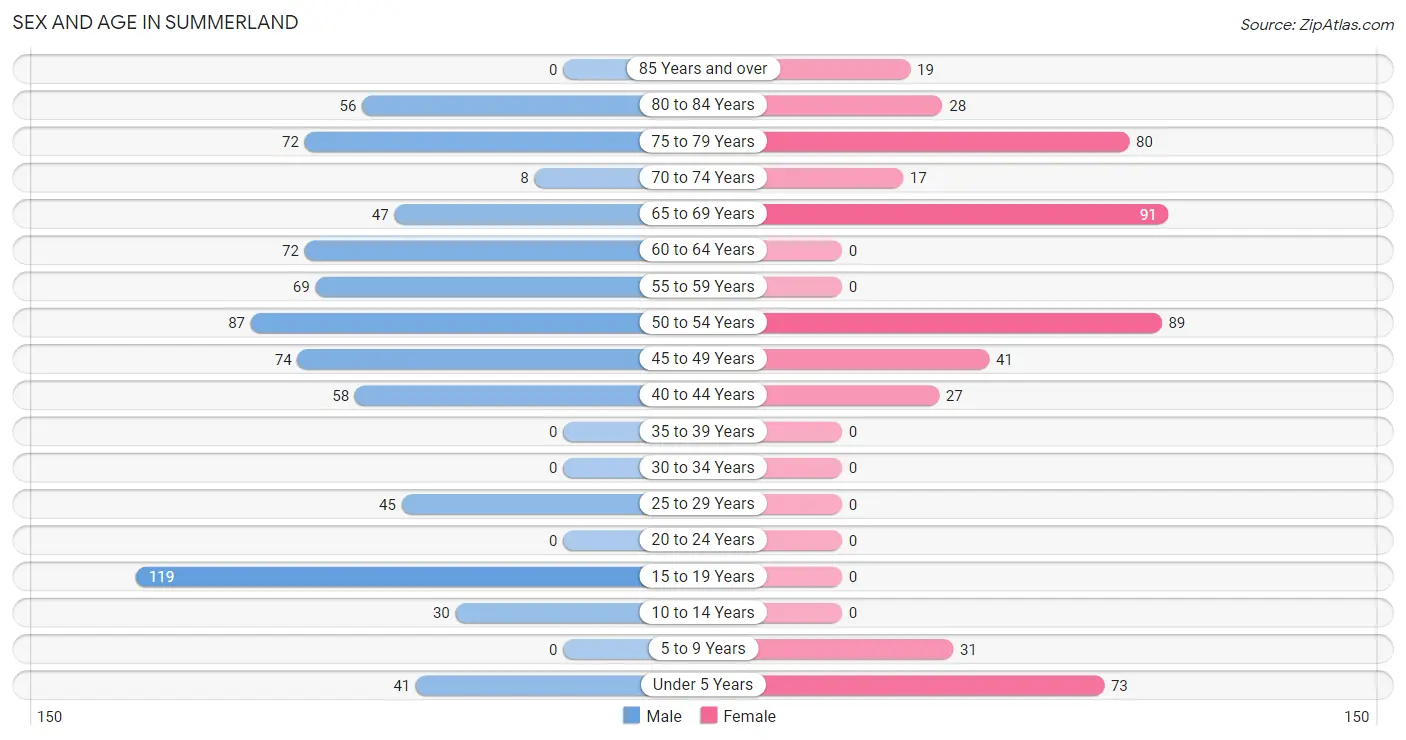
Sex and Age in Summerland
The most populous age groups in Summerland are 15 to 19 Years (119 | 15.3%) for men and 65 to 69 Years (91 | 18.3%) for women.
| Age Bracket | Male | Female |
| Under 5 Years | 41 (5.3%) | 73 (14.7%) |
| 5 to 9 Years | 0 (0.0%) | 31 (6.2%) |
| 10 to 14 Years | 30 (3.9%) | 0 (0.0%) |
| 15 to 19 Years | 119 (15.3%) | 0 (0.0%) |
| 20 to 24 Years | 0 (0.0%) | 0 (0.0%) |
| 25 to 29 Years | 45 (5.8%) | 0 (0.0%) |
| 30 to 34 Years | 0 (0.0%) | 0 (0.0%) |
| 35 to 39 Years | 0 (0.0%) | 0 (0.0%) |
| 40 to 44 Years | 58 (7.5%) | 27 (5.4%) |
| 45 to 49 Years | 74 (9.5%) | 41 (8.3%) |
| 50 to 54 Years | 87 (11.2%) | 89 (17.9%) |
| 55 to 59 Years | 69 (8.9%) | 0 (0.0%) |
| 60 to 64 Years | 72 (9.2%) | 0 (0.0%) |
| 65 to 69 Years | 47 (6.0%) | 91 (18.3%) |
| 70 to 74 Years | 8 (1.0%) | 17 (3.4%) |
| 75 to 79 Years | 72 (9.2%) | 80 (16.1%) |
| 80 to 84 Years | 56 (7.2%) | 28 (5.7%) |
| 85 Years and over | 0 (0.0%) | 19 (3.8%) |
| Total | 778 (100.0%) | 496 (100.0%) |
Families and Households in Summerland
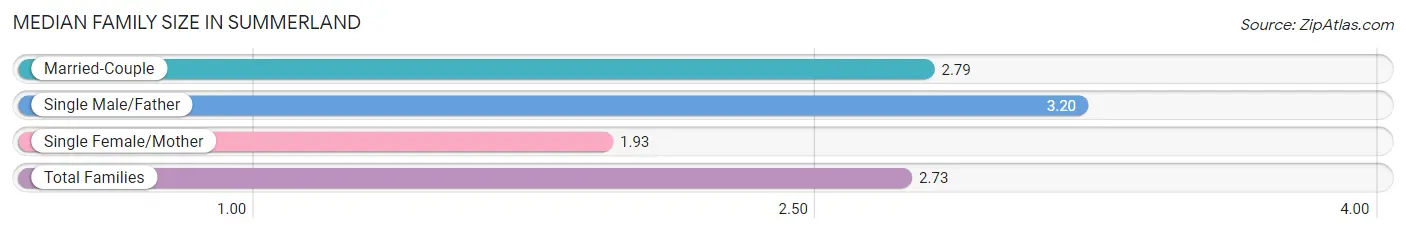
Median Family Size in Summerland
The median family size in Summerland is 2.73 persons per family, with single male/father families (35 | 10.0%) accounting for the largest median family size of 3.2 persons per family. On the other hand, single female/mother families (41 | 11.7%) represent the smallest median family size with 1.93 persons per family.
| Family Type | # Families | Family Size |
| Married-Couple | 275 (78.3%) | 2.79 |
| Single Male/Father | 35 (10.0%) | 3.20 |
| Single Female/Mother | 41 (11.7%) | 1.93 |
| Total Families | 351 (100.0%) | 2.73 |
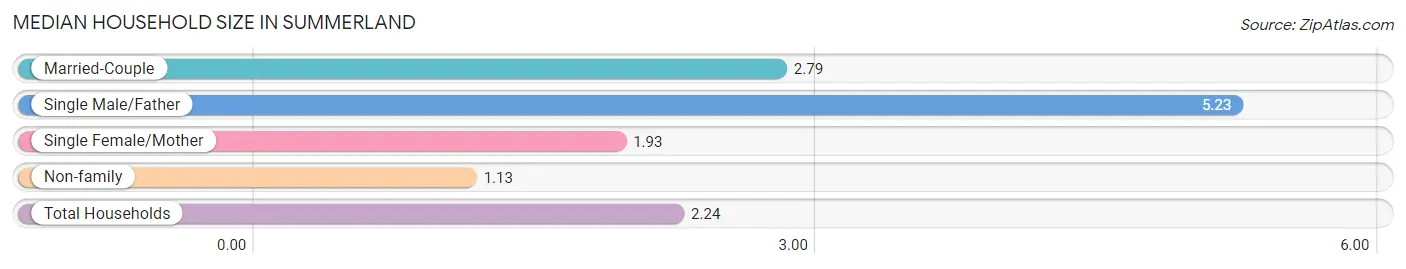
Median Household Size in Summerland
The median household size in Summerland is 2.24 persons per household, with single male/father households (35 | 6.2%) accounting for the largest median household size of 5.23 persons per household. non-family households (217 | 38.2%) represent the smallest median household size with 1.13 persons per household.
| Household Type | # Households | Household Size |
| Married-Couple | 275 (48.4%) | 2.79 |
| Single Male/Father | 35 (6.2%) | 5.23 |
| Single Female/Mother | 41 (7.2%) | 1.93 |
| Non-family | 217 (38.2%) | 1.13 |
| Total Households | 568 (100.0%) | 2.24 |
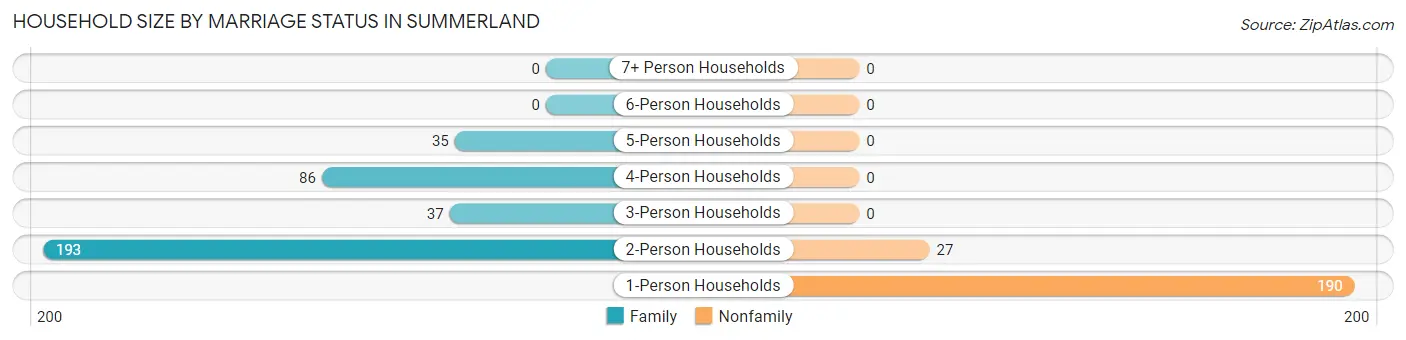
Household Size by Marriage Status in Summerland
Out of a total of 568 households in Summerland, 351 (61.8%) are family households, while 217 (38.2%) are nonfamily households. The most numerous type of family households are 2-person households, comprising 193, and the most common type of nonfamily households are 1-person households, comprising 190.
| Household Size | Family Households | Nonfamily Households |
| 1-Person Households | - | 190 (33.5%) |
| 2-Person Households | 193 (34.0%) | 27 (4.8%) |
| 3-Person Households | 37 (6.5%) | 0 (0.0%) |
| 4-Person Households | 86 (15.1%) | 0 (0.0%) |
| 5-Person Households | 35 (6.2%) | 0 (0.0%) |
| 6-Person Households | 0 (0.0%) | 0 (0.0%) |
| 7+ Person Households | 0 (0.0%) | 0 (0.0%) |
| Total | 351 (61.8%) | 217 (38.2%) |
Female Fertility in Summerland
Fertility by Age in Summerland
| Age Bracket | Women with Births | Births / 1,000 Women |
| 15 to 19 years | 0 (0.0%) | 0.0 |
| 20 to 34 years | 0 (0.0%) | 0.0 |
| 35 to 50 years | 0 (0.0%) | 0.0 |
| Total | 0 (0.0%) | 0.0 |
Fertility by Age by Marriage Status in Summerland
| Age Bracket | Married | Unmarried |
| 15 to 19 years | 0 (0.0%) | 0 (0.0%) |
| 20 to 34 years | 0 (0.0%) | 0 (0.0%) |
| 35 to 50 years | 0 (0.0%) | 0 (0.0%) |
| Total | 0 (0.0%) | 0 (0.0%) |
Fertility by Education in Summerland
| Educational Attainment | Women with Births | Births / 1,000 Women |
| Less than High School | 0 (0.0%) | 0.0 |
| High School Diploma | 0 (0.0%) | 0.0 |
| College or Associate's Degree | 0 (0.0%) | 0.0 |
| Bachelor's Degree | 0 (0.0%) | 0.0 |
| Graduate Degree | 0 (0.0%) | 0.0 |
| Total | 0 (0.0%) | 0.0 |
Fertility by Education by Marriage Status in Summerland
| Educational Attainment | Married | Unmarried |
| Less than High School | 0 (0.0%) | 0 (0.0%) |
| High School Diploma | 0 (0.0%) | 0 (0.0%) |
| College or Associate's Degree | 0 (0.0%) | 0 (0.0%) |
| Bachelor's Degree | 0 (0.0%) | 0 (0.0%) |
| Graduate Degree | 0 (0.0%) | 0 (0.0%) |
| Total | 0 (0.0%) | 0 (0.0%) |
Employment Characteristics in Summerland
Employment by Class of Employer in Summerland
Among the 461 employed individuals in Summerland, private company employees (233 | 50.5%), self-employed (not incorporated) (111 | 24.1%), and not-for-profit organizations (45 | 9.8%) make up the most common classes of employment.
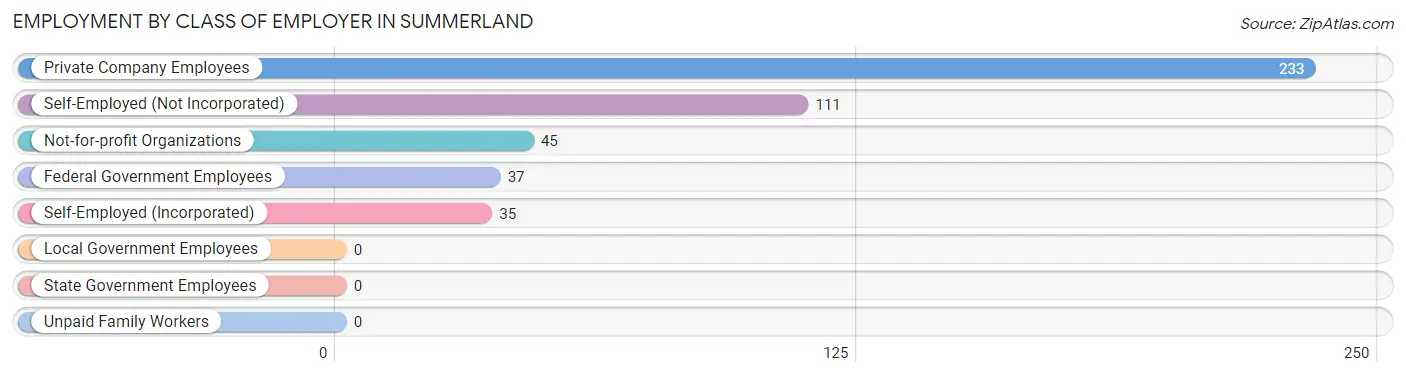
| Employer Class | # Employees | % Employees |
| Private Company Employees | 233 | 50.5% |
| Self-Employed (Incorporated) | 35 | 7.6% |
| Self-Employed (Not Incorporated) | 111 | 24.1% |
| Not-for-profit Organizations | 45 | 9.8% |
| Local Government Employees | 0 | 0.0% |
| State Government Employees | 0 | 0.0% |
| Federal Government Employees | 37 | 8.0% |
| Unpaid Family Workers | 0 | 0.0% |
| Total | 461 | 100.0% |
Employment Status by Age in Summerland
According to the labor force statistics for Summerland, out of the total population over 16 years of age (1,039), 53.9% or 560 individuals are in the labor force, with 12.3% or 69 of them unemployed. The age group with the highest labor force participation rate is 16 to 19 years, with 100.0% or 59 individuals in the labor force. Within the labor force, the 55 to 59 years age range has the highest percentage of unemployed individuals, with 100.0% or 69 of them being unemployed.
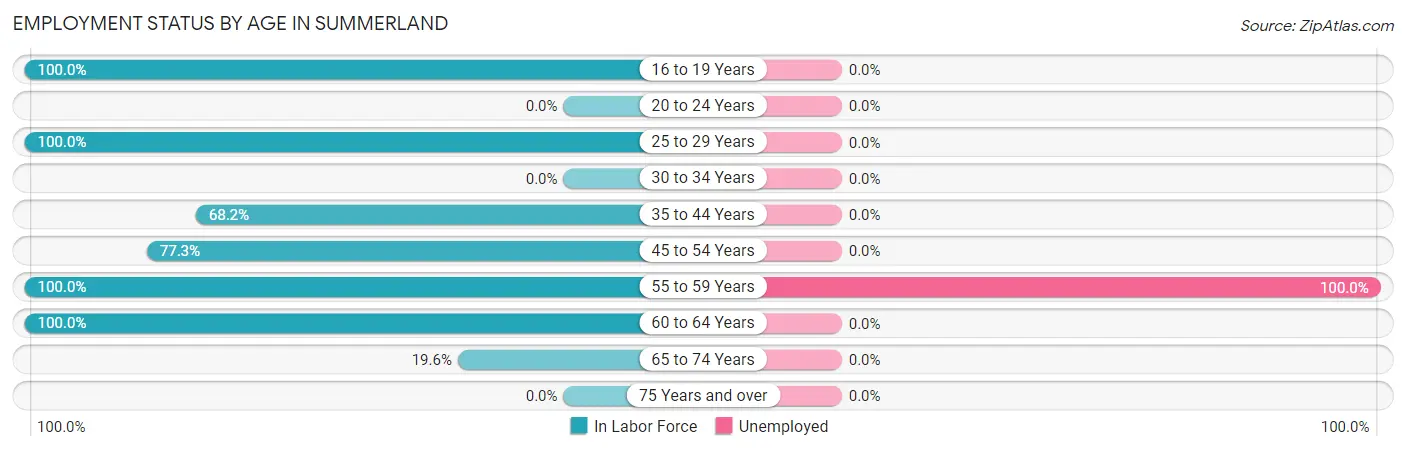
| Age Bracket | In Labor Force | Unemployed |
| 16 to 19 Years | 59 (100.0%) | 0 (0.0%) |
| 20 to 24 Years | 0 (0.0%) | 0 (0.0%) |
| 25 to 29 Years | 45 (100.0%) | 0 (0.0%) |
| 30 to 34 Years | 0 (0.0%) | 0 (0.0%) |
| 35 to 44 Years | 58 (68.2%) | 0 (0.0%) |
| 45 to 54 Years | 225 (77.3%) | 0 (0.0%) |
| 55 to 59 Years | 69 (100.0%) | 69 (100.0%) |
| 60 to 64 Years | 72 (100.0%) | 0 (0.0%) |
| 65 to 74 Years | 32 (19.6%) | 0 (0.0%) |
| 75 Years and over | 0 (0.0%) | 0 (0.0%) |
| Total | 560 (53.9%) | 69 (12.3%) |
Employment Status by Educational Attainment in Summerland
According to labor force statistics for Summerland, 83.5% of individuals (469) out of the total population between 25 and 64 years of age (562) are in the labor force, with 14.7% or 69 of them being unemployed. The group with the highest labor force participation rate are those with the educational attainment of less than high school, with 100.0% or 59 individuals in the labor force. Within the labor force, individuals with high school diploma education have the highest percentage of unemployment, with 37.2% or 42 of them being unemployed.
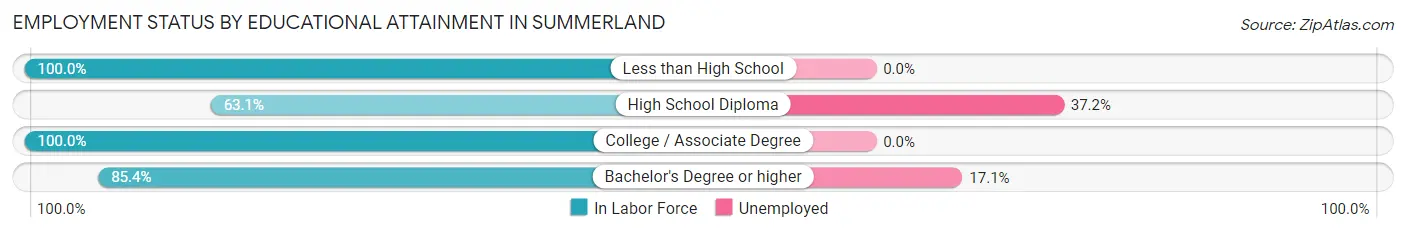
| Educational Attainment | In Labor Force | Unemployed |
| Less than High School | 59 (100.0%) | 0 (0.0%) |
| High School Diploma | 113 (63.1%) | 67 (37.2%) |
| College / Associate Degree | 139 (100.0%) | 0 (0.0%) |
| Bachelor's Degree or higher | 158 (85.4%) | 32 (17.1%) |
| Total | 469 (83.5%) | 83 (14.7%) |
Employment Occupations by Sex in Summerland
Management, Business, Science and Arts Occupations
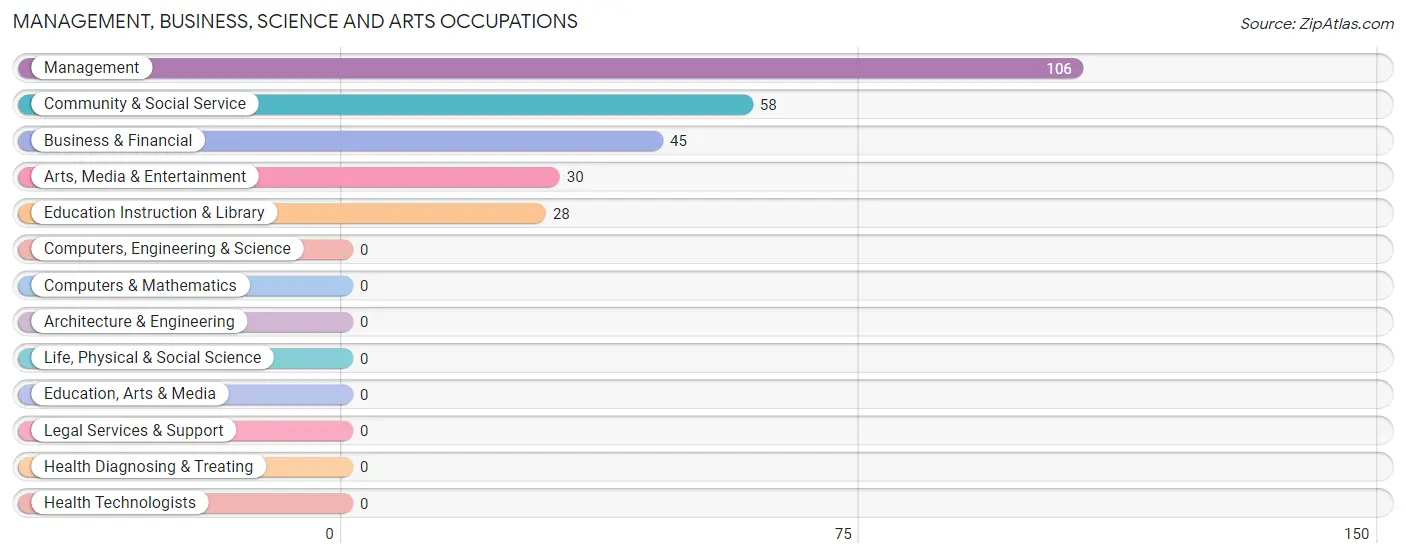
The most common Management, Business, Science and Arts occupations in Summerland are Management (106 | 21.6%), Community & Social Service (58 | 11.8%), Business & Financial (45 | 9.2%), Arts, Media & Entertainment (30 | 6.1%), and Education Instruction & Library (28 | 5.7%).
Management, Business, Science and Arts Occupations by Sex
Within the Management, Business, Science and Arts occupations in Summerland, the most male-oriented occupations are Management (100.0%), Business & Financial (100.0%), and Education Instruction & Library (100.0%), while the most female-oriented occupations are Arts, Media & Entertainment (100.0%), and Community & Social Service (51.7%).
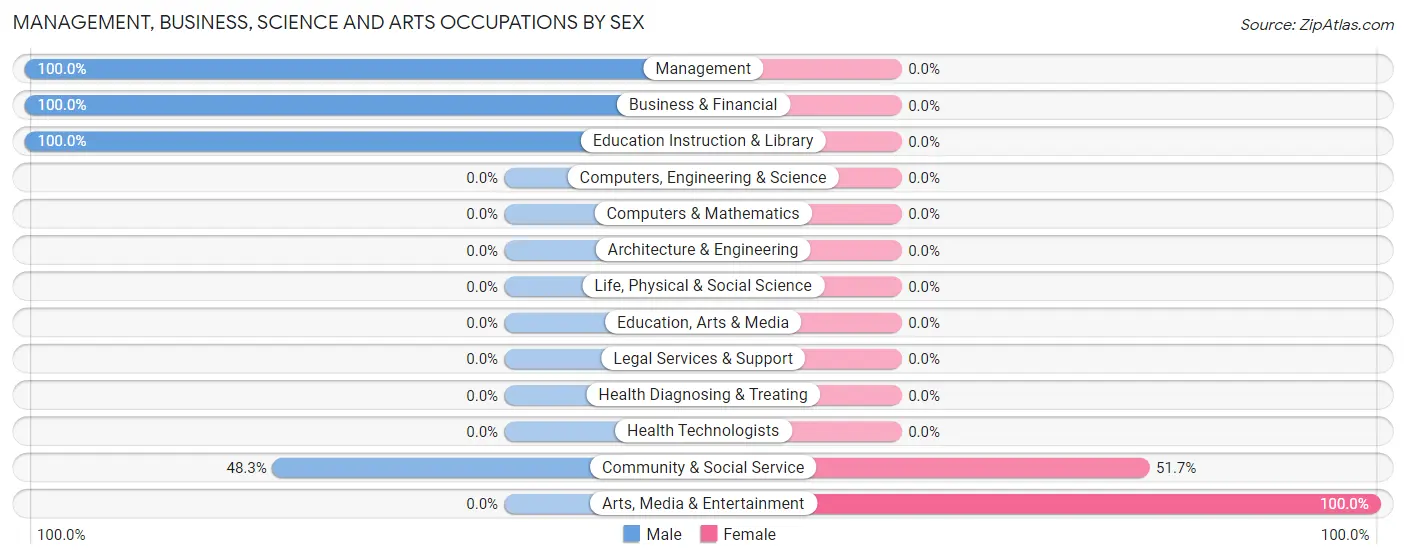
| Occupation | Male | Female |
| Management | 106 (100.0%) | 0 (0.0%) |
| Business & Financial | 45 (100.0%) | 0 (0.0%) |
| Computers, Engineering & Science | 0 (0.0%) | 0 (0.0%) |
| Computers & Mathematics | 0 (0.0%) | 0 (0.0%) |
| Architecture & Engineering | 0 (0.0%) | 0 (0.0%) |
| Life, Physical & Social Science | 0 (0.0%) | 0 (0.0%) |
| Community & Social Service | 28 (48.3%) | 30 (51.7%) |
| Education, Arts & Media | 0 (0.0%) | 0 (0.0%) |
| Legal Services & Support | 0 (0.0%) | 0 (0.0%) |
| Education Instruction & Library | 28 (100.0%) | 0 (0.0%) |
| Arts, Media & Entertainment | 0 (0.0%) | 30 (100.0%) |
| Health Diagnosing & Treating | 0 (0.0%) | 0 (0.0%) |
| Health Technologists | 0 (0.0%) | 0 (0.0%) |
| Total (Category) | 179 (85.7%) | 30 (14.3%) |
| Total (Overall) | 411 (83.7%) | 80 (16.3%) |
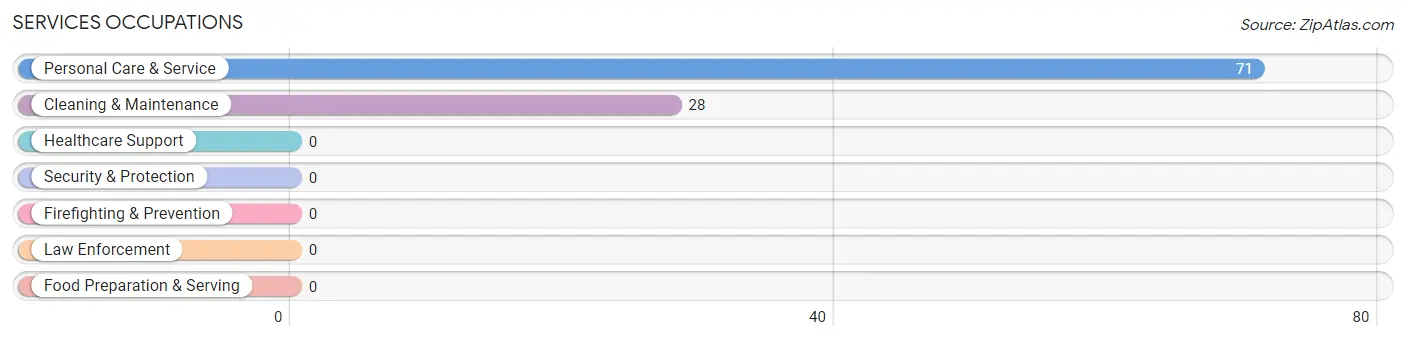
Services Occupations
The most common Services occupations in Summerland are Personal Care & Service (71 | 14.5%), and Cleaning & Maintenance (28 | 5.7%).
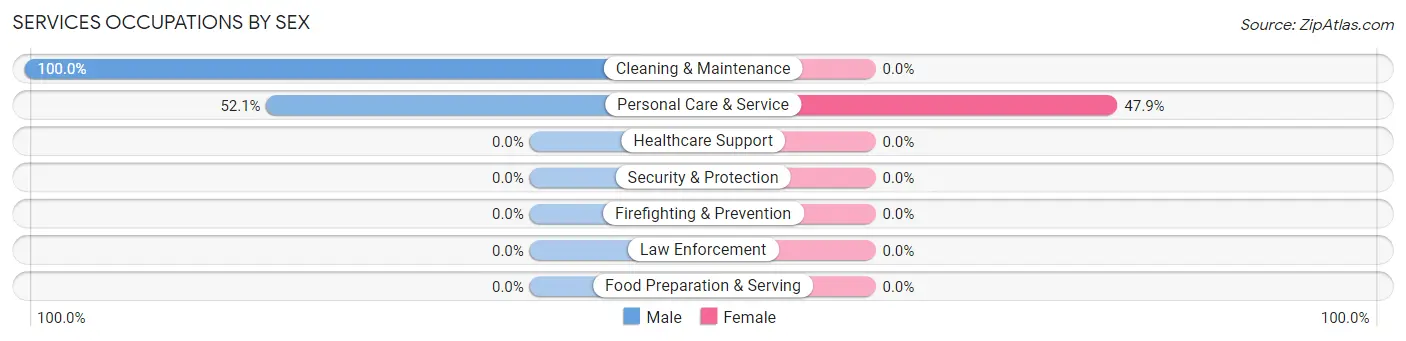
Services Occupations by Sex
| Occupation | Male | Female |
| Healthcare Support | 0 (0.0%) | 0 (0.0%) |
| Security & Protection | 0 (0.0%) | 0 (0.0%) |
| Firefighting & Prevention | 0 (0.0%) | 0 (0.0%) |
| Law Enforcement | 0 (0.0%) | 0 (0.0%) |
| Food Preparation & Serving | 0 (0.0%) | 0 (0.0%) |
| Cleaning & Maintenance | 28 (100.0%) | 0 (0.0%) |
| Personal Care & Service | 37 (52.1%) | 34 (47.9%) |
| Total (Category) | 65 (65.7%) | 34 (34.3%) |
| Total (Overall) | 411 (83.7%) | 80 (16.3%) |
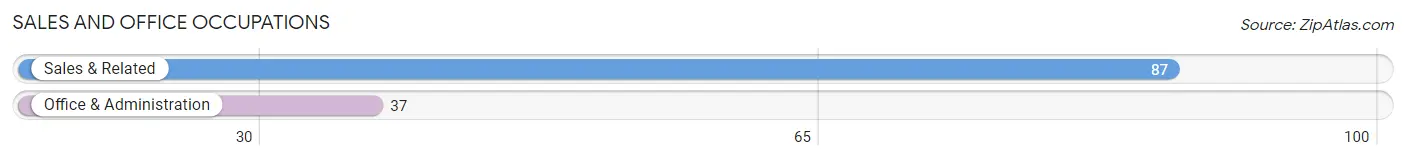
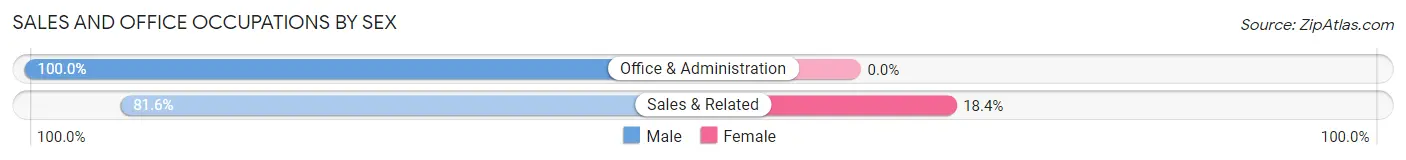
Sales and Office Occupations
The most common Sales and Office occupations in Summerland are Sales & Related (87 | 17.7%), and Office & Administration (37 | 7.5%).
Sales and Office Occupations by Sex
| Occupation | Male | Female |
| Sales & Related | 71 (81.6%) | 16 (18.4%) |
| Office & Administration | 37 (100.0%) | 0 (0.0%) |
| Total (Category) | 108 (87.1%) | 16 (12.9%) |
| Total (Overall) | 411 (83.7%) | 80 (16.3%) |
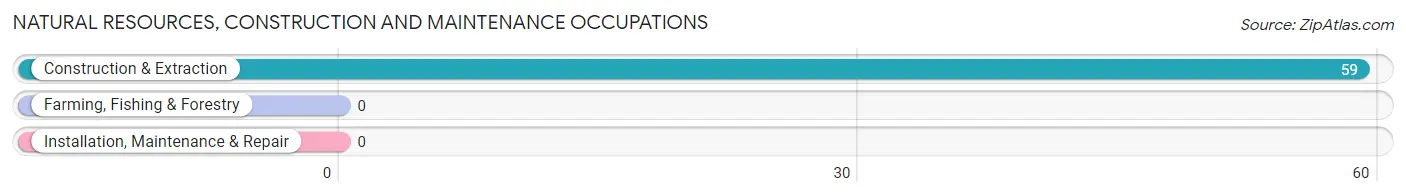
Natural Resources, Construction and Maintenance Occupations
The most common Natural Resources, Construction and Maintenance occupations in Summerland are , and Construction & Extraction (59 | 12.0%).
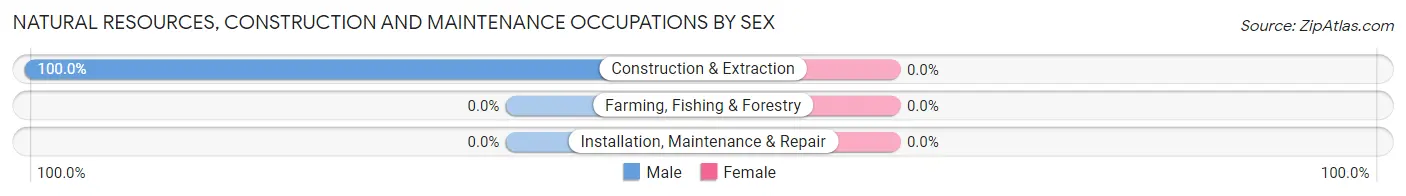
Natural Resources, Construction and Maintenance Occupations by Sex
| Occupation | Male | Female |
| Farming, Fishing & Forestry | 0 (0.0%) | 0 (0.0%) |
| Construction & Extraction | 59 (100.0%) | 0 (0.0%) |
| Installation, Maintenance & Repair | 0 (0.0%) | 0 (0.0%) |
| Total (Category) | 59 (100.0%) | 0 (0.0%) |
| Total (Overall) | 411 (83.7%) | 80 (16.3%) |
Production, Transportation and Moving Occupations
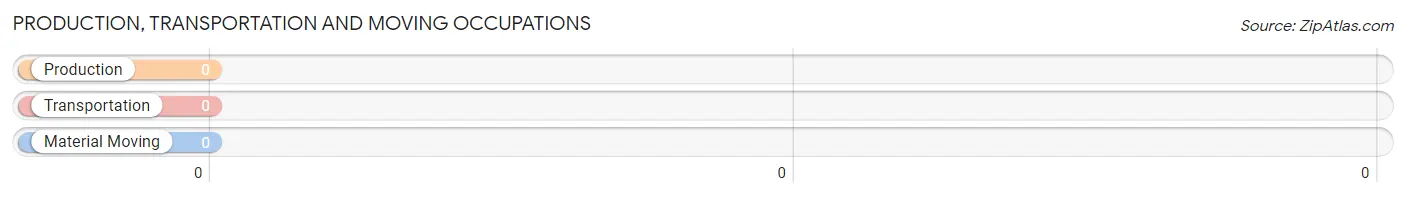
Production, Transportation and Moving Occupations by Sex
| Occupation | Male | Female |
| Production | 0 (0.0%) | 0 (0.0%) |
| Transportation | 0 (0.0%) | 0 (0.0%) |
| Material Moving | 0 (0.0%) | 0 (0.0%) |
| Total (Category) | 0 (0.0%) | 0 (0.0%) |
| Total (Overall) | 411 (83.7%) | 80 (16.3%) |
Employment Industries by Sex in Summerland
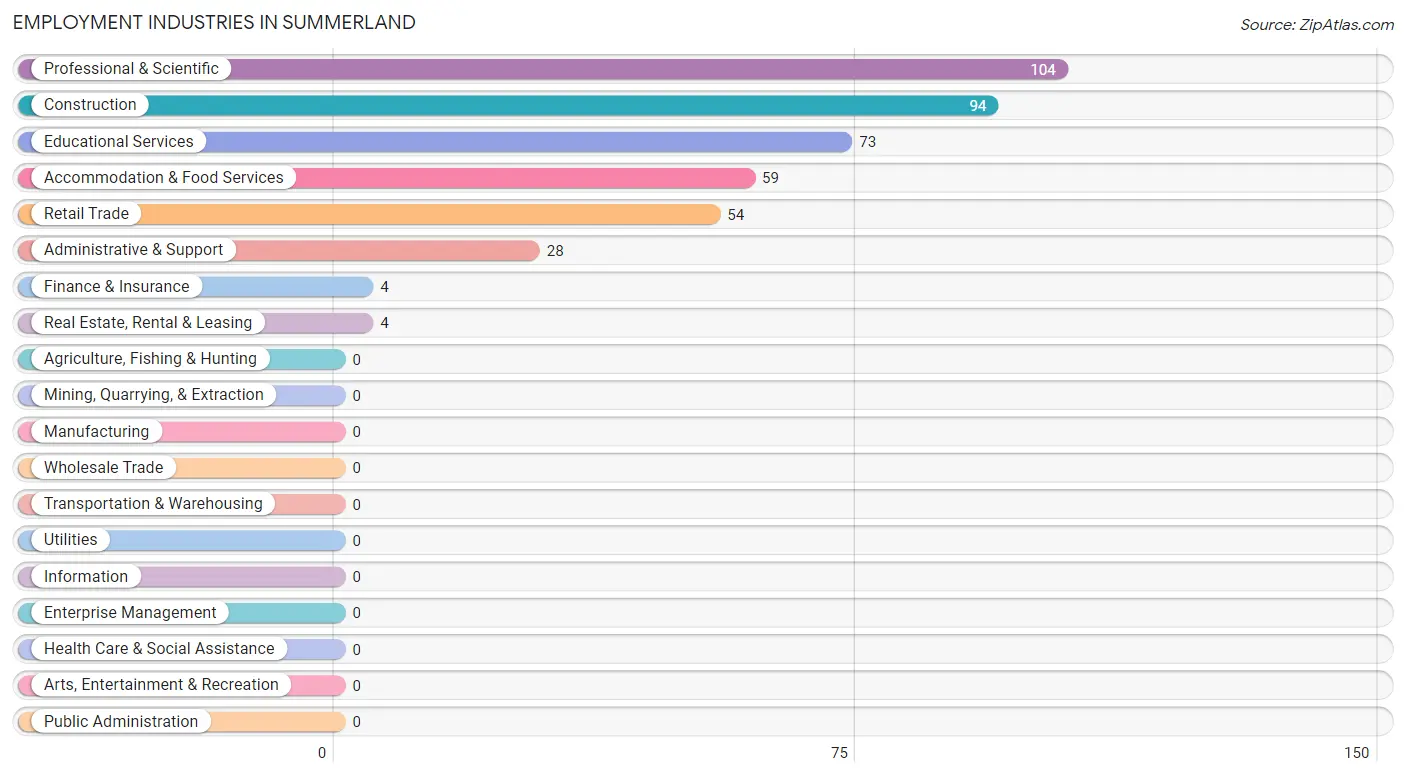
Employment Industries in Summerland
The major employment industries in Summerland include Professional & Scientific (104 | 21.2%), Construction (94 | 19.1%), Educational Services (73 | 14.9%), Accommodation & Food Services (59 | 12.0%), and Retail Trade (54 | 11.0%).
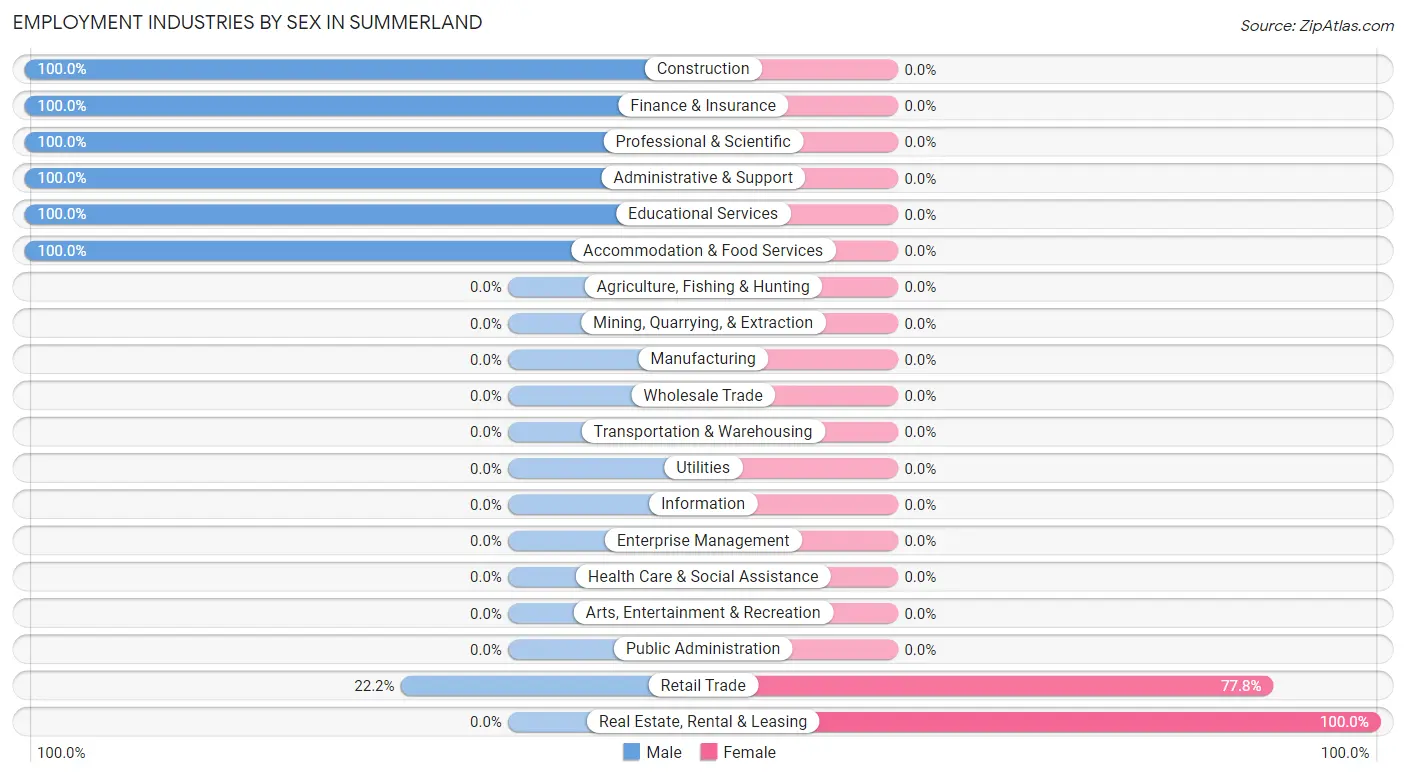
Employment Industries by Sex in Summerland
The Summerland industries that see more men than women are Construction (100.0%), Finance & Insurance (100.0%), and Professional & Scientific (100.0%), whereas the industries that tend to have a higher number of women are Real Estate, Rental & Leasing (100.0%), and Retail Trade (77.8%).
| Industry | Male | Female |
| Agriculture, Fishing & Hunting | 0 (0.0%) | 0 (0.0%) |
| Mining, Quarrying, & Extraction | 0 (0.0%) | 0 (0.0%) |
| Construction | 94 (100.0%) | 0 (0.0%) |
| Manufacturing | 0 (0.0%) | 0 (0.0%) |
| Wholesale Trade | 0 (0.0%) | 0 (0.0%) |
| Retail Trade | 12 (22.2%) | 42 (77.8%) |
| Transportation & Warehousing | 0 (0.0%) | 0 (0.0%) |
| Utilities | 0 (0.0%) | 0 (0.0%) |
| Information | 0 (0.0%) | 0 (0.0%) |
| Finance & Insurance | 4 (100.0%) | 0 (0.0%) |
| Real Estate, Rental & Leasing | 0 (0.0%) | 4 (100.0%) |
| Professional & Scientific | 104 (100.0%) | 0 (0.0%) |
| Enterprise Management | 0 (0.0%) | 0 (0.0%) |
| Administrative & Support | 28 (100.0%) | 0 (0.0%) |
| Educational Services | 73 (100.0%) | 0 (0.0%) |
| Health Care & Social Assistance | 0 (0.0%) | 0 (0.0%) |
| Arts, Entertainment & Recreation | 0 (0.0%) | 0 (0.0%) |
| Accommodation & Food Services | 59 (100.0%) | 0 (0.0%) |
| Public Administration | 0 (0.0%) | 0 (0.0%) |
| Total | 411 (83.7%) | 80 (16.3%) |
Education in Summerland
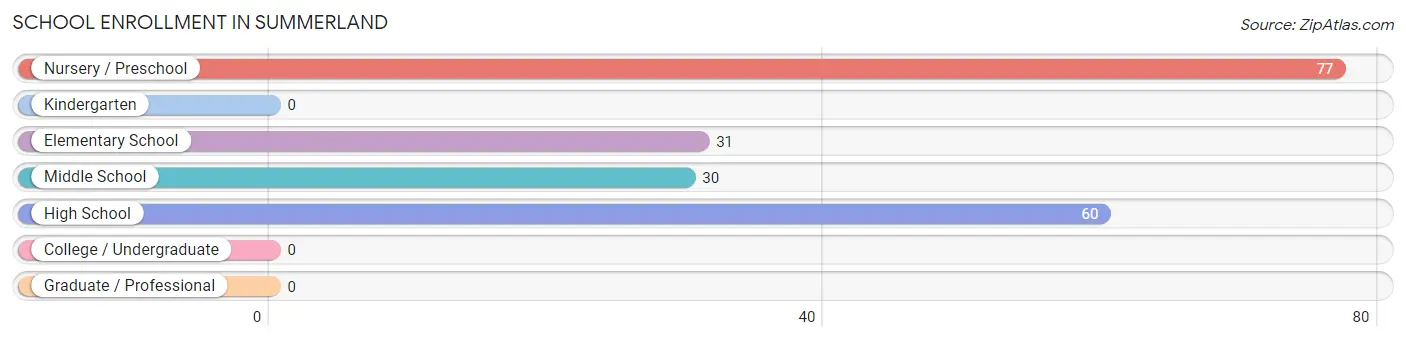
School Enrollment in Summerland
The most common levels of schooling among the 198 students in Summerland are nursery / preschool (77 | 38.9%), high school (60 | 30.3%), and elementary school (31 | 15.7%).
| School Level | # Students | % Students |
| Nursery / Preschool | 77 | 38.9% |
| Kindergarten | 0 | 0.0% |
| Elementary School | 31 | 15.7% |
| Middle School | 30 | 15.1% |
| High School | 60 | 30.3% |
| College / Undergraduate | 0 | 0.0% |
| Graduate / Professional | 0 | 0.0% |
| Total | 198 | 100.0% |
School Enrollment by Age by Funding Source in Summerland
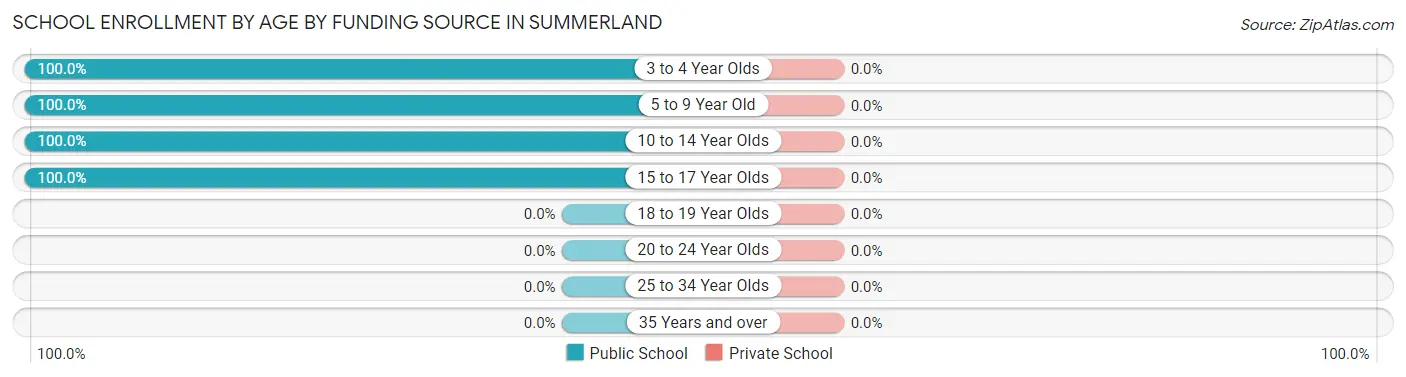
| Age Bracket | Public School | Private School |
| 3 to 4 Year Olds | 77 (100.0%) | 0 (0.0%) |
| 5 to 9 Year Old | 31 (100.0%) | 0 (0.0%) |
| 10 to 14 Year Olds | 30 (100.0%) | 0 (0.0%) |
| 15 to 17 Year Olds | 60 (100.0%) | 0 (0.0%) |
| 18 to 19 Year Olds | 0 (0.0%) | 0 (0.0%) |
| 20 to 24 Year Olds | 0 (0.0%) | 0 (0.0%) |
| 25 to 34 Year Olds | 0 (0.0%) | 0 (0.0%) |
| 35 Years and over | 0 (0.0%) | 0 (0.0%) |
| Total | 198 (100.0%) | 0 (0.0%) |
Educational Attainment by Field of Study in Summerland
Social sciences (185 | 31.7%), literature & languages (83 | 14.2%), business (52 | 8.9%), physical & health sciences (47 | 8.1%), and engineering (47 | 8.1%) are the most common fields of study among 583 individuals in Summerland who have obtained a bachelor's degree or higher.
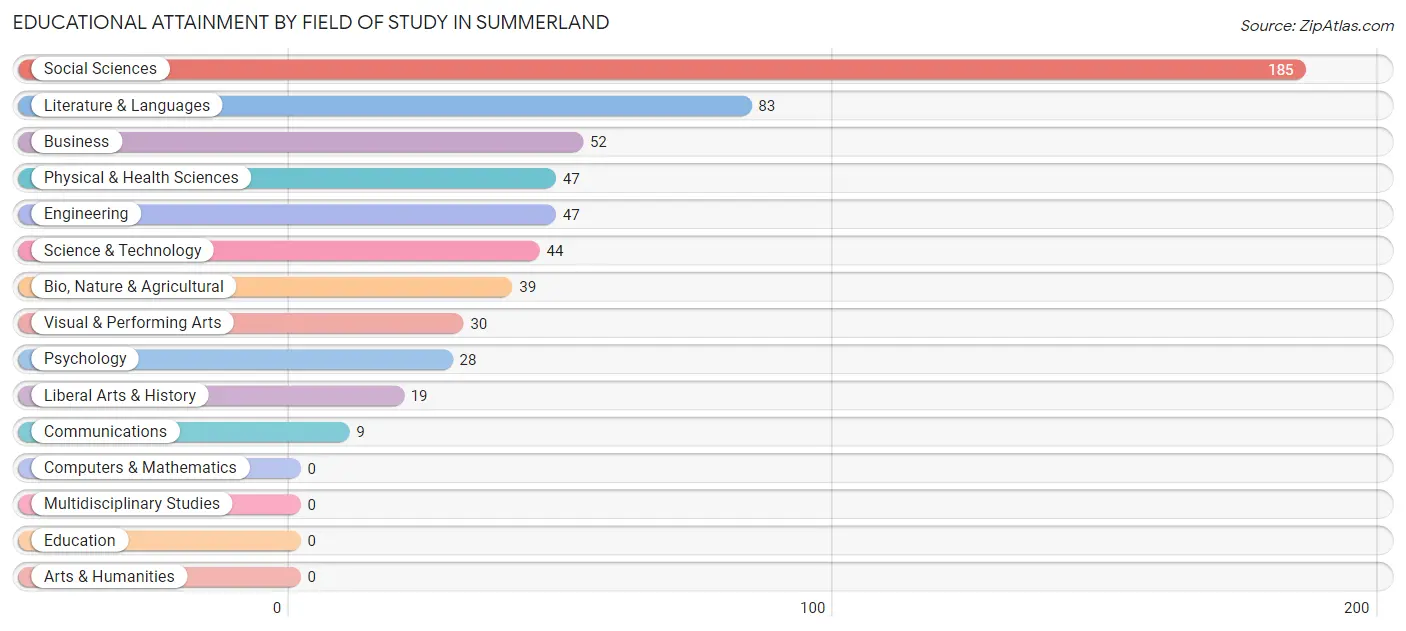
| Field of Study | # Graduates | % Graduates |
| Computers & Mathematics | 0 | 0.0% |
| Bio, Nature & Agricultural | 39 | 6.7% |
| Physical & Health Sciences | 47 | 8.1% |
| Psychology | 28 | 4.8% |
| Social Sciences | 185 | 31.7% |
| Engineering | 47 | 8.1% |
| Multidisciplinary Studies | 0 | 0.0% |
| Science & Technology | 44 | 7.5% |
| Business | 52 | 8.9% |
| Education | 0 | 0.0% |
| Literature & Languages | 83 | 14.2% |
| Liberal Arts & History | 19 | 3.3% |
| Visual & Performing Arts | 30 | 5.1% |
| Communications | 9 | 1.5% |
| Arts & Humanities | 0 | 0.0% |
| Total | 583 | 100.0% |
Transportation & Commute in Summerland
Vehicle Availability by Sex in Summerland
The most prevalent vehicle ownership categories in Summerland are males with 3 vehicles (174, accounting for 45.7%) and females with 3 vehicles (0, making up 217.5%).
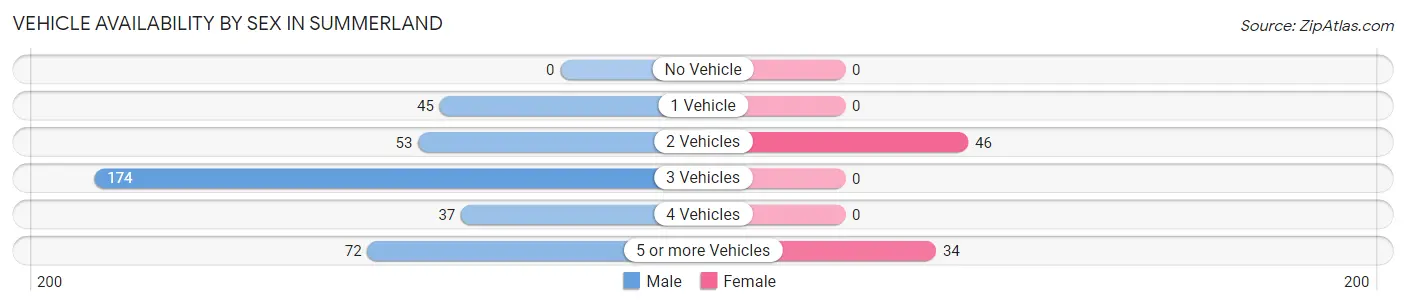
| Vehicles Available | Male | Female |
| No Vehicle | 0 (0.0%) | 0 (0.0%) |
| 1 Vehicle | 45 (11.8%) | 0 (0.0%) |
| 2 Vehicles | 53 (13.9%) | 46 (57.5%) |
| 3 Vehicles | 174 (45.7%) | 0 (0.0%) |
| 4 Vehicles | 37 (9.7%) | 0 (0.0%) |
| 5 or more Vehicles | 72 (18.9%) | 34 (42.5%) |
| Total | 381 (100.0%) | 80 (100.0%) |
Commute Time in Summerland
The most frequently occuring commute durations in Summerland are 20 to 24 minutes (131 commuters, 57.0%), 60 to 89 minutes (37 commuters, 16.1%), and 5 to 9 minutes (34 commuters, 14.8%).
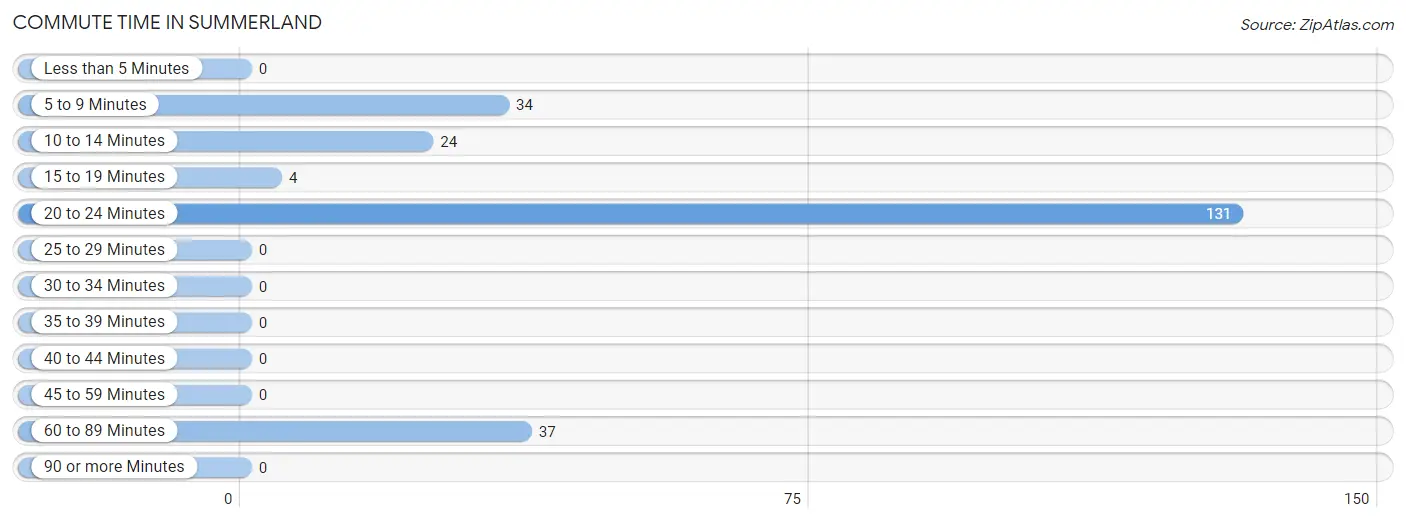
| Commute Time | # Commuters | % Commuters |
| Less than 5 Minutes | 0 | 0.0% |
| 5 to 9 Minutes | 34 | 14.8% |
| 10 to 14 Minutes | 24 | 10.4% |
| 15 to 19 Minutes | 4 | 1.7% |
| 20 to 24 Minutes | 131 | 57.0% |
| 25 to 29 Minutes | 0 | 0.0% |
| 30 to 34 Minutes | 0 | 0.0% |
| 35 to 39 Minutes | 0 | 0.0% |
| 40 to 44 Minutes | 0 | 0.0% |
| 45 to 59 Minutes | 0 | 0.0% |
| 60 to 89 Minutes | 37 | 16.1% |
| 90 or more Minutes | 0 | 0.0% |
Commute Time by Sex in Summerland
The most common commute times in Summerland are 20 to 24 minutes (131 commuters, 71.2%) for males and 5 to 9 minutes (34 commuters, 73.9%) for females.
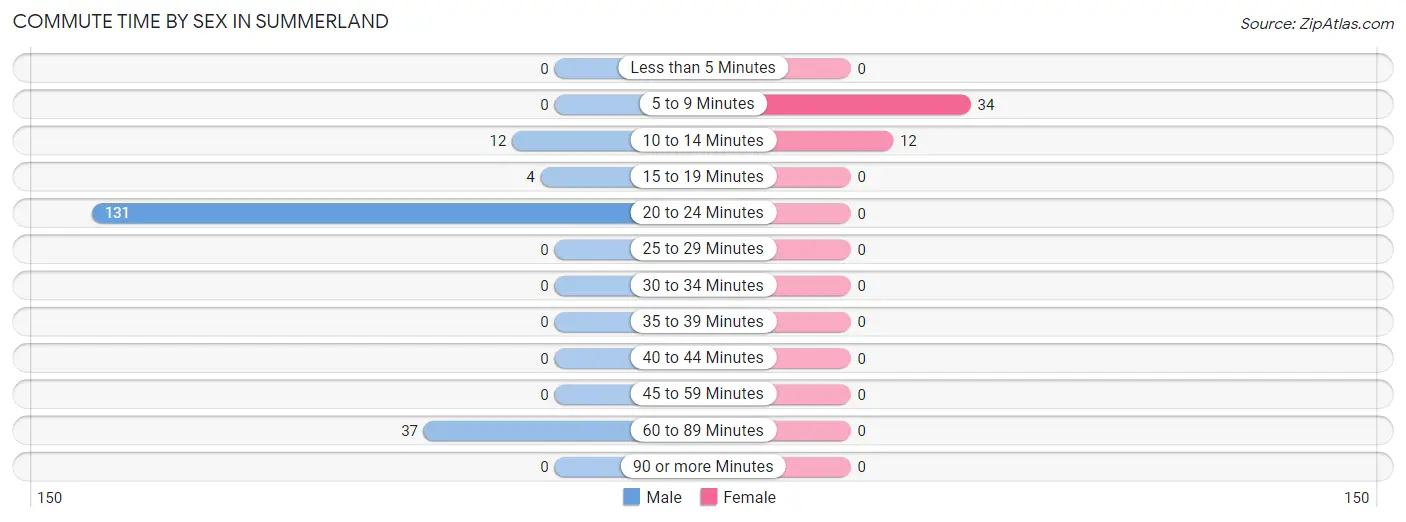
| Commute Time | Male | Female |
| Less than 5 Minutes | 0 (0.0%) | 0 (0.0%) |
| 5 to 9 Minutes | 0 (0.0%) | 34 (73.9%) |
| 10 to 14 Minutes | 12 (6.5%) | 12 (26.1%) |
| 15 to 19 Minutes | 4 (2.2%) | 0 (0.0%) |
| 20 to 24 Minutes | 131 (71.2%) | 0 (0.0%) |
| 25 to 29 Minutes | 0 (0.0%) | 0 (0.0%) |
| 30 to 34 Minutes | 0 (0.0%) | 0 (0.0%) |
| 35 to 39 Minutes | 0 (0.0%) | 0 (0.0%) |
| 40 to 44 Minutes | 0 (0.0%) | 0 (0.0%) |
| 45 to 59 Minutes | 0 (0.0%) | 0 (0.0%) |
| 60 to 89 Minutes | 37 (20.1%) | 0 (0.0%) |
| 90 or more Minutes | 0 (0.0%) | 0 (0.0%) |
Time of Departure to Work by Sex in Summerland
The most frequent times of departure to work in Summerland are 8:00 AM to 8:29 AM (131, 71.2%) for males and 6:30 AM to 6:59 AM (30, 65.2%) for females.
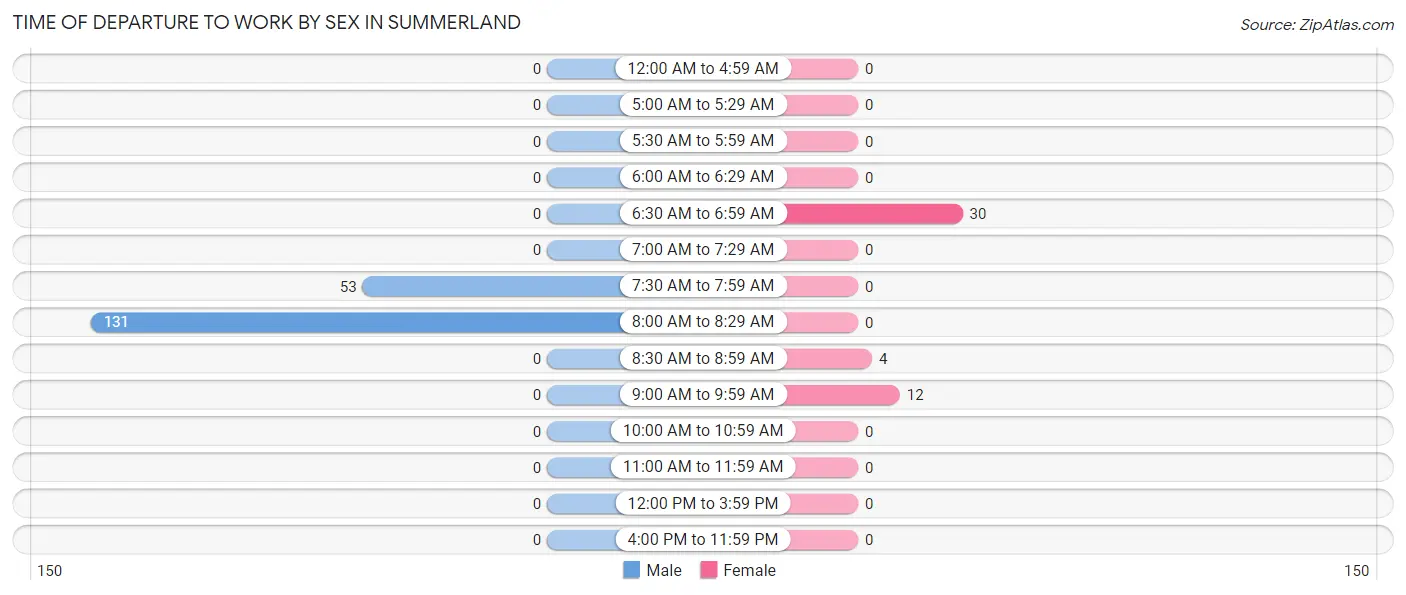
| Time of Departure | Male | Female |
| 12:00 AM to 4:59 AM | 0 (0.0%) | 0 (0.0%) |
| 5:00 AM to 5:29 AM | 0 (0.0%) | 0 (0.0%) |
| 5:30 AM to 5:59 AM | 0 (0.0%) | 0 (0.0%) |
| 6:00 AM to 6:29 AM | 0 (0.0%) | 0 (0.0%) |
| 6:30 AM to 6:59 AM | 0 (0.0%) | 30 (65.2%) |
| 7:00 AM to 7:29 AM | 0 (0.0%) | 0 (0.0%) |
| 7:30 AM to 7:59 AM | 53 (28.8%) | 0 (0.0%) |
| 8:00 AM to 8:29 AM | 131 (71.2%) | 0 (0.0%) |
| 8:30 AM to 8:59 AM | 0 (0.0%) | 4 (8.7%) |
| 9:00 AM to 9:59 AM | 0 (0.0%) | 12 (26.1%) |
| 10:00 AM to 10:59 AM | 0 (0.0%) | 0 (0.0%) |
| 11:00 AM to 11:59 AM | 0 (0.0%) | 0 (0.0%) |
| 12:00 PM to 3:59 PM | 0 (0.0%) | 0 (0.0%) |
| 4:00 PM to 11:59 PM | 0 (0.0%) | 0 (0.0%) |
| Total | 184 (100.0%) | 46 (100.0%) |
Housing Occupancy in Summerland
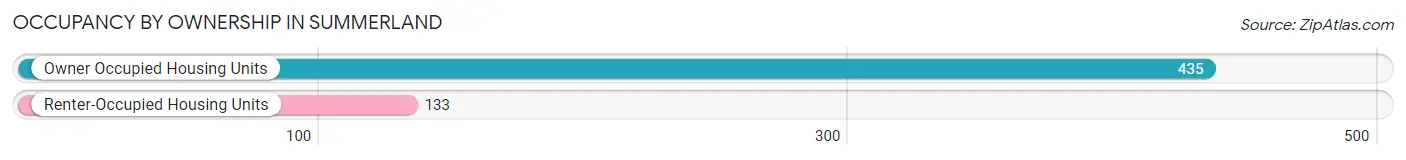
Occupancy by Ownership in Summerland
Of the total 568 dwellings in Summerland, owner-occupied units account for 435 (76.6%), while renter-occupied units make up 133 (23.4%).
| Occupancy | # Housing Units | % Housing Units |
| Owner Occupied Housing Units | 435 | 76.6% |
| Renter-Occupied Housing Units | 133 | 23.4% |
| Total Occupied Housing Units | 568 | 100.0% |
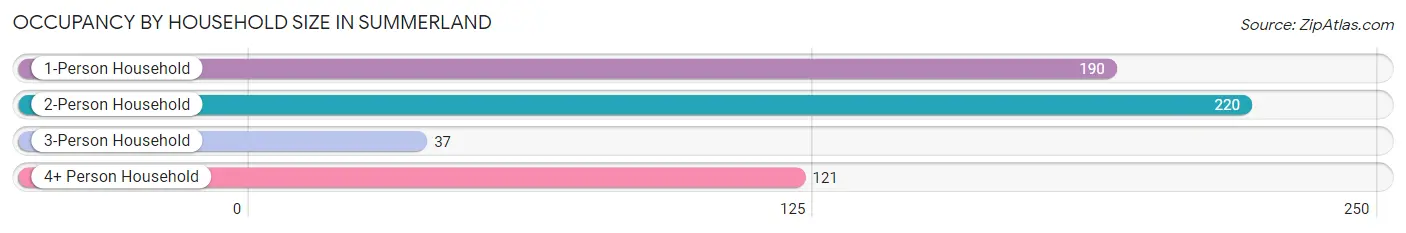
Occupancy by Household Size in Summerland
| Household Size | # Housing Units | % Housing Units |
| 1-Person Household | 190 | 33.5% |
| 2-Person Household | 220 | 38.7% |
| 3-Person Household | 37 | 6.5% |
| 4+ Person Household | 121 | 21.3% |
| Total Housing Units | 568 | 100.0% |
Occupancy by Ownership by Household Size in Summerland
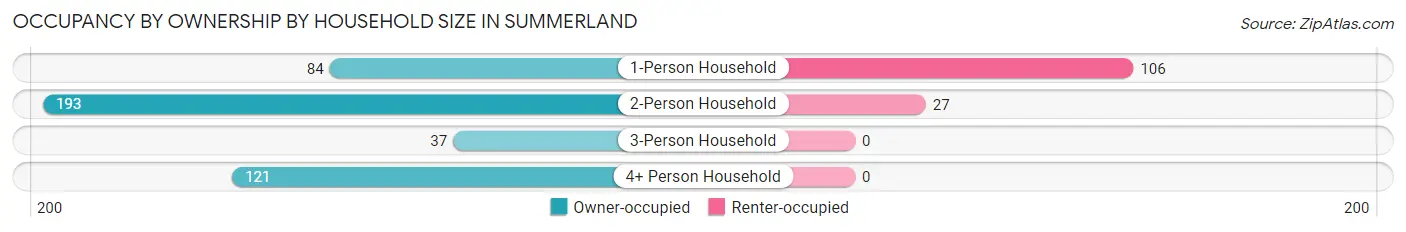
| Household Size | Owner-occupied | Renter-occupied |
| 1-Person Household | 84 (44.2%) | 106 (55.8%) |
| 2-Person Household | 193 (87.7%) | 27 (12.3%) |
| 3-Person Household | 37 (100.0%) | 0 (0.0%) |
| 4+ Person Household | 121 (100.0%) | 0 (0.0%) |
| Total Housing Units | 435 (76.6%) | 133 (23.4%) |
Occupancy by Educational Attainment in Summerland
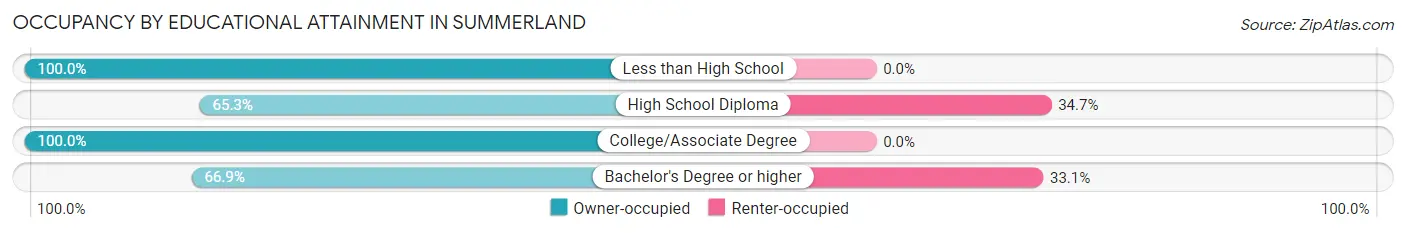
| Household Size | Owner-occupied | Renter-occupied |
| Less than High School | 59 (100.0%) | 0 (0.0%) |
| High School Diploma | 79 (65.3%) | 42 (34.7%) |
| College/Associate Degree | 113 (100.0%) | 0 (0.0%) |
| Bachelor's Degree or higher | 184 (66.9%) | 91 (33.1%) |
Occupancy by Age of Householder in Summerland
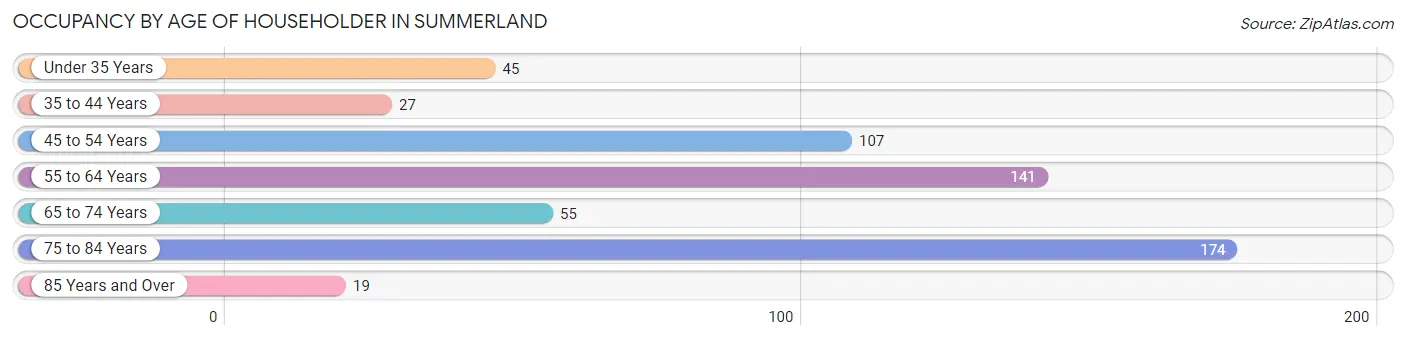
| Age Bracket | # Households | % Households |
| Under 35 Years | 45 | 7.9% |
| 35 to 44 Years | 27 | 4.8% |
| 45 to 54 Years | 107 | 18.8% |
| 55 to 64 Years | 141 | 24.8% |
| 65 to 74 Years | 55 | 9.7% |
| 75 to 84 Years | 174 | 30.6% |
| 85 Years and Over | 19 | 3.4% |
| Total | 568 | 100.0% |
Housing Finances in Summerland
Median Income by Occupancy in Summerland
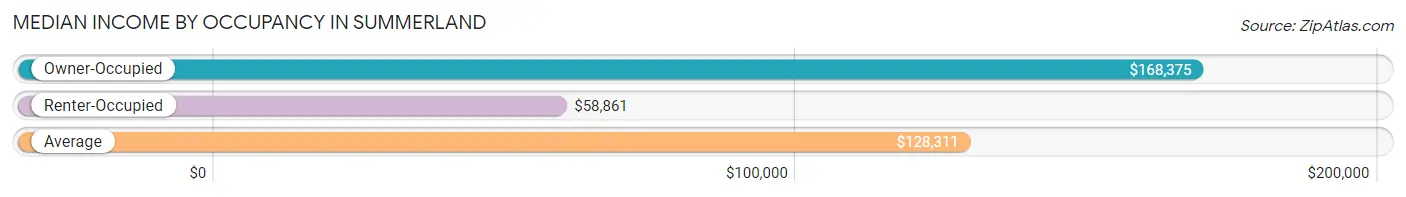
| Occupancy Type | # Households | Median Income |
| Owner-Occupied | 435 (76.6%) | $168,375 |
| Renter-Occupied | 133 (23.4%) | $58,861 |
| Average | 568 (100.0%) | $128,311 |
Occupancy by Householder Income Bracket in Summerland
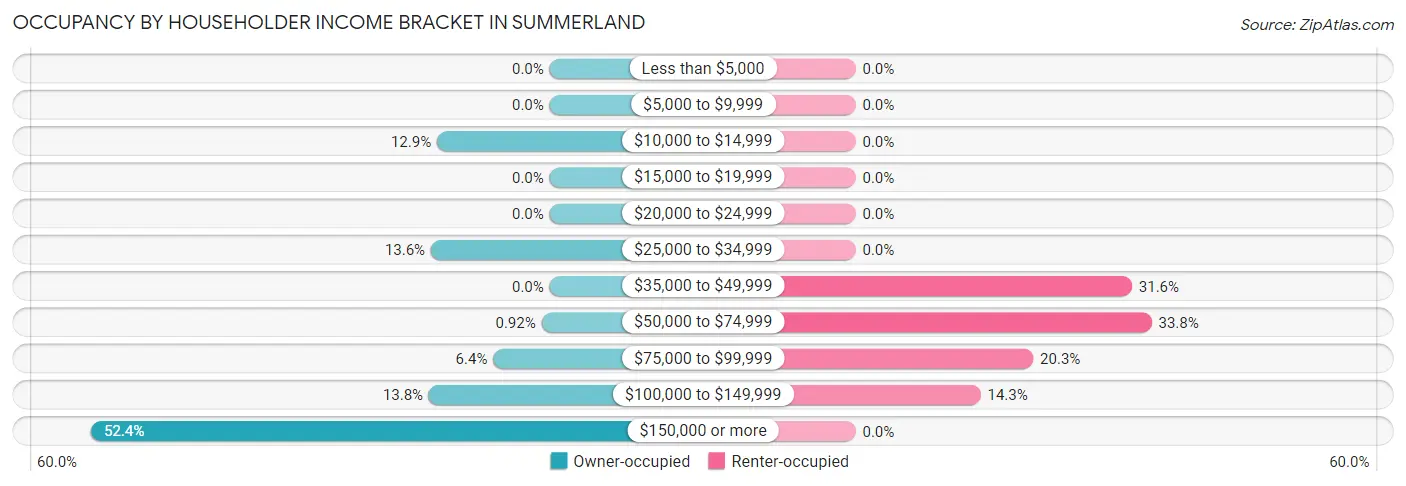
| Income Bracket | Owner-occupied | Renter-occupied |
| Less than $5,000 | 0 (0.0%) | 0 (0.0%) |
| $5,000 to $9,999 | 0 (0.0%) | 0 (0.0%) |
| $10,000 to $14,999 | 56 (12.9%) | 0 (0.0%) |
| $15,000 to $19,999 | 0 (0.0%) | 0 (0.0%) |
| $20,000 to $24,999 | 0 (0.0%) | 0 (0.0%) |
| $25,000 to $34,999 | 59 (13.6%) | 0 (0.0%) |
| $35,000 to $49,999 | 0 (0.0%) | 42 (31.6%) |
| $50,000 to $74,999 | 4 (0.9%) | 45 (33.8%) |
| $75,000 to $99,999 | 28 (6.4%) | 27 (20.3%) |
| $100,000 to $149,999 | 60 (13.8%) | 19 (14.3%) |
| $150,000 or more | 228 (52.4%) | 0 (0.0%) |
| Total | 435 (100.0%) | 133 (100.0%) |
Monthly Housing Cost Tiers in Summerland
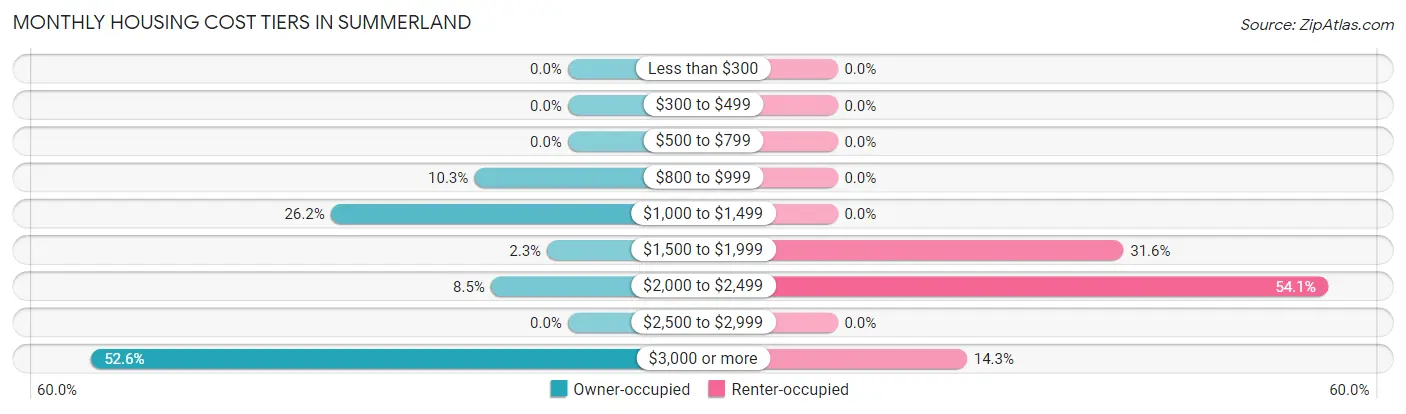
| Monthly Cost | Owner-occupied | Renter-occupied |
| Less than $300 | 0 (0.0%) | 0 (0.0%) |
| $300 to $499 | 0 (0.0%) | 0 (0.0%) |
| $500 to $799 | 0 (0.0%) | 0 (0.0%) |
| $800 to $999 | 45 (10.3%) | 0 (0.0%) |
| $1,000 to $1,499 | 114 (26.2%) | 0 (0.0%) |
| $1,500 to $1,999 | 10 (2.3%) | 42 (31.6%) |
| $2,000 to $2,499 | 37 (8.5%) | 72 (54.1%) |
| $2,500 to $2,999 | 0 (0.0%) | 0 (0.0%) |
| $3,000 or more | 229 (52.6%) | 19 (14.3%) |
| Total | 435 (100.0%) | 133 (100.0%) |
Physical Housing Characteristics in Summerland
Housing Structures in Summerland
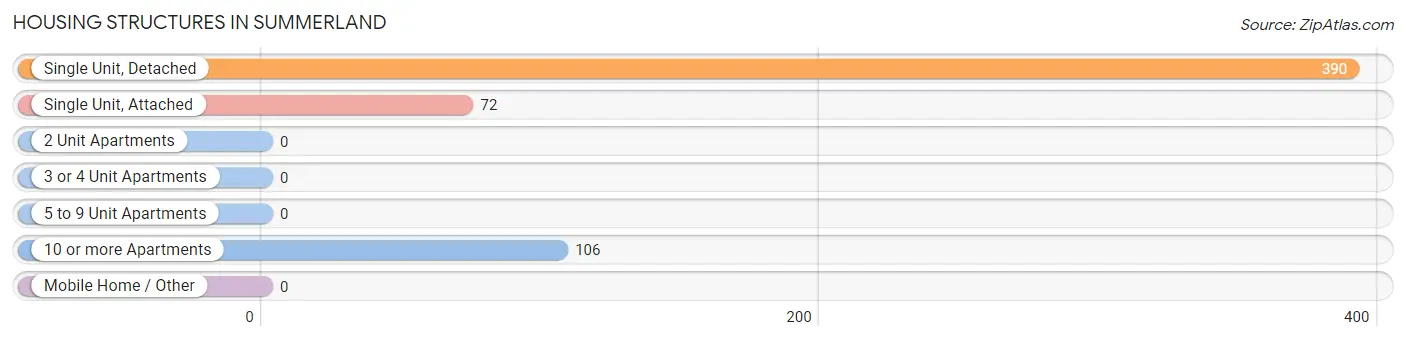
| Structure Type | # Housing Units | % Housing Units |
| Single Unit, Detached | 390 | 68.7% |
| Single Unit, Attached | 72 | 12.7% |
| 2 Unit Apartments | 0 | 0.0% |
| 3 or 4 Unit Apartments | 0 | 0.0% |
| 5 to 9 Unit Apartments | 0 | 0.0% |
| 10 or more Apartments | 106 | 18.7% |
| Mobile Home / Other | 0 | 0.0% |
| Total | 568 | 100.0% |
Housing Structures by Occupancy in Summerland
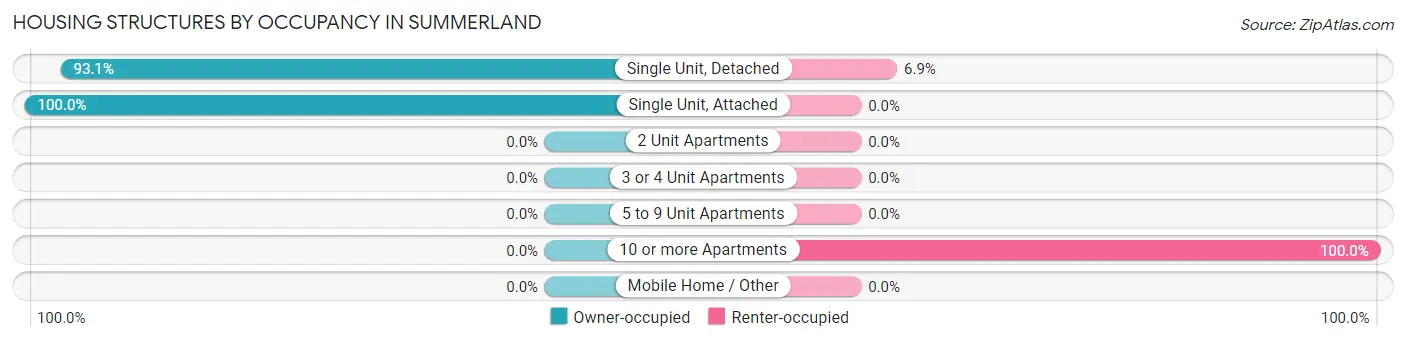
| Structure Type | Owner-occupied | Renter-occupied |
| Single Unit, Detached | 363 (93.1%) | 27 (6.9%) |
| Single Unit, Attached | 72 (100.0%) | 0 (0.0%) |
| 2 Unit Apartments | 0 (0.0%) | 0 (0.0%) |
| 3 or 4 Unit Apartments | 0 (0.0%) | 0 (0.0%) |
| 5 to 9 Unit Apartments | 0 (0.0%) | 0 (0.0%) |
| 10 or more Apartments | 0 (0.0%) | 106 (100.0%) |
| Mobile Home / Other | 0 (0.0%) | 0 (0.0%) |
| Total | 435 (76.6%) | 133 (23.4%) |
Housing Structures by Number of Rooms in Summerland
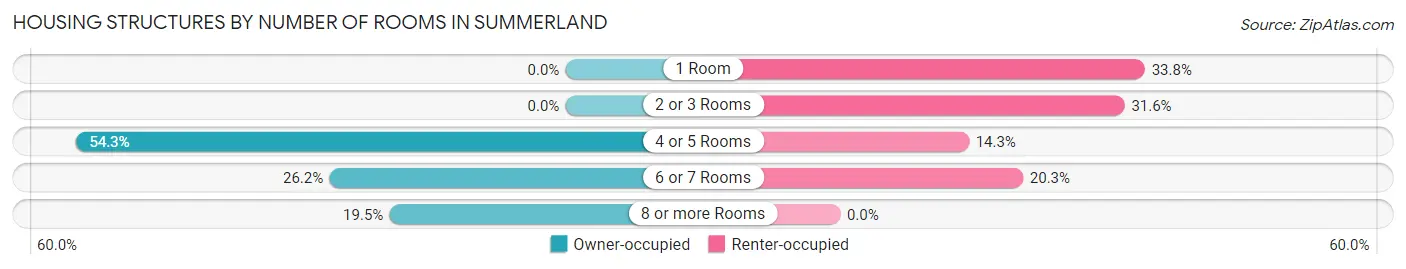
| Number of Rooms | Owner-occupied | Renter-occupied |
| 1 Room | 0 (0.0%) | 45 (33.8%) |
| 2 or 3 Rooms | 0 (0.0%) | 42 (31.6%) |
| 4 or 5 Rooms | 236 (54.2%) | 19 (14.3%) |
| 6 or 7 Rooms | 114 (26.2%) | 27 (20.3%) |
| 8 or more Rooms | 85 (19.5%) | 0 (0.0%) |
| Total | 435 (100.0%) | 133 (100.0%) |
Housing Structure by Heating Type in Summerland
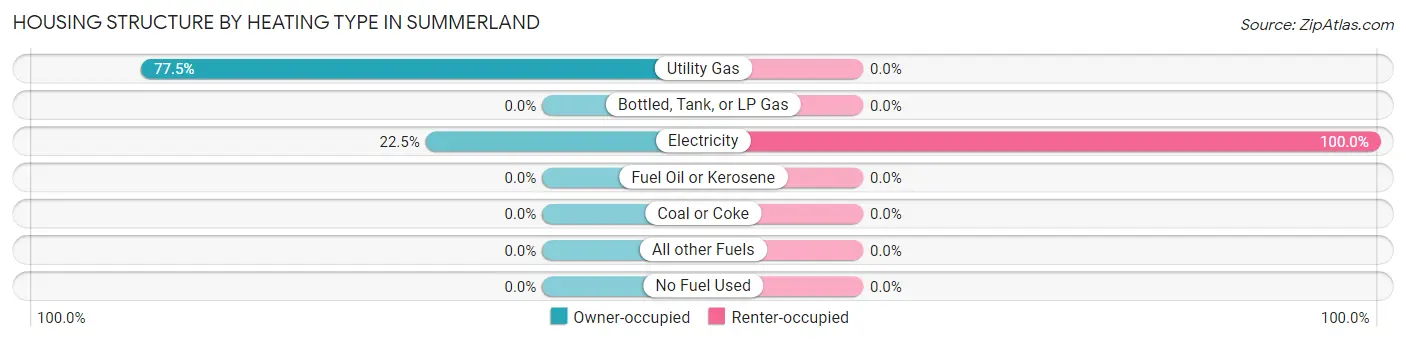
| Heating Type | Owner-occupied | Renter-occupied |
| Utility Gas | 337 (77.5%) | 0 (0.0%) |
| Bottled, Tank, or LP Gas | 0 (0.0%) | 0 (0.0%) |
| Electricity | 98 (22.5%) | 133 (100.0%) |
| Fuel Oil or Kerosene | 0 (0.0%) | 0 (0.0%) |
| Coal or Coke | 0 (0.0%) | 0 (0.0%) |
| All other Fuels | 0 (0.0%) | 0 (0.0%) |
| No Fuel Used | 0 (0.0%) | 0 (0.0%) |
| Total | 435 (100.0%) | 133 (100.0%) |
Household Vehicle Usage in Summerland
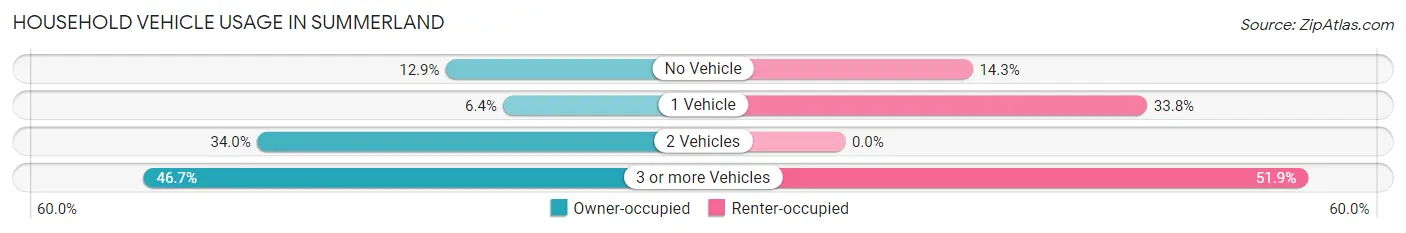
| Vehicles per Household | Owner-occupied | Renter-occupied |
| No Vehicle | 56 (12.9%) | 19 (14.3%) |
| 1 Vehicle | 28 (6.4%) | 45 (33.8%) |
| 2 Vehicles | 148 (34.0%) | 0 (0.0%) |
| 3 or more Vehicles | 203 (46.7%) | 69 (51.9%) |
| Total | 435 (100.0%) | 133 (100.0%) |
Real Estate & Mortgages in Summerland
Real Estate and Mortgage Overview in Summerland
| Characteristic | Without Mortgage | With Mortgage |
| Housing Units | 156 | 279 |
| Median Property Value | $2,000,001 | $1,620,800 |
| Median Household Income | - | - |
| Monthly Housing Costs | $1,159 | $204 |
| Real Estate Taxes | $10,001 | $0 |
Property Value by Mortgage Status in Summerland
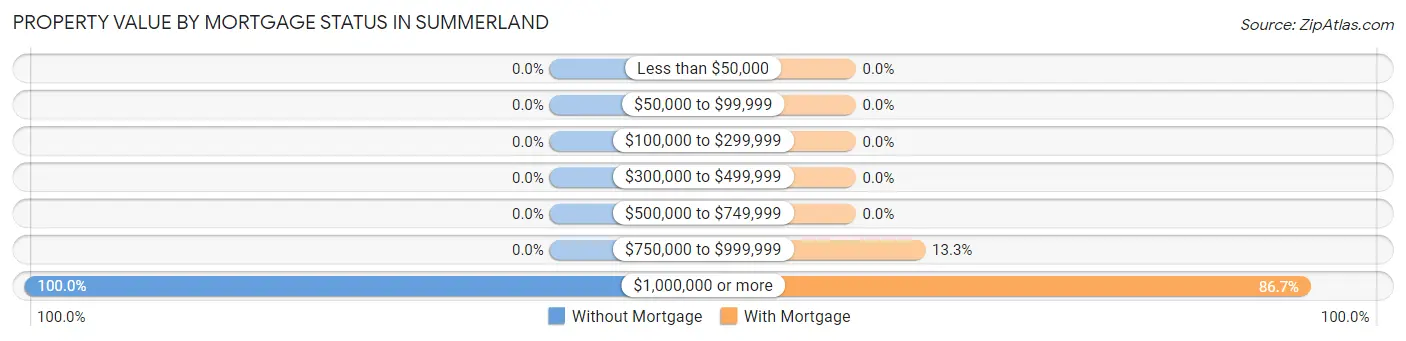
| Property Value | Without Mortgage | With Mortgage |
| Less than $50,000 | 0 (0.0%) | 0 (0.0%) |
| $50,000 to $99,999 | 0 (0.0%) | 0 (0.0%) |
| $100,000 to $299,999 | 0 (0.0%) | 0 (0.0%) |
| $300,000 to $499,999 | 0 (0.0%) | 0 (0.0%) |
| $500,000 to $749,999 | 0 (0.0%) | 0 (0.0%) |
| $750,000 to $999,999 | 0 (0.0%) | 37 (13.3%) |
| $1,000,000 or more | 156 (100.0%) | 242 (86.7%) |
| Total | 156 (100.0%) | 279 (100.0%) |
Household Income by Mortgage Status in Summerland
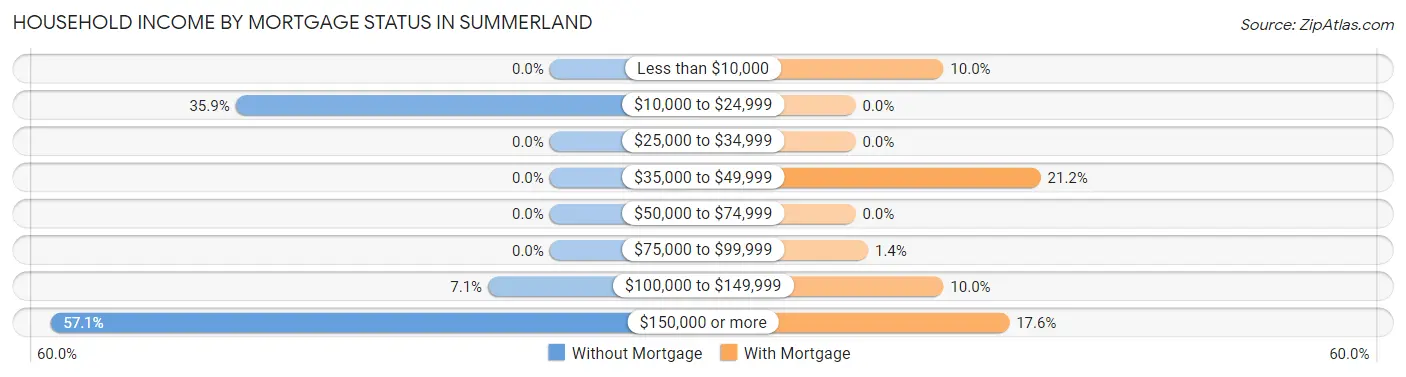
| Household Income | Without Mortgage | With Mortgage |
| Less than $10,000 | 0 (0.0%) | 28 (10.0%) |
| $10,000 to $24,999 | 56 (35.9%) | 0 (0.0%) |
| $25,000 to $34,999 | 0 (0.0%) | 0 (0.0%) |
| $35,000 to $49,999 | 0 (0.0%) | 59 (21.1%) |
| $50,000 to $74,999 | 0 (0.0%) | 0 (0.0%) |
| $75,000 to $99,999 | 0 (0.0%) | 4 (1.4%) |
| $100,000 to $149,999 | 11 (7.0%) | 28 (10.0%) |
| $150,000 or more | 89 (57.1%) | 49 (17.6%) |
| Total | 156 (100.0%) | 279 (100.0%) |
Property Value to Household Income Ratio in Summerland
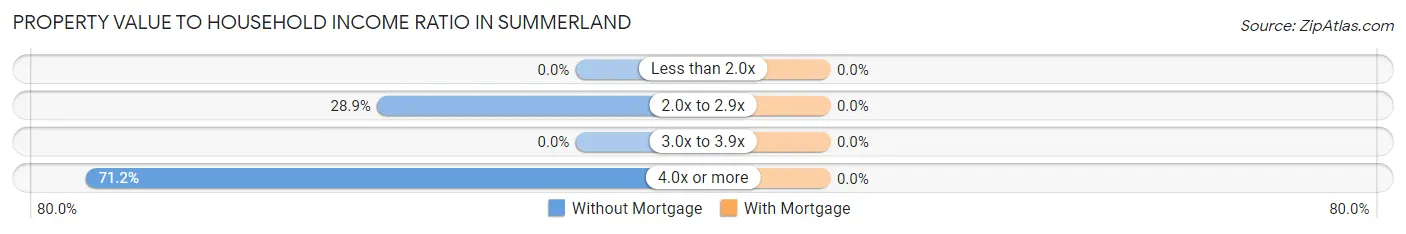
| Value-to-Income Ratio | Without Mortgage | With Mortgage |
| Less than 2.0x | 0 (0.0%) | 0 (0.0%) |
| 2.0x to 2.9x | 45 (28.8%) | 0 (0.0%) |
| 3.0x to 3.9x | 0 (0.0%) | 0 (0.0%) |
| 4.0x or more | 111 (71.2%) | 0 (0.0%) |
| Total | 156 (100.0%) | 279 (100.0%) |
Real Estate Taxes by Mortgage Status in Summerland
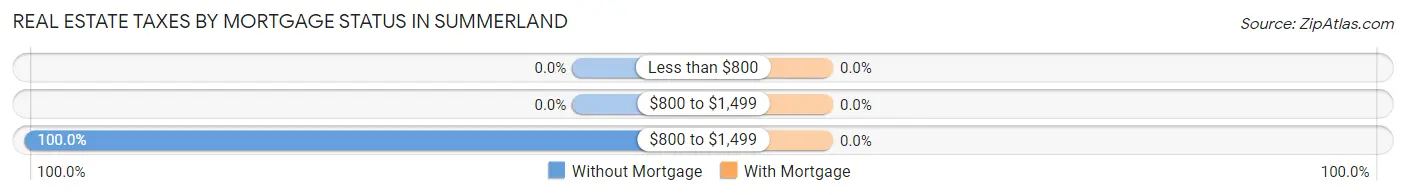
| Property Taxes | Without Mortgage | With Mortgage |
| Less than $800 | 0 (0.0%) | 0 (0.0%) |
| $800 to $1,499 | 0 (0.0%) | 0 (0.0%) |
| $800 to $1,499 | 156 (100.0%) | 0 (0.0%) |
| Total | 156 (100.0%) | 279 (100.0%) |
Health & Disability in Summerland
Health Insurance Coverage by Age in Summerland
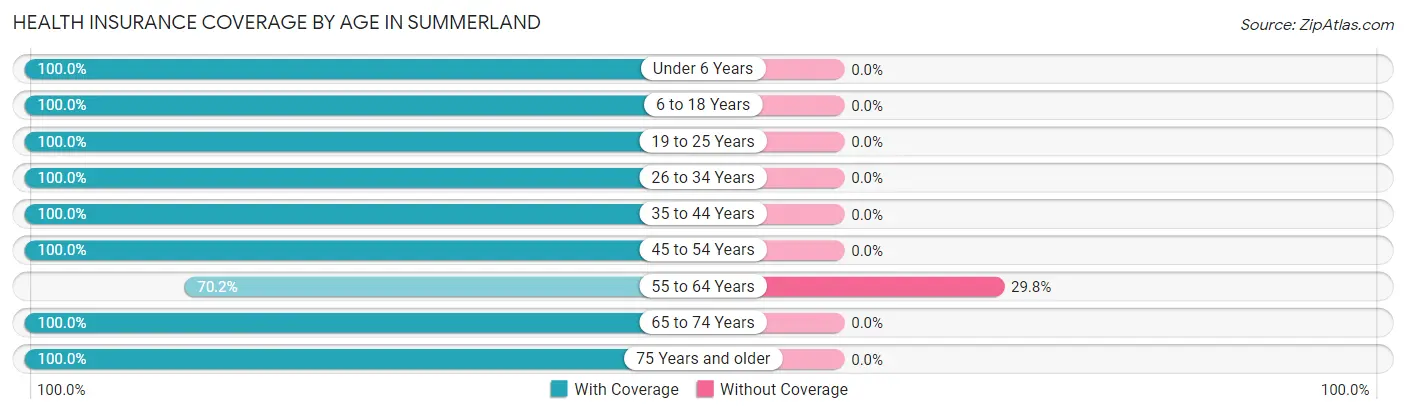
| Age Bracket | With Coverage | Without Coverage |
| Under 6 Years | 114 (100.0%) | 0 (0.0%) |
| 6 to 18 Years | 121 (100.0%) | 0 (0.0%) |
| 19 to 25 Years | 59 (100.0%) | 0 (0.0%) |
| 26 to 34 Years | 45 (100.0%) | 0 (0.0%) |
| 35 to 44 Years | 85 (100.0%) | 0 (0.0%) |
| 45 to 54 Years | 291 (100.0%) | 0 (0.0%) |
| 55 to 64 Years | 99 (70.2%) | 42 (29.8%) |
| 65 to 74 Years | 163 (100.0%) | 0 (0.0%) |
| 75 Years and older | 255 (100.0%) | 0 (0.0%) |
| Total | 1,232 (96.7%) | 42 (3.3%) |
Health Insurance Coverage by Citizenship Status in Summerland
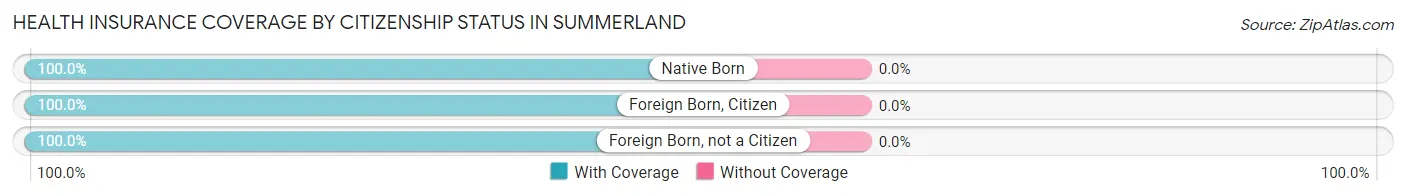
| Citizenship Status | With Coverage | Without Coverage |
| Native Born | 114 (100.0%) | 0 (0.0%) |
| Foreign Born, Citizen | 121 (100.0%) | 0 (0.0%) |
| Foreign Born, not a Citizen | 59 (100.0%) | 0 (0.0%) |
Health Insurance Coverage by Household Income in Summerland
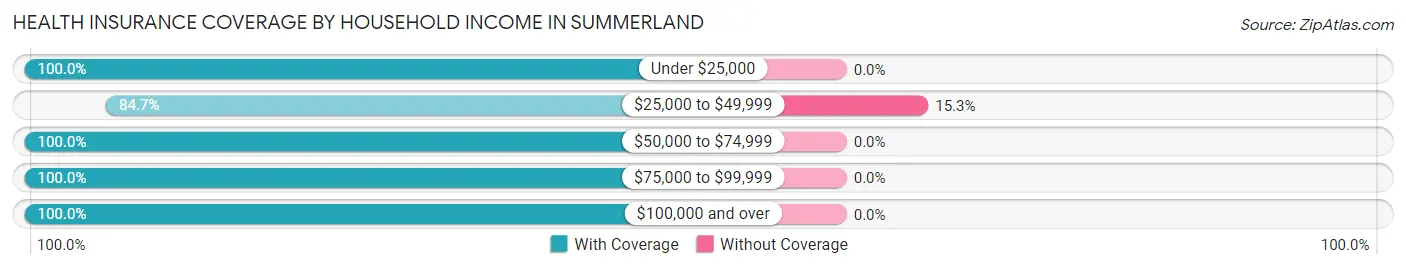
| Household Income | With Coverage | Without Coverage |
| Under $25,000 | 56 (100.0%) | 0 (0.0%) |
| $25,000 to $49,999 | 233 (84.7%) | 42 (15.3%) |
| $50,000 to $74,999 | 53 (100.0%) | 0 (0.0%) |
| $75,000 to $99,999 | 83 (100.0%) | 0 (0.0%) |
| $100,000 and over | 807 (100.0%) | 0 (0.0%) |
Public vs Private Health Insurance Coverage by Age in Summerland
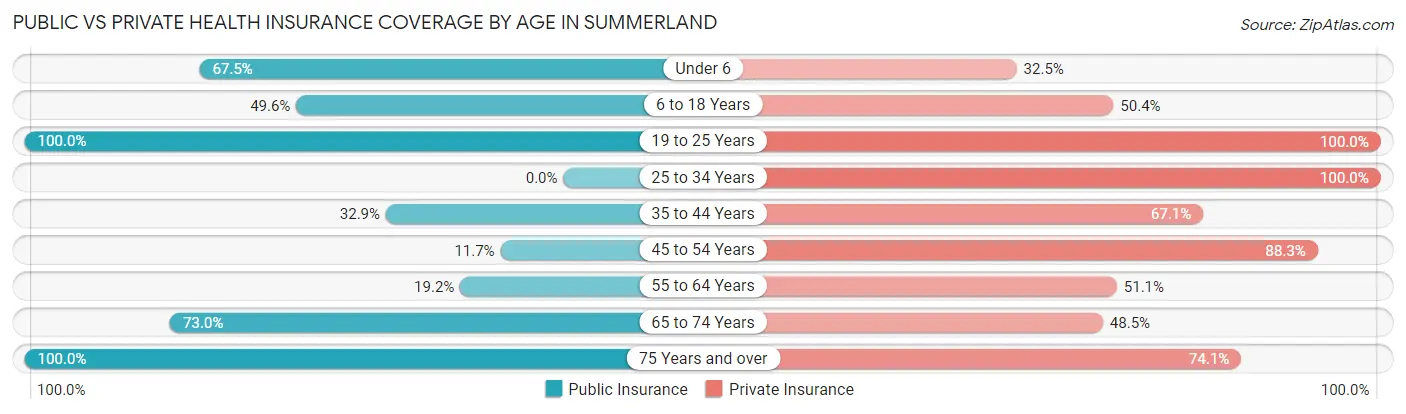
| Age Bracket | Public Insurance | Private Insurance |
| Under 6 | 77 (67.5%) | 37 (32.5%) |
| 6 to 18 Years | 60 (49.6%) | 61 (50.4%) |
| 19 to 25 Years | 59 (100.0%) | 59 (100.0%) |
| 25 to 34 Years | 0 (0.0%) | 45 (100.0%) |
| 35 to 44 Years | 28 (32.9%) | 57 (67.1%) |
| 45 to 54 Years | 34 (11.7%) | 257 (88.3%) |
| 55 to 64 Years | 27 (19.2%) | 72 (51.1%) |
| 65 to 74 Years | 119 (73.0%) | 79 (48.5%) |
| 75 Years and over | 255 (100.0%) | 189 (74.1%) |
| Total | 659 (51.7%) | 856 (67.2%) |
Disability Status by Sex by Age in Summerland
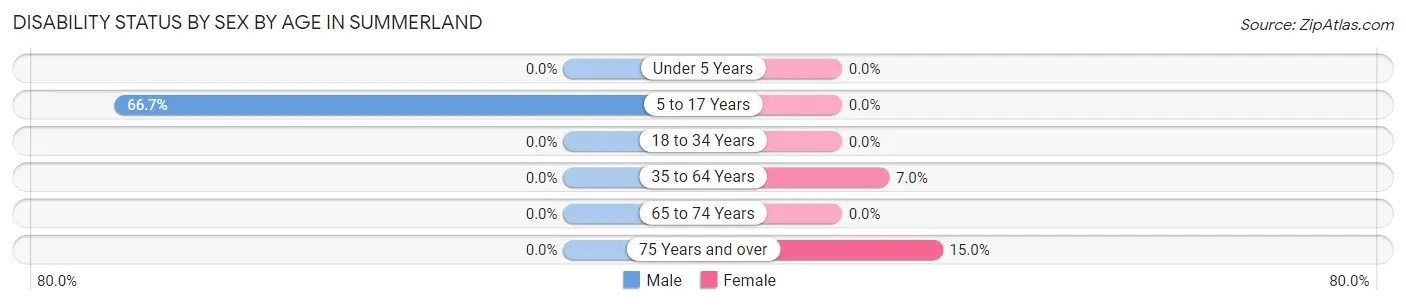
| Age Bracket | Male | Female |
| Under 5 Years | 0 (0.0%) | 0 (0.0%) |
| 5 to 17 Years | 60 (66.7%) | 0 (0.0%) |
| 18 to 34 Years | 0 (0.0%) | 0 (0.0%) |
| 35 to 64 Years | 0 (0.0%) | 11 (7.0%) |
| 65 to 74 Years | 0 (0.0%) | 0 (0.0%) |
| 75 Years and over | 0 (0.0%) | 19 (15.0%) |
Disability Class by Sex by Age in Summerland
Disability Class: Hearing Difficulty
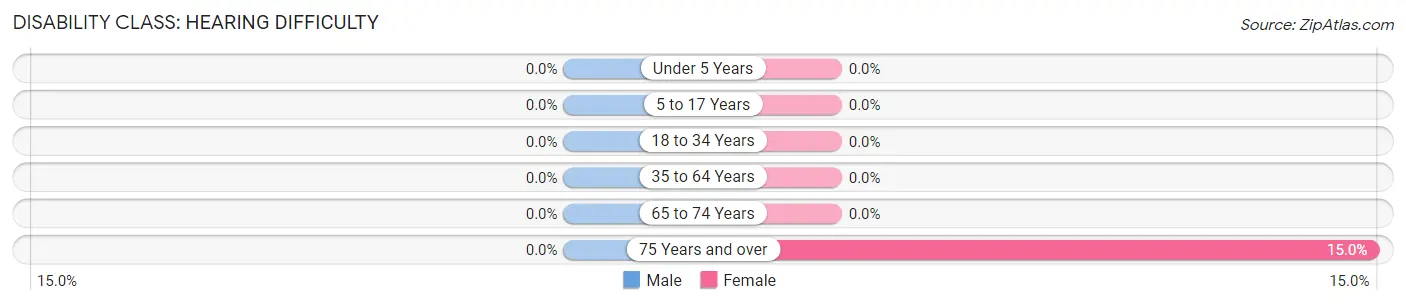
| Age Bracket | Male | Female |
| Under 5 Years | 0 (0.0%) | 0 (0.0%) |
| 5 to 17 Years | 0 (0.0%) | 0 (0.0%) |
| 18 to 34 Years | 0 (0.0%) | 0 (0.0%) |
| 35 to 64 Years | 0 (0.0%) | 0 (0.0%) |
| 65 to 74 Years | 0 (0.0%) | 0 (0.0%) |
| 75 Years and over | 0 (0.0%) | 19 (15.0%) |
Disability Class: Vision Difficulty
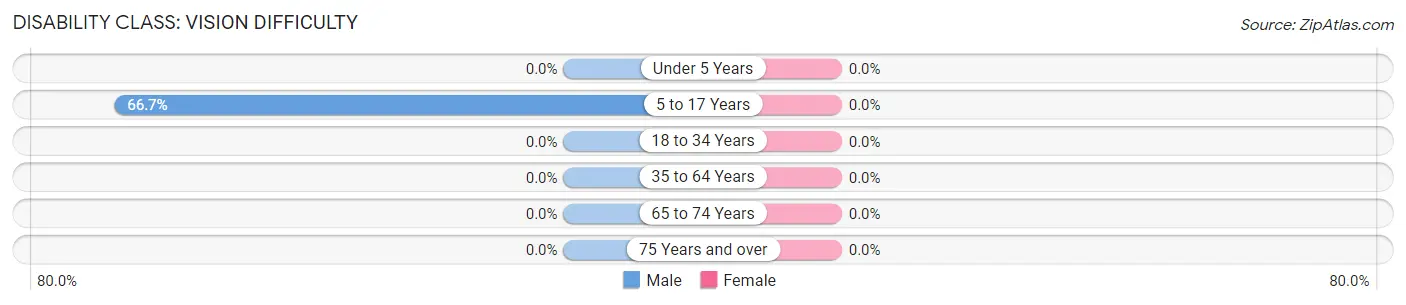
| Age Bracket | Male | Female |
| Under 5 Years | 0 (0.0%) | 0 (0.0%) |
| 5 to 17 Years | 60 (66.7%) | 0 (0.0%) |
| 18 to 34 Years | 0 (0.0%) | 0 (0.0%) |
| 35 to 64 Years | 0 (0.0%) | 0 (0.0%) |
| 65 to 74 Years | 0 (0.0%) | 0 (0.0%) |
| 75 Years and over | 0 (0.0%) | 0 (0.0%) |
Disability Class: Cognitive Difficulty
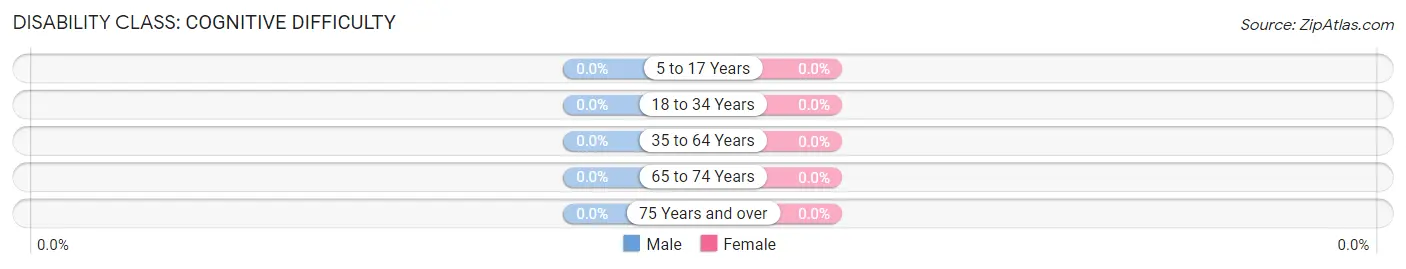
| Age Bracket | Male | Female |
| 5 to 17 Years | 0 (0.0%) | 0 (0.0%) |
| 18 to 34 Years | 0 (0.0%) | 0 (0.0%) |
| 35 to 64 Years | 0 (0.0%) | 0 (0.0%) |
| 65 to 74 Years | 0 (0.0%) | 0 (0.0%) |
| 75 Years and over | 0 (0.0%) | 0 (0.0%) |
Disability Class: Ambulatory Difficulty
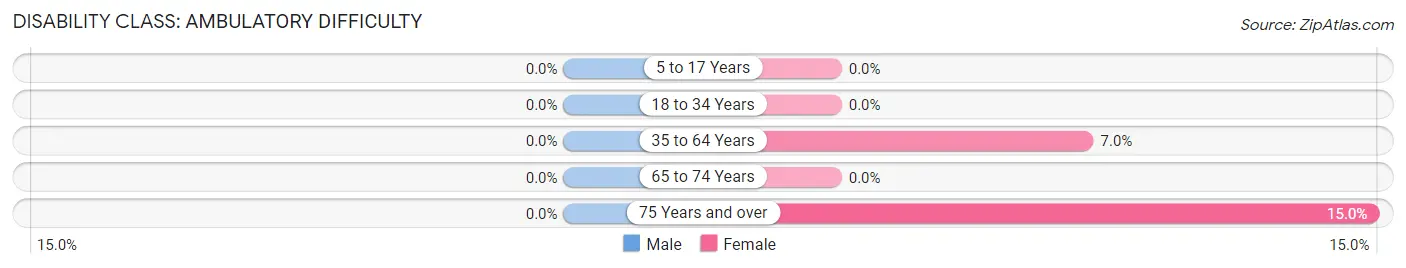
| Age Bracket | Male | Female |
| 5 to 17 Years | 0 (0.0%) | 0 (0.0%) |
| 18 to 34 Years | 0 (0.0%) | 0 (0.0%) |
| 35 to 64 Years | 0 (0.0%) | 11 (7.0%) |
| 65 to 74 Years | 0 (0.0%) | 0 (0.0%) |
| 75 Years and over | 0 (0.0%) | 19 (15.0%) |
Disability Class: Self-Care Difficulty
| Age Bracket | Male | Female |
| 5 to 17 Years | 0 (0.0%) | 0 (0.0%) |
| 18 to 34 Years | 0 (0.0%) | 0 (0.0%) |
| 35 to 64 Years | 0 (0.0%) | 0 (0.0%) |
| 65 to 74 Years | 0 (0.0%) | 0 (0.0%) |
| 75 Years and over | 0 (0.0%) | 0 (0.0%) |
Technology Access in Summerland
Computing Device Access in Summerland
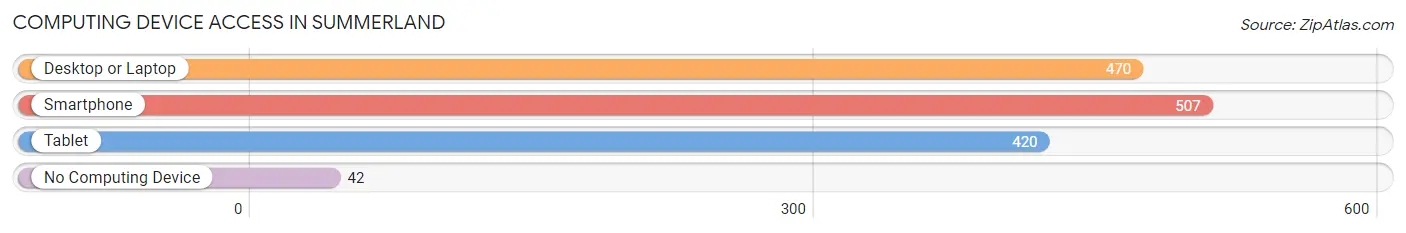
| Device Type | # Households | % Households |
| Desktop or Laptop | 470 | 82.8% |
| Smartphone | 507 | 89.3% |
| Tablet | 420 | 73.9% |
| No Computing Device | 42 | 7.4% |
| Total | 568 | 100.0% |
Internet Access in Summerland
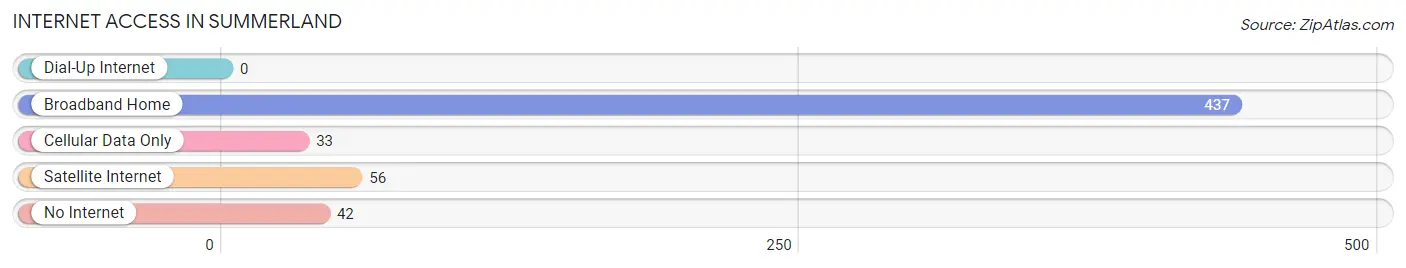
| Internet Type | # Households | % Households |
| Dial-Up Internet | 0 | 0.0% |
| Broadband Home | 437 | 76.9% |
| Cellular Data Only | 33 | 5.8% |
| Satellite Internet | 56 | 9.9% |
| No Internet | 42 | 7.4% |
| Total | 568 | 100.0% |
Summerland Summary
Introduction
Located in the heart of California’s Central Coast, the city of Summerland is a small beach town with a population of just over 1,500 people. The city is situated on the coast of Santa Barbara County, just south of the city of Santa Barbara. Summerland is known for its beautiful beaches, stunning views of the Pacific Ocean, and its laid-back atmosphere.
History
Summerland was founded in 1887 by William and Mary Hollister, who purchased the land from the Chumash Indians. The Hollisters named the area Summerland because of its warm climate and beautiful scenery. The town was originally a small fishing village, but it quickly grew into a popular tourist destination.
In the early 1900s, Summerland was a popular destination for wealthy vacationers from Los Angeles and San Francisco. The town was known for its luxurious hotels, fine dining, and beautiful beaches. In the 1920s, the town was home to a number of celebrities, including Charlie Chaplin and Rudolph Valentino.
In the 1950s, Summerland began to decline in popularity as more people moved to the larger cities of Santa Barbara and Los Angeles. The town was eventually annexed by the city of Santa Barbara in the 1970s.
Geography
Summerland is located on the coast of Santa Barbara County, just south of the city of Santa Barbara. The city is situated on a small peninsula, surrounded by the Pacific Ocean on three sides. The city is bordered by the cities of Carpinteria to the east and Montecito to the north.
The city has a total area of 1.3 square miles, with 0.3 square miles of land and 1.0 square miles of water. The city is located at an elevation of approximately 200 feet above sea level.
Economy
The economy of Summerland is largely based on tourism. The city is home to a number of hotels, restaurants, and other tourist attractions. The city also has a number of small businesses, including art galleries, boutiques, and antique stores.
The city is also home to a number of wineries, which produce some of the finest wines in the region. The city is also home to a number of agricultural operations, including avocado and citrus farms.
Demographics
As of the 2010 census, the population of Summerland was 1,541. The racial makeup of the city was 91.2% White, 0.7% African American, 0.3% Native American, 0.7% Asian, 0.1% Pacific Islander, 4.2% from other races, and 2.8% from two or more races. Hispanic or Latino of any race were 8.3% of the population.
The median income for a household in the city was $60,938, and the median income for a family was $68,750. The per capita income for the city was $31,945. About 5.2% of families and 7.2% of the population were below the poverty line, including 8.3% of those under age 18 and 4.2% of those age 65 or over.
Conclusion
Summerland is a small beach town located on the coast of Santa Barbara County. The city is known for its beautiful beaches, stunning views of the Pacific Ocean, and its laid-back atmosphere. The economy of Summerland is largely based on tourism, with a number of hotels, restaurants, and other tourist attractions. The population of Summerland is 1,541, with a median income of $60,938. Summerland is a great place to visit or live, with its stunning scenery and relaxed atmosphere.
Common Questions
What is Per Capita Income in Summerland?
Per Capita income in Summerland is $78,083.
What is the Median Family Income in Summerland?
Median Family Income in Summerland is $179,107.
What is the Median Household income in Summerland?
Median Household Income in Summerland is $128,311.
What is Inequality or Gini Index in Summerland?
Inequality or Gini Index in Summerland is 0.49.
What is the Total Population of Summerland?
Total Population of Summerland is 1,274.
What is the Total Male Population of Summerland?
Total Male Population of Summerland is 778.
What is the Total Female Population of Summerland?
Total Female Population of Summerland is 496.
What is the Ratio of Males per 100 Females in Summerland?
There are 156.85 Males per 100 Females in Summerland.
What is the Ratio of Females per 100 Males in Summerland?
There are 63.75 Females per 100 Males in Summerland.
What is the Median Population Age in Summerland?
Median Population Age in Summerland is 53.4 Years.
What is the Average Family Size in Summerland
Average Family Size in Summerland is 2.7 People.
What is the Average Household Size in Summerland
Average Household Size in Summerland is 2.2 People.
How Large is the Labor Force in Summerland?
There are 560 People in the Labor Forcein in Summerland.
What is the Percentage of People in the Labor Force in Summerland?
53.9% of People are in the Labor Force in Summerland.
What is the Unemployment Rate in Summerland?
Unemployment Rate in Summerland is 12.3%.