Lakeview, CA Map & Demographics
Lakeview Map
Lakeview Overview
$46,187
PER CAPITA INCOME
$81,250
AVG FAMILY INCOME
$72,550
AVG HOUSEHOLD INCOME
16.1%
WAGE / INCOME GAP [ % ]
83.9¢/ $1
WAGE / INCOME GAP [ $ ]
0.67
INEQUALITY / GINI INDEX
2,327
TOTAL POPULATION
1,017
MALE POPULATION
1,310
FEMALE POPULATION
77.63
MALES / 100 FEMALES
128.81
FEMALES / 100 MALES
32.0
MEDIAN AGE
4.3
AVG FAMILY SIZE
4.1
AVG HOUSEHOLD SIZE
1,045
LABOR FORCE [ PEOPLE ]
60.7%
PERCENT IN LABOR FORCE
5.0%
UNEMPLOYMENT RATE
Lakeview Area Codes
Income in Lakeview
Income Overview in Lakeview
Per Capita Income in Lakeview is $46,187, while median incomes of families and households are $81,250 and $72,550 respectively.
| Characteristic | Number | Measure |
| Per Capita Income | 2,327 | $46,187 |
| Median Family Income | 452 | $81,250 |
| Mean Family Income | 452 | $189,185 |
| Median Household Income | 563 | $72,550 |
| Mean Household Income | 563 | $169,938 |
| Income Deficit | 452 | $0 |
| Wage / Income Gap (%) | 2,327 | 16.08% |
| Wage / Income Gap ($) | 2,327 | 83.92¢ per $1 |
| Gini / Inequality Index | 2,327 | 0.67 |
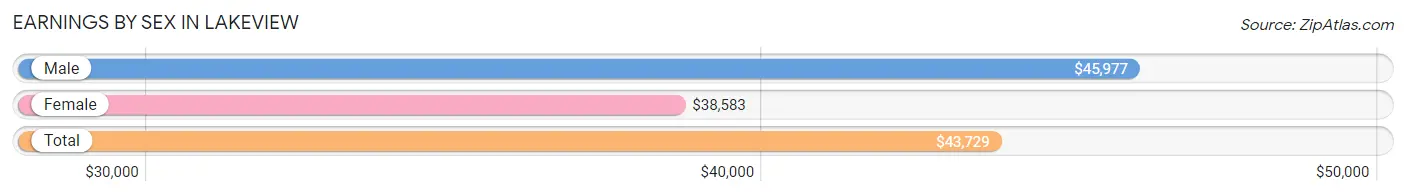
Earnings by Sex in Lakeview
Average Earnings in Lakeview are $43,729, $45,977 for men and $38,583 for women, a difference of 16.1%.
| Sex | Number | Average Earnings |
| Male | 538 (51.0%) | $45,977 |
| Female | 517 (49.0%) | $38,583 |
| Total | 1,055 (100.0%) | $43,729 |
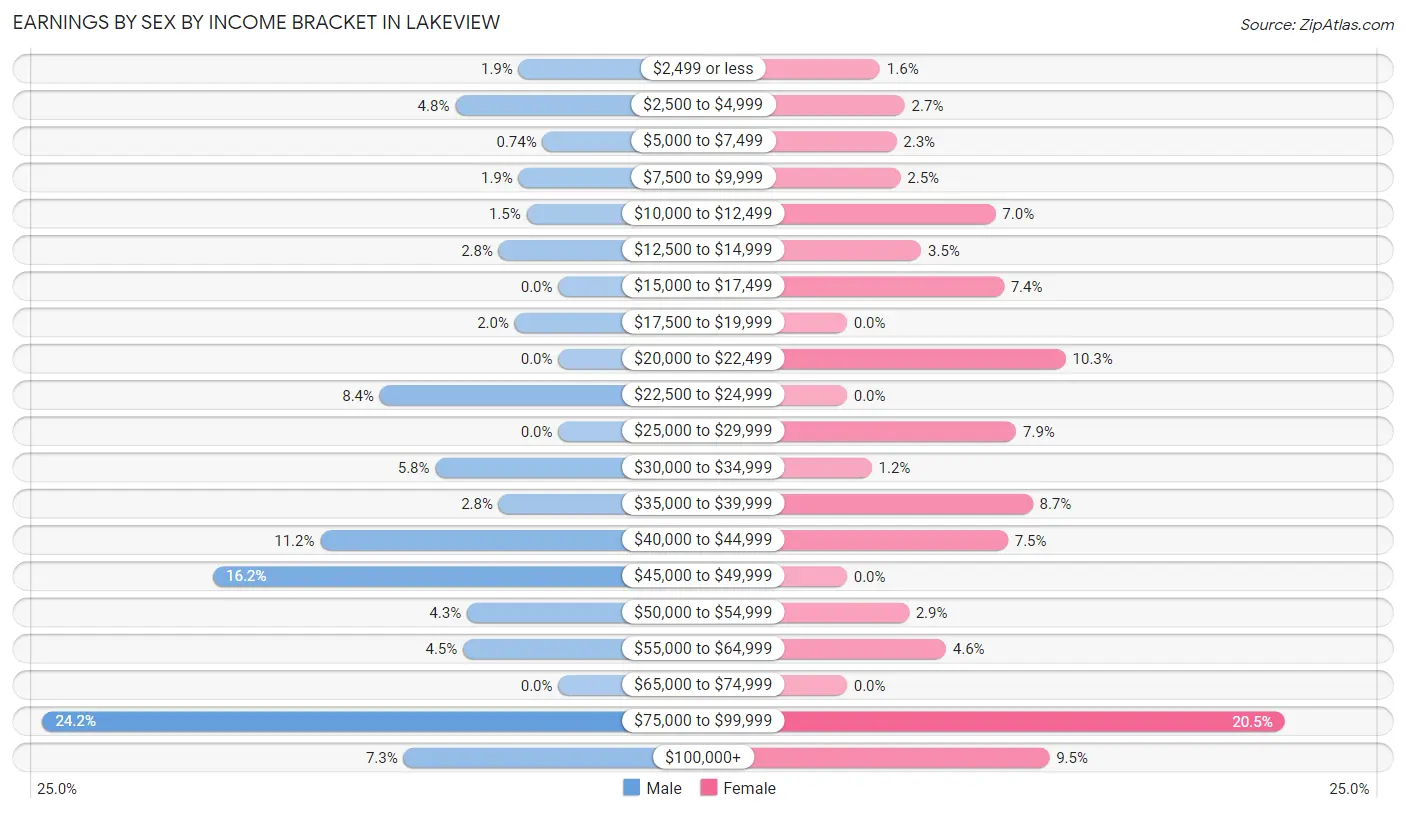
Earnings by Sex by Income Bracket in Lakeview
The most common earnings brackets in Lakeview are $75,000 to $99,999 for men (130 | 24.2%) and $75,000 to $99,999 for women (106 | 20.5%).
| Income | Male | Female |
| $2,499 or less | 10 (1.9%) | 8 (1.5%) |
| $2,500 to $4,999 | 26 (4.8%) | 14 (2.7%) |
| $5,000 to $7,499 | 4 (0.7%) | 12 (2.3%) |
| $7,500 to $9,999 | 10 (1.9%) | 13 (2.5%) |
| $10,000 to $12,499 | 8 (1.5%) | 36 (7.0%) |
| $12,500 to $14,999 | 15 (2.8%) | 18 (3.5%) |
| $15,000 to $17,499 | 0 (0.0%) | 38 (7.3%) |
| $17,500 to $19,999 | 11 (2.0%) | 0 (0.0%) |
| $20,000 to $22,499 | 0 (0.0%) | 53 (10.2%) |
| $22,500 to $24,999 | 45 (8.4%) | 0 (0.0%) |
| $25,000 to $29,999 | 0 (0.0%) | 41 (7.9%) |
| $30,000 to $34,999 | 31 (5.8%) | 6 (1.2%) |
| $35,000 to $39,999 | 15 (2.8%) | 45 (8.7%) |
| $40,000 to $44,999 | 60 (11.2%) | 39 (7.5%) |
| $45,000 to $49,999 | 87 (16.2%) | 0 (0.0%) |
| $50,000 to $54,999 | 23 (4.3%) | 15 (2.9%) |
| $55,000 to $64,999 | 24 (4.5%) | 24 (4.6%) |
| $65,000 to $74,999 | 0 (0.0%) | 0 (0.0%) |
| $75,000 to $99,999 | 130 (24.2%) | 106 (20.5%) |
| $100,000+ | 39 (7.2%) | 49 (9.5%) |
| Total | 538 (100.0%) | 517 (100.0%) |
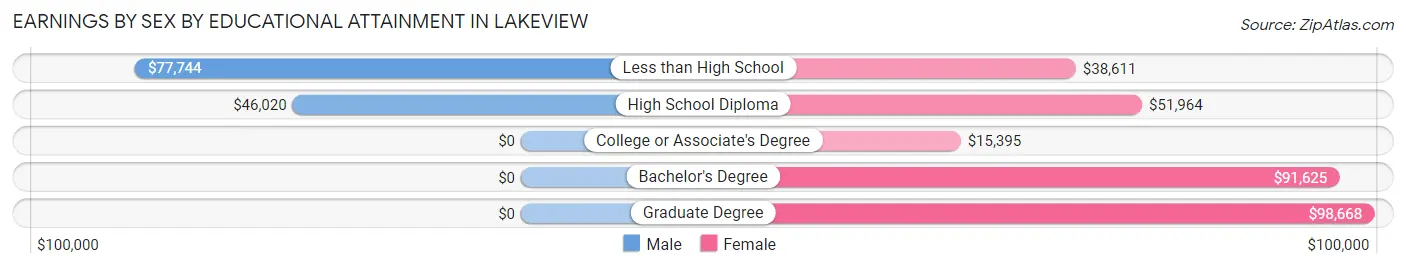
Earnings by Sex by Educational Attainment in Lakeview
Average earnings in Lakeview are $46,552 for men and $41,293 for women, a difference of 11.3%. Men with an educational attainment of less than high school enjoy the highest average annual earnings of $77,744, while those with high school diploma education earn the least with $46,020. Women with an educational attainment of graduate degree earn the most with the average annual earnings of $98,668, while those with college or associate's degree education have the smallest earnings of $15,395.
| Educational Attainment | Male Income | Female Income |
| Less than High School | $77,744 | $38,611 |
| High School Diploma | $46,020 | $51,964 |
| College or Associate's Degree | - | - |
| Bachelor's Degree | - | - |
| Graduate Degree | - | - |
| Total | $46,552 | $41,293 |
Family Income in Lakeview
Family Income Brackets in Lakeview
According to the Lakeview family income data, there are 101 families falling into the $150,000 to $199,999 income range, which is the most common income bracket and makes up 22.4% of all families.
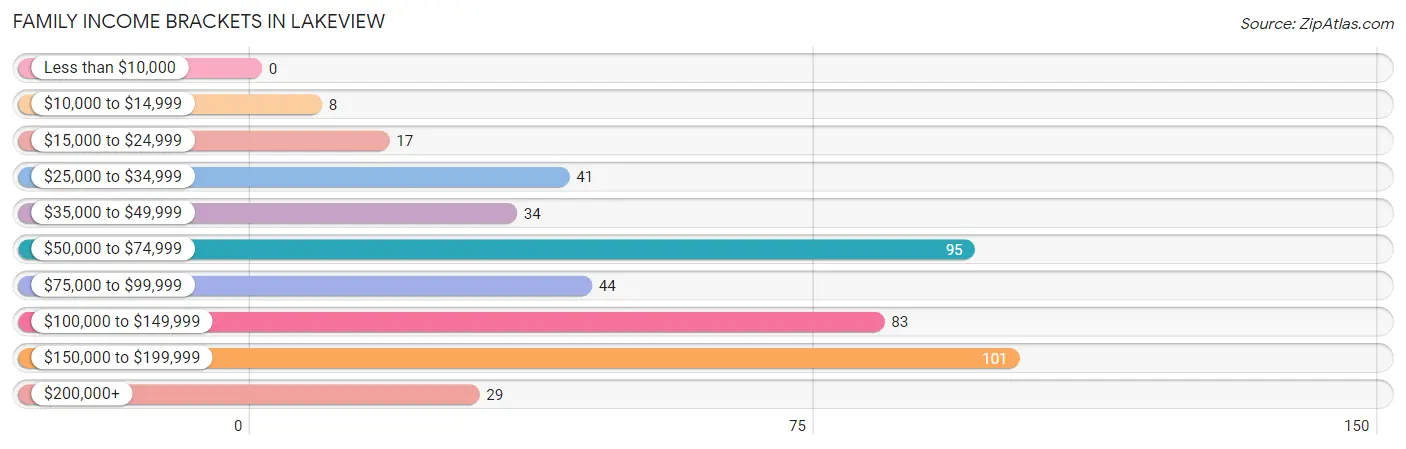
| Income Bracket | # Families | % Families |
| Less than $10,000 | 0 | 0.0% |
| $10,000 to $14,999 | 8 | 1.8% |
| $15,000 to $24,999 | 17 | 3.8% |
| $25,000 to $34,999 | 41 | 9.1% |
| $35,000 to $49,999 | 34 | 7.5% |
| $50,000 to $74,999 | 95 | 21.0% |
| $75,000 to $99,999 | 44 | 9.7% |
| $100,000 to $149,999 | 83 | 18.4% |
| $150,000 to $199,999 | 101 | 22.3% |
| $200,000+ | 29 | 6.4% |
Family Income by Famaliy Size in Lakeview
4-person families (148 | 32.7%) account for the highest median family income in Lakeview with $156,250 per family, while 3-person families (73 | 16.2%) have the highest median income of $47,649 per family member.
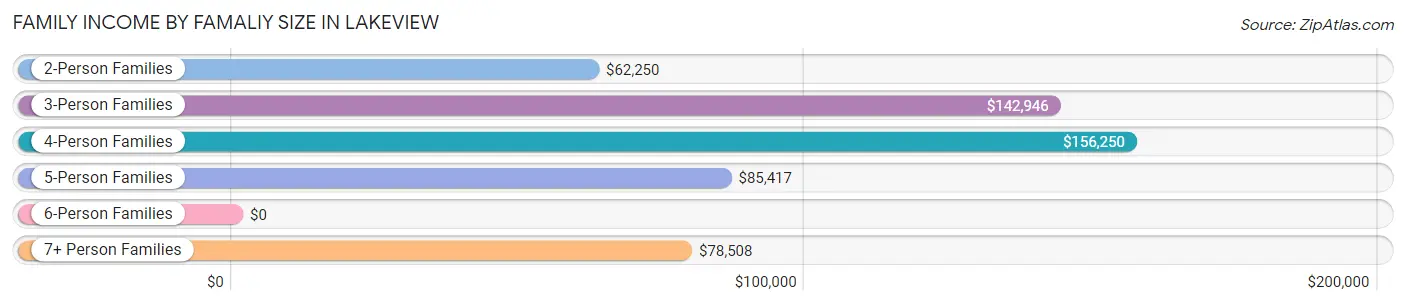
| Income Bracket | # Families | Median Income |
| 2-Person Families | 125 (27.7%) | $62,250 |
| 3-Person Families | 73 (16.2%) | $142,946 |
| 4-Person Families | 148 (32.7%) | $156,250 |
| 5-Person Families | 29 (6.4%) | $85,417 |
| 6-Person Families | 0 (0.0%) | $0 |
| 7+ Person Families | 77 (17.0%) | $78,508 |
| Total | 452 (100.0%) | $81,250 |
Family Income by Number of Earners in Lakeview
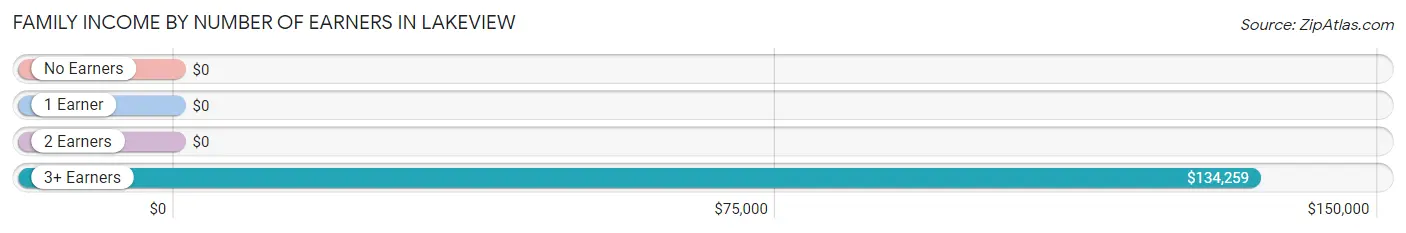
| Number of Earners | # Families | Median Income |
| No Earners | 100 (22.1%) | $0 |
| 1 Earner | 76 (16.8%) | $0 |
| 2 Earners | 146 (32.3%) | $0 |
| 3+ Earners | 130 (28.8%) | $134,259 |
| Total | 452 (100.0%) | $81,250 |
Household Income in Lakeview
Household Income Brackets in Lakeview
With 110 households falling in the category, the $50,000 to $74,999 income range is the most frequent in Lakeview, accounting for 19.5% of all households. In contrast, only 31 households (5.5%) fall into the $10,000 to $14,999 income bracket, making it the least populous group.
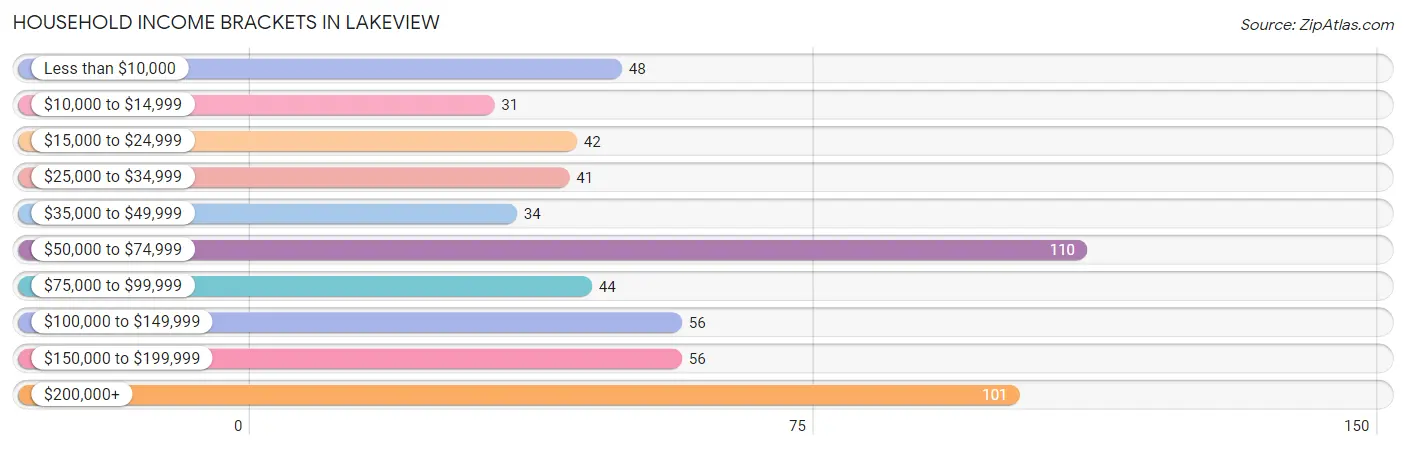
| Income Bracket | # Households | % Households |
| Less than $10,000 | 48 | 8.5% |
| $10,000 to $14,999 | 31 | 5.5% |
| $15,000 to $24,999 | 42 | 7.5% |
| $25,000 to $34,999 | 41 | 7.3% |
| $35,000 to $49,999 | 34 | 6.0% |
| $50,000 to $74,999 | 110 | 19.5% |
| $75,000 to $99,999 | 44 | 7.8% |
| $100,000 to $149,999 | 56 | 9.9% |
| $150,000 to $199,999 | 56 | 9.9% |
| $200,000+ | 101 | 17.9% |
Household Income by Householder Age in Lakeview
| Income Bracket | # Households | Median Income |
| 15 to 24 Years | 38 (6.8%) | $0 |
| 25 to 44 Years | 95 (16.9%) | $0 |
| 45 to 64 Years | 248 (44.1%) | $0 |
| 65+ Years | 182 (32.3%) | $0 |
| Total | 563 (100.0%) | $72,550 |
Poverty in Lakeview
Income Below Poverty by Sex and Age in Lakeview
With 11.8% poverty level for males and 22.0% for females among the residents of Lakeview, 16 and 17 year old males and under 5 year old females are the most vulnerable to poverty, with 12 males (35.3%) and 56 females (100.0%) in their respective age groups living below the poverty level.
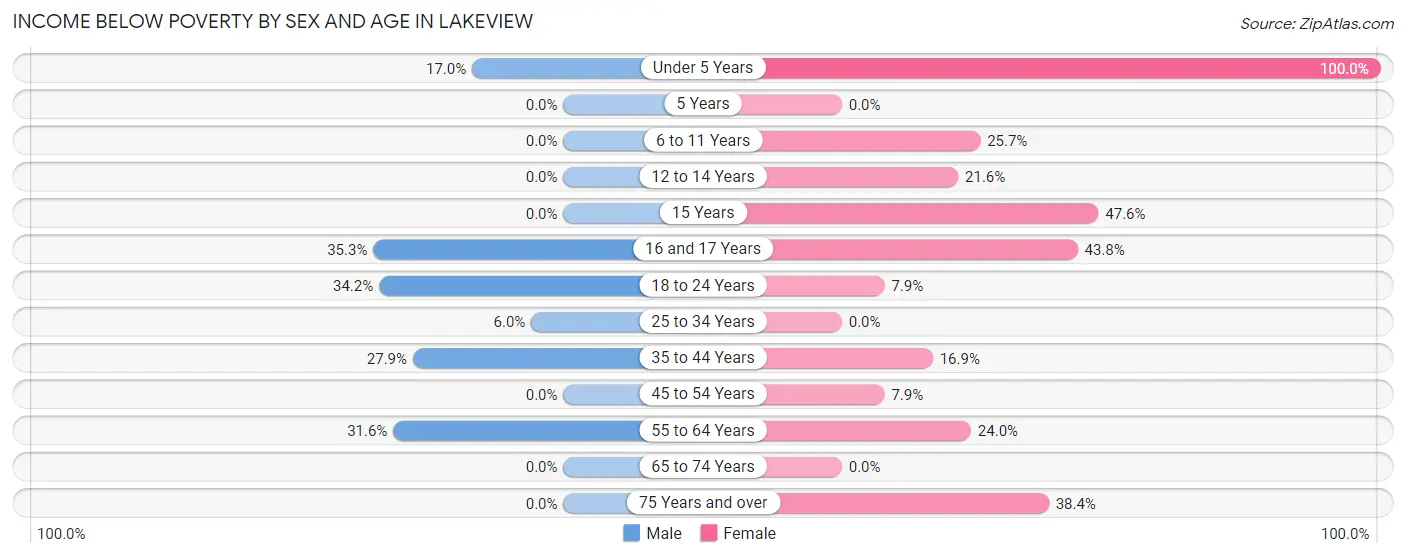
| Age Bracket | Male | Female |
| Under 5 Years | 10 (17.0%) | 56 (100.0%) |
| 5 Years | 0 (0.0%) | 0 (0.0%) |
| 6 to 11 Years | 0 (0.0%) | 28 (25.7%) |
| 12 to 14 Years | 0 (0.0%) | 38 (21.6%) |
| 15 Years | 0 (0.0%) | 20 (47.6%) |
| 16 and 17 Years | 12 (35.3%) | 28 (43.8%) |
| 18 to 24 Years | 26 (34.2%) | 8 (7.9%) |
| 25 to 34 Years | 8 (6.0%) | 0 (0.0%) |
| 35 to 44 Years | 31 (27.9%) | 26 (16.9%) |
| 45 to 54 Years | 0 (0.0%) | 8 (7.9%) |
| 55 to 64 Years | 30 (31.6%) | 23 (24.0%) |
| 65 to 74 Years | 0 (0.0%) | 0 (0.0%) |
| 75 Years and over | 0 (0.0%) | 48 (38.4%) |
| Total | 117 (11.8%) | 283 (22.0%) |
Income Above Poverty by Sex and Age in Lakeview
According to the poverty statistics in Lakeview, males aged 5 years and females aged 25 to 34 years are the age groups that are most secure financially, with 100.0% of males and 100.0% of females in these age groups living above the poverty line.
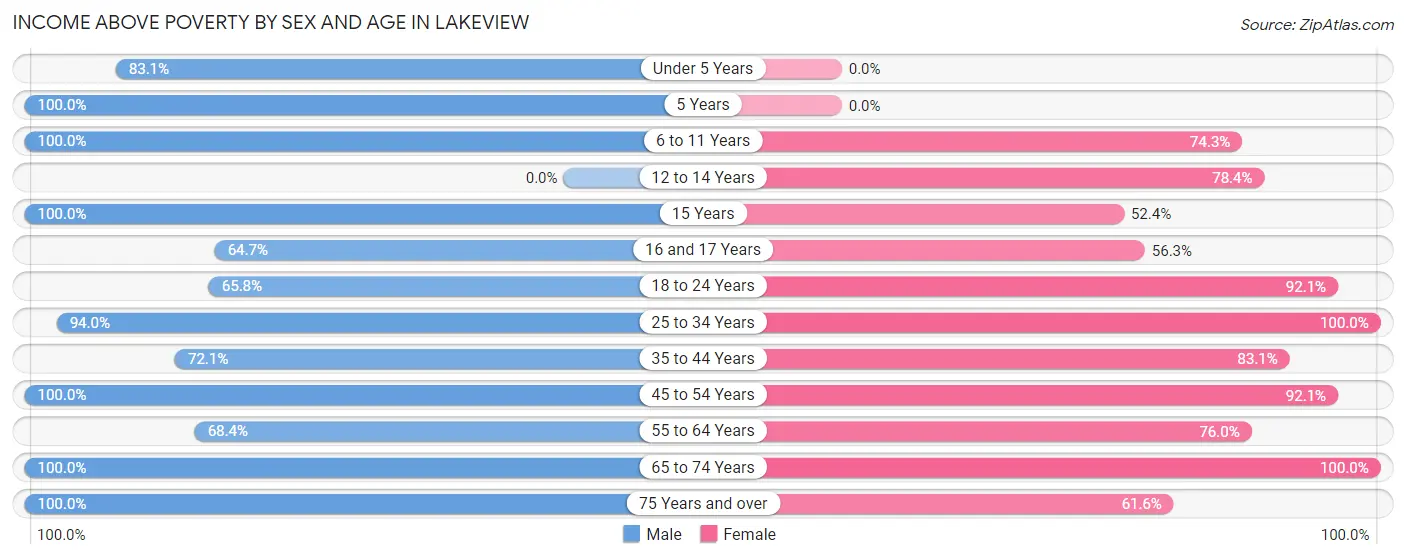
| Age Bracket | Male | Female |
| Under 5 Years | 49 (83.1%) | 0 (0.0%) |
| 5 Years | 13 (100.0%) | 0 (0.0%) |
| 6 to 11 Years | 90 (100.0%) | 81 (74.3%) |
| 12 to 14 Years | 0 (0.0%) | 138 (78.4%) |
| 15 Years | 8 (100.0%) | 22 (52.4%) |
| 16 and 17 Years | 22 (64.7%) | 36 (56.2%) |
| 18 to 24 Years | 50 (65.8%) | 93 (92.1%) |
| 25 to 34 Years | 126 (94.0%) | 172 (100.0%) |
| 35 to 44 Years | 80 (72.1%) | 128 (83.1%) |
| 45 to 54 Years | 195 (100.0%) | 93 (92.1%) |
| 55 to 64 Years | 65 (68.4%) | 73 (76.0%) |
| 65 to 74 Years | 63 (100.0%) | 91 (100.0%) |
| 75 Years and over | 110 (100.0%) | 77 (61.6%) |
| Total | 871 (88.2%) | 1,004 (78.0%) |
Income Below Poverty Among Married-Couple Families in Lakeview
The poverty statistics for married-couple families in Lakeview show that 8.5% or 34 of the total 398 families live below the poverty line. Families with 5 or more children have the highest poverty rate of 100.0%, comprising of 26 families. On the other hand, families with no children have the lowest poverty rate of 0.0%, which includes 0 families.
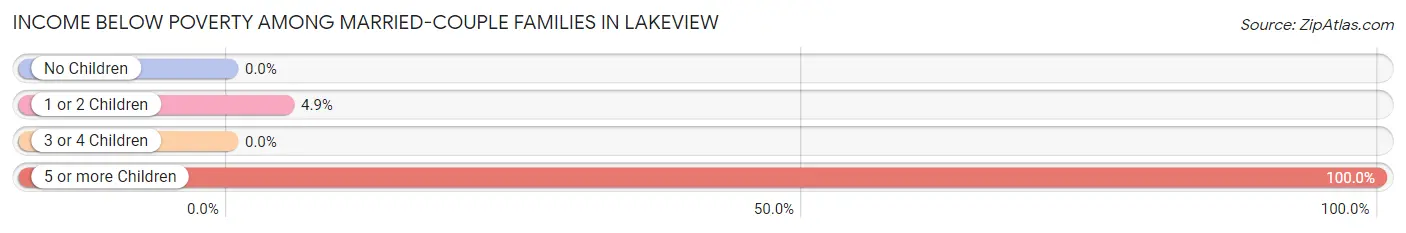
| Children | Above Poverty | Below Poverty |
| No Children | 152 (100.0%) | 0 (0.0%) |
| 1 or 2 Children | 156 (95.1%) | 8 (4.9%) |
| 3 or 4 Children | 56 (100.0%) | 0 (0.0%) |
| 5 or more Children | 0 (0.0%) | 26 (100.0%) |
| Total | 364 (91.5%) | 34 (8.5%) |
Income Below Poverty Among Single-Parent Households in Lakeview
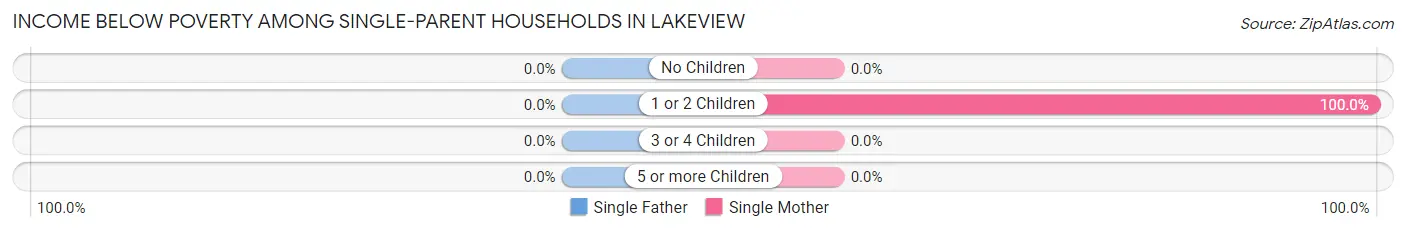
| Children | Single Father | Single Mother |
| No Children | 0 (0.0%) | 0 (0.0%) |
| 1 or 2 Children | 0 (0.0%) | 8 (100.0%) |
| 3 or 4 Children | 0 (0.0%) | 0 (0.0%) |
| 5 or more Children | 0 (0.0%) | 0 (0.0%) |
| Total | 0 (0.0%) | 8 (44.4%) |
Income Below Poverty Among Married-Couple vs Single-Parent Households in Lakeview
The poverty data for Lakeview shows that 34 of the married-couple family households (8.5%) and 8 of the single-parent households (14.8%) are living below the poverty level. Within the married-couple family households, those with 5 or more children have the highest poverty rate, with 26 households (100.0%) falling below the poverty line. Among the single-parent households, those with 1 or 2 children have the highest poverty rate, with 8 household (47.1%) living below poverty.
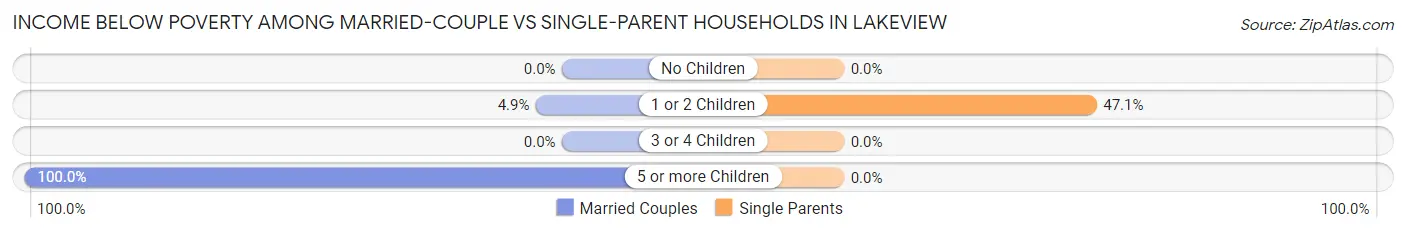
| Children | Married-Couple Families | Single-Parent Households |
| No Children | 0 (0.0%) | 0 (0.0%) |
| 1 or 2 Children | 8 (4.9%) | 8 (47.1%) |
| 3 or 4 Children | 0 (0.0%) | 0 (0.0%) |
| 5 or more Children | 26 (100.0%) | 0 (0.0%) |
| Total | 34 (8.5%) | 8 (14.8%) |
Race in Lakeview
The most populous races in Lakeview are Hispanic or Latino (1,738 | 74.7%), Some other Race (1,122 | 48.2%), and White / Caucasian (978 | 42.0%).
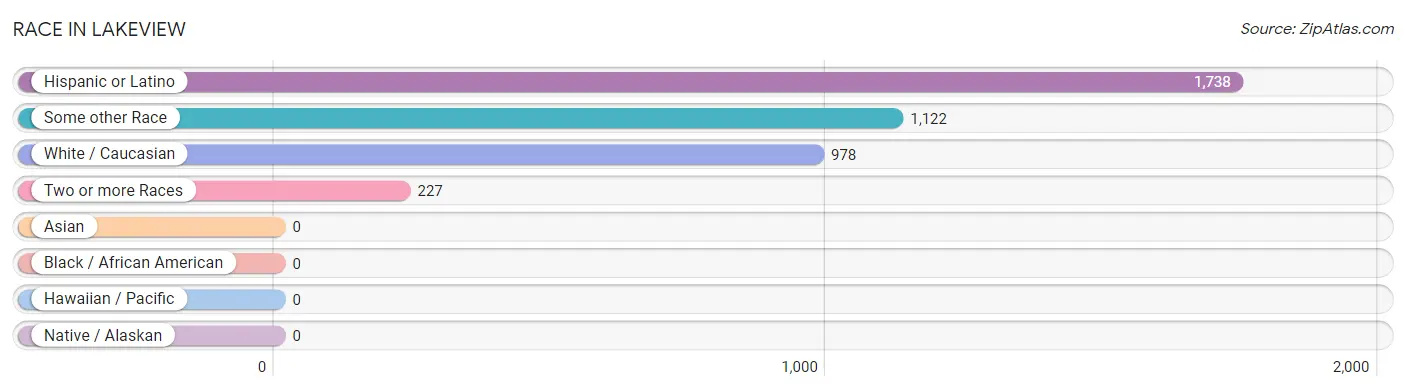
| Race | # Population | % Population |
| Asian | 0 | 0.0% |
| Black / African American | 0 | 0.0% |
| Hawaiian / Pacific | 0 | 0.0% |
| Hispanic or Latino | 1,738 | 74.7% |
| Native / Alaskan | 0 | 0.0% |
| White / Caucasian | 978 | 42.0% |
| Two or more Races | 227 | 9.8% |
| Some other Race | 1,122 | 48.2% |
| Total | 2,327 | 100.0% |
Ancestry in Lakeview
The most populous ancestries reported in Lakeview are Mexican (1,705 | 73.3%), Korean (85 | 3.6%), Irish (82 | 3.5%), German (80 | 3.4%), and English (48 | 2.1%), together accounting for 85.9% of all Lakeview residents.
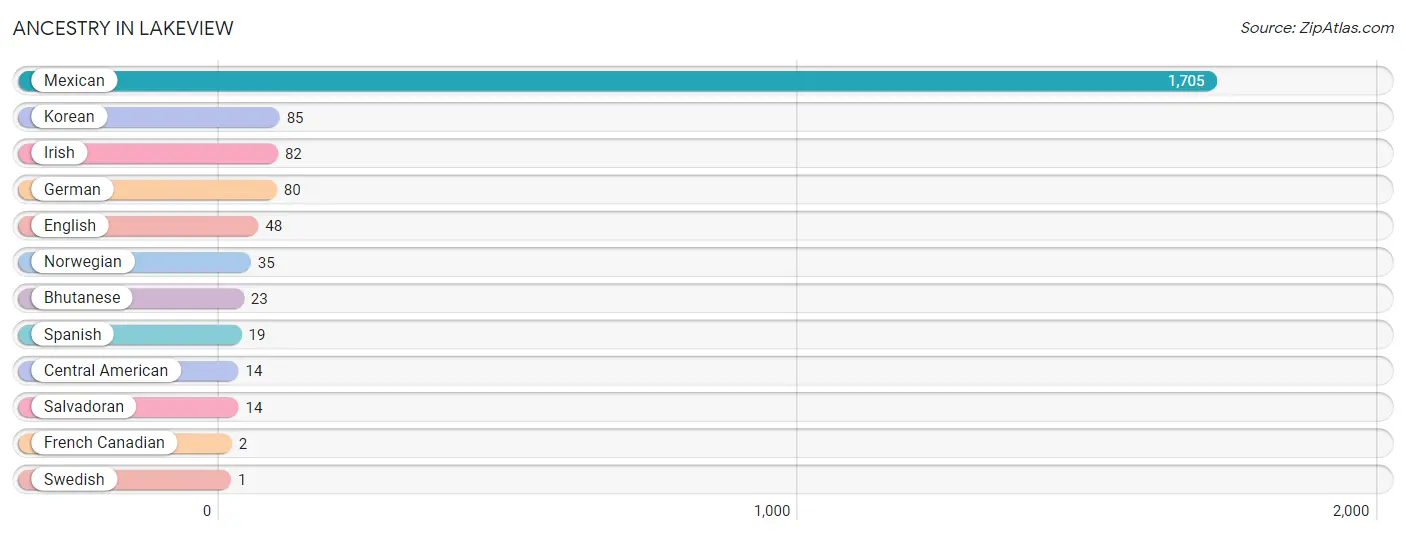
| Ancestry | # Population | % Population |
| Bhutanese | 23 | 1.0% |
| Central American | 14 | 0.6% |
| English | 48 | 2.1% |
| French Canadian | 2 | 0.1% |
| German | 80 | 3.4% |
| Irish | 82 | 3.5% |
| Korean | 85 | 3.6% |
| Mexican | 1,705 | 73.3% |
| Norwegian | 35 | 1.5% |
| Salvadoran | 14 | 0.6% |
| Spanish | 19 | 0.8% |
| Swedish | 1 | 0.0% | View All 12 Rows |
Immigrants in Lakeview
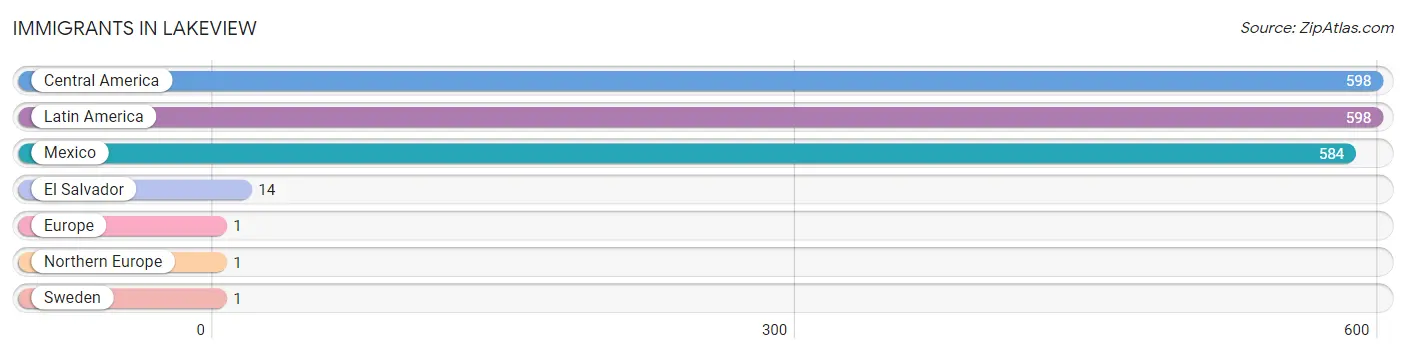
The most numerous immigrant groups reported in Lakeview came from Central America (598 | 25.7%), Latin America (598 | 25.7%), Mexico (584 | 25.1%), El Salvador (14 | 0.6%), and Europe (1 | 0.0%), together accounting for 77.1% of all Lakeview residents.
| Immigration Origin | # Population | % Population |
| Central America | 598 | 25.7% |
| El Salvador | 14 | 0.6% |
| Europe | 1 | 0.0% |
| Latin America | 598 | 25.7% |
| Mexico | 584 | 25.1% |
| Northern Europe | 1 | 0.0% |
| Sweden | 1 | 0.0% | View All 7 Rows |
Sex and Age in Lakeview
Sex and Age in Lakeview
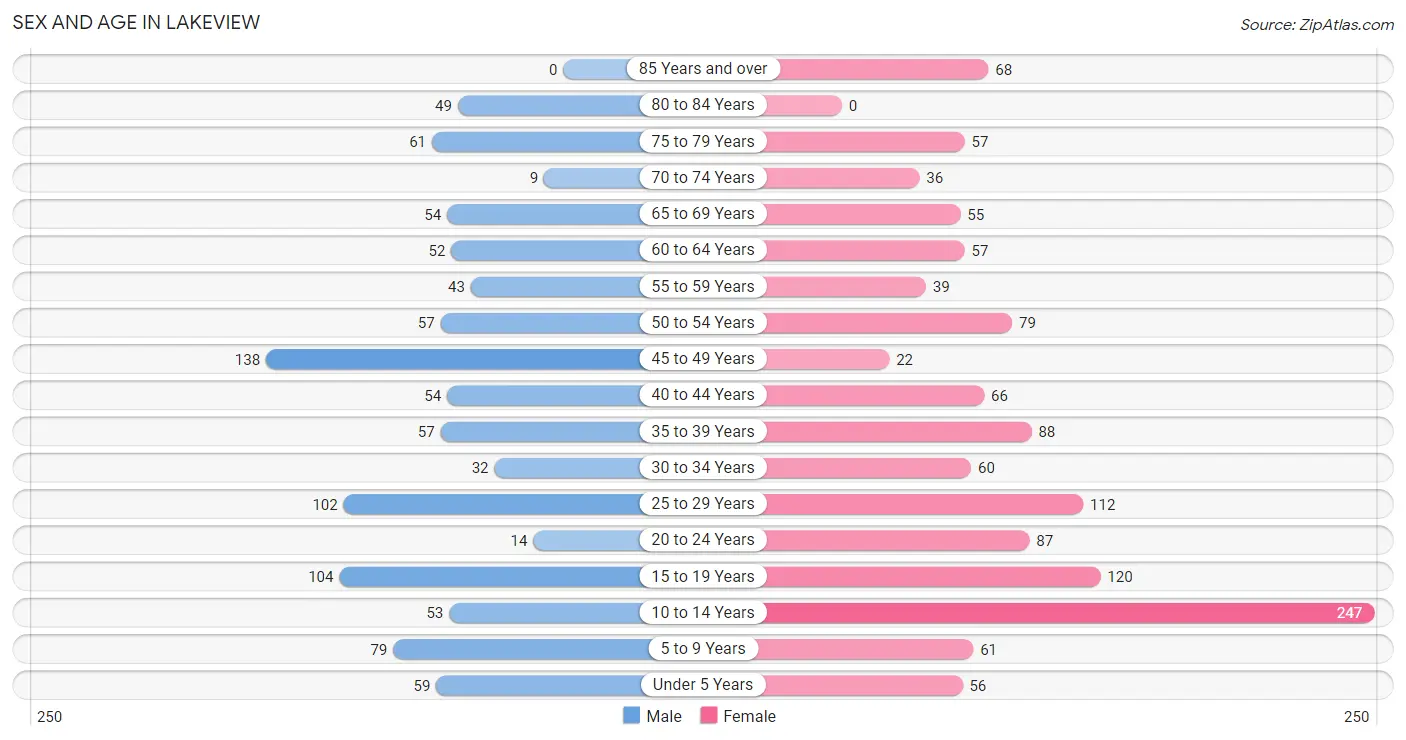
The most populous age groups in Lakeview are 45 to 49 Years (138 | 13.6%) for men and 10 to 14 Years (247 | 18.9%) for women.
| Age Bracket | Male | Female |
| Under 5 Years | 59 (5.8%) | 56 (4.3%) |
| 5 to 9 Years | 79 (7.8%) | 61 (4.7%) |
| 10 to 14 Years | 53 (5.2%) | 247 (18.9%) |
| 15 to 19 Years | 104 (10.2%) | 120 (9.2%) |
| 20 to 24 Years | 14 (1.4%) | 87 (6.6%) |
| 25 to 29 Years | 102 (10.0%) | 112 (8.6%) |
| 30 to 34 Years | 32 (3.2%) | 60 (4.6%) |
| 35 to 39 Years | 57 (5.6%) | 88 (6.7%) |
| 40 to 44 Years | 54 (5.3%) | 66 (5.0%) |
| 45 to 49 Years | 138 (13.6%) | 22 (1.7%) |
| 50 to 54 Years | 57 (5.6%) | 79 (6.0%) |
| 55 to 59 Years | 43 (4.2%) | 39 (3.0%) |
| 60 to 64 Years | 52 (5.1%) | 57 (4.3%) |
| 65 to 69 Years | 54 (5.3%) | 55 (4.2%) |
| 70 to 74 Years | 9 (0.9%) | 36 (2.8%) |
| 75 to 79 Years | 61 (6.0%) | 57 (4.3%) |
| 80 to 84 Years | 49 (4.8%) | 0 (0.0%) |
| 85 Years and over | 0 (0.0%) | 68 (5.2%) |
| Total | 1,017 (100.0%) | 1,310 (100.0%) |
Families and Households in Lakeview
Median Family Size in Lakeview
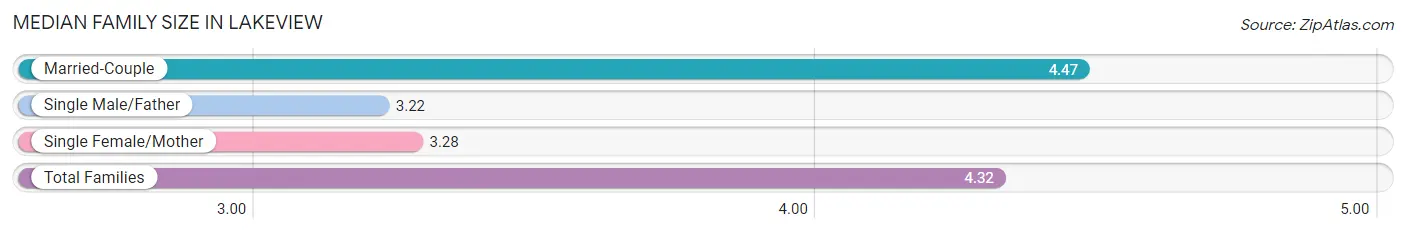
The median family size in Lakeview is 4.32 persons per family, with married-couple families (398 | 88.0%) accounting for the largest median family size of 4.47 persons per family. On the other hand, single male/father families (36 | 8.0%) represent the smallest median family size with 3.22 persons per family.
| Family Type | # Families | Family Size |
| Married-Couple | 398 (88.0%) | 4.47 |
| Single Male/Father | 36 (8.0%) | 3.22 |
| Single Female/Mother | 18 (4.0%) | 3.28 |
| Total Families | 452 (100.0%) | 4.32 |
Median Household Size in Lakeview
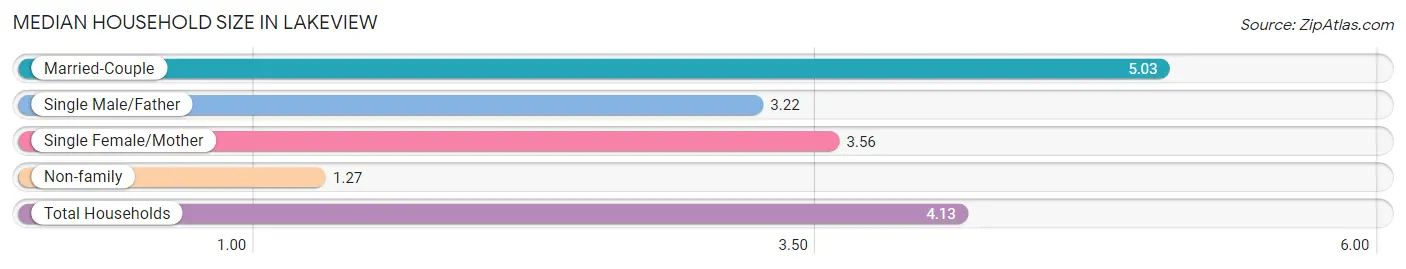
The median household size in Lakeview is 4.13 persons per household, with married-couple households (398 | 70.7%) accounting for the largest median household size of 5.03 persons per household. non-family households (111 | 19.7%) represent the smallest median household size with 1.27 persons per household.
| Household Type | # Households | Household Size |
| Married-Couple | 398 (70.7%) | 5.03 |
| Single Male/Father | 36 (6.4%) | 3.22 |
| Single Female/Mother | 18 (3.2%) | 3.56 |
| Non-family | 111 (19.7%) | 1.27 |
| Total Households | 563 (100.0%) | 4.13 |
Household Size by Marriage Status in Lakeview
Out of a total of 563 households in Lakeview, 452 (80.3%) are family households, while 111 (19.7%) are nonfamily households. The most numerous type of family households are 2-person households, comprising 121, and the most common type of nonfamily households are 1-person households, comprising 88.
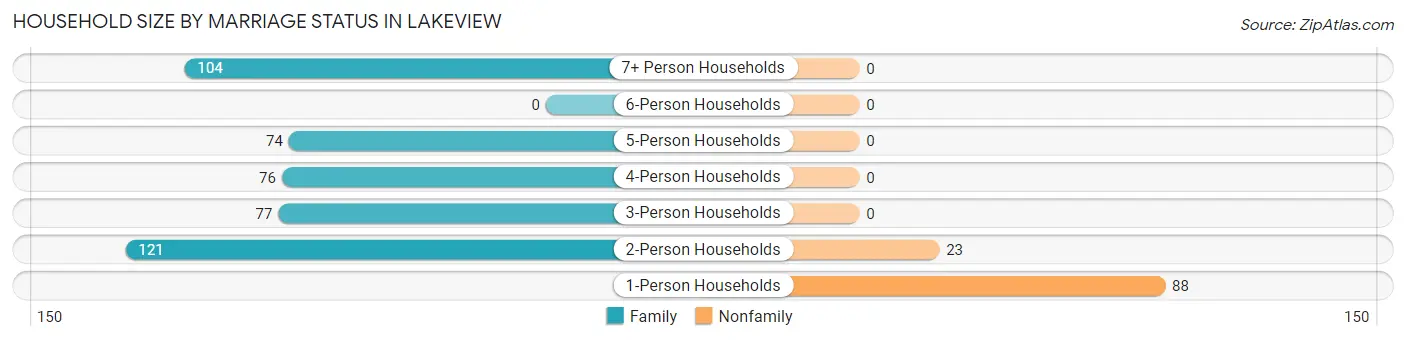
| Household Size | Family Households | Nonfamily Households |
| 1-Person Households | - | 88 (15.6%) |
| 2-Person Households | 121 (21.5%) | 23 (4.1%) |
| 3-Person Households | 77 (13.7%) | 0 (0.0%) |
| 4-Person Households | 76 (13.5%) | 0 (0.0%) |
| 5-Person Households | 74 (13.1%) | 0 (0.0%) |
| 6-Person Households | 0 (0.0%) | 0 (0.0%) |
| 7+ Person Households | 104 (18.5%) | 0 (0.0%) |
| Total | 452 (80.3%) | 111 (19.7%) |
Female Fertility in Lakeview
Fertility by Age in Lakeview
Average fertility rate in Lakeview is 57.0 births per 1,000 women. Women in the age bracket of 35 to 50 years have the highest fertility rate with 118.0 births per 1,000 women. Women in the age bracket of 35 to 50 years acount for 76.5% of all women with births.
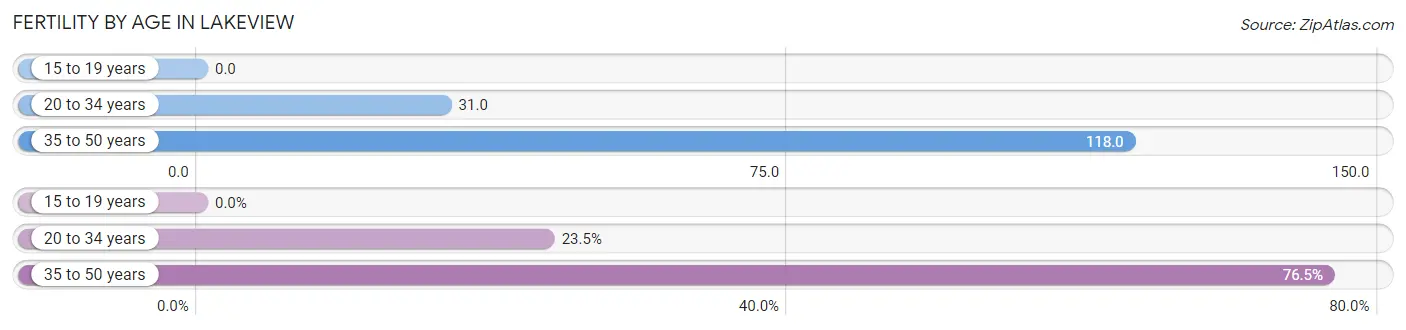
| Age Bracket | Women with Births | Births / 1,000 Women |
| 15 to 19 years | 0 (0.0%) | 0.0 |
| 20 to 34 years | 8 (23.5%) | 31.0 |
| 35 to 50 years | 26 (76.5%) | 118.0 |
| Total | 34 (100.0%) | 57.0 |
Fertility by Age by Marriage Status in Lakeview
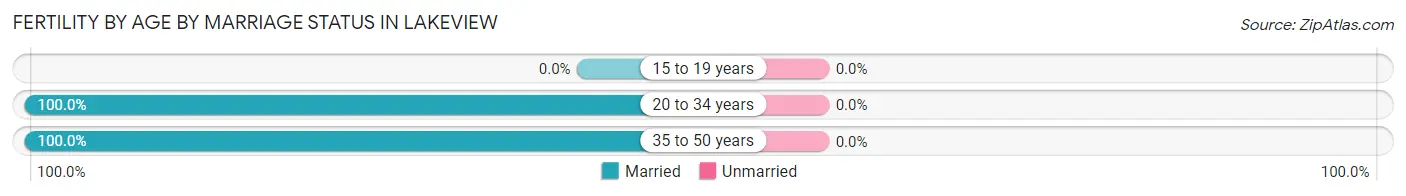
| Age Bracket | Married | Unmarried |
| 15 to 19 years | 0 (0.0%) | 0 (0.0%) |
| 20 to 34 years | 8 (100.0%) | 0 (0.0%) |
| 35 to 50 years | 26 (100.0%) | 0 (0.0%) |
| Total | 34 (100.0%) | 0 (0.0%) |
Fertility by Education in Lakeview
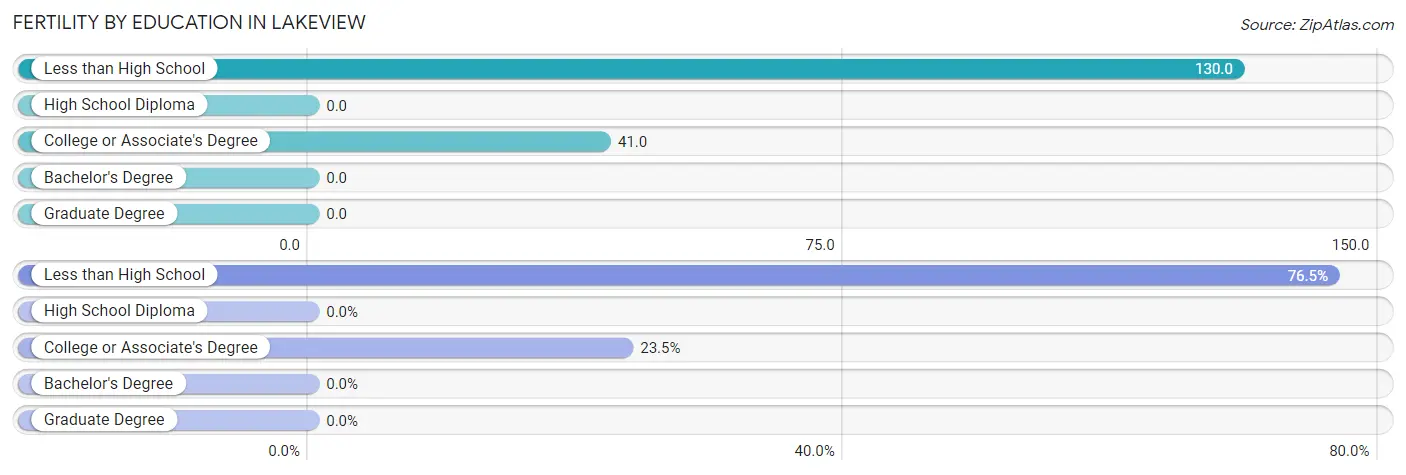
| Educational Attainment | Women with Births | Births / 1,000 Women |
| Less than High School | 26 (76.5%) | 130.0 |
| High School Diploma | 0 (0.0%) | 0.0 |
| College or Associate's Degree | 8 (23.5%) | 41.0 |
| Bachelor's Degree | 0 (0.0%) | 0.0 |
| Graduate Degree | 0 (0.0%) | 0.0 |
| Total | 34 (100.0%) | 57.0 |
Fertility by Education by Marriage Status in Lakeview
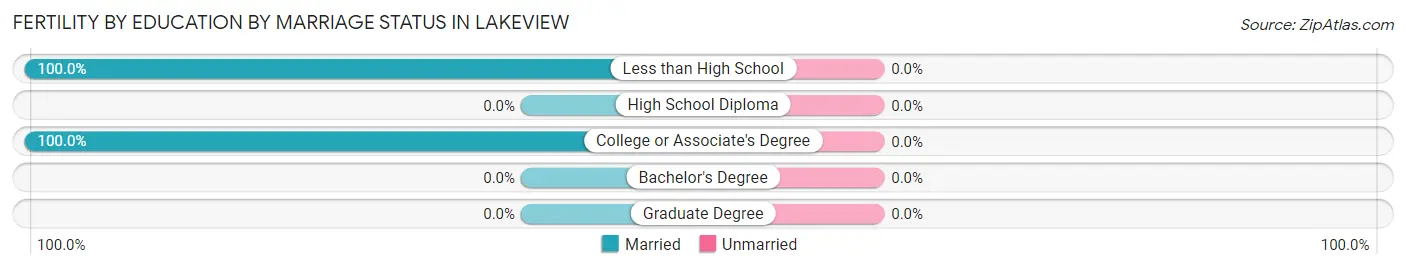
| Educational Attainment | Married | Unmarried |
| Less than High School | 26 (100.0%) | 0 (0.0%) |
| High School Diploma | 0 (0.0%) | 0 (0.0%) |
| College or Associate's Degree | 8 (100.0%) | 0 (0.0%) |
| Bachelor's Degree | 0 (0.0%) | 0 (0.0%) |
| Graduate Degree | 0 (0.0%) | 0 (0.0%) |
| Total | 34 (100.0%) | 0 (0.0%) |
Employment Characteristics in Lakeview
Employment by Class of Employer in Lakeview
Among the 954 employed individuals in Lakeview, private company employees (693 | 72.6%), local government employees (157 | 16.5%), and state government employees (79 | 8.3%) make up the most common classes of employment.
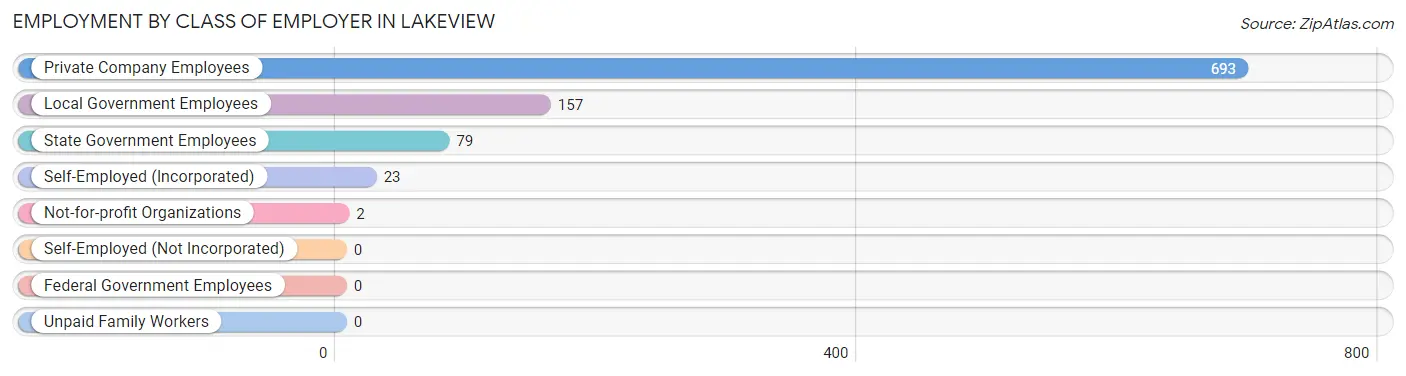
| Employer Class | # Employees | % Employees |
| Private Company Employees | 693 | 72.6% |
| Self-Employed (Incorporated) | 23 | 2.4% |
| Self-Employed (Not Incorporated) | 0 | 0.0% |
| Not-for-profit Organizations | 2 | 0.2% |
| Local Government Employees | 157 | 16.5% |
| State Government Employees | 79 | 8.3% |
| Federal Government Employees | 0 | 0.0% |
| Unpaid Family Workers | 0 | 0.0% |
| Total | 954 | 100.0% |
Employment Status by Age in Lakeview
According to the labor force statistics for Lakeview, out of the total population over 16 years of age (1,722), 60.7% or 1,045 individuals are in the labor force, with 5.0% or 52 of them unemployed. The age group with the highest labor force participation rate is 20 to 24 years, with 100.0% or 101 individuals in the labor force. Within the labor force, the 65 to 74 years age range has the highest percentage of unemployed individuals, with 80.4% or 41 of them being unemployed.
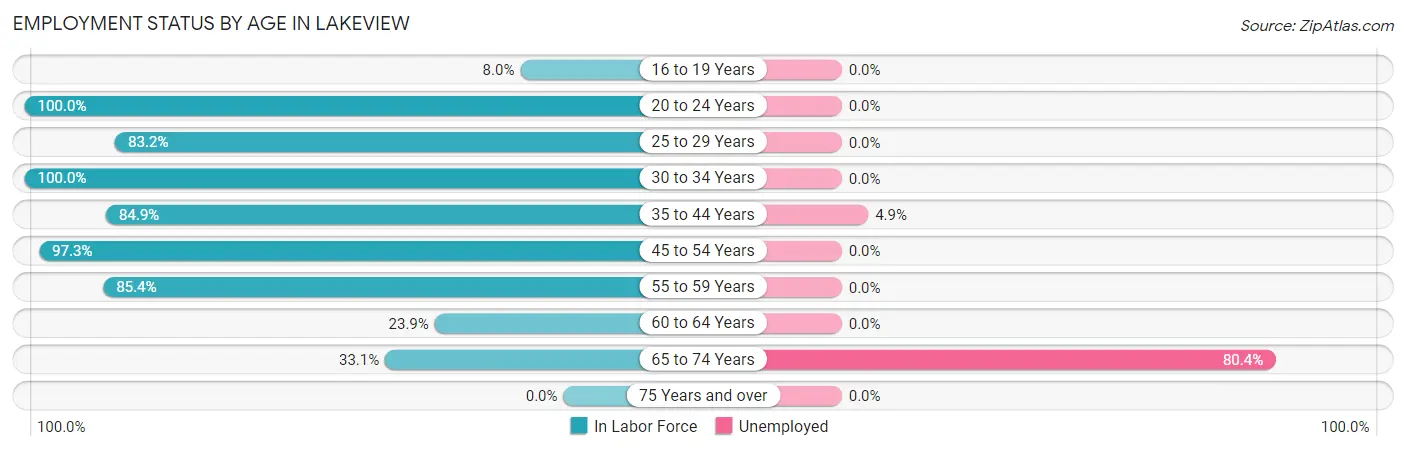
| Age Bracket | In Labor Force | Unemployed |
| 16 to 19 Years | 14 (8.0%) | 0 (0.0%) |
| 20 to 24 Years | 101 (100.0%) | 0 (0.0%) |
| 25 to 29 Years | 178 (83.2%) | 0 (0.0%) |
| 30 to 34 Years | 92 (100.0%) | 0 (0.0%) |
| 35 to 44 Years | 225 (84.9%) | 11 (4.9%) |
| 45 to 54 Years | 288 (97.3%) | 0 (0.0%) |
| 55 to 59 Years | 70 (85.4%) | 0 (0.0%) |
| 60 to 64 Years | 26 (23.9%) | 0 (0.0%) |
| 65 to 74 Years | 51 (33.1%) | 41 (80.4%) |
| 75 Years and over | 0 (0.0%) | 0 (0.0%) |
| Total | 1,045 (60.7%) | 52 (5.0%) |
Employment Status by Educational Attainment in Lakeview
According to labor force statistics for Lakeview, 83.1% of individuals (879) out of the total population between 25 and 64 years of age (1,058) are in the labor force, with 1.3% or 11 of them being unemployed. The group with the highest labor force participation rate are those with the educational attainment of less than high school, with 92.2% or 307 individuals in the labor force. Within the labor force, individuals with college / associate degree education have the highest percentage of unemployment, with 9.0% or 11 of them being unemployed.
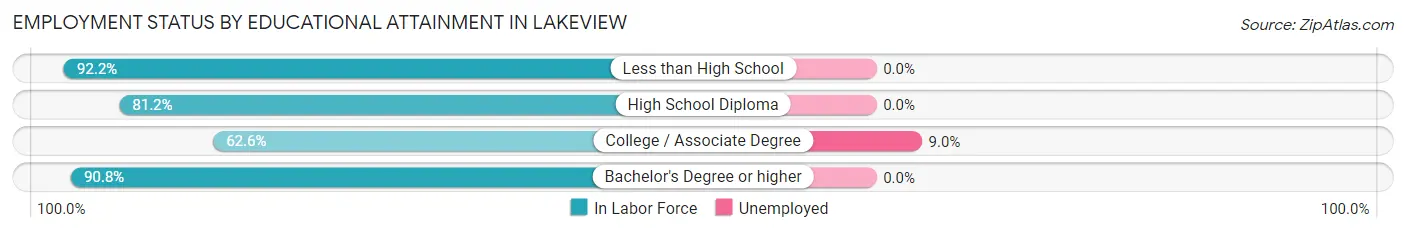
| Educational Attainment | In Labor Force | Unemployed |
| Less than High School | 307 (92.2%) | 0 (0.0%) |
| High School Diploma | 263 (81.2%) | 0 (0.0%) |
| College / Associate Degree | 122 (62.6%) | 18 (9.0%) |
| Bachelor's Degree or higher | 187 (90.8%) | 0 (0.0%) |
| Total | 879 (83.1%) | 14 (1.3%) |
Employment Occupations by Sex in Lakeview
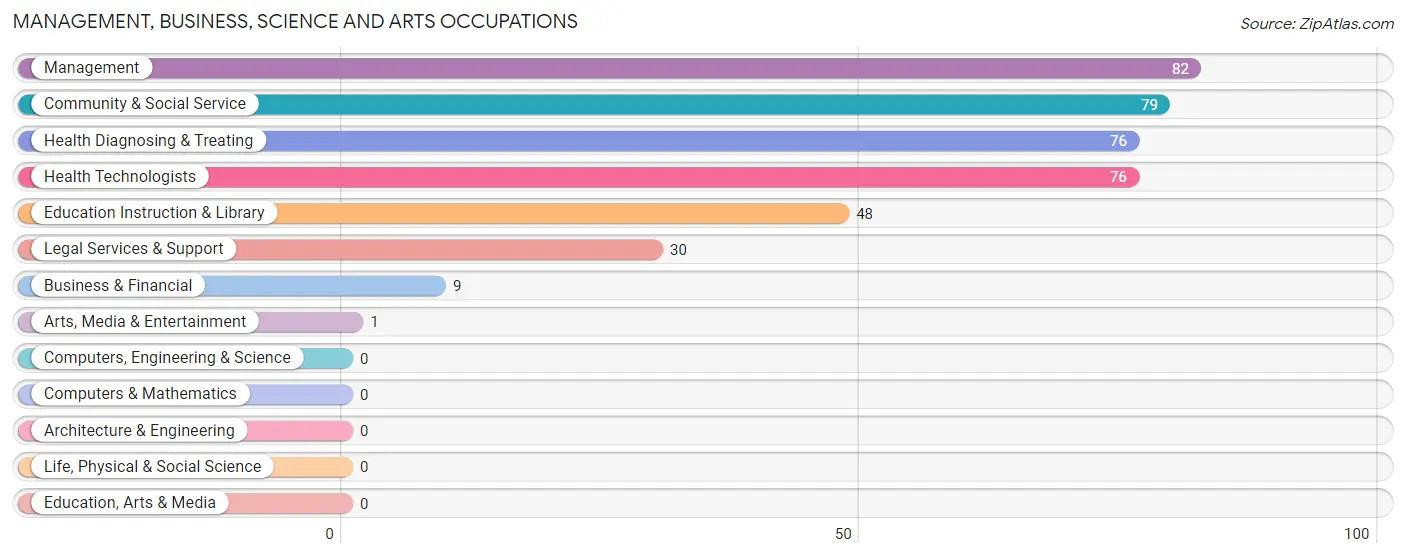
Management, Business, Science and Arts Occupations
The most common Management, Business, Science and Arts occupations in Lakeview are Management (82 | 8.3%), Community & Social Service (79 | 8.0%), Health Diagnosing & Treating (76 | 7.6%), Health Technologists (76 | 7.6%), and Education Instruction & Library (48 | 4.8%).
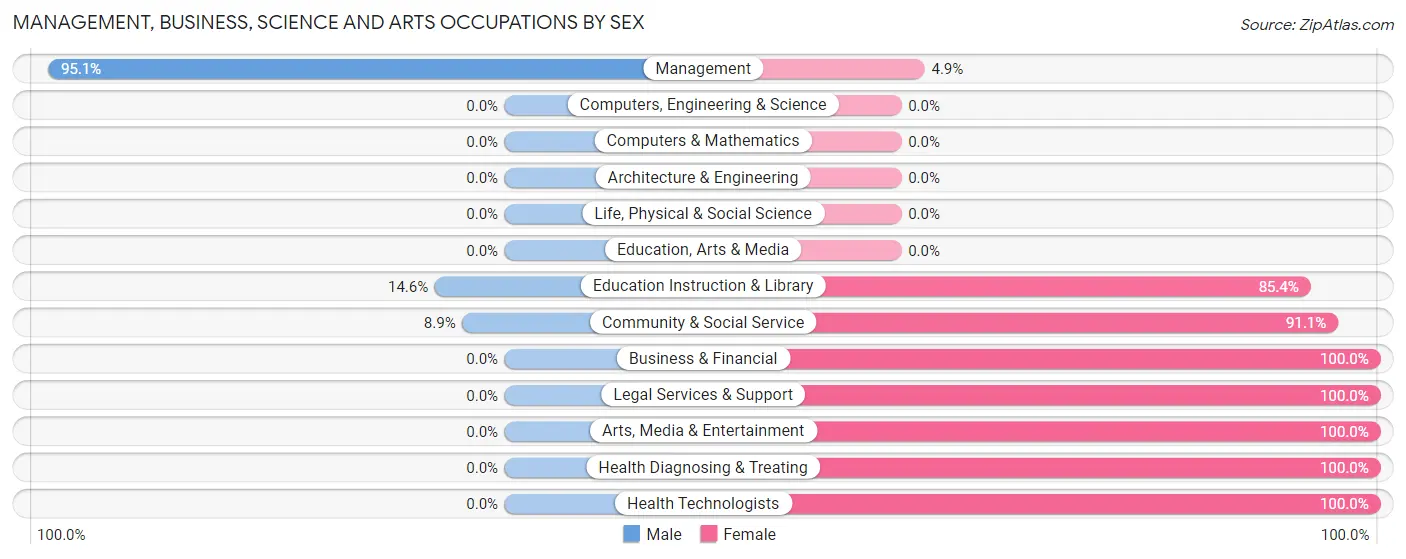
Management, Business, Science and Arts Occupations by Sex
Within the Management, Business, Science and Arts occupations in Lakeview, the most male-oriented occupations are Management (95.1%), Education Instruction & Library (14.6%), and Community & Social Service (8.9%), while the most female-oriented occupations are Business & Financial (100.0%), Legal Services & Support (100.0%), and Arts, Media & Entertainment (100.0%).
| Occupation | Male | Female |
| Management | 78 (95.1%) | 4 (4.9%) |
| Business & Financial | 0 (0.0%) | 9 (100.0%) |
| Computers, Engineering & Science | 0 (0.0%) | 0 (0.0%) |
| Computers & Mathematics | 0 (0.0%) | 0 (0.0%) |
| Architecture & Engineering | 0 (0.0%) | 0 (0.0%) |
| Life, Physical & Social Science | 0 (0.0%) | 0 (0.0%) |
| Community & Social Service | 7 (8.9%) | 72 (91.1%) |
| Education, Arts & Media | 0 (0.0%) | 0 (0.0%) |
| Legal Services & Support | 0 (0.0%) | 30 (100.0%) |
| Education Instruction & Library | 7 (14.6%) | 41 (85.4%) |
| Arts, Media & Entertainment | 0 (0.0%) | 1 (100.0%) |
| Health Diagnosing & Treating | 0 (0.0%) | 76 (100.0%) |
| Health Technologists | 0 (0.0%) | 76 (100.0%) |
| Total (Category) | 85 (34.5%) | 161 (65.4%) |
| Total (Overall) | 512 (51.6%) | 481 (48.4%) |
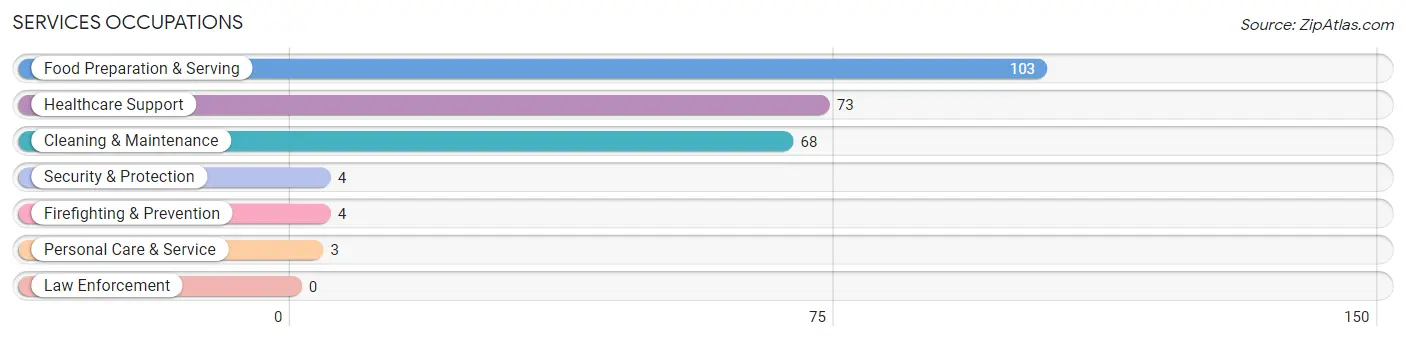
Services Occupations
The most common Services occupations in Lakeview are Food Preparation & Serving (103 | 10.4%), Healthcare Support (73 | 7.3%), Cleaning & Maintenance (68 | 6.9%), Security & Protection (4 | 0.4%), and Firefighting & Prevention (4 | 0.4%).
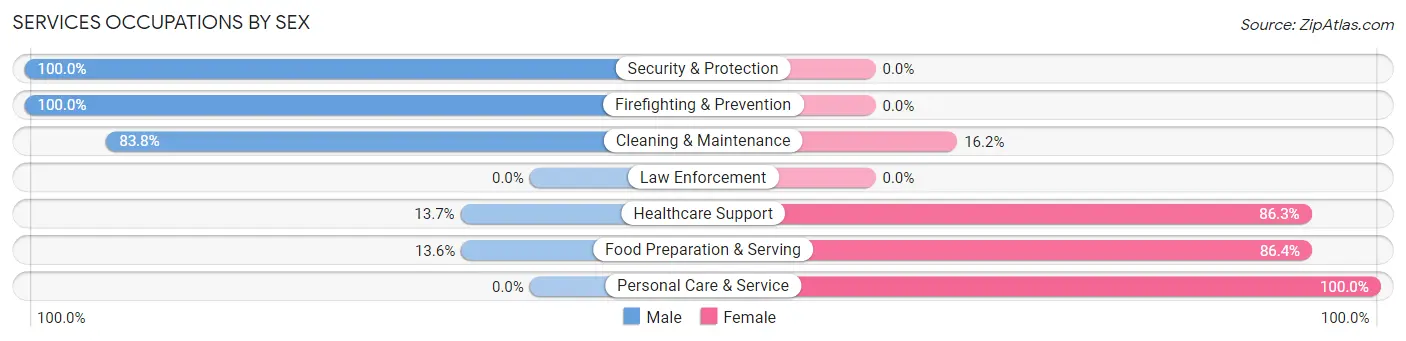
Services Occupations by Sex
Within the Services occupations in Lakeview, the most male-oriented occupations are Security & Protection (100.0%), Firefighting & Prevention (100.0%), and Cleaning & Maintenance (83.8%), while the most female-oriented occupations are Personal Care & Service (100.0%), Food Preparation & Serving (86.4%), and Healthcare Support (86.3%).
| Occupation | Male | Female |
| Healthcare Support | 10 (13.7%) | 63 (86.3%) |
| Security & Protection | 4 (100.0%) | 0 (0.0%) |
| Firefighting & Prevention | 4 (100.0%) | 0 (0.0%) |
| Law Enforcement | 0 (0.0%) | 0 (0.0%) |
| Food Preparation & Serving | 14 (13.6%) | 89 (86.4%) |
| Cleaning & Maintenance | 57 (83.8%) | 11 (16.2%) |
| Personal Care & Service | 0 (0.0%) | 3 (100.0%) |
| Total (Category) | 85 (33.9%) | 166 (66.1%) |
| Total (Overall) | 512 (51.6%) | 481 (48.4%) |
Sales and Office Occupations
The most common Sales and Office occupations in Lakeview are Sales & Related (50 | 5.0%), and Office & Administration (45 | 4.5%).
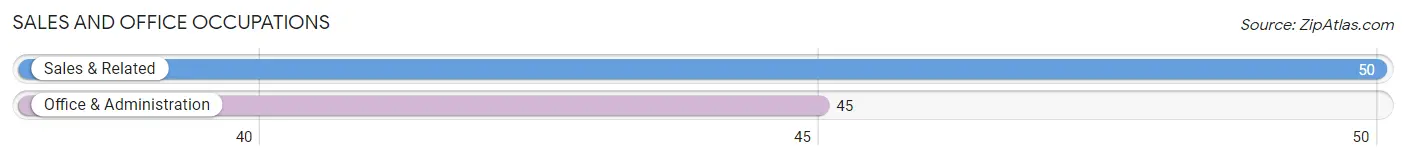
Sales and Office Occupations by Sex

| Occupation | Male | Female |
| Sales & Related | 27 (54.0%) | 23 (46.0%) |
| Office & Administration | 0 (0.0%) | 45 (100.0%) |
| Total (Category) | 27 (28.4%) | 68 (71.6%) |
| Total (Overall) | 512 (51.6%) | 481 (48.4%) |
Natural Resources, Construction and Maintenance Occupations
The most common Natural Resources, Construction and Maintenance occupations in Lakeview are , and Construction & Extraction (162 | 16.3%).
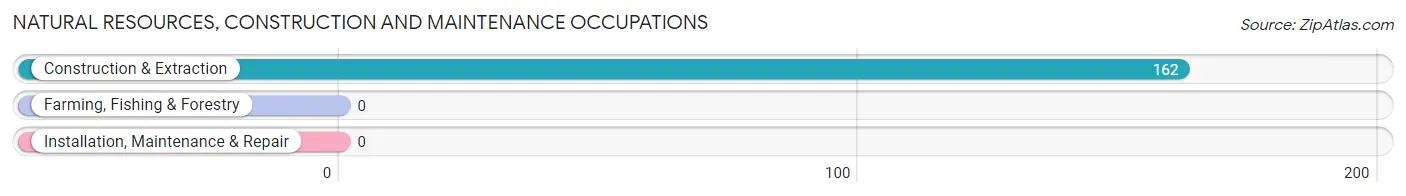
Natural Resources, Construction and Maintenance Occupations by Sex

| Occupation | Male | Female |
| Farming, Fishing & Forestry | 0 (0.0%) | 0 (0.0%) |
| Construction & Extraction | 162 (100.0%) | 0 (0.0%) |
| Installation, Maintenance & Repair | 0 (0.0%) | 0 (0.0%) |
| Total (Category) | 162 (100.0%) | 0 (0.0%) |
| Total (Overall) | 512 (51.6%) | 481 (48.4%) |
Production, Transportation and Moving Occupations
The most common Production, Transportation and Moving occupations in Lakeview are Production (87 | 8.8%), Transportation (83 | 8.4%), and Material Moving (69 | 7.0%).
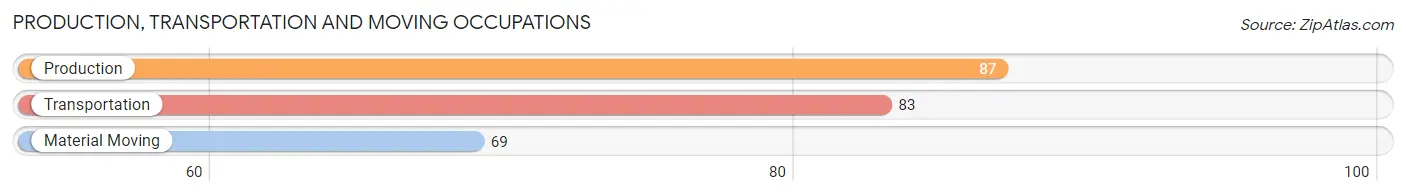
Production, Transportation and Moving Occupations by Sex
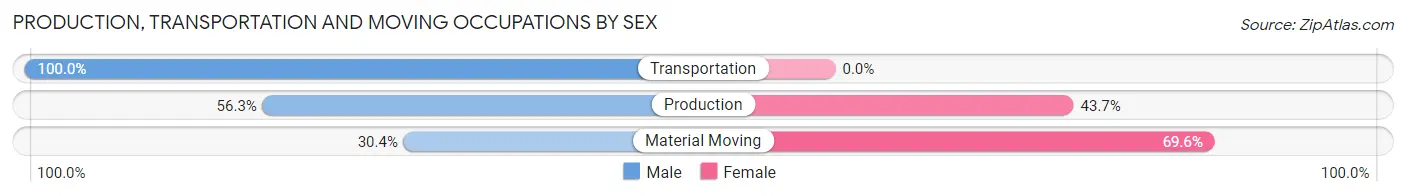
| Occupation | Male | Female |
| Production | 49 (56.3%) | 38 (43.7%) |
| Transportation | 83 (100.0%) | 0 (0.0%) |
| Material Moving | 21 (30.4%) | 48 (69.6%) |
| Total (Category) | 153 (64.0%) | 86 (36.0%) |
| Total (Overall) | 512 (51.6%) | 481 (48.4%) |
Employment Industries by Sex in Lakeview
Employment Industries in Lakeview
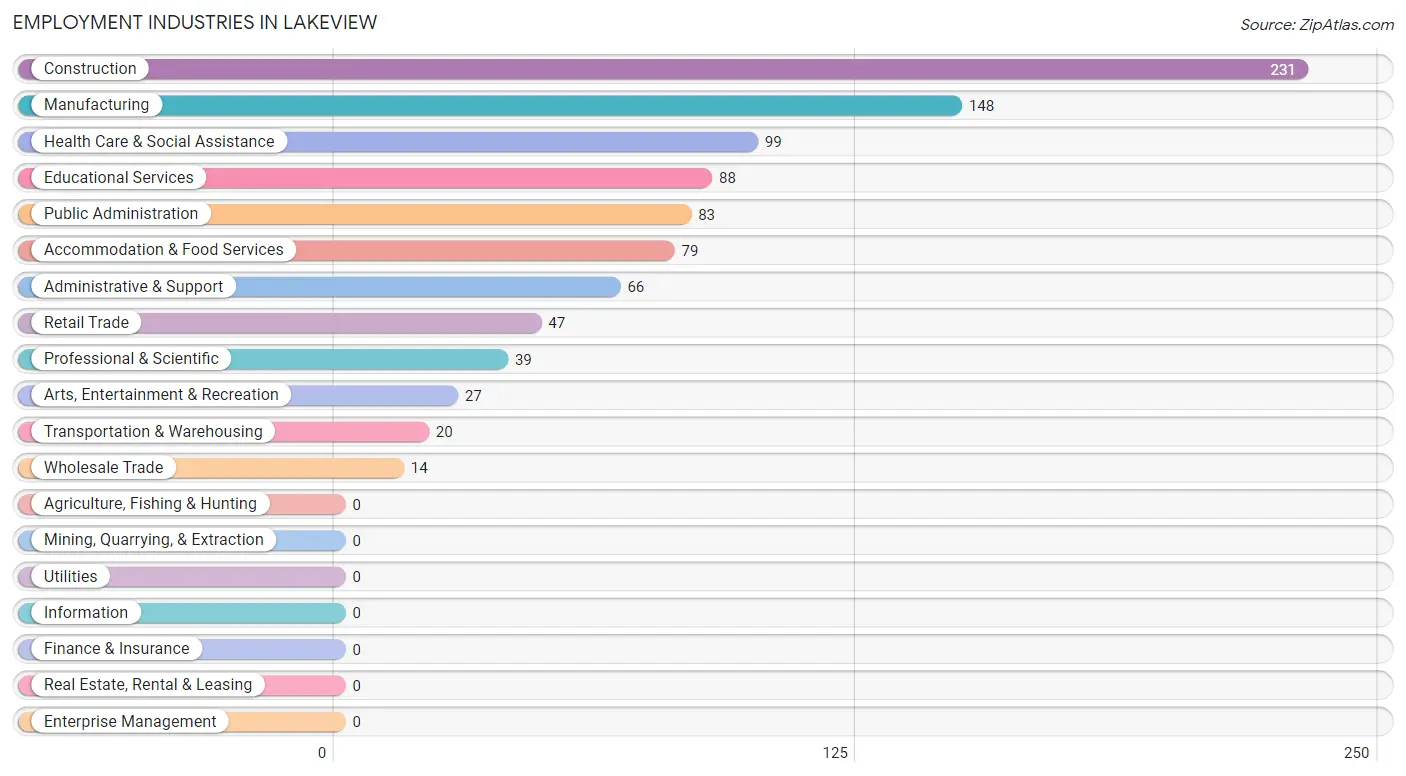
The major employment industries in Lakeview include Construction (231 | 23.3%), Manufacturing (148 | 14.9%), Health Care & Social Assistance (99 | 10.0%), Educational Services (88 | 8.9%), and Public Administration (83 | 8.4%).
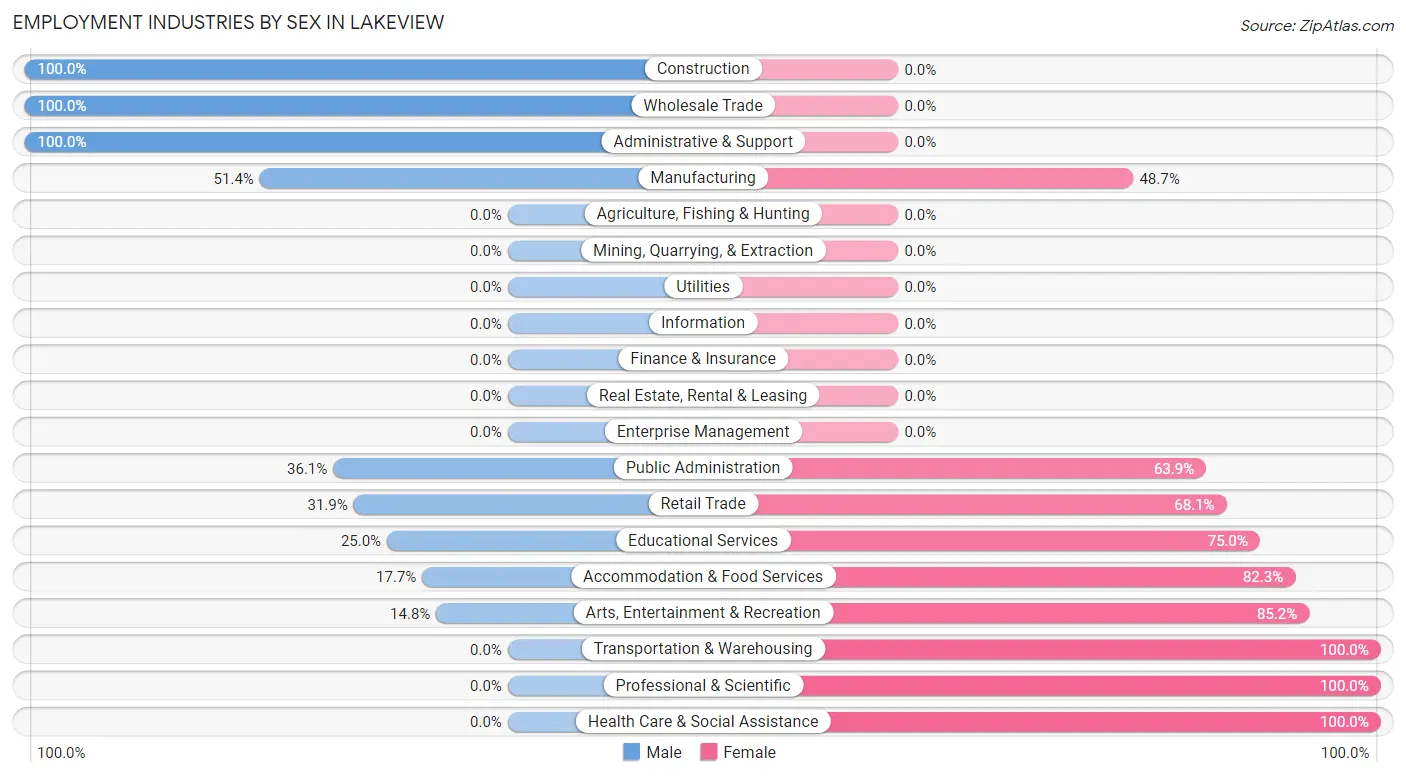
Employment Industries by Sex in Lakeview
The Lakeview industries that see more men than women are Construction (100.0%), Wholesale Trade (100.0%), and Administrative & Support (100.0%), whereas the industries that tend to have a higher number of women are Transportation & Warehousing (100.0%), Professional & Scientific (100.0%), and Health Care & Social Assistance (100.0%).
| Industry | Male | Female |
| Agriculture, Fishing & Hunting | 0 (0.0%) | 0 (0.0%) |
| Mining, Quarrying, & Extraction | 0 (0.0%) | 0 (0.0%) |
| Construction | 231 (100.0%) | 0 (0.0%) |
| Manufacturing | 76 (51.3%) | 72 (48.6%) |
| Wholesale Trade | 14 (100.0%) | 0 (0.0%) |
| Retail Trade | 15 (31.9%) | 32 (68.1%) |
| Transportation & Warehousing | 0 (0.0%) | 20 (100.0%) |
| Utilities | 0 (0.0%) | 0 (0.0%) |
| Information | 0 (0.0%) | 0 (0.0%) |
| Finance & Insurance | 0 (0.0%) | 0 (0.0%) |
| Real Estate, Rental & Leasing | 0 (0.0%) | 0 (0.0%) |
| Professional & Scientific | 0 (0.0%) | 39 (100.0%) |
| Enterprise Management | 0 (0.0%) | 0 (0.0%) |
| Administrative & Support | 66 (100.0%) | 0 (0.0%) |
| Educational Services | 22 (25.0%) | 66 (75.0%) |
| Health Care & Social Assistance | 0 (0.0%) | 99 (100.0%) |
| Arts, Entertainment & Recreation | 4 (14.8%) | 23 (85.2%) |
| Accommodation & Food Services | 14 (17.7%) | 65 (82.3%) |
| Public Administration | 30 (36.1%) | 53 (63.9%) |
| Total | 512 (51.6%) | 481 (48.4%) |
Education in Lakeview
School Enrollment in Lakeview
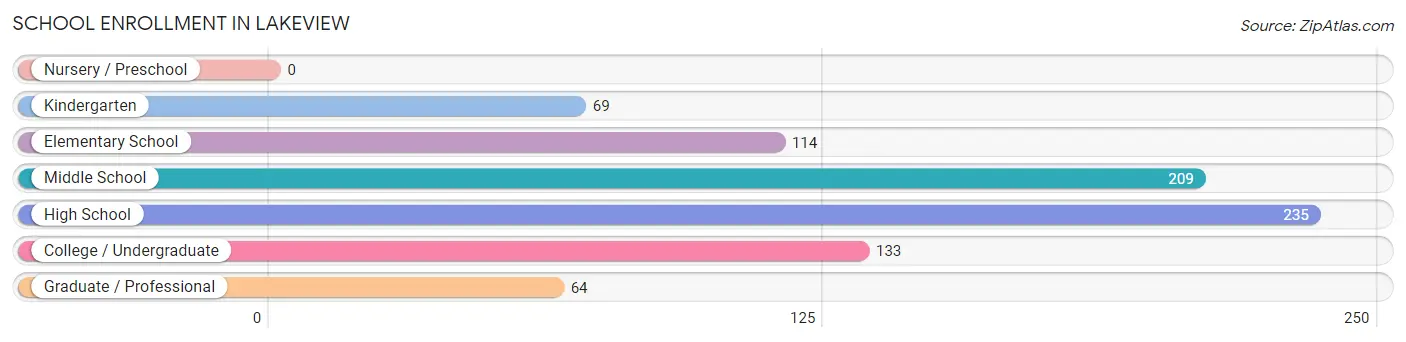
The most common levels of schooling among the 824 students in Lakeview are high school (235 | 28.5%), middle school (209 | 25.4%), and college / undergraduate (133 | 16.1%).
| School Level | # Students | % Students |
| Nursery / Preschool | 0 | 0.0% |
| Kindergarten | 69 | 8.4% |
| Elementary School | 114 | 13.8% |
| Middle School | 209 | 25.4% |
| High School | 235 | 28.5% |
| College / Undergraduate | 133 | 16.1% |
| Graduate / Professional | 64 | 7.8% |
| Total | 824 | 100.0% |
School Enrollment by Age by Funding Source in Lakeview
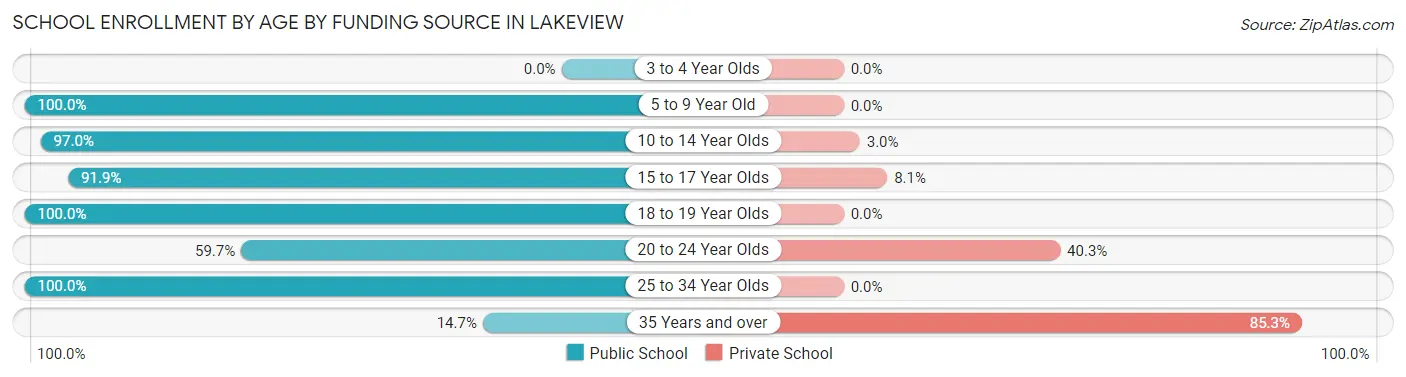
Out of a total of 824 students who are enrolled in schools in Lakeview, 110 (13.3%) attend a private institution, while the remaining 714 (86.7%) are enrolled in public schools. The age group of 35 years and over has the highest likelihood of being enrolled in private schools, with 64 (85.3% in the age bracket) enrolled. Conversely, the age group of 5 to 9 year old has the lowest likelihood of being enrolled in a private school, with 140 (100.0% in the age bracket) attending a public institution.
| Age Bracket | Public School | Private School |
| 3 to 4 Year Olds | 0 (0.0%) | 0 (0.0%) |
| 5 to 9 Year Old | 140 (100.0%) | 0 (0.0%) |
| 10 to 14 Year Olds | 291 (97.0%) | 9 (3.0%) |
| 15 to 17 Year Olds | 136 (91.9%) | 12 (8.1%) |
| 18 to 19 Year Olds | 76 (100.0%) | 0 (0.0%) |
| 20 to 24 Year Olds | 37 (59.7%) | 25 (40.3%) |
| 25 to 34 Year Olds | 23 (100.0%) | 0 (0.0%) |
| 35 Years and over | 11 (14.7%) | 64 (85.3%) |
| Total | 714 (86.7%) | 110 (13.3%) |
Educational Attainment by Field of Study in Lakeview
Psychology (77 | 34.1%), social sciences (50 | 22.1%), bio, nature & agricultural (44 | 19.5%), physical & health sciences (30 | 13.3%), and communications (20 | 8.8%) are the most common fields of study among 226 individuals in Lakeview who have obtained a bachelor's degree or higher.
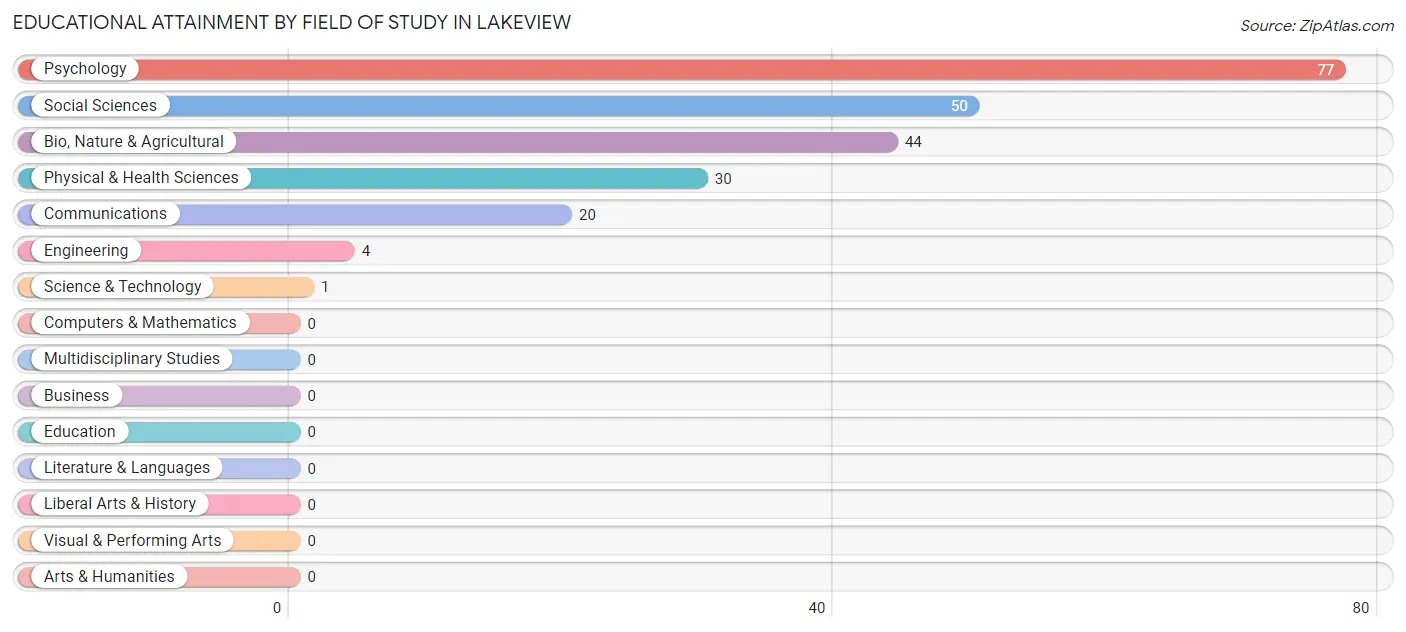
| Field of Study | # Graduates | % Graduates |
| Computers & Mathematics | 0 | 0.0% |
| Bio, Nature & Agricultural | 44 | 19.5% |
| Physical & Health Sciences | 30 | 13.3% |
| Psychology | 77 | 34.1% |
| Social Sciences | 50 | 22.1% |
| Engineering | 4 | 1.8% |
| Multidisciplinary Studies | 0 | 0.0% |
| Science & Technology | 1 | 0.4% |
| Business | 0 | 0.0% |
| Education | 0 | 0.0% |
| Literature & Languages | 0 | 0.0% |
| Liberal Arts & History | 0 | 0.0% |
| Visual & Performing Arts | 0 | 0.0% |
| Communications | 20 | 8.8% |
| Arts & Humanities | 0 | 0.0% |
| Total | 226 | 100.0% |
Transportation & Commute in Lakeview
Vehicle Availability by Sex in Lakeview
The most prevalent vehicle ownership categories in Lakeview are males with 4 vehicles (180, accounting for 37.4%) and females with 4 vehicles (140, making up 38.2%).
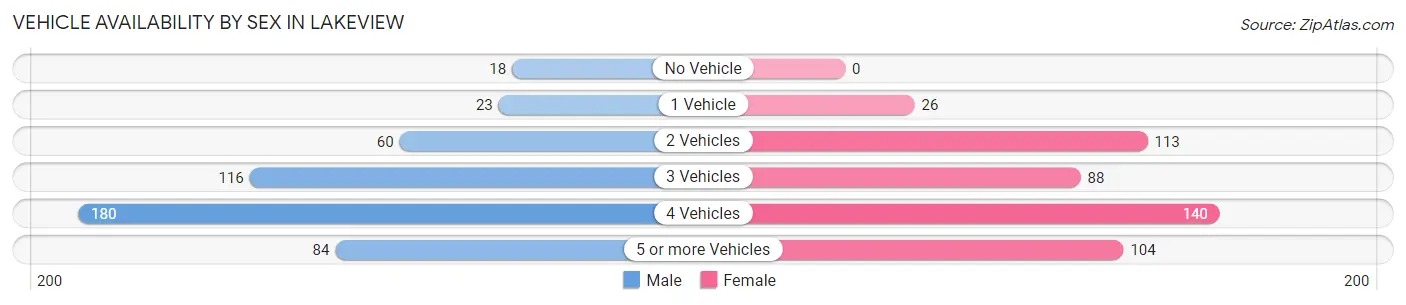
| Vehicles Available | Male | Female |
| No Vehicle | 18 (3.7%) | 0 (0.0%) |
| 1 Vehicle | 23 (4.8%) | 26 (5.5%) |
| 2 Vehicles | 60 (12.5%) | 113 (24.0%) |
| 3 Vehicles | 116 (24.1%) | 88 (18.7%) |
| 4 Vehicles | 180 (37.4%) | 140 (29.7%) |
| 5 or more Vehicles | 84 (17.5%) | 104 (22.1%) |
| Total | 481 (100.0%) | 471 (100.0%) |
Commute Time in Lakeview
The most frequently occuring commute durations in Lakeview are 20 to 24 minutes (203 commuters, 24.8%), 90 or more minutes (168 commuters, 20.5%), and 30 to 34 minutes (146 commuters, 17.8%).
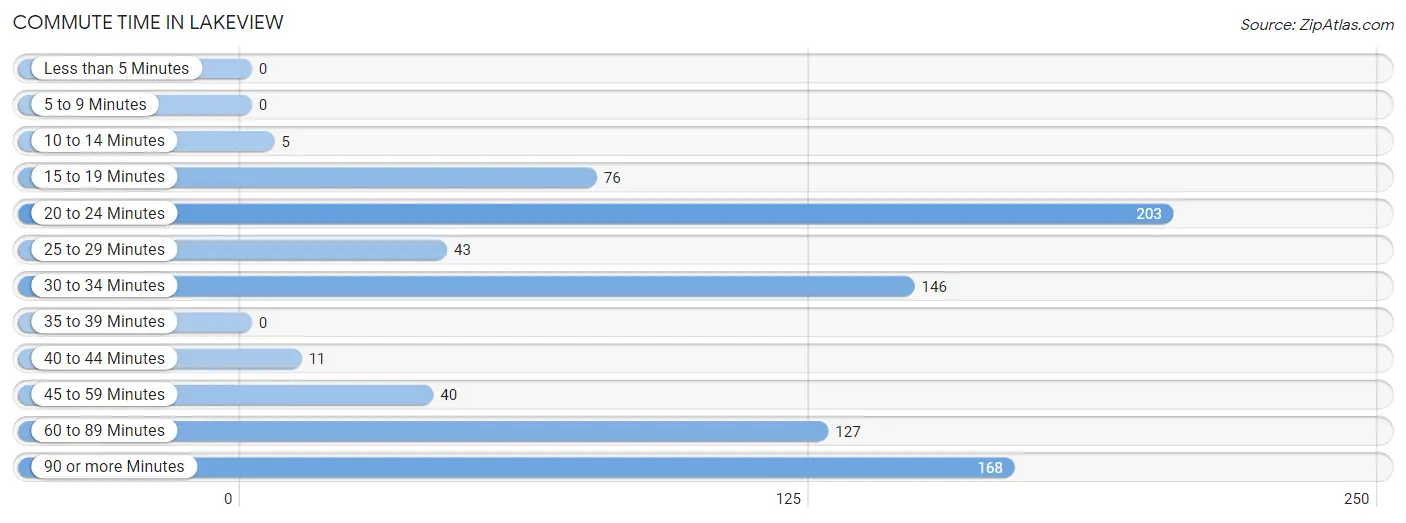
| Commute Time | # Commuters | % Commuters |
| Less than 5 Minutes | 0 | 0.0% |
| 5 to 9 Minutes | 0 | 0.0% |
| 10 to 14 Minutes | 5 | 0.6% |
| 15 to 19 Minutes | 76 | 9.3% |
| 20 to 24 Minutes | 203 | 24.8% |
| 25 to 29 Minutes | 43 | 5.2% |
| 30 to 34 Minutes | 146 | 17.8% |
| 35 to 39 Minutes | 0 | 0.0% |
| 40 to 44 Minutes | 11 | 1.3% |
| 45 to 59 Minutes | 40 | 4.9% |
| 60 to 89 Minutes | 127 | 15.5% |
| 90 or more Minutes | 168 | 20.5% |
Commute Time by Sex in Lakeview
The most common commute times in Lakeview are 90 or more minutes (145 commuters, 37.8%) for males and 60 to 89 minutes (127 commuters, 29.2%) for females.
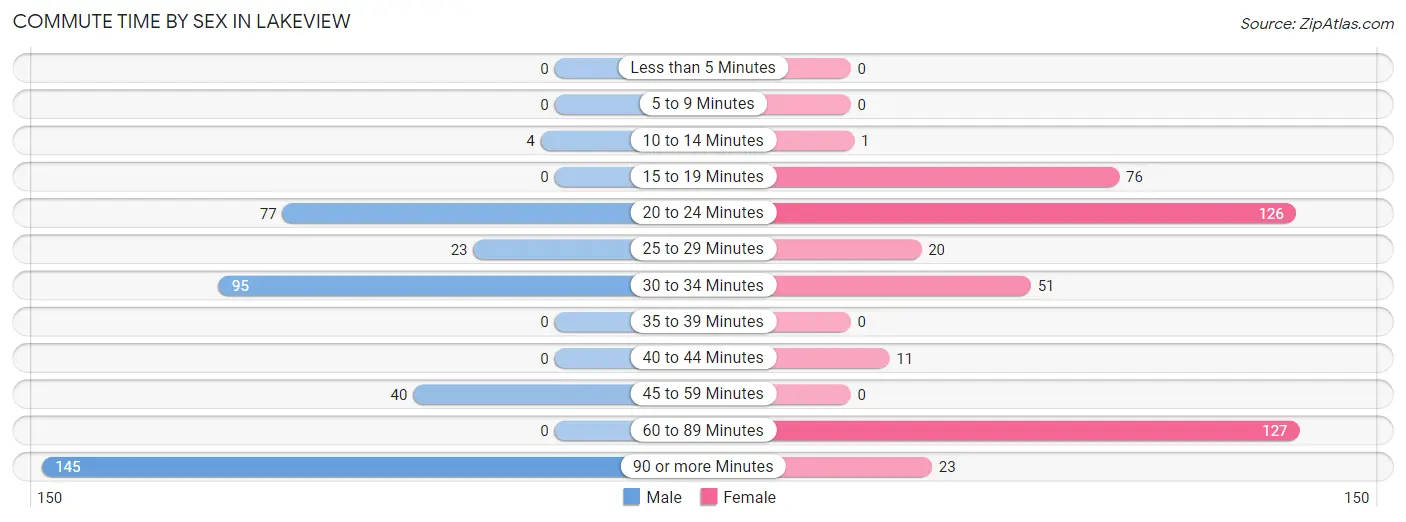
| Commute Time | Male | Female |
| Less than 5 Minutes | 0 (0.0%) | 0 (0.0%) |
| 5 to 9 Minutes | 0 (0.0%) | 0 (0.0%) |
| 10 to 14 Minutes | 4 (1.0%) | 1 (0.2%) |
| 15 to 19 Minutes | 0 (0.0%) | 76 (17.5%) |
| 20 to 24 Minutes | 77 (20.1%) | 126 (29.0%) |
| 25 to 29 Minutes | 23 (6.0%) | 20 (4.6%) |
| 30 to 34 Minutes | 95 (24.7%) | 51 (11.7%) |
| 35 to 39 Minutes | 0 (0.0%) | 0 (0.0%) |
| 40 to 44 Minutes | 0 (0.0%) | 11 (2.5%) |
| 45 to 59 Minutes | 40 (10.4%) | 0 (0.0%) |
| 60 to 89 Minutes | 0 (0.0%) | 127 (29.2%) |
| 90 or more Minutes | 145 (37.8%) | 23 (5.3%) |
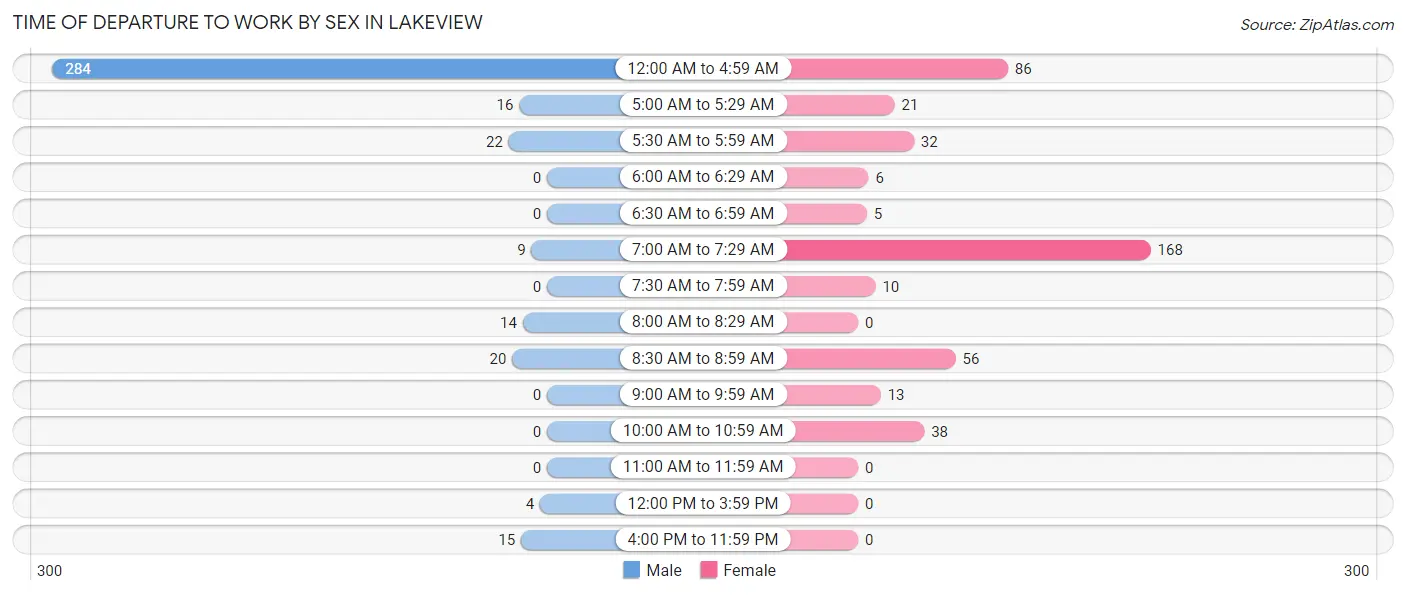
Time of Departure to Work by Sex in Lakeview
The most frequent times of departure to work in Lakeview are 12:00 AM to 4:59 AM (284, 74.0%) for males and 7:00 AM to 7:29 AM (168, 38.6%) for females.
| Time of Departure | Male | Female |
| 12:00 AM to 4:59 AM | 284 (74.0%) | 86 (19.8%) |
| 5:00 AM to 5:29 AM | 16 (4.2%) | 21 (4.8%) |
| 5:30 AM to 5:59 AM | 22 (5.7%) | 32 (7.4%) |
| 6:00 AM to 6:29 AM | 0 (0.0%) | 6 (1.4%) |
| 6:30 AM to 6:59 AM | 0 (0.0%) | 5 (1.1%) |
| 7:00 AM to 7:29 AM | 9 (2.3%) | 168 (38.6%) |
| 7:30 AM to 7:59 AM | 0 (0.0%) | 10 (2.3%) |
| 8:00 AM to 8:29 AM | 14 (3.6%) | 0 (0.0%) |
| 8:30 AM to 8:59 AM | 20 (5.2%) | 56 (12.9%) |
| 9:00 AM to 9:59 AM | 0 (0.0%) | 13 (3.0%) |
| 10:00 AM to 10:59 AM | 0 (0.0%) | 38 (8.7%) |
| 11:00 AM to 11:59 AM | 0 (0.0%) | 0 (0.0%) |
| 12:00 PM to 3:59 PM | 4 (1.0%) | 0 (0.0%) |
| 4:00 PM to 11:59 PM | 15 (3.9%) | 0 (0.0%) |
| Total | 384 (100.0%) | 435 (100.0%) |
Housing Occupancy in Lakeview
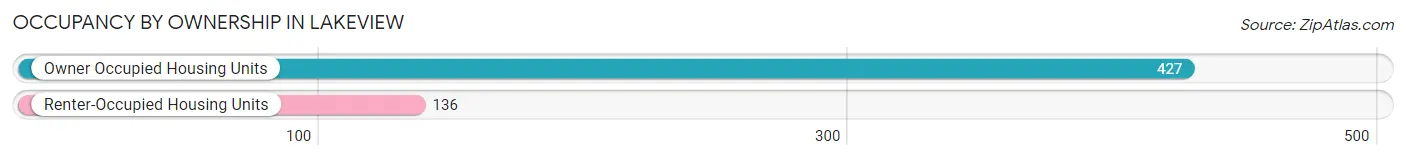
Occupancy by Ownership in Lakeview
Of the total 563 dwellings in Lakeview, owner-occupied units account for 427 (75.8%), while renter-occupied units make up 136 (24.2%).
| Occupancy | # Housing Units | % Housing Units |
| Owner Occupied Housing Units | 427 | 75.8% |
| Renter-Occupied Housing Units | 136 | 24.2% |
| Total Occupied Housing Units | 563 | 100.0% |
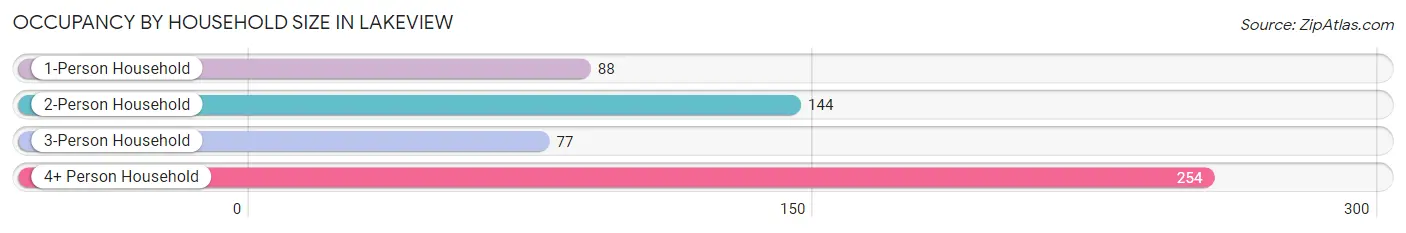
Occupancy by Household Size in Lakeview
| Household Size | # Housing Units | % Housing Units |
| 1-Person Household | 88 | 15.6% |
| 2-Person Household | 144 | 25.6% |
| 3-Person Household | 77 | 13.7% |
| 4+ Person Household | 254 | 45.1% |
| Total Housing Units | 563 | 100.0% |
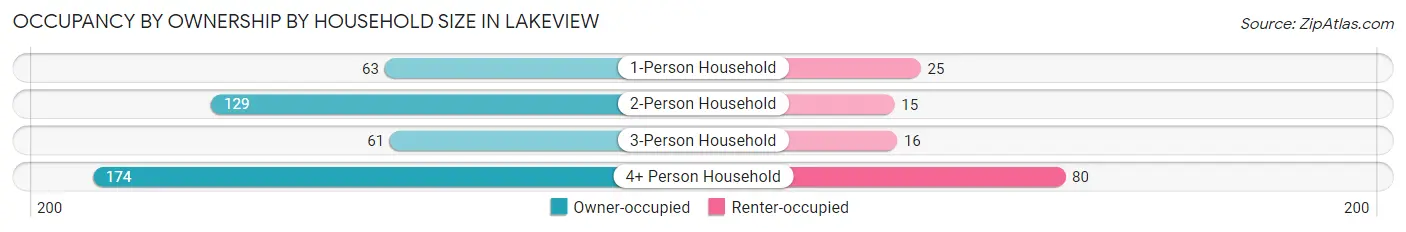
Occupancy by Ownership by Household Size in Lakeview
| Household Size | Owner-occupied | Renter-occupied |
| 1-Person Household | 63 (71.6%) | 25 (28.4%) |
| 2-Person Household | 129 (89.6%) | 15 (10.4%) |
| 3-Person Household | 61 (79.2%) | 16 (20.8%) |
| 4+ Person Household | 174 (68.5%) | 80 (31.5%) |
| Total Housing Units | 427 (75.8%) | 136 (24.2%) |
Occupancy by Educational Attainment in Lakeview
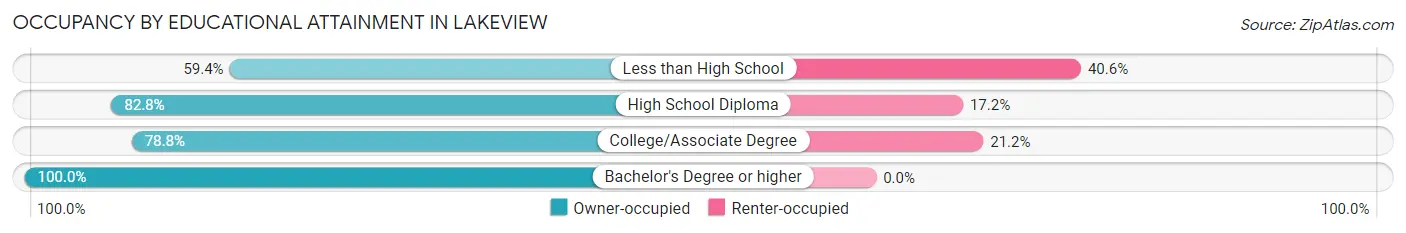
| Household Size | Owner-occupied | Renter-occupied |
| Less than High School | 98 (59.4%) | 67 (40.6%) |
| High School Diploma | 101 (82.8%) | 21 (17.2%) |
| College/Associate Degree | 178 (78.8%) | 48 (21.2%) |
| Bachelor's Degree or higher | 50 (100.0%) | 0 (0.0%) |
Occupancy by Age of Householder in Lakeview
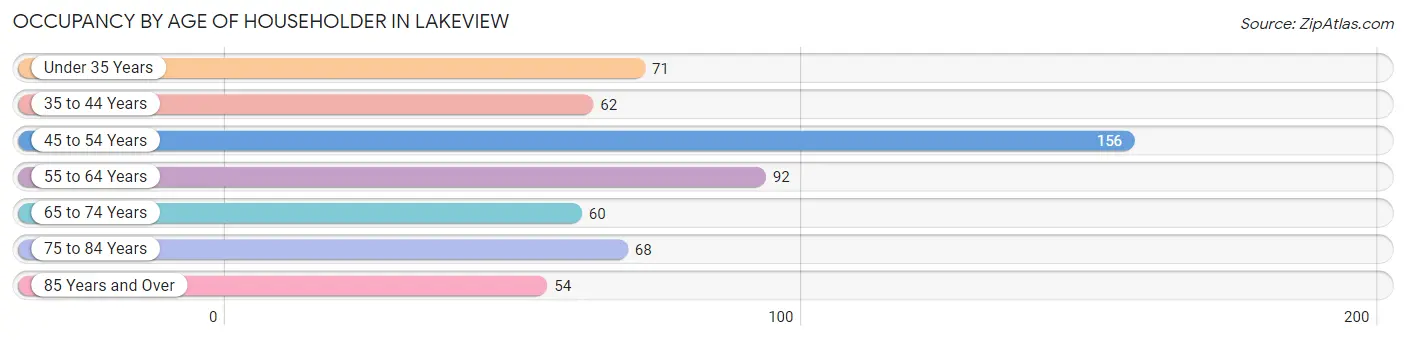
| Age Bracket | # Households | % Households |
| Under 35 Years | 71 | 12.6% |
| 35 to 44 Years | 62 | 11.0% |
| 45 to 54 Years | 156 | 27.7% |
| 55 to 64 Years | 92 | 16.3% |
| 65 to 74 Years | 60 | 10.7% |
| 75 to 84 Years | 68 | 12.1% |
| 85 Years and Over | 54 | 9.6% |
| Total | 563 | 100.0% |
Housing Finances in Lakeview
Median Income by Occupancy in Lakeview
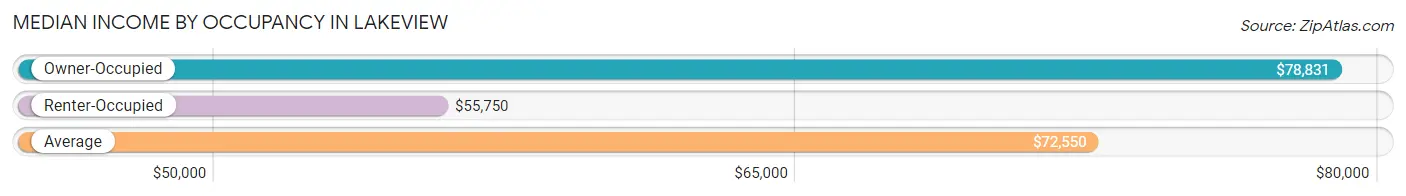
| Occupancy Type | # Households | Median Income |
| Owner-Occupied | 427 (75.8%) | $78,831 |
| Renter-Occupied | 136 (24.2%) | $55,750 |
| Average | 563 (100.0%) | $72,550 |
Occupancy by Householder Income Bracket in Lakeview
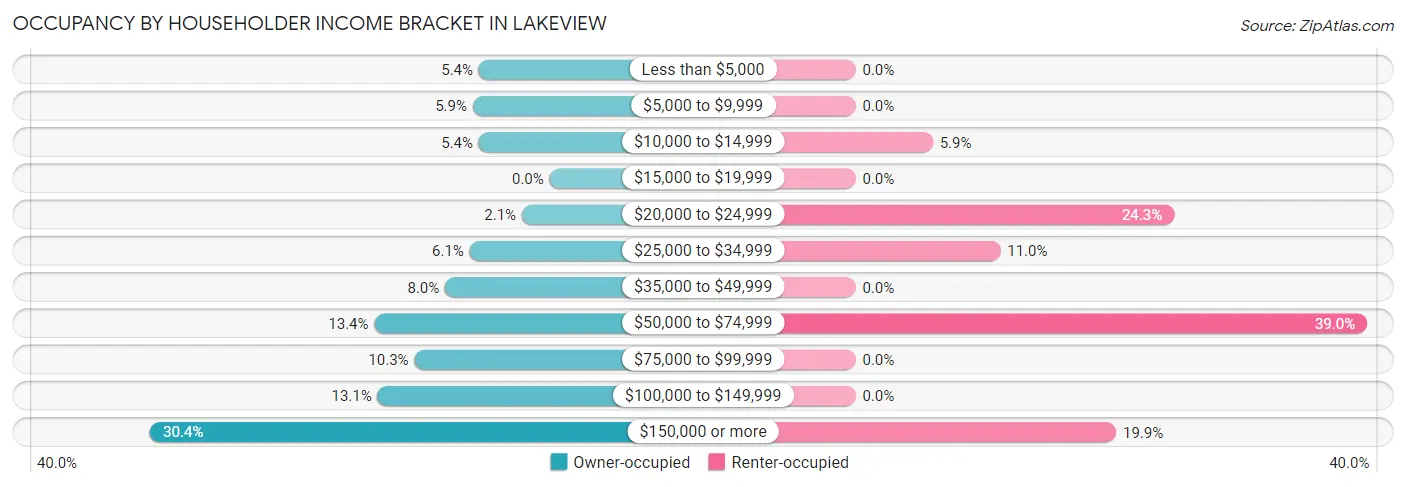
| Income Bracket | Owner-occupied | Renter-occupied |
| Less than $5,000 | 23 (5.4%) | 0 (0.0%) |
| $5,000 to $9,999 | 25 (5.9%) | 0 (0.0%) |
| $10,000 to $14,999 | 23 (5.4%) | 8 (5.9%) |
| $15,000 to $19,999 | 0 (0.0%) | 0 (0.0%) |
| $20,000 to $24,999 | 9 (2.1%) | 33 (24.3%) |
| $25,000 to $34,999 | 26 (6.1%) | 15 (11.0%) |
| $35,000 to $49,999 | 34 (8.0%) | 0 (0.0%) |
| $50,000 to $74,999 | 57 (13.4%) | 53 (39.0%) |
| $75,000 to $99,999 | 44 (10.3%) | 0 (0.0%) |
| $100,000 to $149,999 | 56 (13.1%) | 0 (0.0%) |
| $150,000 or more | 130 (30.4%) | 27 (19.9%) |
| Total | 427 (100.0%) | 136 (100.0%) |
Monthly Housing Cost Tiers in Lakeview
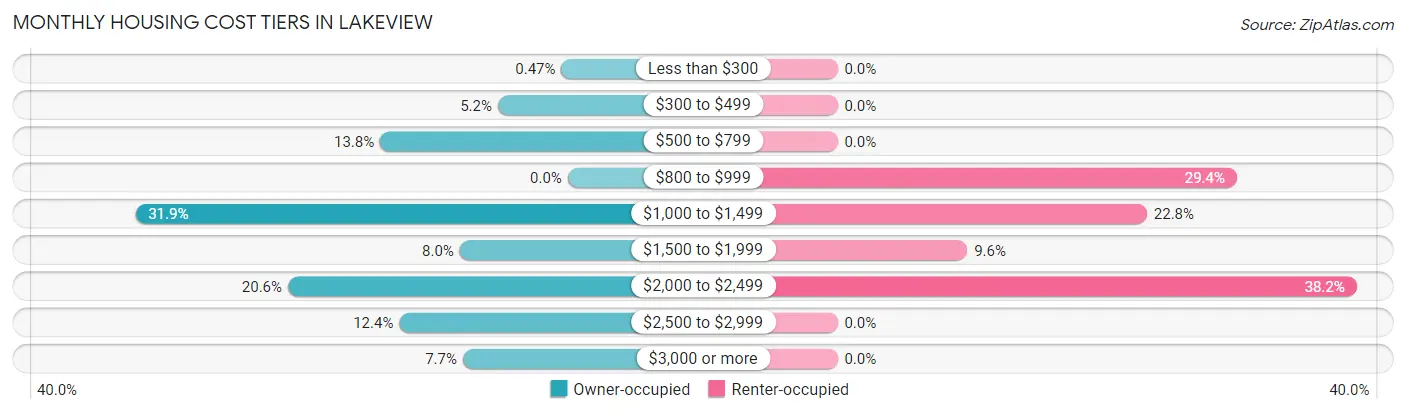
| Monthly Cost | Owner-occupied | Renter-occupied |
| Less than $300 | 2 (0.5%) | 0 (0.0%) |
| $300 to $499 | 22 (5.1%) | 0 (0.0%) |
| $500 to $799 | 59 (13.8%) | 0 (0.0%) |
| $800 to $999 | 0 (0.0%) | 40 (29.4%) |
| $1,000 to $1,499 | 136 (31.9%) | 31 (22.8%) |
| $1,500 to $1,999 | 34 (8.0%) | 13 (9.6%) |
| $2,000 to $2,499 | 88 (20.6%) | 52 (38.2%) |
| $2,500 to $2,999 | 53 (12.4%) | 0 (0.0%) |
| $3,000 or more | 33 (7.7%) | 0 (0.0%) |
| Total | 427 (100.0%) | 136 (100.0%) |
Physical Housing Characteristics in Lakeview
Housing Structures in Lakeview
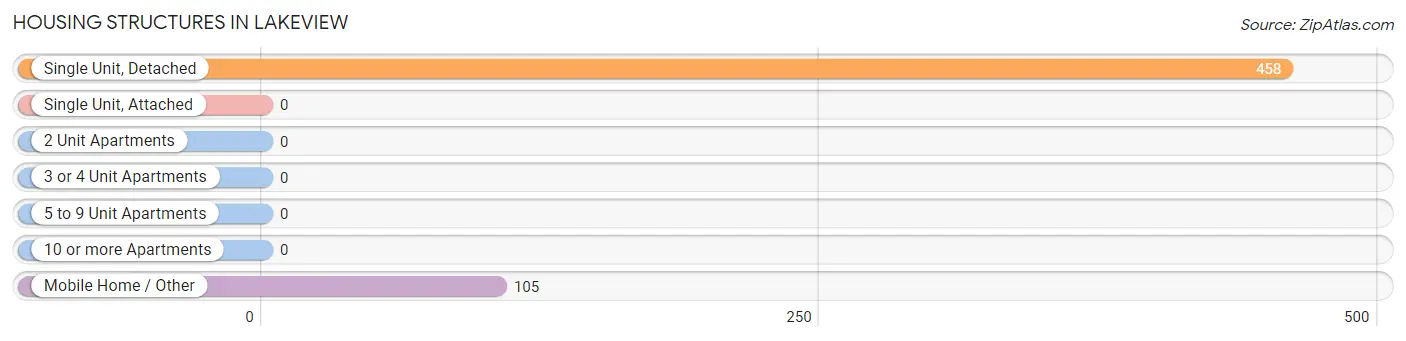
| Structure Type | # Housing Units | % Housing Units |
| Single Unit, Detached | 458 | 81.4% |
| Single Unit, Attached | 0 | 0.0% |
| 2 Unit Apartments | 0 | 0.0% |
| 3 or 4 Unit Apartments | 0 | 0.0% |
| 5 to 9 Unit Apartments | 0 | 0.0% |
| 10 or more Apartments | 0 | 0.0% |
| Mobile Home / Other | 105 | 18.6% |
| Total | 563 | 100.0% |
Housing Structures by Occupancy in Lakeview
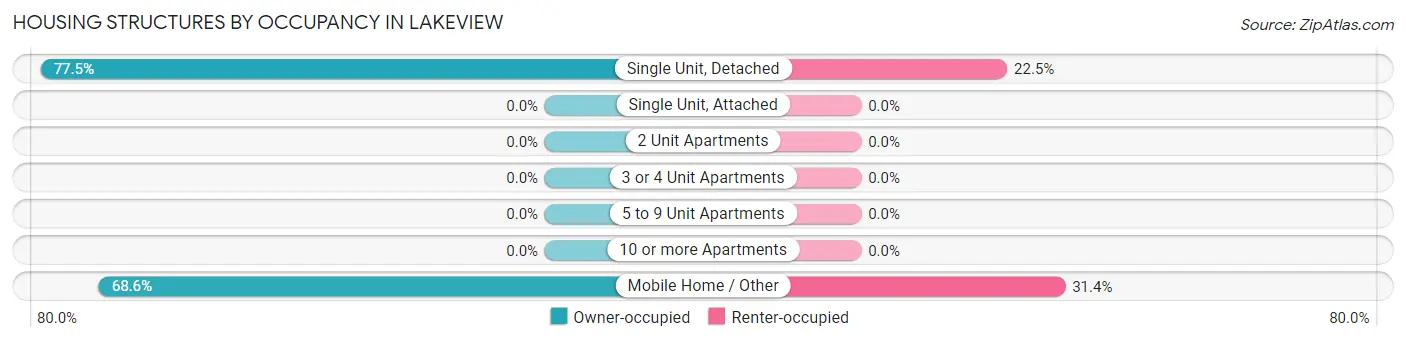
| Structure Type | Owner-occupied | Renter-occupied |
| Single Unit, Detached | 355 (77.5%) | 103 (22.5%) |
| Single Unit, Attached | 0 (0.0%) | 0 (0.0%) |
| 2 Unit Apartments | 0 (0.0%) | 0 (0.0%) |
| 3 or 4 Unit Apartments | 0 (0.0%) | 0 (0.0%) |
| 5 to 9 Unit Apartments | 0 (0.0%) | 0 (0.0%) |
| 10 or more Apartments | 0 (0.0%) | 0 (0.0%) |
| Mobile Home / Other | 72 (68.6%) | 33 (31.4%) |
| Total | 427 (75.8%) | 136 (24.2%) |
Housing Structures by Number of Rooms in Lakeview
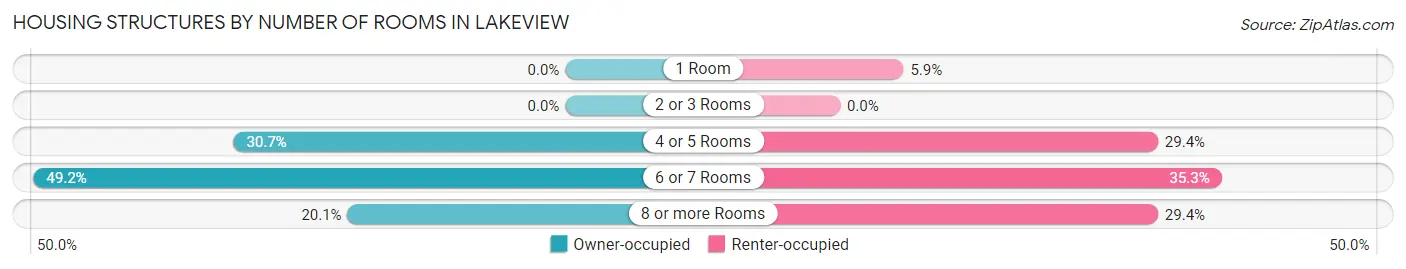
| Number of Rooms | Owner-occupied | Renter-occupied |
| 1 Room | 0 (0.0%) | 8 (5.9%) |
| 2 or 3 Rooms | 0 (0.0%) | 0 (0.0%) |
| 4 or 5 Rooms | 131 (30.7%) | 40 (29.4%) |
| 6 or 7 Rooms | 210 (49.2%) | 48 (35.3%) |
| 8 or more Rooms | 86 (20.1%) | 40 (29.4%) |
| Total | 427 (100.0%) | 136 (100.0%) |
Housing Structure by Heating Type in Lakeview
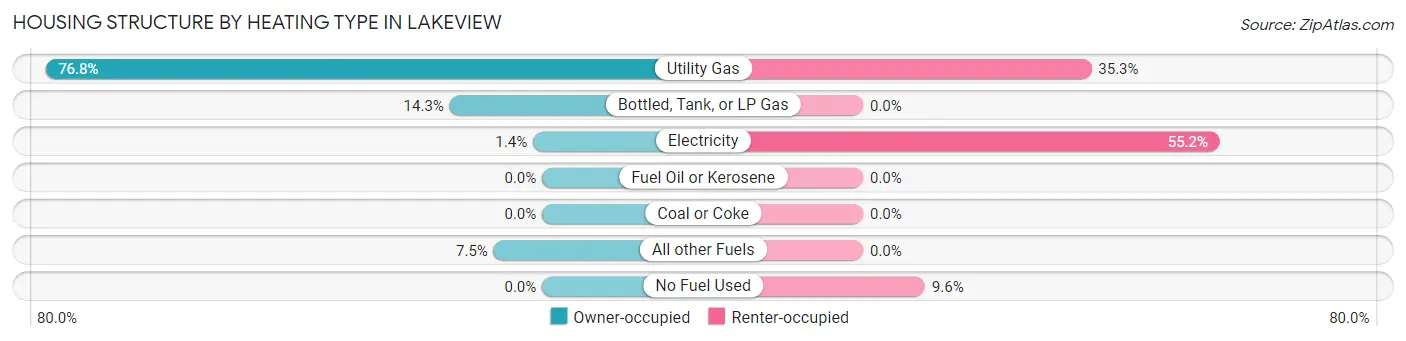
| Heating Type | Owner-occupied | Renter-occupied |
| Utility Gas | 328 (76.8%) | 48 (35.3%) |
| Bottled, Tank, or LP Gas | 61 (14.3%) | 0 (0.0%) |
| Electricity | 6 (1.4%) | 75 (55.1%) |
| Fuel Oil or Kerosene | 0 (0.0%) | 0 (0.0%) |
| Coal or Coke | 0 (0.0%) | 0 (0.0%) |
| All other Fuels | 32 (7.5%) | 0 (0.0%) |
| No Fuel Used | 0 (0.0%) | 13 (9.6%) |
| Total | 427 (100.0%) | 136 (100.0%) |
Household Vehicle Usage in Lakeview
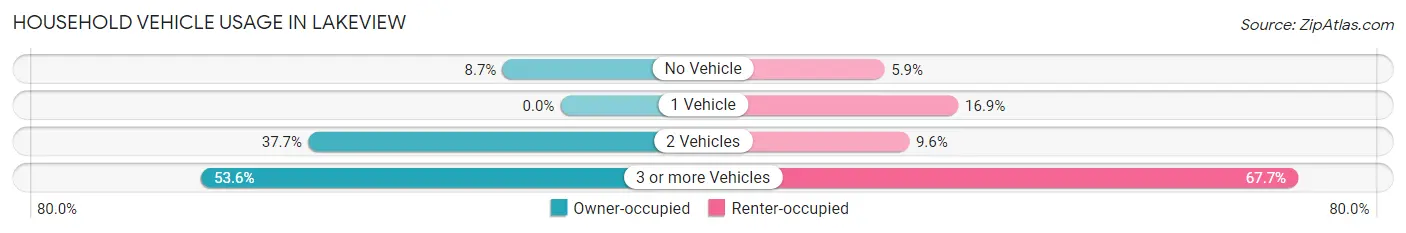
| Vehicles per Household | Owner-occupied | Renter-occupied |
| No Vehicle | 37 (8.7%) | 8 (5.9%) |
| 1 Vehicle | 0 (0.0%) | 23 (16.9%) |
| 2 Vehicles | 161 (37.7%) | 13 (9.6%) |
| 3 or more Vehicles | 229 (53.6%) | 92 (67.6%) |
| Total | 427 (100.0%) | 136 (100.0%) |
Real Estate & Mortgages in Lakeview
Real Estate and Mortgage Overview in Lakeview
| Characteristic | Without Mortgage | With Mortgage |
| Housing Units | 108 | 319 |
| Median Property Value | $409,400 | $470,200 |
| Median Household Income | - | - |
| Monthly Housing Costs | $558 | $33 |
| Real Estate Taxes | $1,824 | $0 |
Property Value by Mortgage Status in Lakeview
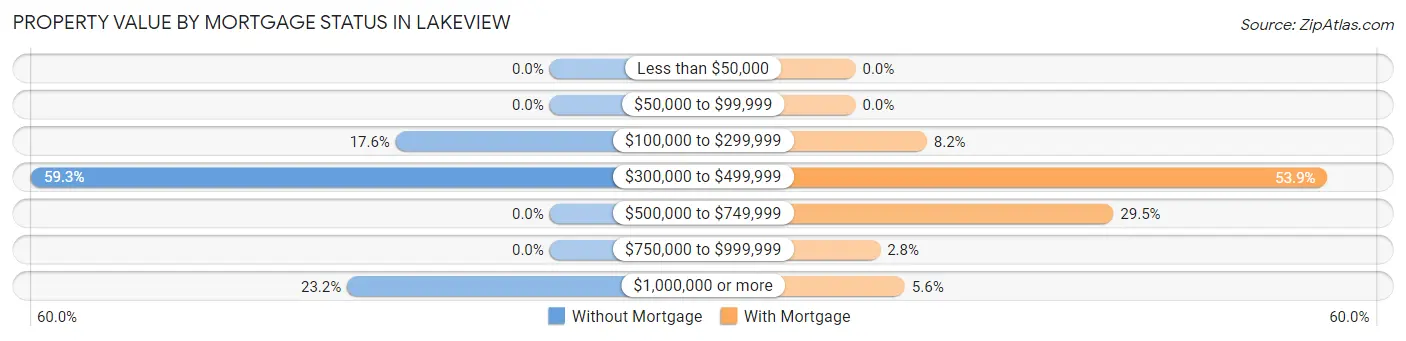
| Property Value | Without Mortgage | With Mortgage |
| Less than $50,000 | 0 (0.0%) | 0 (0.0%) |
| $50,000 to $99,999 | 0 (0.0%) | 0 (0.0%) |
| $100,000 to $299,999 | 19 (17.6%) | 26 (8.2%) |
| $300,000 to $499,999 | 64 (59.3%) | 172 (53.9%) |
| $500,000 to $749,999 | 0 (0.0%) | 94 (29.5%) |
| $750,000 to $999,999 | 0 (0.0%) | 9 (2.8%) |
| $1,000,000 or more | 25 (23.2%) | 18 (5.6%) |
| Total | 108 (100.0%) | 319 (100.0%) |
Household Income by Mortgage Status in Lakeview
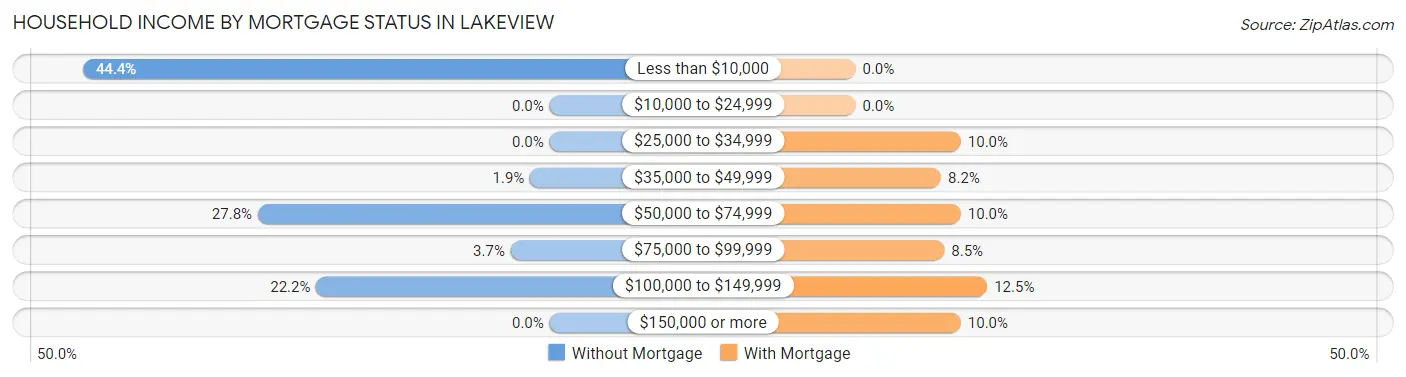
| Household Income | Without Mortgage | With Mortgage |
| Less than $10,000 | 48 (44.4%) | 0 (0.0%) |
| $10,000 to $24,999 | 0 (0.0%) | 0 (0.0%) |
| $25,000 to $34,999 | 0 (0.0%) | 32 (10.0%) |
| $35,000 to $49,999 | 2 (1.8%) | 26 (8.2%) |
| $50,000 to $74,999 | 30 (27.8%) | 32 (10.0%) |
| $75,000 to $99,999 | 4 (3.7%) | 27 (8.5%) |
| $100,000 to $149,999 | 24 (22.2%) | 40 (12.5%) |
| $150,000 or more | 0 (0.0%) | 32 (10.0%) |
| Total | 108 (100.0%) | 319 (100.0%) |
Property Value to Household Income Ratio in Lakeview
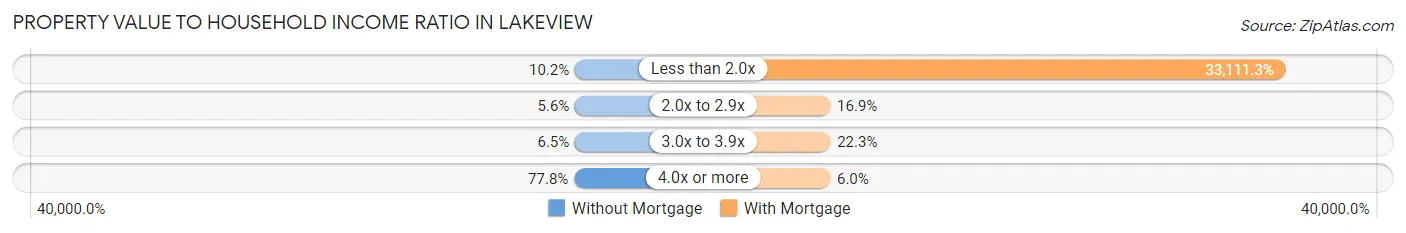
| Value-to-Income Ratio | Without Mortgage | With Mortgage |
| Less than 2.0x | 11 (10.2%) | 105,625 (33,111.3%) |
| 2.0x to 2.9x | 6 (5.6%) | 54 (16.9%) |
| 3.0x to 3.9x | 7 (6.5%) | 71 (22.3%) |
| 4.0x or more | 84 (77.8%) | 19 (6.0%) |
| Total | 108 (100.0%) | 319 (100.0%) |
Real Estate Taxes by Mortgage Status in Lakeview
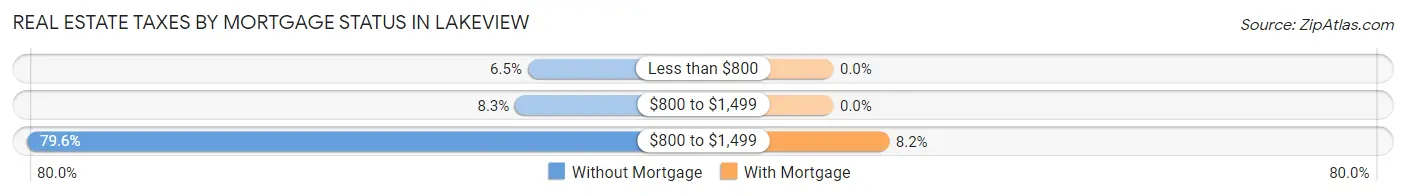
| Property Taxes | Without Mortgage | With Mortgage |
| Less than $800 | 7 (6.5%) | 0 (0.0%) |
| $800 to $1,499 | 9 (8.3%) | 0 (0.0%) |
| $800 to $1,499 | 86 (79.6%) | 26 (8.2%) |
| Total | 108 (100.0%) | 319 (100.0%) |
Health & Disability in Lakeview
Health Insurance Coverage by Age in Lakeview
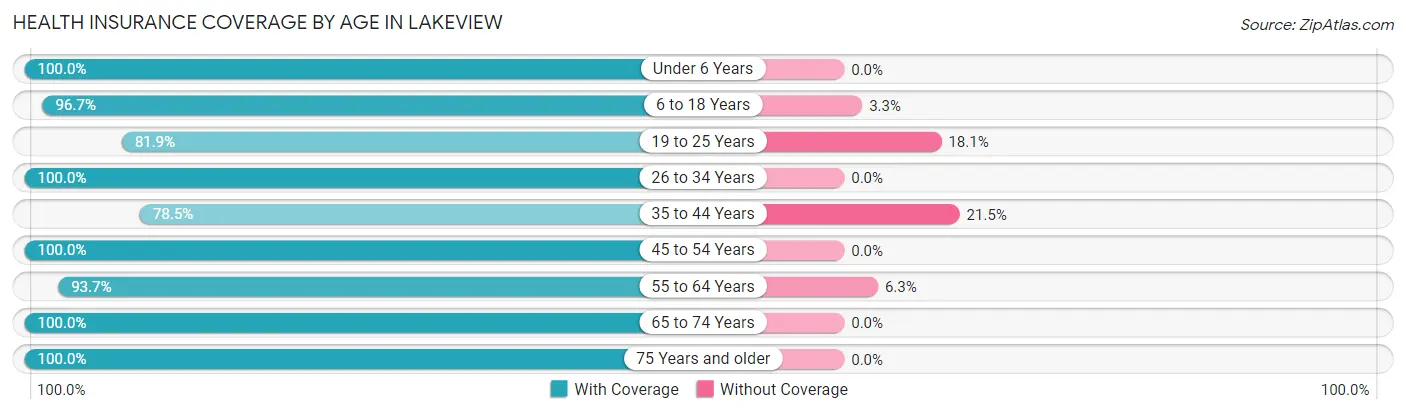
| Age Bracket | With Coverage | Without Coverage |
| Under 6 Years | 151 (100.0%) | 0 (0.0%) |
| 6 to 18 Years | 579 (96.7%) | 20 (3.3%) |
| 19 to 25 Years | 113 (81.9%) | 25 (18.1%) |
| 26 to 34 Years | 298 (100.0%) | 0 (0.0%) |
| 35 to 44 Years | 208 (78.5%) | 57 (21.5%) |
| 45 to 54 Years | 296 (100.0%) | 0 (0.0%) |
| 55 to 64 Years | 179 (93.7%) | 12 (6.3%) |
| 65 to 74 Years | 154 (100.0%) | 0 (0.0%) |
| 75 Years and older | 235 (100.0%) | 0 (0.0%) |
| Total | 2,213 (95.1%) | 114 (4.9%) |
Health Insurance Coverage by Citizenship Status in Lakeview
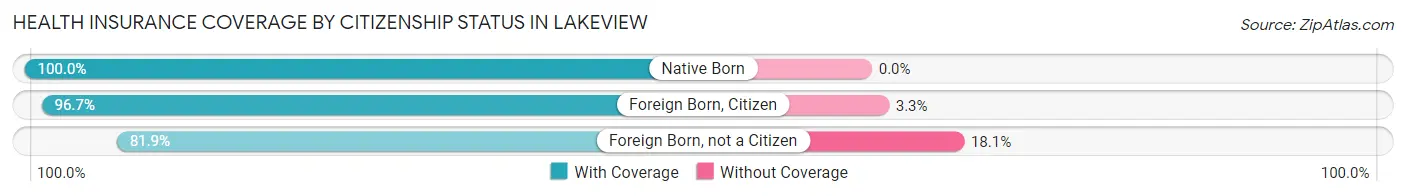
| Citizenship Status | With Coverage | Without Coverage |
| Native Born | 151 (100.0%) | 0 (0.0%) |
| Foreign Born, Citizen | 579 (96.7%) | 20 (3.3%) |
| Foreign Born, not a Citizen | 113 (81.9%) | 25 (18.1%) |
Health Insurance Coverage by Household Income in Lakeview
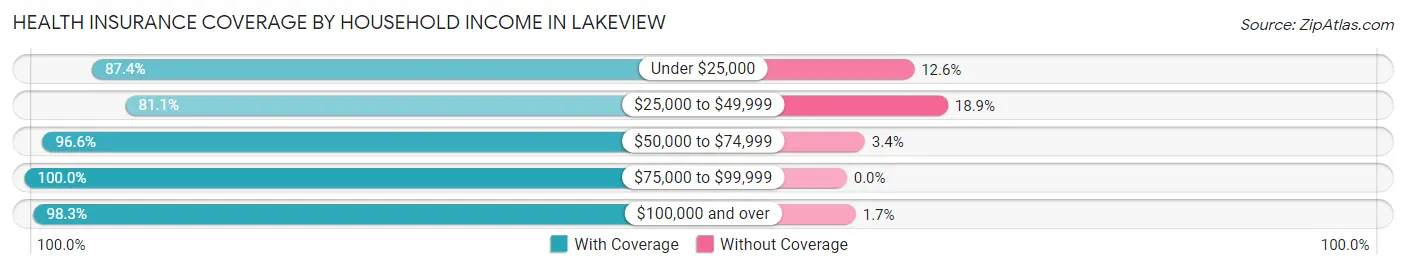
| Household Income | With Coverage | Without Coverage |
| Under $25,000 | 173 (87.4%) | 25 (12.6%) |
| $25,000 to $49,999 | 244 (81.1%) | 57 (18.9%) |
| $50,000 to $74,999 | 342 (96.6%) | 12 (3.4%) |
| $75,000 to $99,999 | 288 (100.0%) | 0 (0.0%) |
| $100,000 and over | 1,163 (98.3%) | 20 (1.7%) |
Public vs Private Health Insurance Coverage by Age in Lakeview
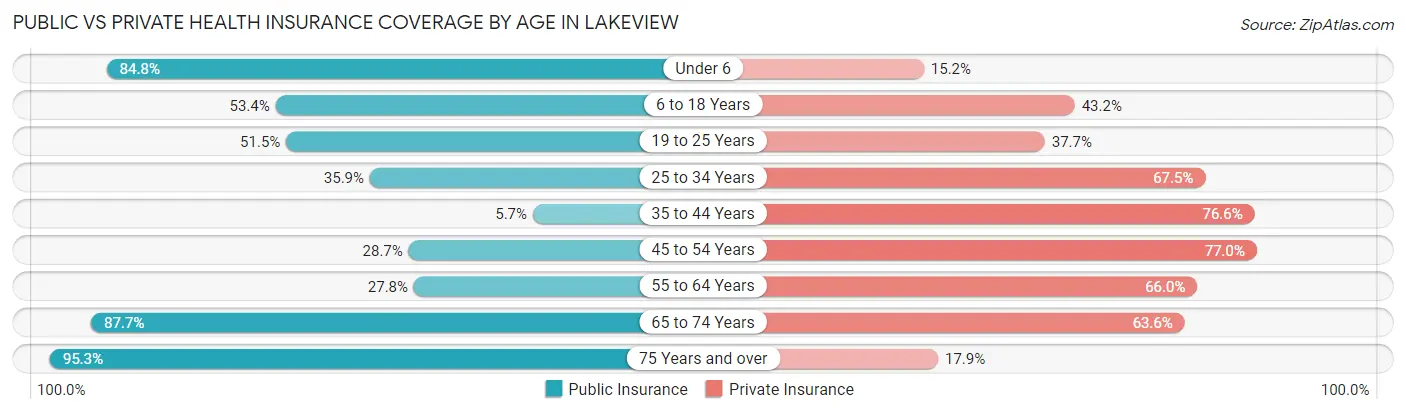
| Age Bracket | Public Insurance | Private Insurance |
| Under 6 | 128 (84.8%) | 23 (15.2%) |
| 6 to 18 Years | 320 (53.4%) | 259 (43.2%) |
| 19 to 25 Years | 71 (51.4%) | 52 (37.7%) |
| 25 to 34 Years | 107 (35.9%) | 201 (67.4%) |
| 35 to 44 Years | 15 (5.7%) | 203 (76.6%) |
| 45 to 54 Years | 85 (28.7%) | 228 (77.0%) |
| 55 to 64 Years | 53 (27.8%) | 126 (66.0%) |
| 65 to 74 Years | 135 (87.7%) | 98 (63.6%) |
| 75 Years and over | 224 (95.3%) | 42 (17.9%) |
| Total | 1,138 (48.9%) | 1,232 (52.9%) |
Disability Status by Sex by Age in Lakeview
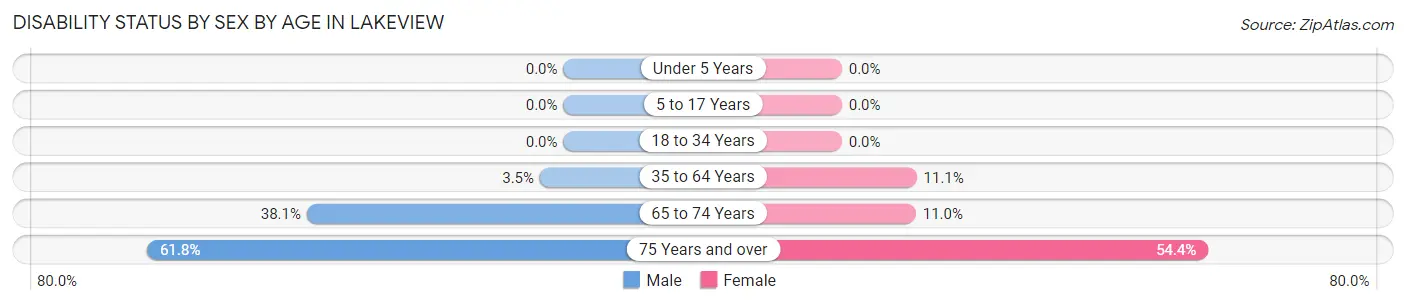
| Age Bracket | Male | Female |
| Under 5 Years | 0 (0.0%) | 0 (0.0%) |
| 5 to 17 Years | 0 (0.0%) | 0 (0.0%) |
| 18 to 34 Years | 0 (0.0%) | 0 (0.0%) |
| 35 to 64 Years | 14 (3.5%) | 39 (11.1%) |
| 65 to 74 Years | 24 (38.1%) | 10 (11.0%) |
| 75 Years and over | 68 (61.8%) | 68 (54.4%) |
Disability Class by Sex by Age in Lakeview
Disability Class: Hearing Difficulty
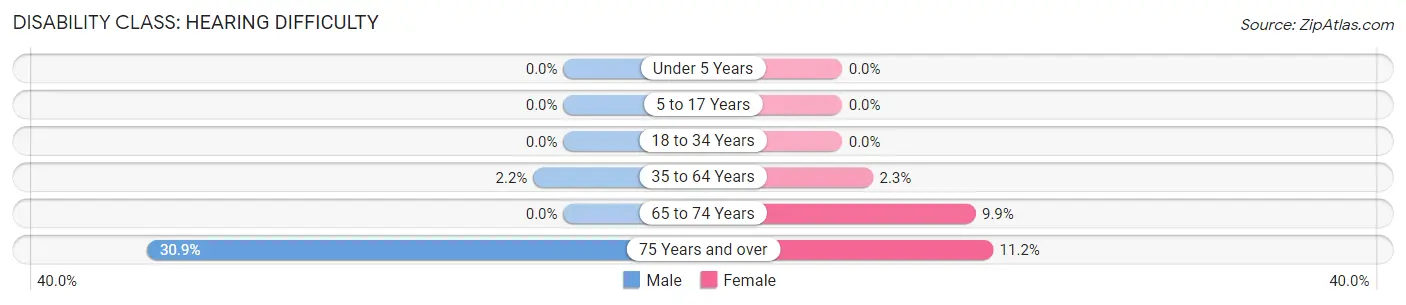
| Age Bracket | Male | Female |
| Under 5 Years | 0 (0.0%) | 0 (0.0%) |
| 5 to 17 Years | 0 (0.0%) | 0 (0.0%) |
| 18 to 34 Years | 0 (0.0%) | 0 (0.0%) |
| 35 to 64 Years | 9 (2.2%) | 8 (2.3%) |
| 65 to 74 Years | 0 (0.0%) | 9 (9.9%) |
| 75 Years and over | 34 (30.9%) | 14 (11.2%) |
Disability Class: Vision Difficulty
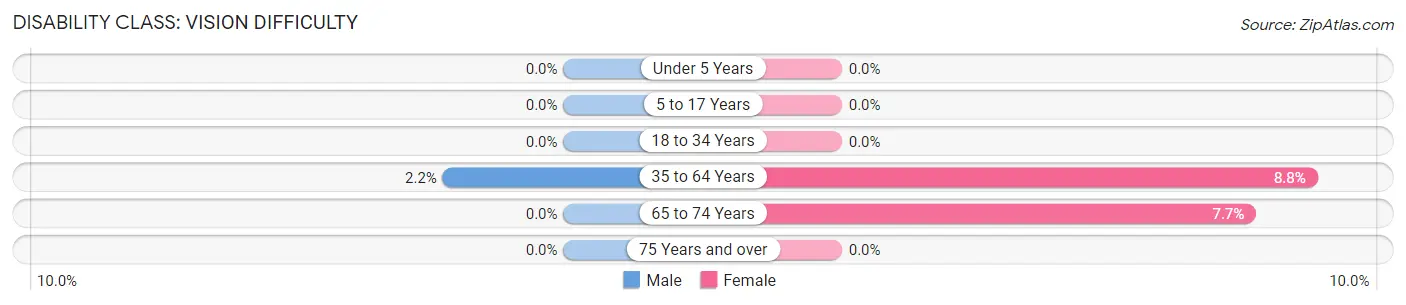
| Age Bracket | Male | Female |
| Under 5 Years | 0 (0.0%) | 0 (0.0%) |
| 5 to 17 Years | 0 (0.0%) | 0 (0.0%) |
| 18 to 34 Years | 0 (0.0%) | 0 (0.0%) |
| 35 to 64 Years | 9 (2.2%) | 31 (8.8%) |
| 65 to 74 Years | 0 (0.0%) | 7 (7.7%) |
| 75 Years and over | 0 (0.0%) | 0 (0.0%) |
Disability Class: Cognitive Difficulty
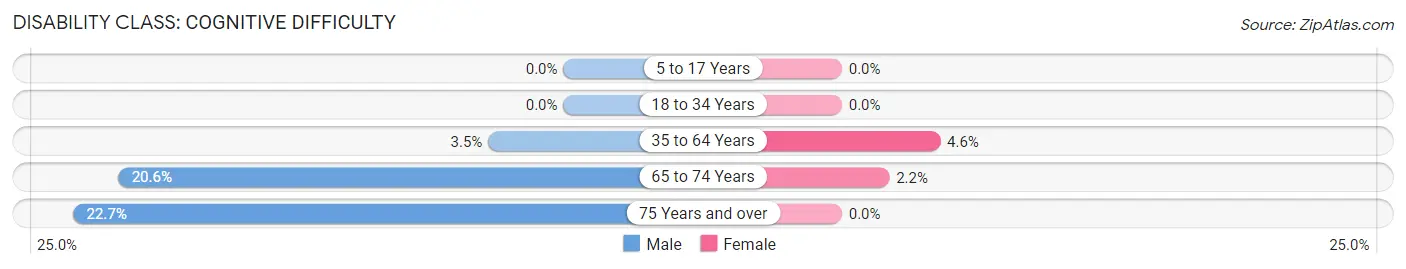
| Age Bracket | Male | Female |
| 5 to 17 Years | 0 (0.0%) | 0 (0.0%) |
| 18 to 34 Years | 0 (0.0%) | 0 (0.0%) |
| 35 to 64 Years | 14 (3.5%) | 16 (4.6%) |
| 65 to 74 Years | 13 (20.6%) | 2 (2.2%) |
| 75 Years and over | 25 (22.7%) | 0 (0.0%) |
Disability Class: Ambulatory Difficulty
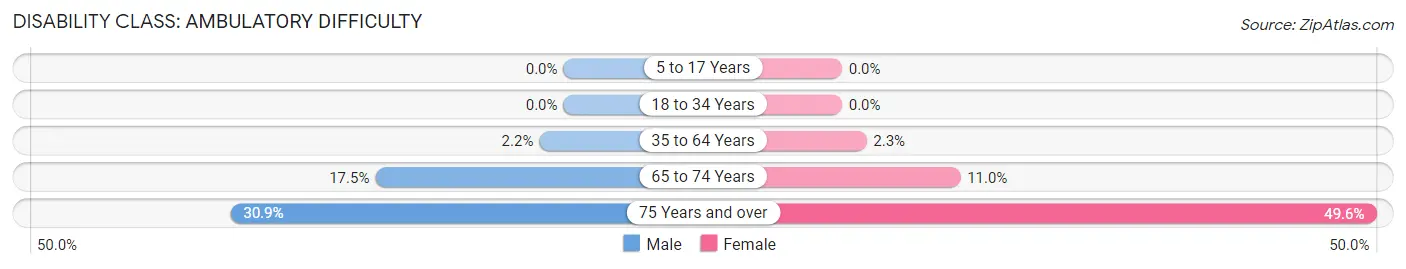
| Age Bracket | Male | Female |
| 5 to 17 Years | 0 (0.0%) | 0 (0.0%) |
| 18 to 34 Years | 0 (0.0%) | 0 (0.0%) |
| 35 to 64 Years | 9 (2.2%) | 8 (2.3%) |
| 65 to 74 Years | 11 (17.5%) | 10 (11.0%) |
| 75 Years and over | 34 (30.9%) | 62 (49.6%) |
Disability Class: Self-Care Difficulty
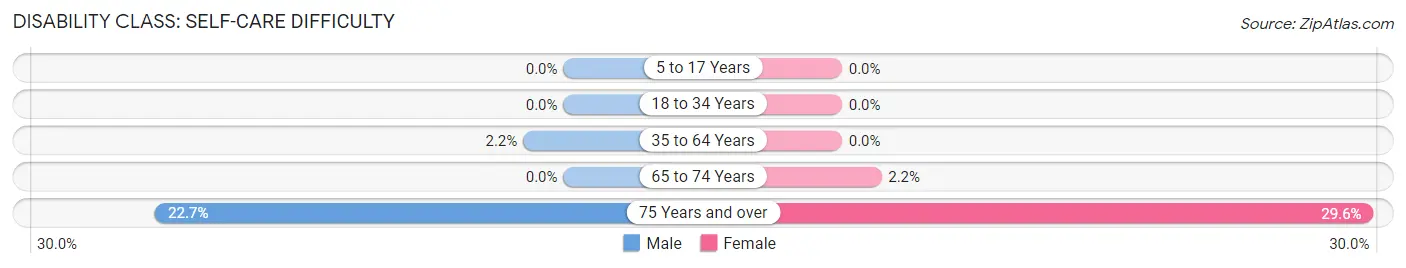
| Age Bracket | Male | Female |
| 5 to 17 Years | 0 (0.0%) | 0 (0.0%) |
| 18 to 34 Years | 0 (0.0%) | 0 (0.0%) |
| 35 to 64 Years | 9 (2.2%) | 0 (0.0%) |
| 65 to 74 Years | 0 (0.0%) | 2 (2.2%) |
| 75 Years and over | 25 (22.7%) | 37 (29.6%) |
Technology Access in Lakeview
Computing Device Access in Lakeview
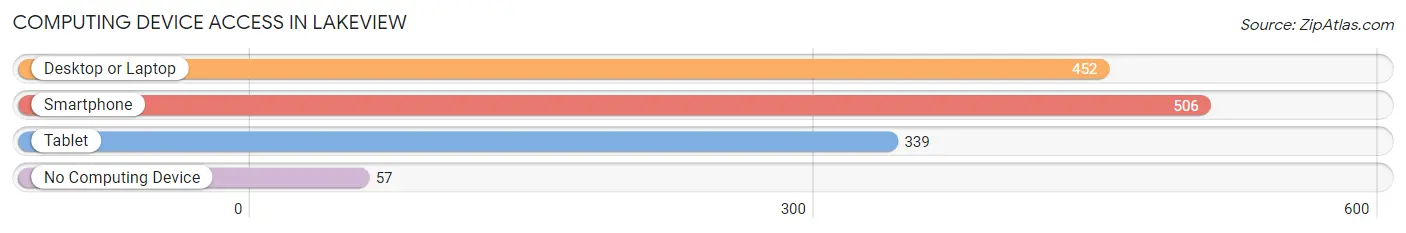
| Device Type | # Households | % Households |
| Desktop or Laptop | 452 | 80.3% |
| Smartphone | 506 | 89.9% |
| Tablet | 339 | 60.2% |
| No Computing Device | 57 | 10.1% |
| Total | 563 | 100.0% |
Internet Access in Lakeview
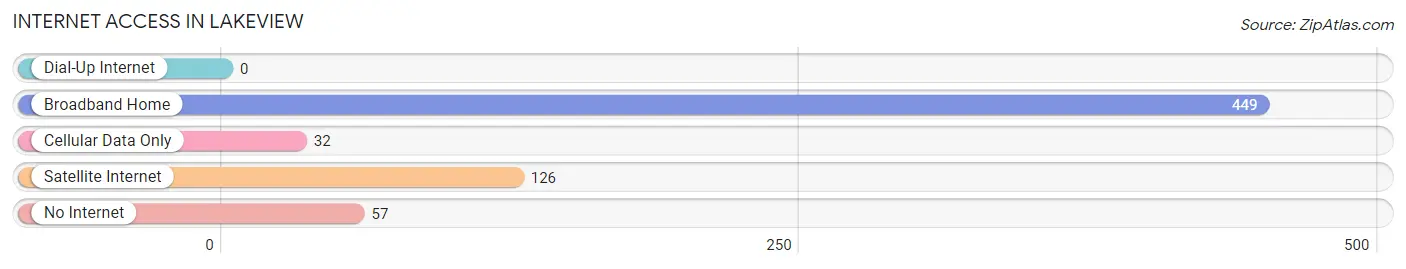
| Internet Type | # Households | % Households |
| Dial-Up Internet | 0 | 0.0% |
| Broadband Home | 449 | 79.7% |
| Cellular Data Only | 32 | 5.7% |
| Satellite Internet | 126 | 22.4% |
| No Internet | 57 | 10.1% |
| Total | 563 | 100.0% |
Lakeview Summary
Lakeview is a small town located in the northeastern corner of California, in Modoc County. It is situated at an elevation of 4,890 feet, and is surrounded by the Warner Mountains to the east, the Cascade Range to the west, and the Great Basin to the south. The town is located on the western edge of the Great Basin, and is the gateway to the Modoc National Forest.
History
The area around Lakeview was first inhabited by the Modoc people, who lived in the area for thousands of years before the arrival of European settlers. The first Europeans to settle in the area were miners, who arrived in the late 1800s in search of gold and other minerals. The town of Lakeview was founded in 1876, and was named for its proximity to the nearby lake.
In the early 1900s, the town began to grow as a center for ranching and farming. The town was also a popular stop for travelers on the California Trail, which ran through the area. In the 1920s, the town began to experience a boom in population, as the nearby Modoc National Forest was established and the area became a popular destination for outdoor recreation.
Geography
Lakeview is located in the northeastern corner of California, in Modoc County. It is situated at an elevation of 4,890 feet, and is surrounded by the Warner Mountains to the east, the Cascade Range to the west, and the Great Basin to the south. The town is located on the western edge of the Great Basin, and is the gateway to the Modoc National Forest.
The town is located in a semi-arid climate, with hot summers and cold winters. The average annual temperature is around 50 degrees Fahrenheit, and the average annual precipitation is around 10 inches.
Economy
The economy of Lakeview is largely based on agriculture and tourism. The town is home to several large ranches, which produce beef, dairy, and other agricultural products. The nearby Modoc National Forest is a popular destination for outdoor recreation, and the town is home to several hotels, restaurants, and other tourist-oriented businesses.
Demographics
As of the 2010 census, the population of Lakeview was 1,845. The racial makeup of the town was 94.3% White, 0.3% African American, 0.7% Native American, 0.3% Asian, 0.1% Pacific Islander, 0.7% from other races, and 3.6% from two or more races. Hispanic or Latino of any race were 4.2% of the population.
The median household income in Lakeview was $37,917, and the median family income was $45,625. The per capita income was $19,845. About 11.3% of families and 14.2% of the population were below the poverty line, including 18.2% of those under age 18 and 8.3% of those age 65 or over.
Common Questions
What is Per Capita Income in Lakeview?
Per Capita income in Lakeview is $46,187.
What is the Median Family Income in Lakeview?
Median Family Income in Lakeview is $81,250.
What is the Median Household income in Lakeview?
Median Household Income in Lakeview is $72,550.
What is Income or Wage Gap in Lakeview?
Income or Wage Gap in Lakeview is 16.1%.
Women in Lakeview earn 83.9 cents for every dollar earned by a man.
What is Inequality or Gini Index in Lakeview?
Inequality or Gini Index in Lakeview is 0.67.
What is the Total Population of Lakeview?
Total Population of Lakeview is 2,327.
What is the Total Male Population of Lakeview?
Total Male Population of Lakeview is 1,017.
What is the Total Female Population of Lakeview?
Total Female Population of Lakeview is 1,310.
What is the Ratio of Males per 100 Females in Lakeview?
There are 77.63 Males per 100 Females in Lakeview.
What is the Ratio of Females per 100 Males in Lakeview?
There are 128.81 Females per 100 Males in Lakeview.
What is the Median Population Age in Lakeview?
Median Population Age in Lakeview is 32.0 Years.
What is the Average Family Size in Lakeview
Average Family Size in Lakeview is 4.3 People.
What is the Average Household Size in Lakeview
Average Household Size in Lakeview is 4.1 People.
How Large is the Labor Force in Lakeview?
There are 1,045 People in the Labor Forcein in Lakeview.
What is the Percentage of People in the Labor Force in Lakeview?
60.7% of People are in the Labor Force in Lakeview.
What is the Unemployment Rate in Lakeview?
Unemployment Rate in Lakeview is 5.0%.