Cities with the Highest Percentage of Population with a Degree in Physical and Health Sciences in Virginia
RELATED REPORTS & OPTIONS
Physical and Health Sciences
Virginia
Compare Cities
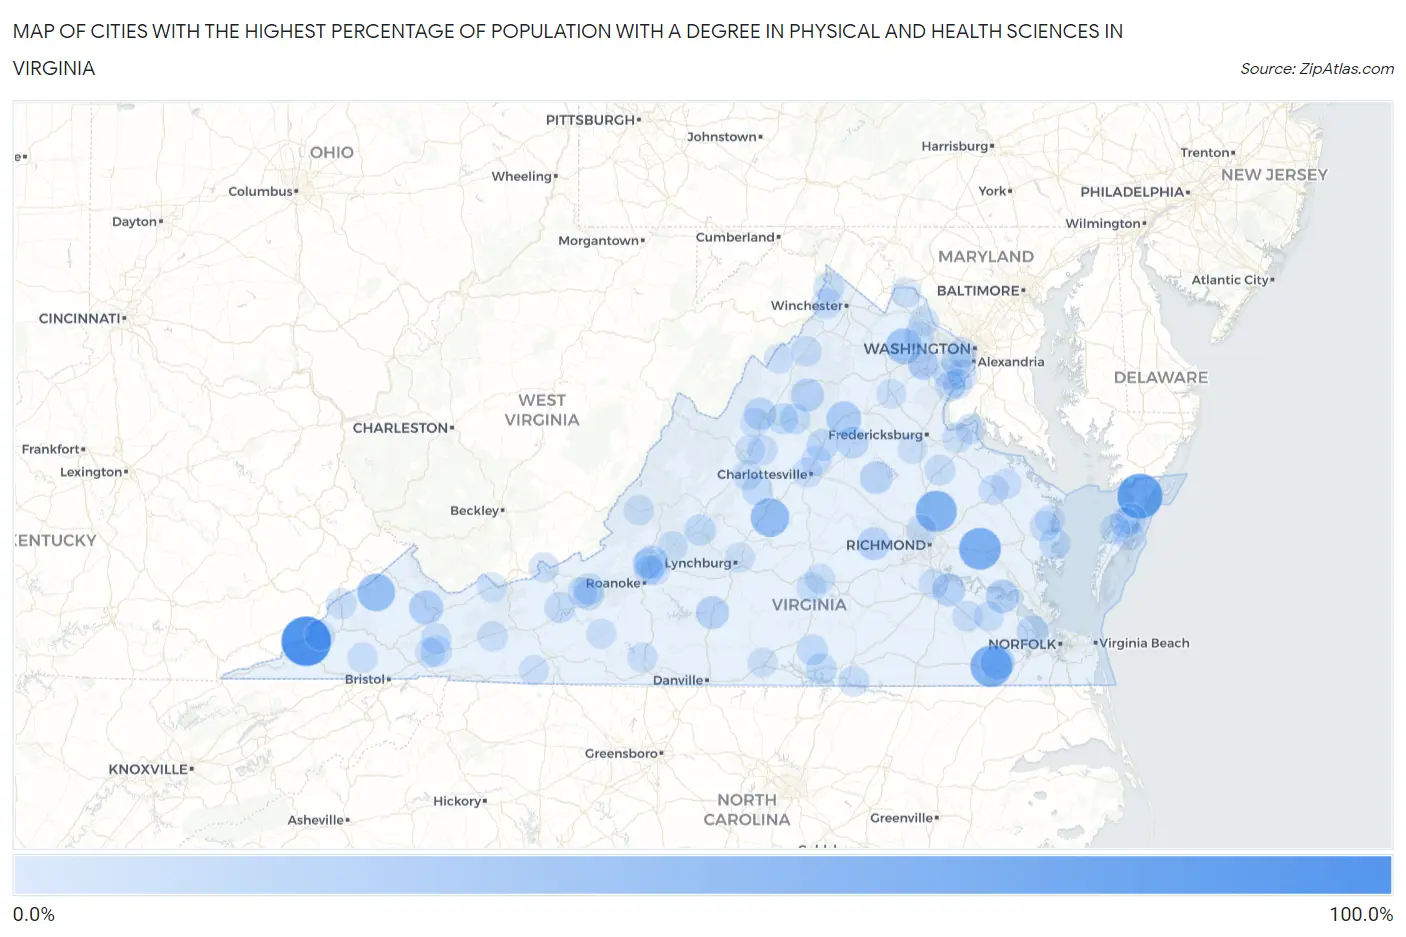
Map of Cities with the Highest Percentage of Population with a Degree in Physical and Health Sciences in Virginia
0.0%
100.0%
Cities with the Highest Percentage of Population with a Degree in Physical and Health Sciences in Virginia
| City | % Graduates | vs State | vs National | |
| 1. | Keokee | 100.0% | 3.2%(+96.8)#1 | 3.1%(+96.9)#7 |
| 2. | Hallwood | 77.8% | 3.2%(+74.6)#2 | 3.1%(+74.7)#30 |
| 3. | New Kent | 61.7% | 3.2%(+58.5)#3 | 3.1%(+58.6)#48 |
| 4. | Camptown | 59.5% | 3.2%(+56.3)#4 | 3.1%(+56.4)#51 |
| 5. | Hanover | 57.4% | 3.2%(+54.2)#5 | 3.1%(+54.3)#58 |
| 6. | Millboro | 50.0% | 3.2%(+46.8)#6 | 3.1%(+46.9)#91 |
| 7. | Shipman | 44.8% | 3.2%(+41.6)#7 | 3.1%(+41.7)#117 |
| 8. | Haysi | 40.9% | 3.2%(+37.7)#8 | 3.1%(+37.8)#131 |
| 9. | Bull Run Mountain Estates | 32.8% | 3.2%(+29.6)#9 | 3.1%(+29.7)#221 |
| 10. | Brightwood | 26.8% | 3.2%(+23.5)#10 | 3.1%(+23.7)#324 |
| 11. | Mount Clifton | 26.7% | 3.2%(+23.5)#11 | 3.1%(+23.6)#332 |
| 12. | Carrsville | 25.0% | 3.2%(+21.8)#12 | 3.1%(+21.9)#373 |
| 13. | Raven | 23.6% | 3.2%(+20.3)#13 | 3.1%(+20.5)#423 |
| 14. | Troutville | 22.1% | 3.2%(+18.8)#14 | 3.1%(+19.0)#471 |
| 15. | Scotland | 20.8% | 3.2%(+17.6)#15 | 3.1%(+17.7)#513 |
| 16. | Motley | 18.9% | 3.2%(+15.7)#16 | 3.1%(+15.8)#592 |
| 17. | Stanley | 18.8% | 3.2%(+15.5)#17 | 3.1%(+15.7)#603 |
| 18. | Prince George | 18.7% | 3.2%(+15.5)#18 | 3.1%(+15.6)#612 |
| 19. | Powhatan | 17.7% | 3.2%(+14.5)#19 | 3.1%(+14.6)#656 |
| 20. | Mineral | 17.4% | 3.2%(+14.2)#20 | 3.1%(+14.3)#677 |
| 21. | Orange | 15.3% | 3.2%(+12.0)#21 | 3.1%(+12.2)#850 |
| 22. | Belmont Estates | 14.9% | 3.2%(+11.6)#22 | 3.1%(+11.8)#889 |
| 23. | Moneta | 14.1% | 3.2%(+10.9)#23 | 3.1%(+11.0)#984 |
| 24. | Carrollton | 12.6% | 3.2%(+9.38)#24 | 3.1%(+9.49)#1,145 |
| 25. | Ruckersville | 12.4% | 3.2%(+9.21)#25 | 3.1%(+9.32)#1,171 |
| 26. | Deltaville | 11.6% | 3.2%(+8.35)#26 | 3.1%(+8.46)#1,284 |
| 27. | Glasgow | 10.8% | 3.2%(+7.62)#27 | 3.1%(+7.73)#1,409 |
| 28. | Glade Spring | 10.5% | 3.2%(+7.30)#28 | 3.1%(+7.41)#1,476 |
| 29. | Boydton | 10.4% | 3.2%(+7.18)#29 | 3.1%(+7.29)#1,503 |
| 30. | Blacksburg | 9.9% | 3.2%(+6.64)#30 | 3.1%(+6.75)#1,643 |
| 31. | Chase City | 9.1% | 3.2%(+5.88)#31 | 3.1%(+5.99)#1,833 |
| 32. | Massanutten | 9.0% | 3.2%(+5.79)#32 | 3.1%(+5.91)#1,890 |
| 33. | Wintergreen | 8.9% | 3.2%(+5.72)#33 | 3.1%(+5.83)#1,908 |
| 34. | Dublin | 8.8% | 3.2%(+5.61)#34 | 3.1%(+5.72)#1,942 |
| 35. | Accomac | 8.8% | 3.2%(+5.56)#35 | 3.1%(+5.67)#1,958 |
| 36. | Elkton | 8.7% | 3.2%(+5.52)#36 | 3.1%(+5.64)#1,968 |
| 37. | Pound | 8.5% | 3.2%(+5.26)#37 | 3.1%(+5.37)#2,061 |
| 38. | Merrimac | 8.4% | 3.2%(+5.20)#38 | 3.1%(+5.31)#2,081 |
| 39. | Saltville | 8.2% | 3.2%(+4.98)#39 | 3.1%(+5.09)#2,154 |
| 40. | Irvington | 7.9% | 3.2%(+4.68)#40 | 3.1%(+4.80)#2,274 |
| 41. | Shawneeland | 7.9% | 3.2%(+4.65)#41 | 3.1%(+4.77)#2,290 |
| 42. | Bracey | 7.8% | 3.2%(+4.61)#42 | 3.1%(+4.73)#2,306 |
| 43. | Waverly | 7.8% | 3.2%(+4.57)#43 | 3.1%(+4.68)#2,332 |
| 44. | Wachapreague | 7.7% | 3.2%(+4.48)#44 | 3.1%(+4.59)#2,381 |
| 45. | Bowling Green | 7.7% | 3.2%(+4.45)#45 | 3.1%(+4.56)#2,401 |
| 46. | Woodstock | 7.6% | 3.2%(+4.35)#46 | 3.1%(+4.46)#2,446 |
| 47. | Onley | 7.5% | 3.2%(+4.27)#47 | 3.1%(+4.38)#2,483 |
| 48. | Rio | 7.3% | 3.2%(+4.14)#48 | 3.1%(+4.25)#2,557 |
| 49. | New Hope | 7.2% | 3.2%(+3.99)#49 | 3.1%(+4.10)#2,647 |
| 50. | Union Mill | 7.2% | 3.2%(+3.98)#50 | 3.1%(+4.09)#2,658 |
| 51. | Dahlgren | 7.1% | 3.2%(+3.92)#51 | 3.1%(+4.03)#2,706 |
| 52. | Fort Belvoir | 7.1% | 3.2%(+3.92)#52 | 3.1%(+4.03)#2,709 |
| 53. | Lake Holiday | 7.0% | 3.2%(+3.77)#53 | 3.1%(+3.88)#2,793 |
| 54. | Loch Lomond | 6.8% | 3.2%(+3.61)#54 | 3.1%(+3.72)#2,899 |
| 55. | Crosspointe | 6.7% | 3.2%(+3.52)#55 | 3.1%(+3.63)#2,945 |
| 56. | Appalachia | 6.7% | 3.2%(+3.46)#56 | 3.1%(+3.57)#2,977 |
| 57. | Warsaw | 6.6% | 3.2%(+3.35)#57 | 3.1%(+3.47)#3,047 |
| 58. | Nickelsville | 6.5% | 3.2%(+3.24)#58 | 3.1%(+3.35)#3,119 |
| 59. | Covington | 6.3% | 3.2%(+3.13)#59 | 3.1%(+3.24)#3,201 |
| 60. | Bobtown | 6.3% | 3.2%(+3.07)#60 | 3.1%(+3.18)#3,229 |
| 61. | Woodbridge | 6.2% | 3.2%(+3.02)#61 | 3.1%(+3.13)#3,285 |
| 62. | North Springfield | 6.2% | 3.2%(+3.01)#62 | 3.1%(+3.13)#3,291 |
| 63. | King George | 6.2% | 3.2%(+2.98)#63 | 3.1%(+3.09)#3,311 |
| 64. | Seven Corners | 6.2% | 3.2%(+2.97)#64 | 3.1%(+3.08)#3,325 |
| 65. | Rural Retreat | 6.2% | 3.2%(+2.94)#65 | 3.1%(+3.05)#3,342 |
| 66. | Stuarts Draft | 6.0% | 3.2%(+2.79)#66 | 3.1%(+2.90)#3,454 |
| 67. | Stanleytown | 6.0% | 3.2%(+2.76)#67 | 3.1%(+2.87)#3,482 |
| 68. | Laurel | 6.0% | 3.2%(+2.75)#68 | 3.1%(+2.86)#3,492 |
| 69. | Rich Creek | 5.9% | 3.2%(+2.73)#69 | 3.1%(+2.84)#3,510 |
| 70. | Hollymead | 5.9% | 3.2%(+2.68)#70 | 3.1%(+2.79)#3,547 |
| 71. | Tappahannock | 5.9% | 3.2%(+2.67)#71 | 3.1%(+2.78)#3,554 |
| 72. | Brambleton | 5.8% | 3.2%(+2.61)#72 | 3.1%(+2.72)#3,613 |
| 73. | Prices Fork | 5.8% | 3.2%(+2.60)#73 | 3.1%(+2.71)#3,622 |
| 74. | University Of Virginia | 5.7% | 3.2%(+2.52)#74 | 3.1%(+2.63)#3,682 |
| 75. | Hampden Sydney | 5.7% | 3.2%(+2.48)#75 | 3.1%(+2.59)#3,716 |
| 76. | Laymantown | 5.7% | 3.2%(+2.48)#76 | 3.1%(+2.59)#3,717 |
| 77. | Buchanan | 5.6% | 3.2%(+2.39)#77 | 3.1%(+2.50)#3,796 |
| 78. | Dendron | 5.6% | 3.2%(+2.34)#78 | 3.1%(+2.46)#3,847 |
| 79. | Verona | 5.5% | 3.2%(+2.27)#79 | 3.1%(+2.38)#3,912 |
| 80. | Daleville | 5.5% | 3.2%(+2.25)#80 | 3.1%(+2.36)#3,936 |
| 81. | Floyd | 5.5% | 3.2%(+2.24)#81 | 3.1%(+2.35)#3,945 |
| 82. | Madison Heights | 5.4% | 3.2%(+2.23)#82 | 3.1%(+2.35)#3,954 |
| 83. | Farmville | 5.4% | 3.2%(+2.22)#83 | 3.1%(+2.34)#3,962 |
| 84. | Kilmarnock | 5.4% | 3.2%(+2.22)#84 | 3.1%(+2.33)#3,975 |
| 85. | Cloverdale | 5.3% | 3.2%(+2.07)#85 | 3.1%(+2.18)#4,124 |
| 86. | Sudley | 5.3% | 3.2%(+2.04)#86 | 3.1%(+2.15)#4,176 |
| 87. | Colonial Heights | 5.2% | 3.2%(+2.03)#87 | 3.1%(+2.14)#4,188 |
| 88. | Bridgewater | 5.2% | 3.2%(+1.98)#88 | 3.1%(+2.09)#4,231 |
| 89. | Bluefield | 5.1% | 3.2%(+1.93)#89 | 3.1%(+2.04)#4,290 |
| 90. | Mason Neck | 5.0% | 3.2%(+1.83)#90 | 3.1%(+1.94)#4,406 |
| 91. | Braddock | 5.0% | 3.2%(+1.81)#91 | 3.1%(+1.92)#4,428 |
| 92. | Lovettsville | 5.0% | 3.2%(+1.74)#92 | 3.1%(+1.85)#4,504 |
| 93. | Emory | 4.9% | 3.2%(+1.71)#93 | 3.1%(+1.82)#4,545 |
| 94. | Lansdowne | 4.9% | 3.2%(+1.70)#94 | 3.1%(+1.82)#4,552 |
| 95. | Bealeton | 4.9% | 3.2%(+1.69)#95 | 3.1%(+1.80)#4,577 |
| 96. | Basye | 4.9% | 3.2%(+1.66)#96 | 3.1%(+1.77)#4,619 |
| 97. | South Boston | 4.9% | 3.2%(+1.65)#97 | 3.1%(+1.76)#4,632 |
| 98. | Galax | 4.8% | 3.2%(+1.61)#98 | 3.1%(+1.72)#4,690 |
| 99. | Spotsylvania Courthouse | 4.8% | 3.2%(+1.56)#99 | 3.1%(+1.67)#4,730 |
| 100. | Woodlawn Cdp Fairfax County | 4.7% | 3.2%(+1.51)#100 | 3.1%(+1.62)#4,823 |
Common Questions
What are the Top 10 Cities with the Highest Percentage of Population with a Degree in Physical and Health Sciences in Virginia?
Top 10 Cities with the Highest Percentage of Population with a Degree in Physical and Health Sciences in Virginia are:
#1
100.0%
#2
77.8%
#3
61.7%
#4
59.5%
#5
57.4%
#6
44.8%
#7
40.9%
#8
32.8%
#9
26.8%
#10
25.0%
What city has the Highest Percentage of Population with a Degree in Physical and Health Sciences in Virginia?
Keokee has the Highest Percentage of Population with a Degree in Physical and Health Sciences in Virginia with 100.0%.
What is the Percentage of Population with a Degree in Physical and Health Sciences in the State of Virginia?
Percentage of Population with a Degree in Physical and Health Sciences in Virginia is 3.2%.
What is the Percentage of Population with a Degree in Physical and Health Sciences in the United States?
Percentage of Population with a Degree in Physical and Health Sciences in the United States is 3.1%.