Cities with the Highest Percentage of Population with a Degree in Physical and Health Sciences in New Hampshire
RELATED REPORTS & OPTIONS
Physical and Health Sciences
New Hampshire
Compare Cities
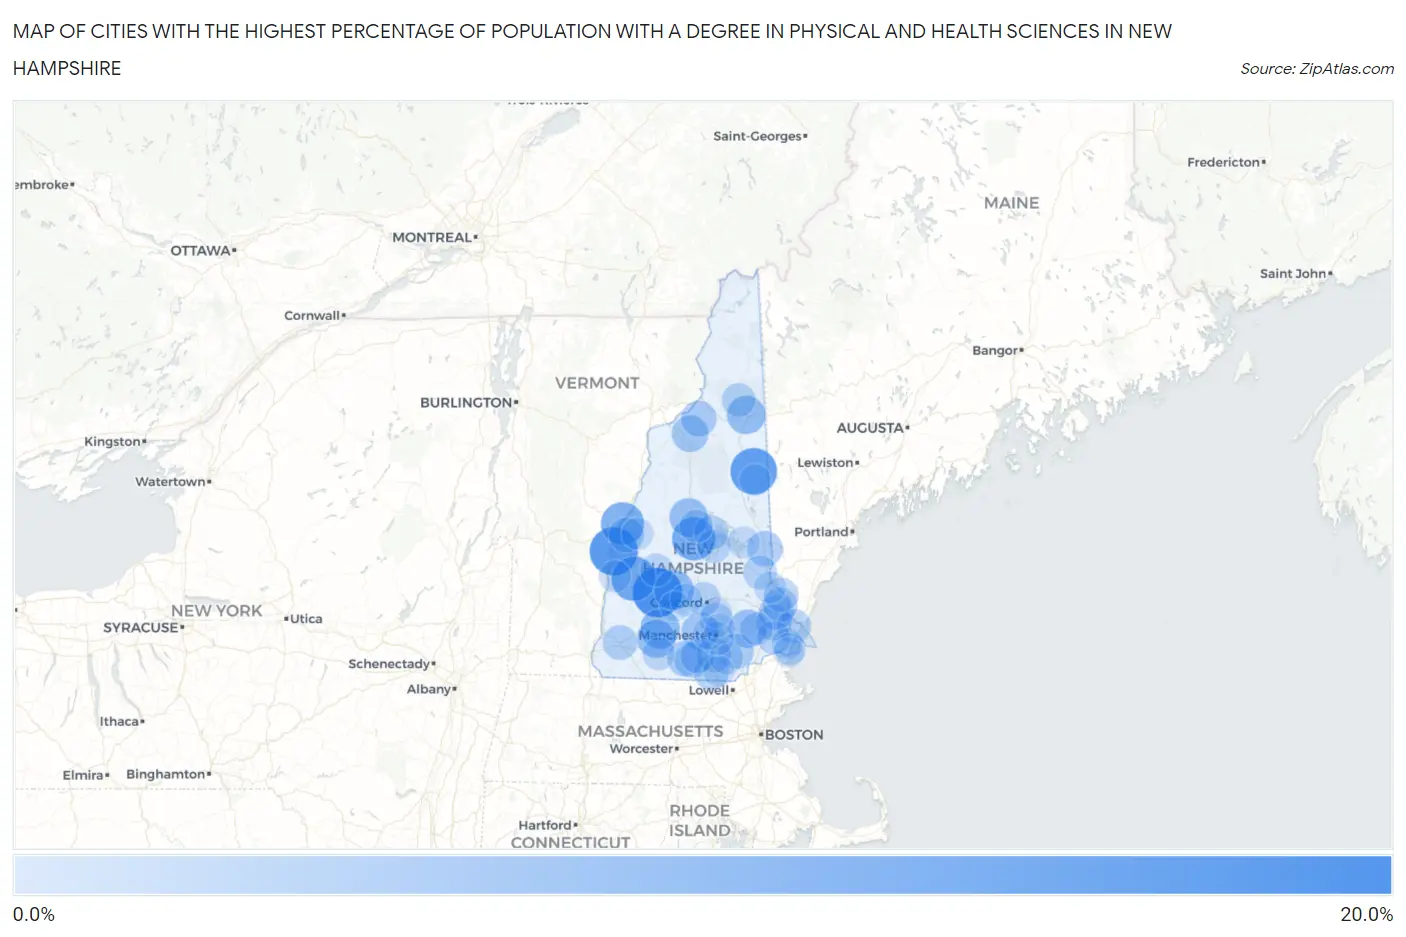
Map of Cities with the Highest Percentage of Population with a Degree in Physical and Health Sciences in New Hampshire
0.0%
20.0%
Cities with the Highest Percentage of Population with a Degree in Physical and Health Sciences in New Hampshire
| City | % Graduates | vs State | vs National | |
| 1. | Bradford | 16.1% | 3.3%(+12.9)#1 | 3.1%(+13.0)#776 |
| 2. | Klondike Corner | 15.0% | 3.3%(+11.8)#2 | 3.1%(+11.9)#864 |
| 3. | Plainfield | 15.0% | 3.3%(+11.7)#3 | 3.1%(+11.9)#874 |
| 4. | North Conway | 13.6% | 3.3%(+10.3)#4 | 3.1%(+10.5)#1,029 |
| 5. | Newport | 11.9% | 3.3%(+8.69)#5 | 3.1%(+8.85)#1,226 |
| 6. | New Hampton | 10.9% | 3.3%(+7.62)#6 | 3.1%(+7.78)#1,394 |
| 7. | Hanover | 10.6% | 3.3%(+7.35)#7 | 3.1%(+7.51)#1,442 |
| 8. | Warner | 7.9% | 3.3%(+4.64)#8 | 3.1%(+4.80)#2,277 |
| 9. | Antrim | 7.8% | 3.3%(+4.54)#9 | 3.1%(+4.69)#2,328 |
| 10. | Plymouth | 6.9% | 3.3%(+3.60)#10 | 3.1%(+3.76)#2,879 |
| 11. | Gorham | 6.8% | 3.3%(+3.57)#11 | 3.1%(+3.72)#2,896 |
| 12. | Hancock | 6.8% | 3.3%(+3.51)#12 | 3.1%(+3.67)#2,926 |
| 13. | Raymond | 6.5% | 3.3%(+3.23)#13 | 3.1%(+3.39)#3,089 |
| 14. | Goffstown | 5.6% | 3.3%(+2.39)#14 | 3.1%(+2.55)#3,757 |
| 15. | Bethlehem | 5.3% | 3.3%(+2.06)#15 | 3.1%(+2.21)#4,088 |
| 16. | Whitefield | 4.5% | 3.3%(+1.29)#16 | 3.1%(+1.45)#5,073 |
| 17. | Sanbornville | 4.5% | 3.3%(+1.23)#17 | 3.1%(+1.39)#5,171 |
| 18. | Newmarket | 4.5% | 3.3%(+1.22)#18 | 3.1%(+1.38)#5,195 |
| 19. | Derry | 4.3% | 3.3%(+1.01)#19 | 3.1%(+1.17)#5,516 |
| 20. | Milford | 4.2% | 3.3%(+0.955)#20 | 3.1%(+1.11)#5,605 |
| 21. | Wilton | 4.2% | 3.3%(+0.937)#21 | 3.1%(+1.09)#5,623 |
| 22. | Lebanon | 4.2% | 3.3%(+0.910)#22 | 3.1%(+1.07)#5,657 |
| 23. | Francestown | 4.2% | 3.3%(+0.910)#23 | 3.1%(+1.07)#5,694 |
| 24. | Durham | 4.0% | 3.3%(+0.762)#24 | 3.1%(+0.919)#5,932 |
| 25. | Nashua | 4.0% | 3.3%(+0.724)#25 | 3.1%(+0.881)#6,012 |
| 26. | East Merrimack | 3.8% | 3.3%(+0.554)#26 | 3.1%(+0.711)#6,345 |
| 27. | Keene | 3.8% | 3.3%(+0.537)#27 | 3.1%(+0.694)#6,386 |
| 28. | Dover | 3.7% | 3.3%(+0.429)#28 | 3.1%(+0.585)#6,616 |
| 29. | Portsmouth | 3.6% | 3.3%(+0.350)#29 | 3.1%(+0.507)#6,777 |
| 30. | Meredith | 3.5% | 3.3%(+0.269)#30 | 3.1%(+0.426)#6,973 |
| 31. | Amherst | 3.4% | 3.3%(+0.111)#31 | 3.1%(+0.268)#7,352 |
| 32. | Somersworth | 3.4% | 3.3%(+0.097)#32 | 3.1%(+0.254)#7,383 |
| 33. | Hooksett | 3.1% | 3.3%(-0.158)#33 | 3.1%(-0.001)#8,019 |
| 34. | Farmington | 3.1% | 3.3%(-0.170)#34 | 3.1%(-0.013)#8,052 |
| 35. | Berlin | 3.0% | 3.3%(-0.216)#35 | 3.1%(-0.059)#8,176 |
| 36. | Londonderry | 3.0% | 3.3%(-0.253)#36 | 3.1%(-0.096)#8,288 |
| 37. | Concord | 2.9% | 3.3%(-0.351)#37 | 3.1%(-0.194)#8,571 |
| 38. | Laconia | 2.8% | 3.3%(-0.473)#38 | 3.1%(-0.317)#8,936 |
| 39. | Exeter | 2.7% | 3.3%(-0.570)#39 | 3.1%(-0.414)#9,248 |
| 40. | New London | 2.5% | 3.3%(-0.756)#40 | 3.1%(-0.600)#9,807 |
| 41. | Ashland | 2.5% | 3.3%(-0.793)#41 | 3.1%(-0.637)#9,913 |
| 42. | Epping | 2.4% | 3.3%(-0.876)#42 | 3.1%(-0.719)#10,144 |
| 43. | Manchester | 2.4% | 3.3%(-0.903)#43 | 3.1%(-0.746)#10,216 |
| 44. | Contoocook | 2.0% | 3.3%(-1.23)#44 | 3.1%(-1.08)#11,208 |
| 45. | Peterborough | 2.0% | 3.3%(-1.28)#45 | 3.1%(-1.13)#11,381 |
| 46. | Claremont | 1.7% | 3.3%(-1.52)#46 | 3.1%(-1.37)#12,097 |
| 47. | Enfield | 1.7% | 3.3%(-1.57)#47 | 3.1%(-1.41)#12,225 |
| 48. | Pinardville | 1.7% | 3.3%(-1.59)#48 | 3.1%(-1.43)#12,274 |
| 49. | Wolfeboro | 1.7% | 3.3%(-1.60)#49 | 3.1%(-1.45)#12,312 |
| 50. | Rochester | 1.6% | 3.3%(-1.67)#50 | 3.1%(-1.51)#12,485 |
| 51. | Hampton Beach | 1.6% | 3.3%(-1.69)#51 | 3.1%(-1.53)#12,541 |
| 52. | Conway | 1.4% | 3.3%(-1.84)#52 | 3.1%(-1.68)#12,947 |
| 53. | Hampton | 1.4% | 3.3%(-1.87)#53 | 3.1%(-1.72)#13,034 |
| 54. | Hudson | 0.90% | 3.3%(-2.36)#54 | 3.1%(-2.20)#14,185 |
| 55. | Suncook | 0.78% | 3.3%(-2.48)#55 | 3.1%(-2.32)#14,406 |
| 56. | Seabrook Beach | 0.58% | 3.3%(-2.67)#56 | 3.1%(-2.51)#14,676 |
| 57. | South Hooksett | 0.35% | 3.3%(-2.91)#57 | 3.1%(-2.75)#14,926 |
| 58. | Henniker | 0.26% | 3.3%(-2.99)#58 | 3.1%(-2.84)#14,972 |
1
Common Questions
What are the Top 10 Cities with the Highest Percentage of Population with a Degree in Physical and Health Sciences in New Hampshire?
Top 10 Cities with the Highest Percentage of Population with a Degree in Physical and Health Sciences in New Hampshire are:
#1
16.1%
#2
15.0%
#3
13.6%
#4
11.9%
#5
10.9%
#6
10.6%
#7
7.9%
#8
7.8%
#9
6.9%
#10
6.8%
What city has the Highest Percentage of Population with a Degree in Physical and Health Sciences in New Hampshire?
Bradford has the Highest Percentage of Population with a Degree in Physical and Health Sciences in New Hampshire with 16.1%.
What is the Percentage of Population with a Degree in Physical and Health Sciences in the State of New Hampshire?
Percentage of Population with a Degree in Physical and Health Sciences in New Hampshire is 3.3%.
What is the Percentage of Population with a Degree in Physical and Health Sciences in the United States?
Percentage of Population with a Degree in Physical and Health Sciences in the United States is 3.1%.