Cities with the Highest Percentage of Population with a Degree in Physical and Health Sciences in Georgia
RELATED REPORTS & OPTIONS
Physical and Health Sciences
Georgia
Compare Cities
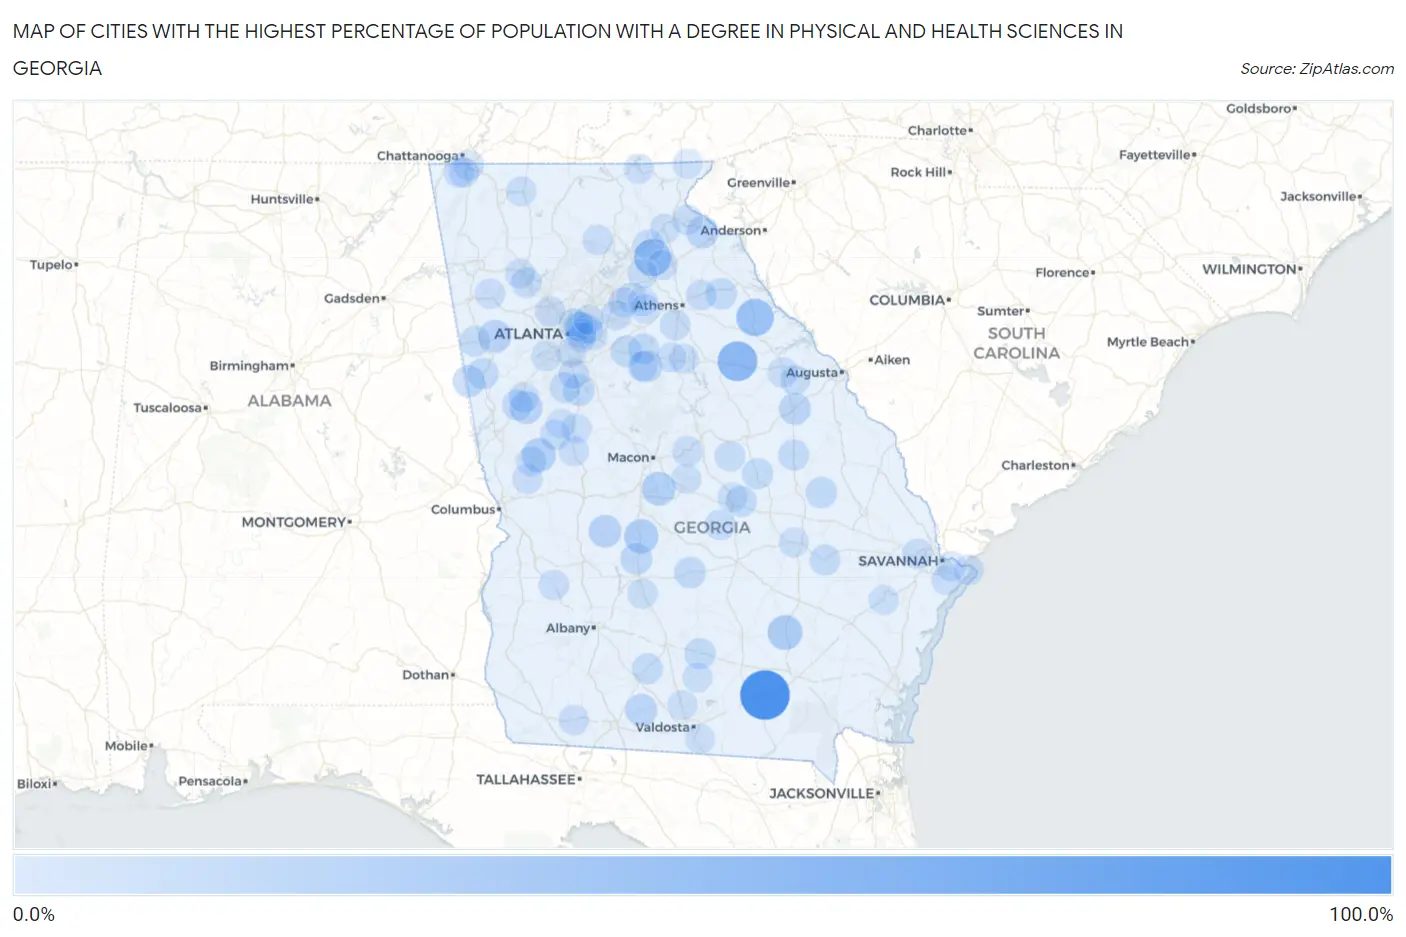
Map of Cities with the Highest Percentage of Population with a Degree in Physical and Health Sciences in Georgia
0.0%
100.0%
Cities with the Highest Percentage of Population with a Degree in Physical and Health Sciences in Georgia
| City | % Graduates | vs State | vs National | |
| 1. | Argyle | 100.0% | 2.6%(+97.4)#1 | 3.1%(+96.9)#5 |
| 2. | Crawfordville | 50.8% | 2.6%(+48.2)#2 | 3.1%(+47.7)#77 |
| 3. | Tignall | 39.1% | 2.6%(+36.5)#3 | 3.1%(+36.0)#148 |
| 4. | Gillsville | 38.5% | 2.6%(+35.9)#4 | 3.1%(+35.4)#159 |
| 5. | Alma | 26.7% | 2.6%(+24.1)#5 | 3.1%(+23.6)#326 |
| 6. | Unadilla | 24.3% | 2.6%(+21.7)#6 | 3.1%(+21.2)#410 |
| 7. | Manchester | 22.7% | 2.6%(+20.2)#7 | 3.1%(+19.6)#447 |
| 8. | Robins Afb | 21.7% | 2.6%(+19.1)#8 | 3.1%(+18.6)#480 |
| 9. | Luthersville | 17.9% | 2.6%(+15.4)#9 | 3.1%(+14.8)#643 |
| 10. | Temple | 17.5% | 2.6%(+14.9)#10 | 3.1%(+14.4)#667 |
| 11. | Oglethorpe | 16.9% | 2.6%(+14.3)#11 | 3.1%(+13.8)#702 |
| 12. | Newborn | 14.9% | 2.6%(+12.3)#12 | 3.1%(+11.8)#876 |
| 13. | Pavo | 14.6% | 2.6%(+12.0)#13 | 3.1%(+11.5)#912 |
| 14. | Martin | 14.3% | 2.6%(+11.7)#14 | 3.1%(+11.2)#953 |
| 15. | Wrens | 13.8% | 2.6%(+11.2)#15 | 3.1%(+10.7)#1,013 |
| 16. | Ephesus | 13.5% | 2.6%(+10.9)#16 | 3.1%(+10.4)#1,043 |
| 17. | Vienna | 12.9% | 2.6%(+10.3)#17 | 3.1%(+9.82)#1,112 |
| 18. | Sunny Side | 12.5% | 2.6%(+9.90)#18 | 3.1%(+9.40)#1,165 |
| 19. | Abbeville | 11.8% | 2.6%(+9.17)#19 | 3.1%(+8.66)#1,248 |
| 20. | Carlton | 11.8% | 2.6%(+9.17)#20 | 3.1%(+8.66)#1,253 |
| 21. | Twin City | 11.5% | 2.6%(+8.94)#21 | 3.1%(+8.44)#1,286 |
| 22. | Oxford | 11.5% | 2.6%(+8.86)#22 | 3.1%(+8.36)#1,302 |
| 23. | Roopville | 11.1% | 2.6%(+8.52)#23 | 3.1%(+8.01)#1,351 |
| 24. | Alapaha | 10.6% | 2.6%(+7.99)#24 | 3.1%(+7.49)#1,448 |
| 25. | Wildwood | 10.6% | 2.6%(+7.97)#25 | 3.1%(+7.47)#1,453 |
| 26. | East Dublin | 10.0% | 2.6%(+7.37)#26 | 3.1%(+6.87)#1,628 |
| 27. | Wadley | 9.7% | 2.6%(+7.08)#27 | 3.1%(+6.58)#1,675 |
| 28. | Wrightsville | 9.6% | 2.6%(+6.97)#28 | 3.1%(+6.47)#1,704 |
| 29. | Social Circle | 9.5% | 2.6%(+6.91)#29 | 3.1%(+6.40)#1,731 |
| 30. | Scottdale | 9.2% | 2.6%(+6.58)#30 | 3.1%(+6.08)#1,819 |
| 31. | Reidsville | 9.1% | 2.6%(+6.50)#31 | 3.1%(+5.99)#1,832 |
| 32. | Grantville | 8.9% | 2.6%(+6.29)#32 | 3.1%(+5.79)#1,924 |
| 33. | Norman Park | 8.9% | 2.6%(+6.29)#33 | 3.1%(+5.79)#1,926 |
| 34. | Woolsey | 8.8% | 2.6%(+6.18)#34 | 3.1%(+5.67)#1,960 |
| 35. | Georgetown Quitman County Unified Government | 8.6% | 2.6%(+6.05)#35 | 3.1%(+5.55)#2,004 |
| 36. | Waco | 8.6% | 2.6%(+5.98)#36 | 3.1%(+5.47)#2,035 |
| 37. | Cadwell | 8.3% | 2.6%(+5.74)#37 | 3.1%(+5.23)#2,102 |
| 38. | Lula | 7.9% | 2.6%(+5.28)#38 | 3.1%(+4.78)#2,283 |
| 39. | North Druid Hills | 7.7% | 2.6%(+5.11)#39 | 3.1%(+4.61)#2,362 |
| 40. | Oconee | 7.7% | 2.6%(+5.10)#40 | 3.1%(+4.59)#2,380 |
| 41. | Molena | 7.4% | 2.6%(+4.81)#41 | 3.1%(+4.31)#2,520 |
| 42. | Colbert | 7.2% | 2.6%(+4.62)#42 | 3.1%(+4.12)#2,642 |
| 43. | Bishop | 7.2% | 2.6%(+4.60)#43 | 3.1%(+4.09)#2,655 |
| 44. | Redan | 6.9% | 2.6%(+4.29)#44 | 3.1%(+3.78)#2,852 |
| 45. | Dawsonville | 6.9% | 2.6%(+4.26)#45 | 3.1%(+3.76)#2,875 |
| 46. | Toccoa | 6.8% | 2.6%(+4.23)#46 | 3.1%(+3.73)#2,893 |
| 47. | Bonanza | 6.8% | 2.6%(+4.17)#47 | 3.1%(+3.66)#2,927 |
| 48. | Auburn | 6.8% | 2.6%(+4.15)#48 | 3.1%(+3.65)#2,933 |
| 49. | Lakeview | 6.7% | 2.6%(+4.12)#49 | 3.1%(+3.61)#2,957 |
| 50. | Dacula | 6.7% | 2.6%(+4.12)#50 | 3.1%(+3.61)#2,959 |
| 51. | Waverly Hall | 6.7% | 2.6%(+4.07)#51 | 3.1%(+3.57)#2,987 |
| 52. | Emerson | 6.6% | 2.6%(+4.05)#52 | 3.1%(+3.55)#3,006 |
| 53. | Chattanooga Valley | 6.6% | 2.6%(+4.01)#53 | 3.1%(+3.51)#3,025 |
| 54. | Grayson | 6.6% | 2.6%(+4.00)#54 | 3.1%(+3.49)#3,033 |
| 55. | Aragon | 6.5% | 2.6%(+3.93)#55 | 3.1%(+3.42)#3,069 |
| 56. | Moreland | 6.4% | 2.6%(+3.83)#56 | 3.1%(+3.32)#3,144 |
| 57. | Mansfield | 6.4% | 2.6%(+3.79)#57 | 3.1%(+3.28)#3,172 |
| 58. | Bloomingdale | 6.4% | 2.6%(+3.78)#58 | 3.1%(+3.27)#3,178 |
| 59. | Thomson | 6.2% | 2.6%(+3.64)#59 | 3.1%(+3.14)#3,280 |
| 60. | Thomaston | 6.2% | 2.6%(+3.63)#60 | 3.1%(+3.13)#3,289 |
| 61. | Whigham | 6.2% | 2.6%(+3.59)#61 | 3.1%(+3.09)#3,319 |
| 62. | Tybee Island | 6.1% | 2.6%(+3.55)#62 | 3.1%(+3.04)#3,350 |
| 63. | Maysville | 6.1% | 2.6%(+3.50)#63 | 3.1%(+3.00)#3,380 |
| 64. | Gordon | 6.1% | 2.6%(+3.47)#64 | 3.1%(+2.96)#3,405 |
| 65. | Parrott | 6.1% | 2.6%(+3.47)#65 | 3.1%(+2.96)#3,418 |
| 66. | Pine Lake | 6.0% | 2.6%(+3.38)#66 | 3.1%(+2.87)#3,479 |
| 67. | Arabi | 5.9% | 2.6%(+3.29)#67 | 3.1%(+2.78)#3,560 |
| 68. | Shiloh | 5.9% | 2.6%(+3.29)#68 | 3.1%(+2.78)#3,564 |
| 69. | Fair Oaks | 5.7% | 2.6%(+3.09)#69 | 3.1%(+2.59)#3,722 |
| 70. | Fairview | 5.6% | 2.6%(+2.99)#70 | 3.1%(+2.48)#3,807 |
| 71. | Dearing | 5.6% | 2.6%(+2.96)#71 | 3.1%(+2.46)#3,836 |
| 72. | Chatsworth | 5.5% | 2.6%(+2.92)#72 | 3.1%(+2.41)#3,878 |
| 73. | Hiawassee | 5.4% | 2.6%(+2.84)#73 | 3.1%(+2.34)#3,964 |
| 74. | Union City | 5.4% | 2.6%(+2.81)#74 | 3.1%(+2.30)#4,000 |
| 75. | Whitemarsh Island | 5.4% | 2.6%(+2.78)#75 | 3.1%(+2.27)#4,031 |
| 76. | Cusseta Chattahoochee County Unified Government | 5.4% | 2.6%(+2.76)#76 | 3.1%(+2.26)#4,041 |
| 77. | Hahira | 5.3% | 2.6%(+2.75)#77 | 3.1%(+2.24)#4,062 |
| 78. | Belvedere Park | 5.3% | 2.6%(+2.72)#78 | 3.1%(+2.21)#4,089 |
| 79. | Meansville | 5.3% | 2.6%(+2.67)#79 | 3.1%(+2.16)#4,161 |
| 80. | Cartersville | 5.2% | 2.6%(+2.64)#80 | 3.1%(+2.13)#4,194 |
| 81. | Candler Mcafee | 5.1% | 2.6%(+2.54)#81 | 3.1%(+2.04)#4,291 |
| 82. | Vidalia | 5.1% | 2.6%(+2.54)#82 | 3.1%(+2.03)#4,299 |
| 83. | Buckhead | 5.1% | 2.6%(+2.53)#83 | 3.1%(+2.03)#4,317 |
| 84. | Winder | 5.1% | 2.6%(+2.53)#84 | 3.1%(+2.03)#4,319 |
| 85. | Dublin | 5.1% | 2.6%(+2.51)#85 | 3.1%(+2.01)#4,337 |
| 86. | Bethlehem | 5.1% | 2.6%(+2.49)#86 | 3.1%(+1.99)#4,357 |
| 87. | Concord | 5.1% | 2.6%(+2.49)#87 | 3.1%(+1.99)#4,358 |
| 88. | Cornelia | 5.1% | 2.6%(+2.48)#88 | 3.1%(+1.97)#4,372 |
| 89. | Jeffersonville | 5.0% | 2.6%(+2.40)#89 | 3.1%(+1.90)#4,449 |
| 90. | Talmo | 5.0% | 2.6%(+2.40)#90 | 3.1%(+1.90)#4,455 |
| 91. | North Decatur | 4.9% | 2.6%(+2.35)#91 | 3.1%(+1.84)#4,512 |
| 92. | Tucker | 4.9% | 2.6%(+2.33)#92 | 3.1%(+1.82)#4,537 |
| 93. | Dasher | 4.9% | 2.6%(+2.32)#93 | 3.1%(+1.82)#4,544 |
| 94. | Nashville | 4.9% | 2.6%(+2.28)#94 | 3.1%(+1.78)#4,599 |
| 95. | Allenhurst | 4.9% | 2.6%(+2.28)#95 | 3.1%(+1.78)#4,606 |
| 96. | Sky Valley | 4.8% | 2.6%(+2.20)#96 | 3.1%(+1.70)#4,709 |
| 97. | Skidaway Island | 4.8% | 2.6%(+2.20)#97 | 3.1%(+1.70)#4,711 |
| 98. | Fairfield Plantation | 4.7% | 2.6%(+2.14)#98 | 3.1%(+1.63)#4,803 |
| 99. | Forest Park | 4.7% | 2.6%(+2.14)#99 | 3.1%(+1.63)#4,805 |
| 100. | Madison | 4.7% | 2.6%(+2.10)#100 | 3.1%(+1.59)#4,859 |
Common Questions
What are the Top 10 Cities with the Highest Percentage of Population with a Degree in Physical and Health Sciences in Georgia?
Top 10 Cities with the Highest Percentage of Population with a Degree in Physical and Health Sciences in Georgia are:
#1
100.0%
#2
50.8%
#3
39.1%
#4
38.5%
#5
26.7%
#6
24.3%
#7
22.7%
#8
21.7%
#9
17.9%
#10
17.5%
What city has the Highest Percentage of Population with a Degree in Physical and Health Sciences in Georgia?
Argyle has the Highest Percentage of Population with a Degree in Physical and Health Sciences in Georgia with 100.0%.
What is the Percentage of Population with a Degree in Physical and Health Sciences in the State of Georgia?
Percentage of Population with a Degree in Physical and Health Sciences in Georgia is 2.6%.
What is the Percentage of Population with a Degree in Physical and Health Sciences in the United States?
Percentage of Population with a Degree in Physical and Health Sciences in the United States is 3.1%.