Cities with the Highest Percentage of Population with a Degree in Physical and Health Sciences in Tennessee
RELATED REPORTS & OPTIONS
Physical and Health Sciences
Tennessee
Compare Cities
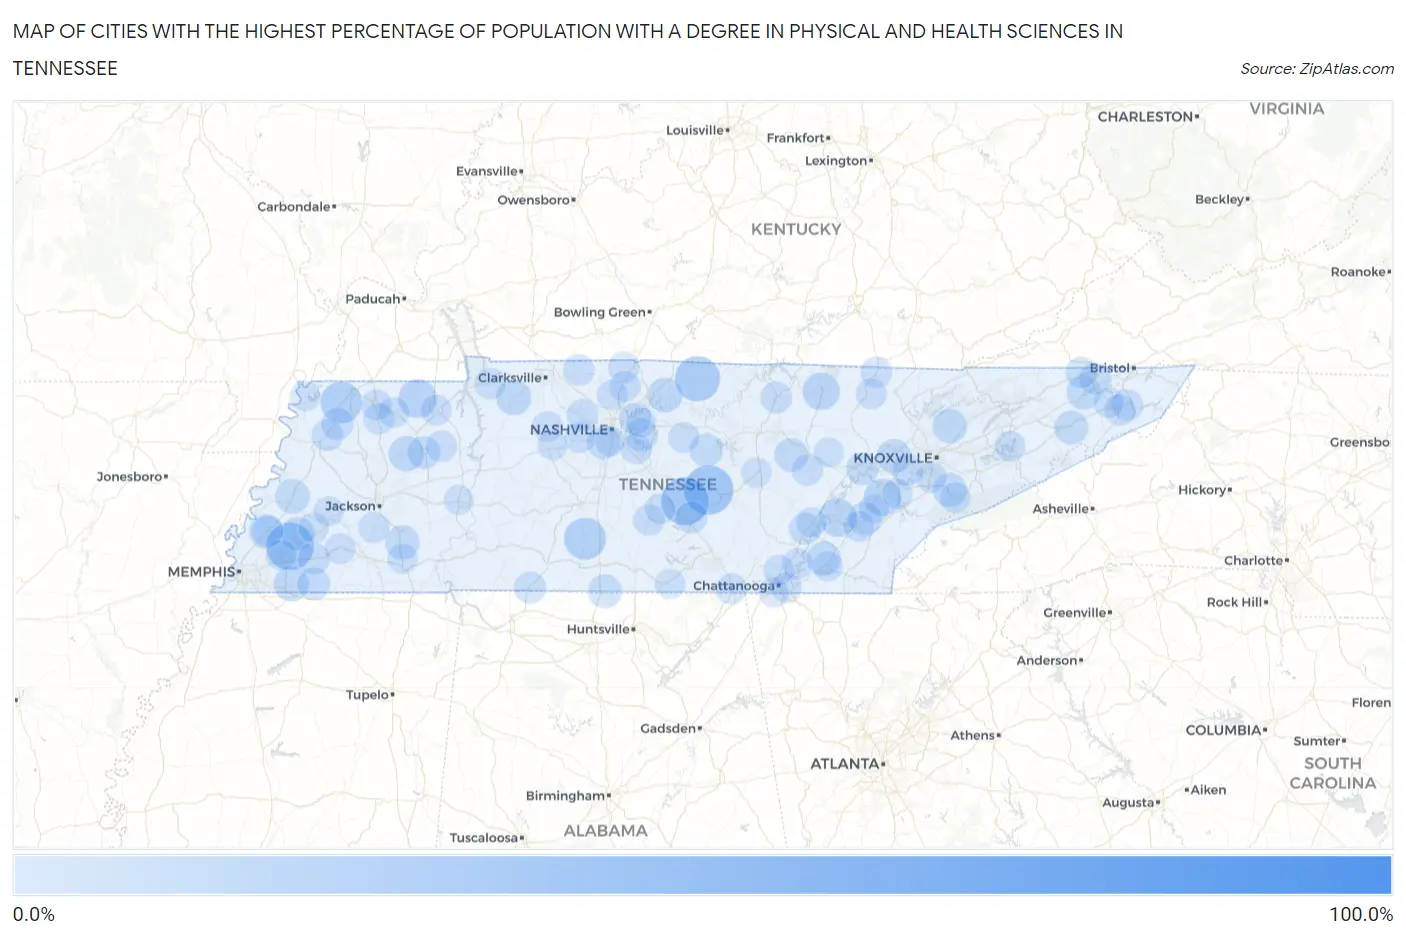
Map of Cities with the Highest Percentage of Population with a Degree in Physical and Health Sciences in Tennessee
0.0%
100.0%
Cities with the Highest Percentage of Population with a Degree in Physical and Health Sciences in Tennessee
| City | % Graduates | vs State | vs National | |
| 1. | Sequatchie | 100.0% | 3.1%(+96.9)#1 | 3.1%(+96.9)#6 |
| 2. | Big Rock | 100.0% | 3.1%(+96.9)#2 | 3.1%(+96.9)#11 |
| 3. | Centertown | 33.3% | 3.1%(+30.2)#3 | 3.1%(+30.2)#203 |
| 4. | Lakewood Park | 31.2% | 3.1%(+28.1)#4 | 3.1%(+28.2)#239 |
| 5. | Gallaway | 30.4% | 3.1%(+27.3)#5 | 3.1%(+27.3)#251 |
| 6. | Lafayette | 26.7% | 3.1%(+23.5)#6 | 3.1%(+23.6)#325 |
| 7. | Lynnville | 21.9% | 3.1%(+18.8)#7 | 3.1%(+18.8)#473 |
| 8. | Troy | 21.3% | 3.1%(+18.1)#8 | 3.1%(+18.2)#498 |
| 9. | Cottage Grove | 16.7% | 3.1%(+13.5)#9 | 3.1%(+13.6)#744 |
| 10. | Decatur | 15.7% | 3.1%(+12.5)#10 | 3.1%(+12.6)#808 |
| 11. | Jamestown | 14.9% | 3.1%(+11.8)#11 | 3.1%(+11.8)#880 |
| 12. | Philadelphia | 14.4% | 3.1%(+11.3)#12 | 3.1%(+11.3)#928 |
| 13. | Mclemoresville | 12.1% | 3.1%(+8.97)#13 | 3.1%(+9.02)#1,205 |
| 14. | Cumberland City | 12.0% | 3.1%(+8.85)#14 | 3.1%(+8.90)#1,219 |
| 15. | Piperton | 11.7% | 3.1%(+8.55)#15 | 3.1%(+8.60)#1,265 |
| 16. | Castalian Springs | 11.2% | 3.1%(+8.07)#16 | 3.1%(+8.12)#1,338 |
| 17. | Henning | 11.1% | 3.1%(+7.96)#17 | 3.1%(+8.01)#1,347 |
| 18. | Valley Forge | 10.5% | 3.1%(+7.34)#18 | 3.1%(+7.39)#1,480 |
| 19. | Walland | 10.4% | 3.1%(+7.27)#19 | 3.1%(+7.32)#1,492 |
| 20. | Finger | 10.3% | 3.1%(+7.20)#20 | 3.1%(+7.25)#1,513 |
| 21. | Munford | 10.3% | 3.1%(+7.18)#21 | 3.1%(+7.23)#1,516 |
| 22. | Hopewell | 10.3% | 3.1%(+7.15)#22 | 3.1%(+7.20)#1,529 |
| 23. | Oak Ridge | 10.3% | 3.1%(+7.15)#23 | 3.1%(+7.20)#1,530 |
| 24. | Plainview | 10.3% | 3.1%(+7.14)#24 | 3.1%(+7.19)#1,531 |
| 25. | Fall Branch | 10.1% | 3.1%(+6.96)#25 | 3.1%(+7.01)#1,577 |
| 26. | Tusculum | 9.9% | 3.1%(+6.76)#26 | 3.1%(+6.81)#1,635 |
| 27. | Mason | 9.7% | 3.1%(+6.58)#27 | 3.1%(+6.63)#1,667 |
| 28. | Pleasant Hill | 9.7% | 3.1%(+6.55)#28 | 3.1%(+6.60)#1,673 |
| 29. | Ardmore | 9.6% | 3.1%(+6.41)#29 | 3.1%(+6.46)#1,709 |
| 30. | Niota | 9.2% | 3.1%(+6.08)#30 | 3.1%(+6.13)#1,810 |
| 31. | Forest Hills | 9.1% | 3.1%(+5.96)#31 | 3.1%(+6.01)#1,826 |
| 32. | Dowelltown | 9.1% | 3.1%(+5.94)#32 | 3.1%(+5.99)#1,851 |
| 33. | Rural Hill | 8.6% | 3.1%(+5.46)#33 | 3.1%(+5.51)#2,016 |
| 34. | Moscow | 8.3% | 3.1%(+5.18)#34 | 3.1%(+5.23)#2,100 |
| 35. | Huntingdon | 8.2% | 3.1%(+5.01)#35 | 3.1%(+5.06)#2,168 |
| 36. | Midtown | 7.7% | 3.1%(+4.59)#36 | 3.1%(+4.64)#2,353 |
| 37. | Somerville | 7.5% | 3.1%(+4.32)#37 | 3.1%(+4.37)#2,484 |
| 38. | Mcdonald | 7.5% | 3.1%(+4.31)#38 | 3.1%(+4.36)#2,489 |
| 39. | Trimble | 7.3% | 3.1%(+4.17)#39 | 3.1%(+4.22)#2,573 |
| 40. | Kingsport | 7.2% | 3.1%(+4.09)#40 | 3.1%(+4.14)#2,626 |
| 41. | St Joseph | 7.1% | 3.1%(+3.99)#41 | 3.1%(+4.04)#2,685 |
| 42. | New Union | 7.1% | 3.1%(+3.97)#42 | 3.1%(+4.02)#2,712 |
| 43. | Graysville | 7.0% | 3.1%(+3.87)#43 | 3.1%(+3.92)#2,772 |
| 44. | Livingston | 6.9% | 3.1%(+3.71)#44 | 3.1%(+3.76)#2,876 |
| 45. | Green Hill | 6.8% | 3.1%(+3.66)#45 | 3.1%(+3.71)#2,905 |
| 46. | Newbern | 6.7% | 3.1%(+3.56)#46 | 3.1%(+3.61)#2,960 |
| 47. | Ashland City | 6.5% | 3.1%(+3.32)#47 | 3.1%(+3.37)#3,101 |
| 48. | Orlinda | 6.3% | 3.1%(+3.19)#48 | 3.1%(+3.24)#3,199 |
| 49. | Elizabethton | 6.3% | 3.1%(+3.15)#49 | 3.1%(+3.20)#3,222 |
| 50. | Dover | 6.2% | 3.1%(+3.10)#50 | 3.1%(+3.15)#3,243 |
| 51. | Lake Tansi | 6.2% | 3.1%(+3.09)#51 | 3.1%(+3.14)#3,277 |
| 52. | Adams | 6.2% | 3.1%(+3.04)#52 | 3.1%(+3.09)#3,313 |
| 53. | Farragut | 6.2% | 3.1%(+3.03)#53 | 3.1%(+3.08)#3,324 |
| 54. | Winfield | 6.1% | 3.1%(+2.97)#54 | 3.1%(+3.02)#3,364 |
| 55. | Atoka | 6.1% | 3.1%(+2.95)#55 | 3.1%(+3.00)#3,383 |
| 56. | Pine Crest | 6.1% | 3.1%(+2.93)#56 | 3.1%(+2.98)#3,397 |
| 57. | Hollow Rock | 6.1% | 3.1%(+2.91)#57 | 3.1%(+2.96)#3,410 |
| 58. | Mount Carmel | 6.0% | 3.1%(+2.85)#58 | 3.1%(+2.90)#3,460 |
| 59. | Shelbyville | 6.0% | 3.1%(+2.84)#59 | 3.1%(+2.89)#3,461 |
| 60. | Watertown | 5.8% | 3.1%(+2.66)#60 | 3.1%(+2.71)#3,620 |
| 61. | Sharon | 5.8% | 3.1%(+2.65)#61 | 3.1%(+2.70)#3,634 |
| 62. | Medon | 5.6% | 3.1%(+2.41)#62 | 3.1%(+2.46)#3,845 |
| 63. | Athens | 5.5% | 3.1%(+2.39)#63 | 3.1%(+2.44)#3,861 |
| 64. | White House | 5.5% | 3.1%(+2.35)#64 | 3.1%(+2.40)#3,898 |
| 65. | Whiteville | 5.5% | 3.1%(+2.31)#65 | 3.1%(+2.36)#3,932 |
| 66. | Pegram | 5.4% | 3.1%(+2.24)#66 | 3.1%(+2.29)#4,011 |
| 67. | Lakesite | 5.4% | 3.1%(+2.22)#67 | 3.1%(+2.27)#4,026 |
| 68. | Alcoa | 5.3% | 3.1%(+2.14)#68 | 3.1%(+2.19)#4,117 |
| 69. | Dresden | 5.3% | 3.1%(+2.13)#69 | 3.1%(+2.18)#4,127 |
| 70. | Ridgetop | 5.3% | 3.1%(+2.13)#70 | 3.1%(+2.18)#4,128 |
| 71. | Bell Buckle | 5.3% | 3.1%(+2.11)#71 | 3.1%(+2.16)#4,147 |
| 72. | La Vergne | 5.3% | 3.1%(+2.10)#72 | 3.1%(+2.15)#4,178 |
| 73. | Paris | 5.2% | 3.1%(+2.01)#73 | 3.1%(+2.06)#4,264 |
| 74. | Huntsville | 5.1% | 3.1%(+1.93)#74 | 3.1%(+1.99)#4,353 |
| 75. | Martin | 5.0% | 3.1%(+1.87)#75 | 3.1%(+1.92)#4,430 |
| 76. | Arlington | 5.0% | 3.1%(+1.84)#76 | 3.1%(+1.89)#4,470 |
| 77. | Townsend | 5.0% | 3.1%(+1.81)#77 | 3.1%(+1.86)#4,494 |
| 78. | Baneberry | 4.9% | 3.1%(+1.72)#78 | 3.1%(+1.77)#4,623 |
| 79. | South Pittsburg | 4.8% | 3.1%(+1.69)#79 | 3.1%(+1.74)#4,657 |
| 80. | Walden | 4.8% | 3.1%(+1.67)#80 | 3.1%(+1.72)#4,681 |
| 81. | Doyle | 4.8% | 3.1%(+1.61)#81 | 3.1%(+1.66)#4,762 |
| 82. | Johnson City | 4.8% | 3.1%(+1.61)#82 | 3.1%(+1.66)#4,783 |
| 83. | Tellico Village | 4.7% | 3.1%(+1.58)#83 | 3.1%(+1.63)#4,807 |
| 84. | Dayton | 4.7% | 3.1%(+1.52)#84 | 3.1%(+1.57)#4,880 |
| 85. | Bethel Springs | 4.7% | 3.1%(+1.50)#85 | 3.1%(+1.55)#4,902 |
| 86. | Stanton | 4.7% | 3.1%(+1.50)#86 | 3.1%(+1.55)#4,905 |
| 87. | Ridgeside | 4.6% | 3.1%(+1.49)#87 | 3.1%(+1.54)#4,921 |
| 88. | Huntland | 4.6% | 3.1%(+1.48)#88 | 3.1%(+1.53)#4,933 |
| 89. | Charlotte | 4.6% | 3.1%(+1.45)#89 | 3.1%(+1.50)#4,988 |
| 90. | Brownsville | 4.6% | 3.1%(+1.41)#90 | 3.1%(+1.46)#5,044 |
| 91. | Cleveland | 4.5% | 3.1%(+1.32)#91 | 3.1%(+1.37)#5,197 |
| 92. | Tiptonville | 4.4% | 3.1%(+1.21)#92 | 3.1%(+1.26)#5,367 |
| 93. | Rarity Bay | 4.3% | 3.1%(+1.13)#93 | 3.1%(+1.18)#5,505 |
| 94. | Sweetwater | 4.3% | 3.1%(+1.11)#94 | 3.1%(+1.16)#5,523 |
| 95. | Burns | 4.2% | 3.1%(+1.09)#95 | 3.1%(+1.14)#5,565 |
| 96. | Fairfield Glade | 4.1% | 3.1%(+0.949)#96 | 3.1%(+1.000)#5,791 |
| 97. | Mount Juliet | 4.1% | 3.1%(+0.943)#97 | 3.1%(+0.993)#5,799 |
| 98. | Oak Hill | 4.1% | 3.1%(+0.921)#98 | 3.1%(+0.971)#5,837 |
| 99. | Lookout Mountain | 4.1% | 3.1%(+0.903)#99 | 3.1%(+0.953)#5,881 |
| 100. | Parsons | 4.0% | 3.1%(+0.824)#100 | 3.1%(+0.874)#6,030 |
Common Questions
What are the Top 10 Cities with the Highest Percentage of Population with a Degree in Physical and Health Sciences in Tennessee?
Top 10 Cities with the Highest Percentage of Population with a Degree in Physical and Health Sciences in Tennessee are:
#1
33.3%
#2
31.2%
#3
30.4%
#4
26.7%
#5
21.9%
#6
21.3%
#7
16.7%
#8
15.7%
#9
14.9%
#10
14.4%
What city has the Highest Percentage of Population with a Degree in Physical and Health Sciences in Tennessee?
Centertown has the Highest Percentage of Population with a Degree in Physical and Health Sciences in Tennessee with 33.3%.
What is the Percentage of Population with a Degree in Physical and Health Sciences in the State of Tennessee?
Percentage of Population with a Degree in Physical and Health Sciences in Tennessee is 3.1%.
What is the Percentage of Population with a Degree in Physical and Health Sciences in the United States?
Percentage of Population with a Degree in Physical and Health Sciences in the United States is 3.1%.