Zip Codes with the Highest Percentage of Population with a Degree in Physical and Health Sciences in Rancho Cucamonga, CA
RELATED REPORTS & OPTIONS
Physical and Health Sciences
Rancho Cucamonga
Compare Zip Codes
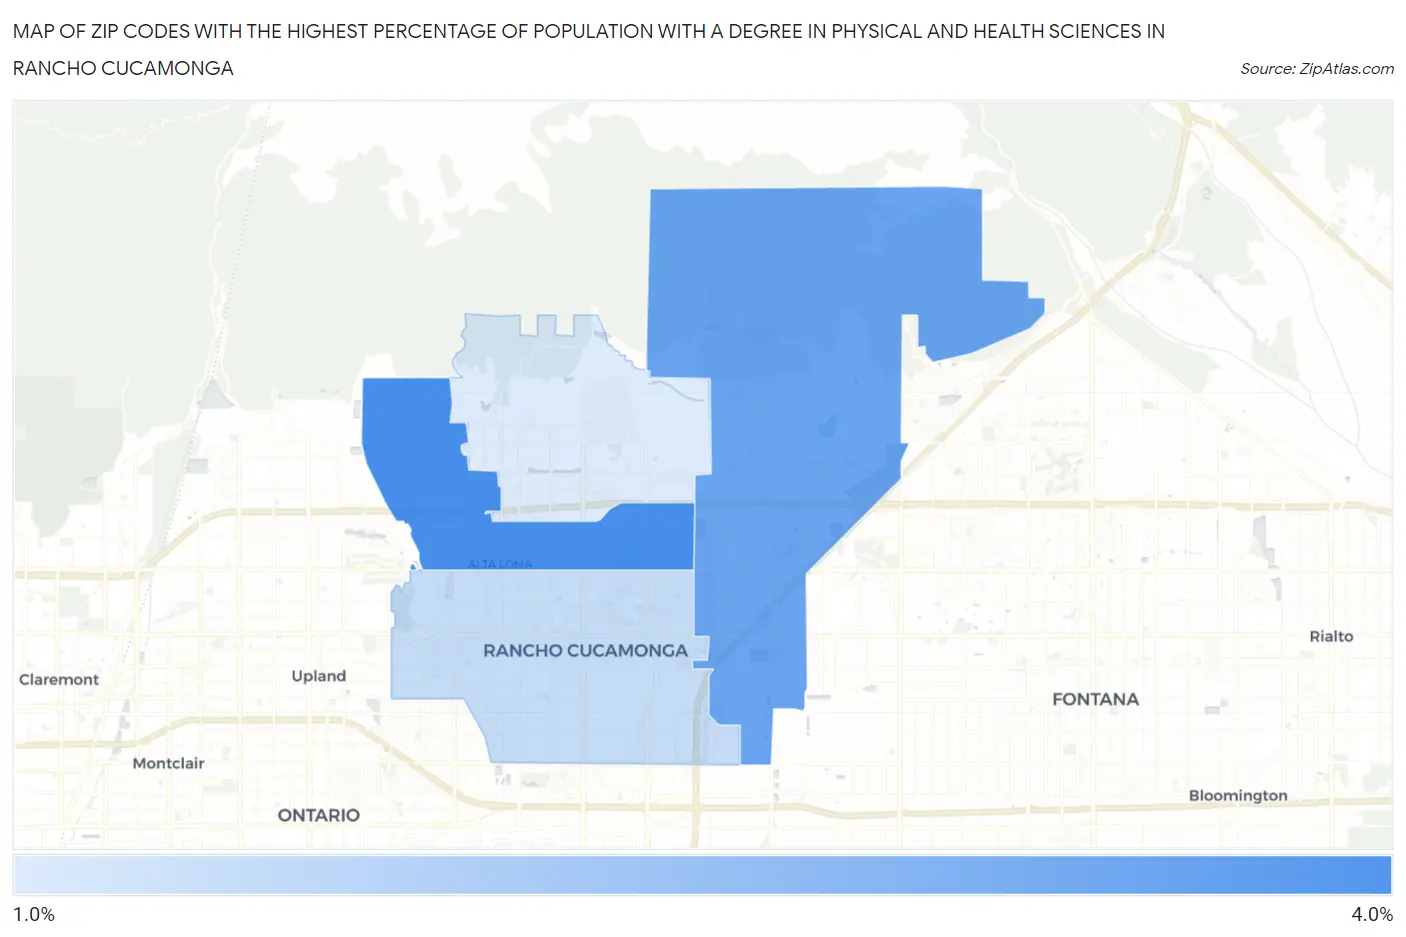
Map of Zip Codes with the Highest Percentage of Population with a Degree in Physical and Health Sciences in Rancho Cucamonga
1.8%
3.1%
Zip Codes with the Highest Percentage of Population with a Degree in Physical and Health Sciences in Rancho Cucamonga, CA
| Zip Code | % Graduates | vs State | vs National | |
| 1. | 91701 | 3.1% | 3.1%(-0.032)#597 | 3.1%(-0.016)#10,048 |
| 2. | 91739 | 2.8% | 3.1%(-0.331)#710 | 3.1%(-0.315)#11,412 |
| 3. | 91730 | 2.0% | 3.1%(-1.11)#1,007 | 3.1%(-1.10)#15,088 |
| 4. | 91737 | 1.8% | 3.1%(-1.31)#1,076 | 3.1%(-1.29)#15,952 |
1
Common Questions
What are the Top 3 Zip Codes with the Highest Percentage of Population with a Degree in Physical and Health Sciences in Rancho Cucamonga, CA?
Top 3 Zip Codes with the Highest Percentage of Population with a Degree in Physical and Health Sciences in Rancho Cucamonga, CA are:
What zip code has the Highest Percentage of Population with a Degree in Physical and Health Sciences in Rancho Cucamonga, CA?
91701 has the Highest Percentage of Population with a Degree in Physical and Health Sciences in Rancho Cucamonga, CA with 3.1%.
What is the Percentage of Population with a Degree in Physical and Health Sciences in Rancho Cucamonga, CA?
Percentage of Population with a Degree in Physical and Health Sciences in Rancho Cucamonga is 2.4%.
What is the Percentage of Population with a Degree in Physical and Health Sciences in California?
Percentage of Population with a Degree in Physical and Health Sciences in California is 3.1%.
What is the Percentage of Population with a Degree in Physical and Health Sciences in the United States?
Percentage of Population with a Degree in Physical and Health Sciences in the United States is 3.1%.