Cities with the Highest Percentage of Population with a Degree in Physical and Health Sciences in Illinois
RELATED REPORTS & OPTIONS
Physical and Health Sciences
Illinois
Compare Cities
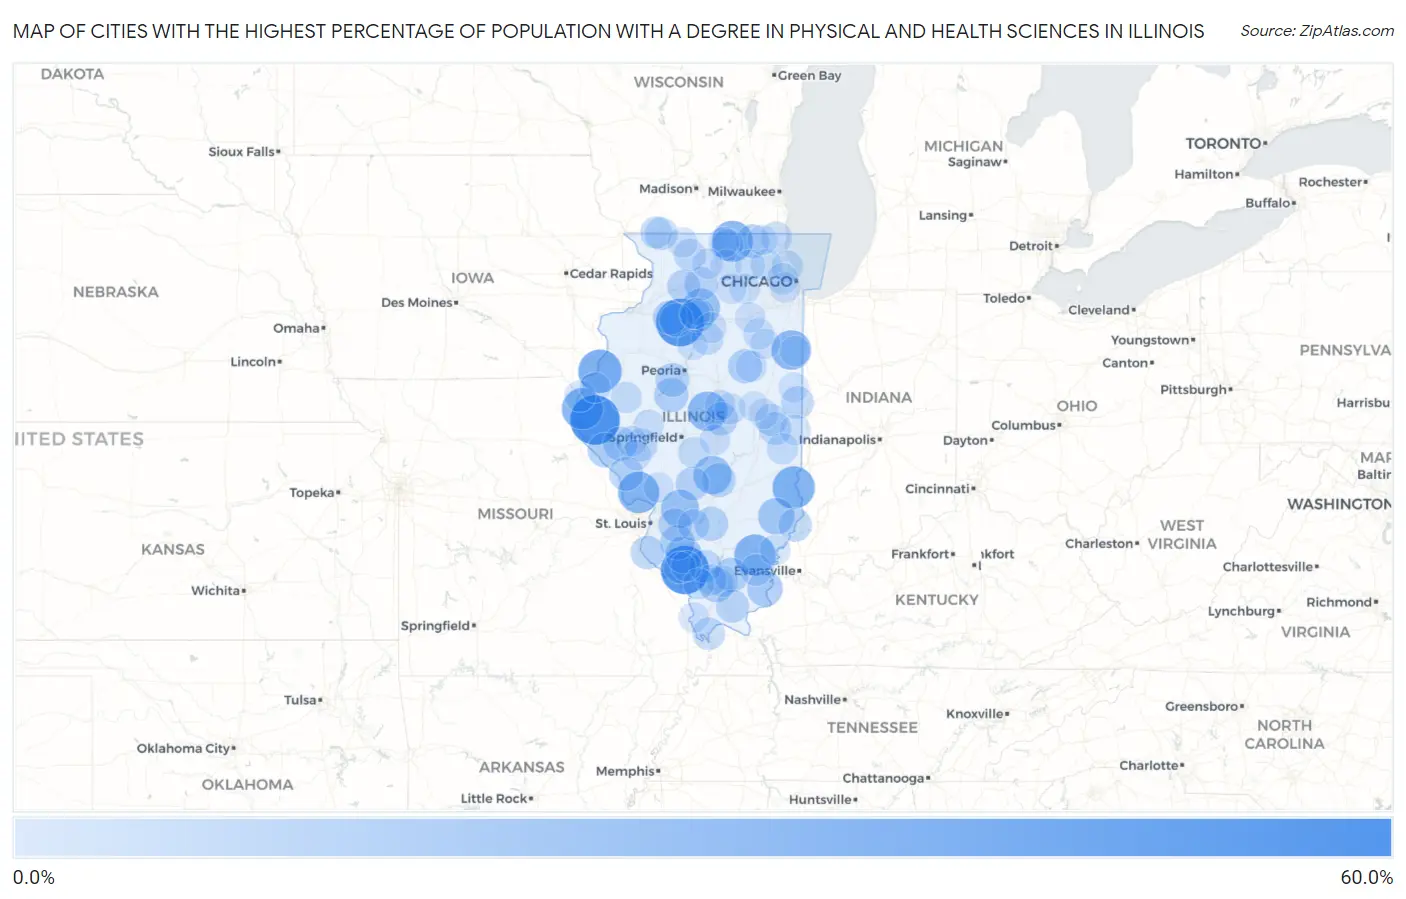
Map of Cities with the Highest Percentage of Population with a Degree in Physical and Health Sciences in Illinois
0.0%
60.0%
Cities with the Highest Percentage of Population with a Degree in Physical and Health Sciences in Illinois
| City | % Graduates | vs State | vs National | |
| 1. | Coatsburg | 52.9% | 2.9%(+50.1)#1 | 3.1%(+49.8)#73 |
| 2. | Willisville | 50.0% | 2.9%(+47.1)#2 | 3.1%(+46.9)#83 |
| 3. | Buda | 48.7% | 2.9%(+45.9)#3 | 3.1%(+45.6)#105 |
| 4. | Lomax | 38.2% | 2.9%(+35.4)#4 | 3.1%(+35.1)#163 |
| 5. | Hutsonville | 35.7% | 2.9%(+32.8)#5 | 3.1%(+32.6)#185 |
| 6. | Lima | 33.3% | 2.9%(+30.5)#6 | 3.1%(+30.2)#208 |
| 7. | Otterville | 33.3% | 2.9%(+30.5)#7 | 3.1%(+30.2)#209 |
| 8. | Springerton | 33.3% | 2.9%(+30.5)#8 | 3.1%(+30.2)#212 |
| 9. | Capron | 32.5% | 2.9%(+29.6)#9 | 3.1%(+29.4)#226 |
| 10. | Rest Haven | 29.4% | 2.9%(+26.5)#10 | 3.1%(+26.3)#270 |
| 11. | Beason | 29.4% | 2.9%(+26.5)#11 | 3.1%(+26.3)#271 |
| 12. | Papineau | 29.4% | 2.9%(+26.5)#12 | 3.1%(+26.3)#272 |
| 13. | Oconee | 25.9% | 2.9%(+23.1)#13 | 3.1%(+22.8)#343 |
| 14. | Grantfork | 25.7% | 2.9%(+22.8)#14 | 3.1%(+22.6)#351 |
| 15. | La Moille | 25.0% | 2.9%(+22.1)#15 | 3.1%(+21.9)#361 |
| 16. | Bonnie Brae | 23.7% | 2.9%(+20.8)#16 | 3.1%(+20.6)#420 |
| 17. | Claremont | 22.2% | 2.9%(+19.4)#17 | 3.1%(+19.1)#463 |
| 18. | Coulterville | 21.9% | 2.9%(+19.1)#18 | 3.1%(+18.8)#472 |
| 19. | Shawneetown | 20.0% | 2.9%(+17.1)#19 | 3.1%(+16.9)#533 |
| 20. | El Dara | 18.2% | 2.9%(+15.3)#20 | 3.1%(+15.1)#635 |
| 21. | St Libory | 17.9% | 2.9%(+15.0)#21 | 3.1%(+14.8)#646 |
| 22. | Energy | 17.6% | 2.9%(+14.7)#22 | 3.1%(+14.5)#664 |
| 23. | Thompsonville | 17.5% | 2.9%(+14.7)#23 | 3.1%(+14.4)#666 |
| 24. | Malden | 17.4% | 2.9%(+14.5)#24 | 3.1%(+14.3)#679 |
| 25. | Forest City | 17.4% | 2.9%(+14.5)#25 | 3.1%(+14.3)#681 |
| 26. | Griggsville | 16.7% | 2.9%(+13.8)#26 | 3.1%(+13.6)#715 |
| 27. | Kampsville | 16.7% | 2.9%(+13.8)#27 | 3.1%(+13.6)#727 |
| 28. | Mineral | 16.7% | 2.9%(+13.8)#28 | 3.1%(+13.6)#731 |
| 29. | Fairbury | 16.6% | 2.9%(+13.7)#29 | 3.1%(+13.5)#747 |
| 30. | Sandoval | 16.4% | 2.9%(+13.5)#30 | 3.1%(+13.3)#757 |
| 31. | Herrick | 16.3% | 2.9%(+13.4)#31 | 3.1%(+13.2)#766 |
| 32. | Glasford | 16.0% | 2.9%(+13.1)#32 | 3.1%(+12.9)#787 |
| 33. | Schram City | 15.4% | 2.9%(+12.5)#33 | 3.1%(+12.3)#824 |
| 34. | Maeystown | 15.4% | 2.9%(+12.5)#34 | 3.1%(+12.3)#834 |
| 35. | Greenwood | 15.3% | 2.9%(+12.5)#35 | 3.1%(+12.2)#840 |
| 36. | Sheffield | 15.3% | 2.9%(+12.4)#36 | 3.1%(+12.2)#843 |
| 37. | St Francisville | 15.3% | 2.9%(+12.4)#37 | 3.1%(+12.2)#844 |
| 38. | Maroa | 15.1% | 2.9%(+12.2)#38 | 3.1%(+12.0)#859 |
| 39. | Summerfield | 14.8% | 2.9%(+11.9)#39 | 3.1%(+11.7)#892 |
| 40. | Franklin Grove | 14.6% | 2.9%(+11.7)#40 | 3.1%(+11.5)#918 |
| 41. | Alvan | 14.3% | 2.9%(+11.4)#41 | 3.1%(+11.2)#963 |
| 42. | Nelson | 14.3% | 2.9%(+11.4)#42 | 3.1%(+11.2)#968 |
| 43. | Simpson | 14.3% | 2.9%(+11.4)#43 | 3.1%(+11.2)#975 |
| 44. | Bismarck | 13.6% | 2.9%(+10.7)#44 | 3.1%(+10.5)#1,032 |
| 45. | St Johns | 13.3% | 2.9%(+10.5)#45 | 3.1%(+10.2)#1,058 |
| 46. | Lynnville | 13.3% | 2.9%(+10.5)#46 | 3.1%(+10.2)#1,060 |
| 47. | Warren | 13.2% | 2.9%(+10.3)#47 | 3.1%(+10.1)#1,076 |
| 48. | Mound City | 13.2% | 2.9%(+10.3)#48 | 3.1%(+10.1)#1,079 |
| 49. | Broadlands | 12.9% | 2.9%(+10.0)#49 | 3.1%(+9.80)#1,115 |
| 50. | German Valley | 12.4% | 2.9%(+9.49)#50 | 3.1%(+9.26)#1,177 |
| 51. | Sidney | 12.3% | 2.9%(+9.41)#51 | 3.1%(+9.18)#1,186 |
| 52. | Apple River | 12.1% | 2.9%(+9.26)#52 | 3.1%(+9.02)#1,203 |
| 53. | Poplar Grove | 12.0% | 2.9%(+9.17)#53 | 3.1%(+8.93)#1,214 |
| 54. | Magnolia | 11.8% | 2.9%(+8.90)#54 | 3.1%(+8.66)#1,257 |
| 55. | Beckemeyer | 11.5% | 2.9%(+8.59)#55 | 3.1%(+8.36)#1,301 |
| 56. | Norris City | 11.4% | 2.9%(+8.56)#56 | 3.1%(+8.33)#1,303 |
| 57. | Old Mill Creek | 11.4% | 2.9%(+8.56)#57 | 3.1%(+8.33)#1,309 |
| 58. | Steeleville | 11.0% | 2.9%(+8.18)#58 | 3.1%(+7.94)#1,372 |
| 59. | Johnston City | 10.7% | 2.9%(+7.84)#59 | 3.1%(+7.60)#1,426 |
| 60. | Kincaid | 10.7% | 2.9%(+7.80)#60 | 3.1%(+7.57)#1,432 |
| 61. | Golf | 10.6% | 2.9%(+7.71)#61 | 3.1%(+7.48)#1,450 |
| 62. | Redmon | 10.5% | 2.9%(+7.66)#62 | 3.1%(+7.43)#1,473 |
| 63. | South Barrington | 10.5% | 2.9%(+7.62)#63 | 3.1%(+7.39)#1,482 |
| 64. | Industry | 10.4% | 2.9%(+7.58)#64 | 3.1%(+7.35)#1,488 |
| 65. | Stone Park | 10.3% | 2.9%(+7.44)#65 | 3.1%(+7.21)#1,523 |
| 66. | Warsaw | 10.3% | 2.9%(+7.42)#66 | 3.1%(+7.19)#1,536 |
| 67. | Forrest | 10.3% | 2.9%(+7.39)#67 | 3.1%(+7.16)#1,542 |
| 68. | Bush | 10.0% | 2.9%(+7.13)#68 | 3.1%(+6.90)#1,606 |
| 69. | De Witt | 10.0% | 2.9%(+7.13)#69 | 3.1%(+6.90)#1,614 |
| 70. | Harrison | 9.9% | 2.9%(+7.06)#70 | 3.1%(+6.82)#1,633 |
| 71. | South Wilmington | 9.9% | 2.9%(+6.99)#71 | 3.1%(+6.76)#1,642 |
| 72. | Kirkland | 9.4% | 2.9%(+6.49)#72 | 3.1%(+6.26)#1,766 |
| 73. | Cedar Point | 9.1% | 2.9%(+6.22)#73 | 3.1%(+5.99)#1,858 |
| 74. | Ferris | 9.1% | 2.9%(+6.22)#74 | 3.1%(+5.99)#1,859 |
| 75. | Dover | 9.1% | 2.9%(+6.22)#75 | 3.1%(+5.99)#1,862 |
| 76. | Grayville | 9.0% | 2.9%(+6.17)#76 | 3.1%(+5.93)#1,876 |
| 77. | Boody | 9.0% | 2.9%(+6.14)#77 | 3.1%(+5.91)#1,888 |
| 78. | Virginia | 9.0% | 2.9%(+6.11)#78 | 3.1%(+5.87)#1,898 |
| 79. | Bluffs | 9.0% | 2.9%(+6.09)#79 | 3.1%(+5.86)#1,904 |
| 80. | Caledonia | 8.9% | 2.9%(+6.06)#80 | 3.1%(+5.83)#1,910 |
| 81. | Pingree Grove | 8.9% | 2.9%(+6.03)#81 | 3.1%(+5.80)#1,923 |
| 82. | Stillman Valley | 8.9% | 2.9%(+6.01)#82 | 3.1%(+5.78)#1,931 |
| 83. | Ridge Farm | 8.8% | 2.9%(+5.96)#83 | 3.1%(+5.72)#1,943 |
| 84. | Big Rock | 8.7% | 2.9%(+5.83)#84 | 3.1%(+5.60)#1,976 |
| 85. | Mcclure | 8.7% | 2.9%(+5.83)#85 | 3.1%(+5.60)#1,986 |
| 86. | Alsey | 8.7% | 2.9%(+5.83)#86 | 3.1%(+5.60)#1,990 |
| 87. | Summit | 8.6% | 2.9%(+5.71)#87 | 3.1%(+5.47)#2,033 |
| 88. | Wapella | 8.5% | 2.9%(+5.64)#88 | 3.1%(+5.41)#2,049 |
| 89. | Sparland | 8.3% | 2.9%(+5.47)#89 | 3.1%(+5.23)#2,111 |
| 90. | Beaverville | 8.3% | 2.9%(+5.47)#90 | 3.1%(+5.23)#2,114 |
| 91. | Cutler | 8.3% | 2.9%(+5.47)#91 | 3.1%(+5.23)#2,115 |
| 92. | Buckingham | 8.3% | 2.9%(+5.47)#92 | 3.1%(+5.23)#2,117 |
| 93. | Waterman | 8.3% | 2.9%(+5.43)#93 | 3.1%(+5.20)#2,131 |
| 94. | Cedarville | 8.2% | 2.9%(+5.38)#94 | 3.1%(+5.15)#2,139 |
| 95. | Morris | 8.2% | 2.9%(+5.33)#95 | 3.1%(+5.09)#2,153 |
| 96. | Shipman | 8.1% | 2.9%(+5.27)#96 | 3.1%(+5.04)#2,173 |
| 97. | Hoopeston | 8.1% | 2.9%(+5.24)#97 | 3.1%(+5.01)#2,184 |
| 98. | Urbana | 8.1% | 2.9%(+5.19)#98 | 3.1%(+4.96)#2,208 |
| 99. | Lake Of The Woods | 7.9% | 2.9%(+5.05)#99 | 3.1%(+4.82)#2,268 |
| 100. | Pistakee Highlands | 7.8% | 2.9%(+4.91)#100 | 3.1%(+4.67)#2,336 |
Common Questions
What are the Top 10 Cities with the Highest Percentage of Population with a Degree in Physical and Health Sciences in Illinois?
Top 10 Cities with the Highest Percentage of Population with a Degree in Physical and Health Sciences in Illinois are:
#1
52.9%
#2
50.0%
#3
48.7%
#4
38.2%
#5
35.7%
#6
33.3%
#7
33.3%
#8
33.3%
#9
32.5%
#10
29.4%
What city has the Highest Percentage of Population with a Degree in Physical and Health Sciences in Illinois?
Coatsburg has the Highest Percentage of Population with a Degree in Physical and Health Sciences in Illinois with 52.9%.
What is the Percentage of Population with a Degree in Physical and Health Sciences in the State of Illinois?
Percentage of Population with a Degree in Physical and Health Sciences in Illinois is 2.9%.
What is the Percentage of Population with a Degree in Physical and Health Sciences in the United States?
Percentage of Population with a Degree in Physical and Health Sciences in the United States is 3.1%.