Orange Cove, CA Map & Demographics
Orange Cove Map
Orange Cove Overview
$12,306
PER CAPITA INCOME
$33,691
AVG FAMILY INCOME
$33,671
AVG HOUSEHOLD INCOME
30.7%
WAGE / INCOME GAP [ % ]
69.3¢/ $1
WAGE / INCOME GAP [ $ ]
$10,644
FAMILY INCOME DEFICIT
0.43
INEQUALITY / GINI INDEX
9,635
TOTAL POPULATION
4,979
MALE POPULATION
4,656
FEMALE POPULATION
106.94
MALES / 100 FEMALES
93.51
FEMALES / 100 MALES
24.4
MEDIAN AGE
4.2
AVG FAMILY SIZE
3.9
AVG HOUSEHOLD SIZE
3,803
LABOR FORCE [ PEOPLE ]
59.5%
PERCENT IN LABOR FORCE
13.7%
UNEMPLOYMENT RATE
Orange Cove Zip Codes
Orange Cove Area Codes
Income in Orange Cove
Income Overview in Orange Cove
Per Capita Income in Orange Cove is $12,306, while median incomes of families and households are $33,691 and $33,671 respectively.
| Characteristic | Number | Measure |
| Per Capita Income | 9,635 | $12,306 |
| Median Family Income | 2,163 | $33,691 |
| Mean Family Income | 2,163 | $46,220 |
| Median Household Income | 2,460 | $33,671 |
| Mean Household Income | 2,460 | $45,243 |
| Income Deficit | 2,163 | $10,644 |
| Wage / Income Gap (%) | 9,635 | 30.74% |
| Wage / Income Gap ($) | 9,635 | 69.26¢ per $1 |
| Gini / Inequality Index | 9,635 | 0.43 |
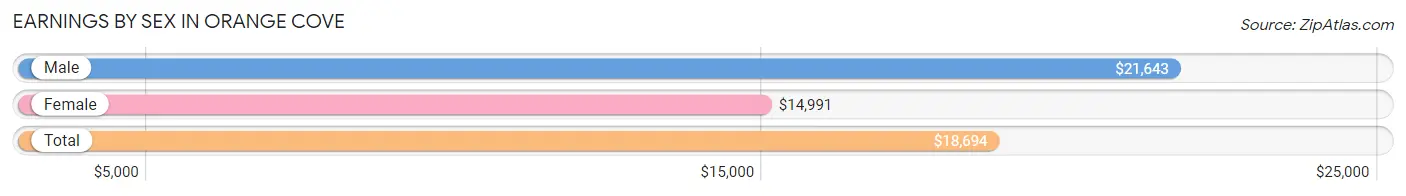
Earnings by Sex in Orange Cove
Average Earnings in Orange Cove are $18,694, $21,643 for men and $14,991 for women, a difference of 30.7%.
| Sex | Number | Average Earnings |
| Male | 2,136 (53.4%) | $21,643 |
| Female | 1,860 (46.6%) | $14,991 |
| Total | 3,996 (100.0%) | $18,694 |
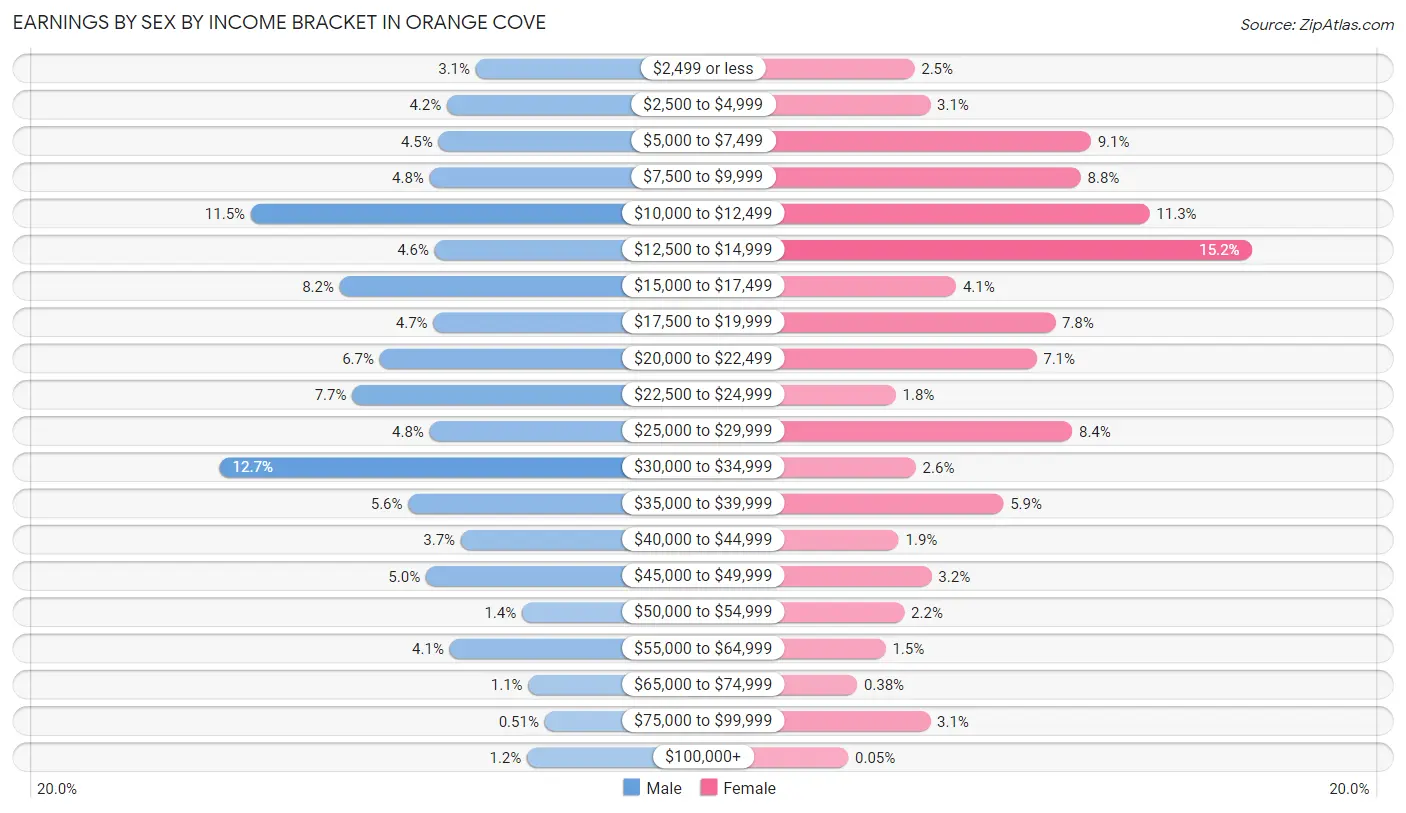
Earnings by Sex by Income Bracket in Orange Cove
The most common earnings brackets in Orange Cove are $30,000 to $34,999 for men (271 | 12.7%) and $12,500 to $14,999 for women (282 | 15.2%).
| Income | Male | Female |
| $2,499 or less | 66 (3.1%) | 47 (2.5%) |
| $2,500 to $4,999 | 89 (4.2%) | 58 (3.1%) |
| $5,000 to $7,499 | 96 (4.5%) | 170 (9.1%) |
| $7,500 to $9,999 | 103 (4.8%) | 163 (8.8%) |
| $10,000 to $12,499 | 246 (11.5%) | 211 (11.3%) |
| $12,500 to $14,999 | 99 (4.6%) | 282 (15.2%) |
| $15,000 to $17,499 | 175 (8.2%) | 76 (4.1%) |
| $17,500 to $19,999 | 100 (4.7%) | 145 (7.8%) |
| $20,000 to $22,499 | 143 (6.7%) | 132 (7.1%) |
| $22,500 to $24,999 | 165 (7.7%) | 34 (1.8%) |
| $25,000 to $29,999 | 103 (4.8%) | 157 (8.4%) |
| $30,000 to $34,999 | 271 (12.7%) | 48 (2.6%) |
| $35,000 to $39,999 | 120 (5.6%) | 109 (5.9%) |
| $40,000 to $44,999 | 78 (3.6%) | 36 (1.9%) |
| $45,000 to $49,999 | 106 (5.0%) | 59 (3.2%) |
| $50,000 to $54,999 | 29 (1.4%) | 40 (2.1%) |
| $55,000 to $64,999 | 87 (4.1%) | 27 (1.5%) |
| $65,000 to $74,999 | 24 (1.1%) | 7 (0.4%) |
| $75,000 to $99,999 | 11 (0.5%) | 58 (3.1%) |
| $100,000+ | 25 (1.2%) | 1 (0.1%) |
| Total | 2,136 (100.0%) | 1,860 (100.0%) |
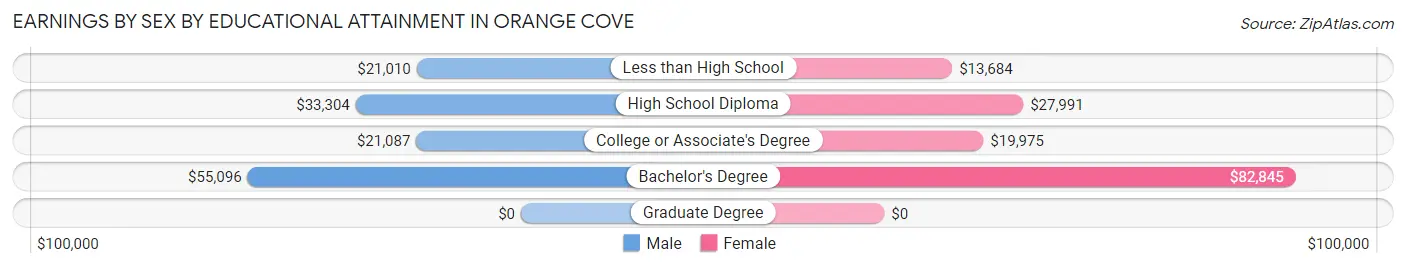
Earnings by Sex by Educational Attainment in Orange Cove
Average earnings in Orange Cove are $23,248 for men and $17,782 for women, a difference of 23.5%. Men with an educational attainment of bachelor's degree enjoy the highest average annual earnings of $55,096, while those with less than high school education earn the least with $21,010. Women with an educational attainment of bachelor's degree earn the most with the average annual earnings of $82,845, while those with less than high school education have the smallest earnings of $13,684.
| Educational Attainment | Male Income | Female Income |
| Less than High School | $21,010 | $13,684 |
| High School Diploma | $33,304 | $27,991 |
| College or Associate's Degree | $21,087 | $19,975 |
| Bachelor's Degree | $55,096 | $82,845 |
| Graduate Degree | - | - |
| Total | $23,248 | $17,782 |
Family Income in Orange Cove
Family Income Brackets in Orange Cove
According to the Orange Cove family income data, there are 456 families falling into the $25,000 to $34,999 income range, which is the most common income bracket and makes up 21.1% of all families. Conversely, the $200,000+ income bracket is the least frequent group with only 13 families (0.6%) belonging to this category.
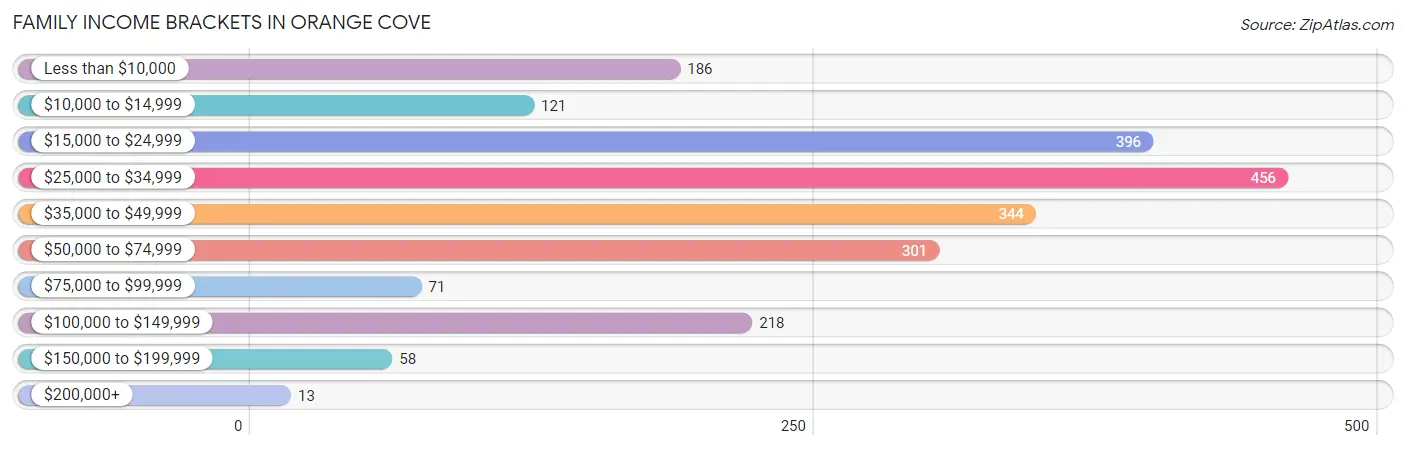
| Income Bracket | # Families | % Families |
| Less than $10,000 | 186 | 8.6% |
| $10,000 to $14,999 | 121 | 5.6% |
| $15,000 to $24,999 | 396 | 18.3% |
| $25,000 to $34,999 | 456 | 21.1% |
| $35,000 to $49,999 | 344 | 15.9% |
| $50,000 to $74,999 | 301 | 13.9% |
| $75,000 to $99,999 | 71 | 3.3% |
| $100,000 to $149,999 | 218 | 10.1% |
| $150,000 to $199,999 | 58 | 2.7% |
| $200,000+ | 13 | 0.6% |
Family Income by Famaliy Size in Orange Cove
7+ person families (118 | 5.5%) account for the highest median family income in Orange Cove with $100,948 per family, while 2-person families (425 | 19.7%) have the highest median income of $17,004 per family member.
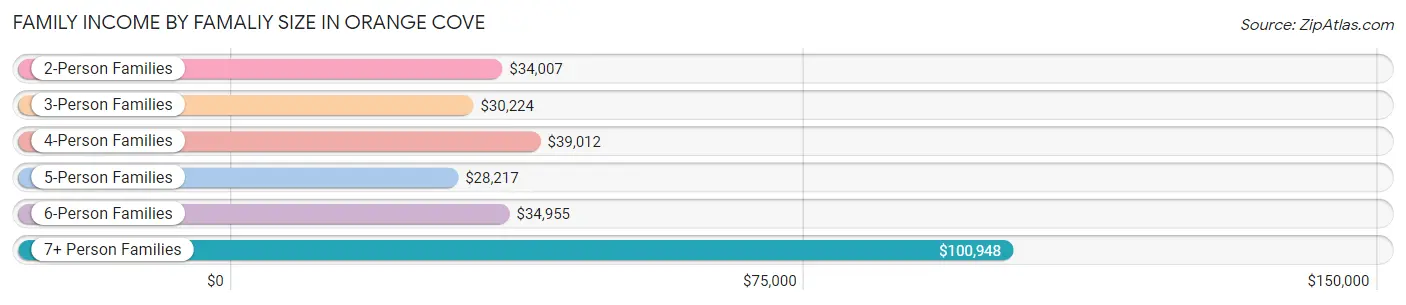
| Income Bracket | # Families | Median Income |
| 2-Person Families | 425 (19.7%) | $34,007 |
| 3-Person Families | 675 (31.2%) | $30,224 |
| 4-Person Families | 386 (17.8%) | $39,012 |
| 5-Person Families | 353 (16.3%) | $28,217 |
| 6-Person Families | 206 (9.5%) | $34,955 |
| 7+ Person Families | 118 (5.5%) | $100,948 |
| Total | 2,163 (100.0%) | $33,691 |
Family Income by Number of Earners in Orange Cove
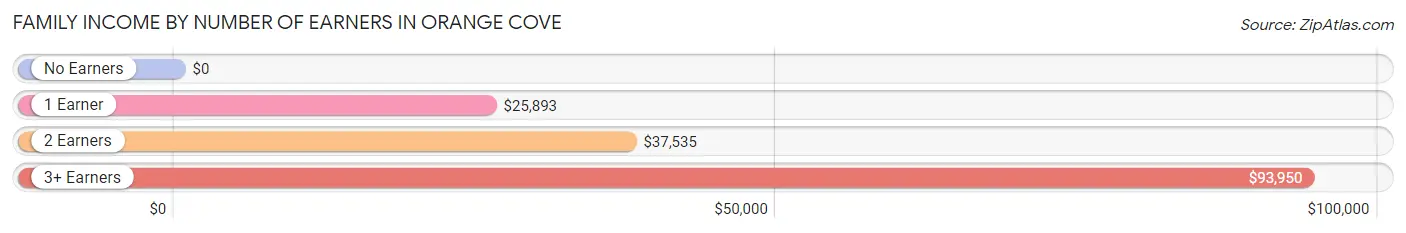
| Number of Earners | # Families | Median Income |
| No Earners | 215 (9.9%) | $0 |
| 1 Earner | 937 (43.3%) | $25,893 |
| 2 Earners | 606 (28.0%) | $37,535 |
| 3+ Earners | 405 (18.7%) | $93,950 |
| Total | 2,163 (100.0%) | $33,691 |
Household Income in Orange Cove
Household Income Brackets in Orange Cove
With 455 households falling in the category, the $25,000 to $34,999 income range is the most frequent in Orange Cove, accounting for 18.5% of all households. In contrast, only 12 households (0.5%) fall into the $200,000+ income bracket, making it the least populous group.
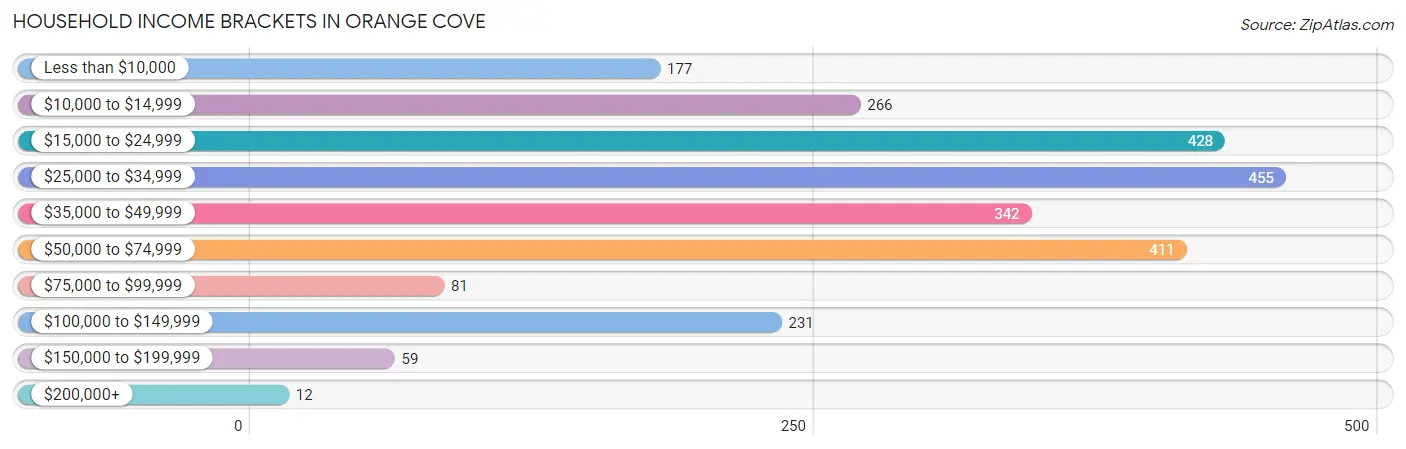
| Income Bracket | # Households | % Households |
| Less than $10,000 | 177 | 7.2% |
| $10,000 to $14,999 | 266 | 10.8% |
| $15,000 to $24,999 | 428 | 17.4% |
| $25,000 to $34,999 | 455 | 18.5% |
| $35,000 to $49,999 | 342 | 13.9% |
| $50,000 to $74,999 | 411 | 16.7% |
| $75,000 to $99,999 | 81 | 3.3% |
| $100,000 to $149,999 | 231 | 9.4% |
| $150,000 to $199,999 | 59 | 2.4% |
| $200,000+ | 12 | 0.5% |
Household Income by Householder Age in Orange Cove
The median household income in Orange Cove is $33,671, with the highest median household income of $38,869 found in the 45 to 64 years age bracket for the primary householder. A total of 921 households (37.4%) fall into this category. Meanwhile, the 15 to 24 years age bracket for the primary householder has the lowest median household income of $0, with 57 households (2.3%) in this group.
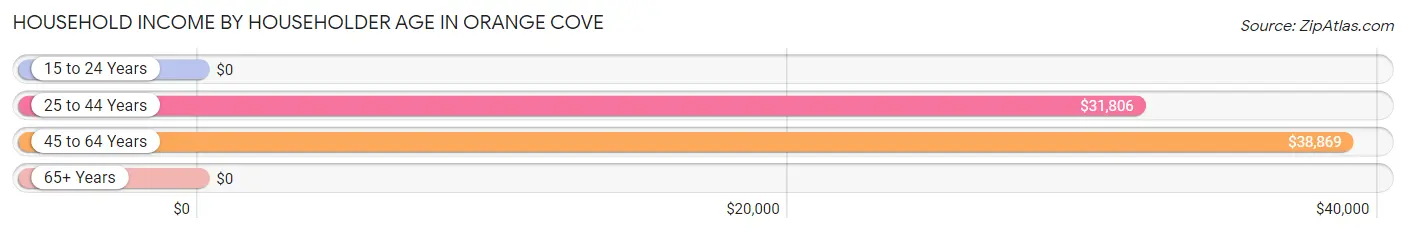
| Income Bracket | # Households | Median Income |
| 15 to 24 Years | 57 (2.3%) | $0 |
| 25 to 44 Years | 1,081 (43.9%) | $31,806 |
| 45 to 64 Years | 921 (37.4%) | $38,869 |
| 65+ Years | 401 (16.3%) | $0 |
| Total | 2,460 (100.0%) | $33,671 |
Poverty in Orange Cove
Income Below Poverty by Sex and Age in Orange Cove
With 42.5% poverty level for males and 50.8% for females among the residents of Orange Cove, 5 year old males and 5 year old females are the most vulnerable to poverty, with 128 males (100.0%) and 27 females (100.0%) in their respective age groups living below the poverty level.
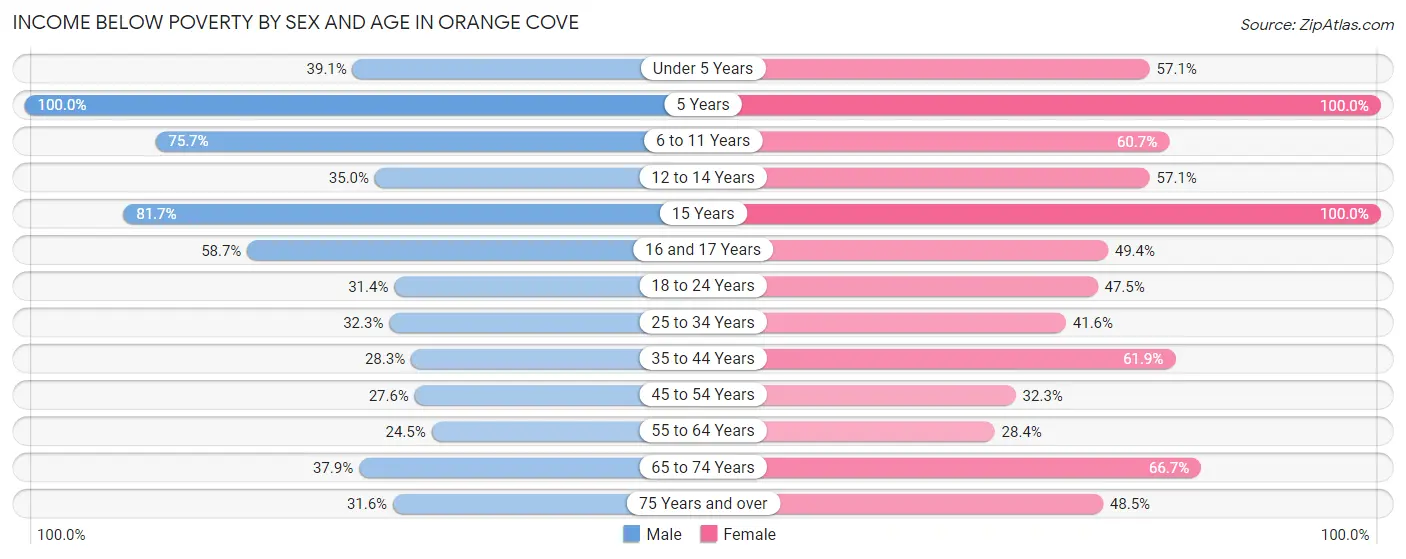
| Age Bracket | Male | Female |
| Under 5 Years | 151 (39.1%) | 224 (57.1%) |
| 5 Years | 128 (100.0%) | 27 (100.0%) |
| 6 to 11 Years | 527 (75.7%) | 345 (60.7%) |
| 12 to 14 Years | 134 (35.0%) | 196 (57.1%) |
| 15 Years | 156 (81.7%) | 95 (100.0%) |
| 16 and 17 Years | 142 (58.7%) | 78 (49.4%) |
| 18 to 24 Years | 248 (31.4%) | 225 (47.5%) |
| 25 to 34 Years | 160 (32.3%) | 257 (41.6%) |
| 35 to 44 Years | 151 (28.3%) | 427 (61.9%) |
| 45 to 54 Years | 149 (27.6%) | 152 (32.3%) |
| 55 to 64 Years | 93 (24.5%) | 118 (28.4%) |
| 65 to 74 Years | 44 (37.9%) | 94 (66.7%) |
| 75 Years and over | 31 (31.6%) | 111 (48.5%) |
| Total | 2,114 (42.5%) | 2,349 (50.8%) |
Income Above Poverty by Sex and Age in Orange Cove
According to the poverty statistics in Orange Cove, males aged 55 to 64 years and females aged 55 to 64 years are the age groups that are most secure financially, with 75.5% of males and 71.6% of females in these age groups living above the poverty line.
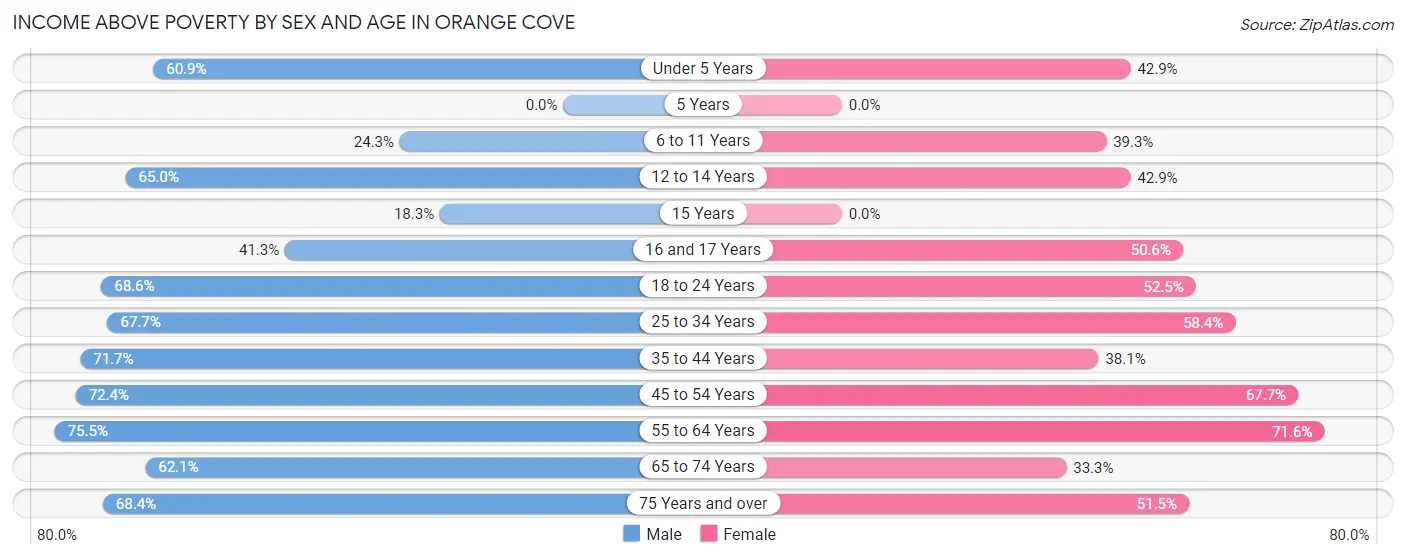
| Age Bracket | Male | Female |
| Under 5 Years | 235 (60.9%) | 168 (42.9%) |
| 5 Years | 0 (0.0%) | 0 (0.0%) |
| 6 to 11 Years | 169 (24.3%) | 223 (39.3%) |
| 12 to 14 Years | 249 (65.0%) | 147 (42.9%) |
| 15 Years | 35 (18.3%) | 0 (0.0%) |
| 16 and 17 Years | 100 (41.3%) | 80 (50.6%) |
| 18 to 24 Years | 542 (68.6%) | 249 (52.5%) |
| 25 to 34 Years | 335 (67.7%) | 361 (58.4%) |
| 35 to 44 Years | 383 (71.7%) | 263 (38.1%) |
| 45 to 54 Years | 391 (72.4%) | 319 (67.7%) |
| 55 to 64 Years | 287 (75.5%) | 298 (71.6%) |
| 65 to 74 Years | 72 (62.1%) | 47 (33.3%) |
| 75 Years and over | 67 (68.4%) | 118 (51.5%) |
| Total | 2,865 (57.5%) | 2,273 (49.2%) |
Income Below Poverty Among Married-Couple Families in Orange Cove
The poverty statistics for married-couple families in Orange Cove show that 36.3% or 445 of the total 1,226 families live below the poverty line. Families with 3 or 4 children have the highest poverty rate of 79.0%, comprising of 158 families. On the other hand, families with no children have the lowest poverty rate of 10.4%, which includes 56 families.
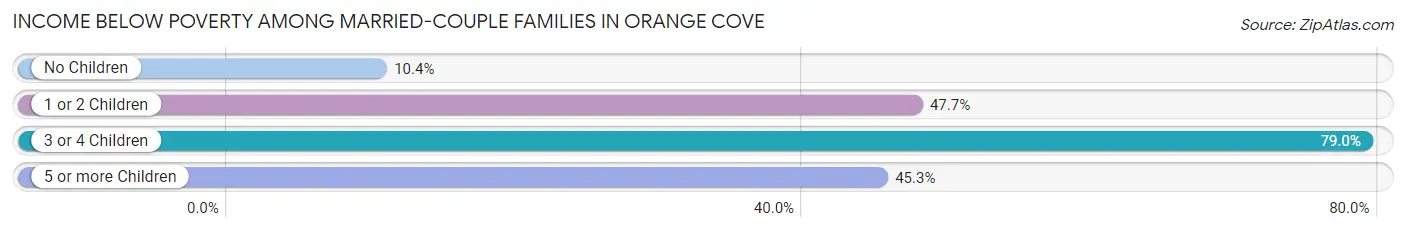
| Children | Above Poverty | Below Poverty |
| No Children | 483 (89.6%) | 56 (10.4%) |
| 1 or 2 Children | 227 (52.3%) | 207 (47.7%) |
| 3 or 4 Children | 42 (21.0%) | 158 (79.0%) |
| 5 or more Children | 29 (54.7%) | 24 (45.3%) |
| Total | 781 (63.7%) | 445 (36.3%) |
Income Below Poverty Among Single-Parent Households in Orange Cove
According to the poverty data in Orange Cove, 31.9% or 58 single-father households and 58.4% or 441 single-mother households are living below the poverty line. Among single-father households, those with 1 or 2 children have the highest poverty rate, with 50 households (48.5%) experiencing poverty. Likewise, among single-mother households, those with 3 or 4 children have the highest poverty rate, with 213 households (78.3%) falling below the poverty line.
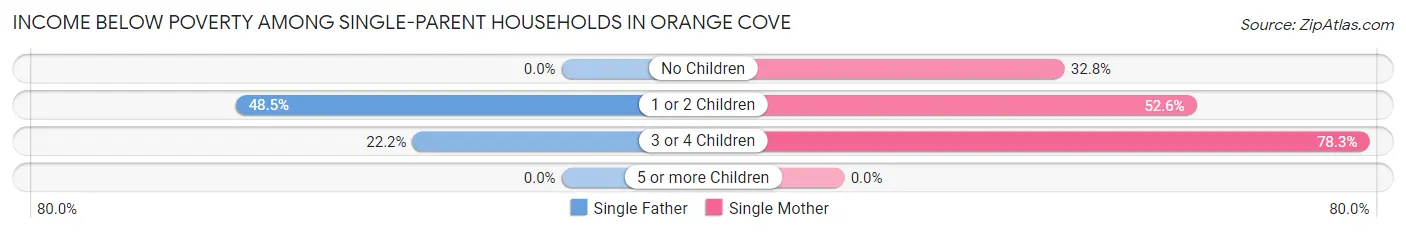
| Children | Single Father | Single Mother |
| No Children | 0 (0.0%) | 43 (32.8%) |
| 1 or 2 Children | 50 (48.5%) | 185 (52.6%) |
| 3 or 4 Children | 8 (22.2%) | 213 (78.3%) |
| 5 or more Children | 0 (0.0%) | 0 (0.0%) |
| Total | 58 (31.9%) | 441 (58.4%) |
Income Below Poverty Among Married-Couple vs Single-Parent Households in Orange Cove
The poverty data for Orange Cove shows that 445 of the married-couple family households (36.3%) and 499 of the single-parent households (53.3%) are living below the poverty level. Within the married-couple family households, those with 3 or 4 children have the highest poverty rate, with 158 households (79.0%) falling below the poverty line. Among the single-parent households, those with 3 or 4 children have the highest poverty rate, with 221 household (71.8%) living below poverty.
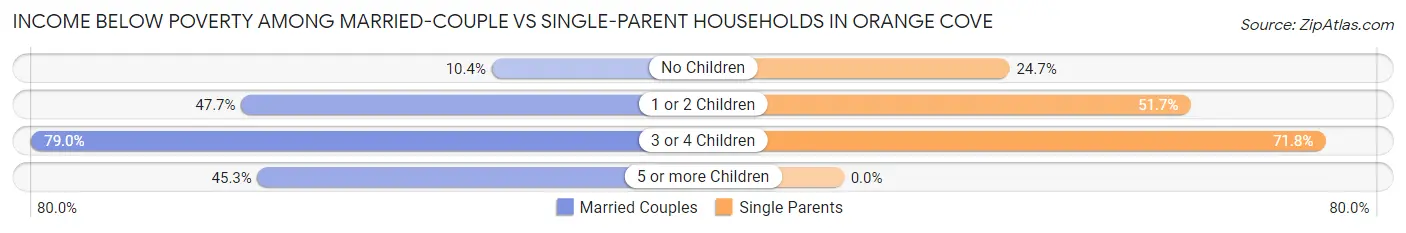
| Children | Married-Couple Families | Single-Parent Households |
| No Children | 56 (10.4%) | 43 (24.7%) |
| 1 or 2 Children | 207 (47.7%) | 235 (51.6%) |
| 3 or 4 Children | 158 (79.0%) | 221 (71.8%) |
| 5 or more Children | 24 (45.3%) | 0 (0.0%) |
| Total | 445 (36.3%) | 499 (53.3%) |
Race in Orange Cove
The most populous races in Orange Cove are Hispanic or Latino (9,257 | 96.1%), White / Caucasian (4,396 | 45.6%), and Some other Race (3,236 | 33.6%).
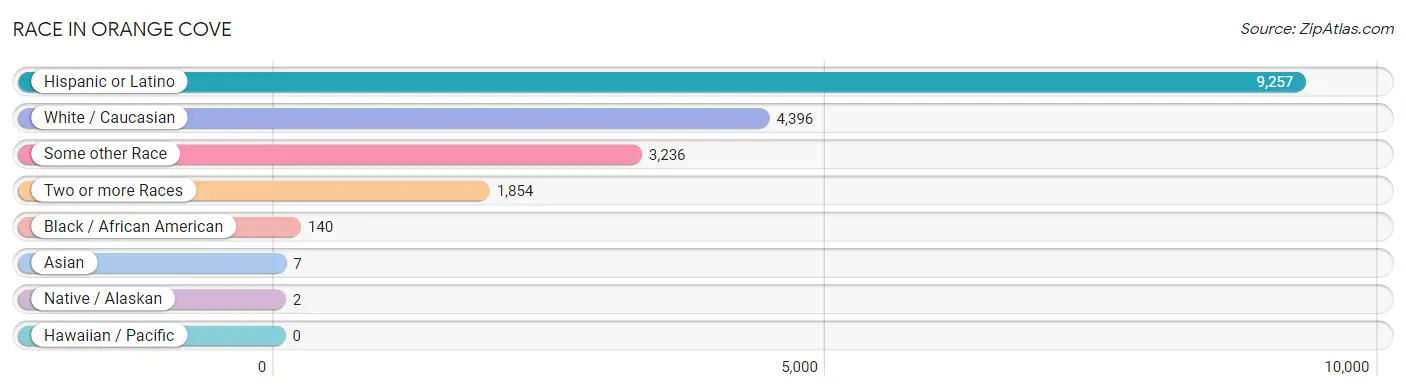
| Race | # Population | % Population |
| Asian | 7 | 0.1% |
| Black / African American | 140 | 1.5% |
| Hawaiian / Pacific | 0 | 0.0% |
| Hispanic or Latino | 9,257 | 96.1% |
| Native / Alaskan | 2 | 0.0% |
| White / Caucasian | 4,396 | 45.6% |
| Two or more Races | 1,854 | 19.2% |
| Some other Race | 3,236 | 33.6% |
| Total | 9,635 | 100.0% |
Ancestry in Orange Cove
The most populous ancestries reported in Orange Cove are Mexican (8,563 | 88.9%), Central American (512 | 5.3%), Salvadoran (512 | 5.3%), American (45 | 0.5%), and Bangladeshi (44 | 0.5%), together accounting for 100.4% of all Orange Cove residents.
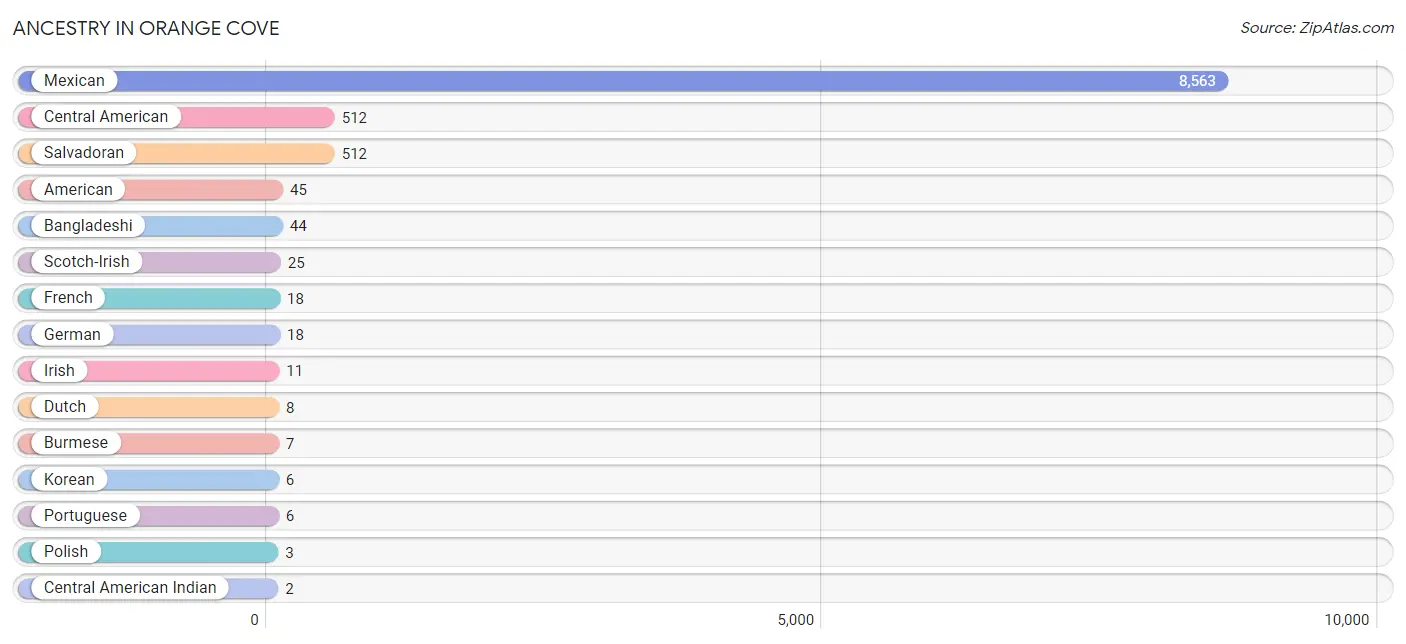
| Ancestry | # Population | % Population |
| American | 45 | 0.5% |
| Bangladeshi | 44 | 0.5% |
| Burmese | 7 | 0.1% |
| Central American | 512 | 5.3% |
| Central American Indian | 2 | 0.0% |
| Dutch | 8 | 0.1% |
| French | 18 | 0.2% |
| German | 18 | 0.2% |
| Irish | 11 | 0.1% |
| Korean | 6 | 0.1% |
| Mexican | 8,563 | 88.9% |
| Mexican American Indian | 2 | 0.0% |
| Polish | 3 | 0.0% |
| Portuguese | 6 | 0.1% |
| Salvadoran | 512 | 5.3% |
| Scotch-Irish | 25 | 0.3% | View All 16 Rows |
Immigrants in Orange Cove
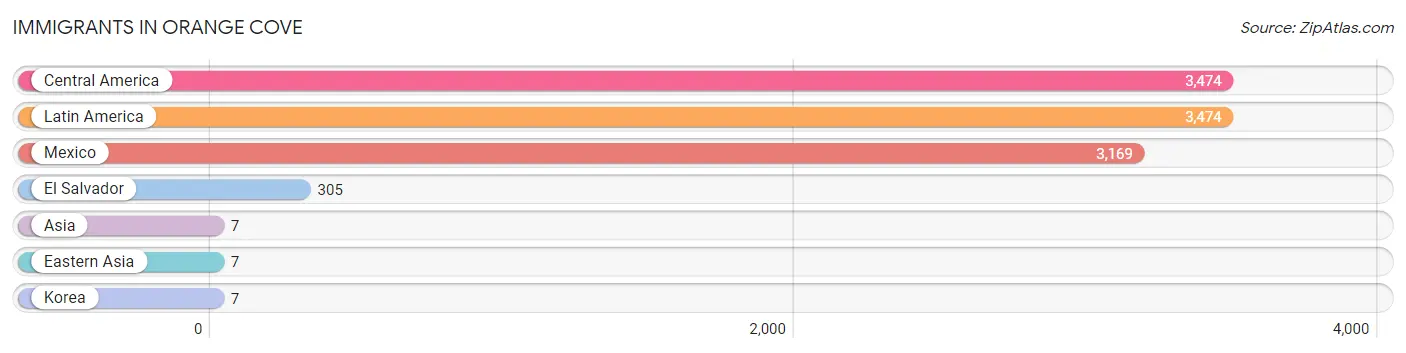
The most numerous immigrant groups reported in Orange Cove came from Central America (3,474 | 36.1%), Latin America (3,474 | 36.1%), Mexico (3,169 | 32.9%), El Salvador (305 | 3.2%), and Asia (7 | 0.1%), together accounting for 108.3% of all Orange Cove residents.
| Immigration Origin | # Population | % Population |
| Asia | 7 | 0.1% |
| Central America | 3,474 | 36.1% |
| Eastern Asia | 7 | 0.1% |
| El Salvador | 305 | 3.2% |
| Korea | 7 | 0.1% |
| Latin America | 3,474 | 36.1% |
| Mexico | 3,169 | 32.9% | View All 7 Rows |
Sex and Age in Orange Cove
Sex and Age in Orange Cove
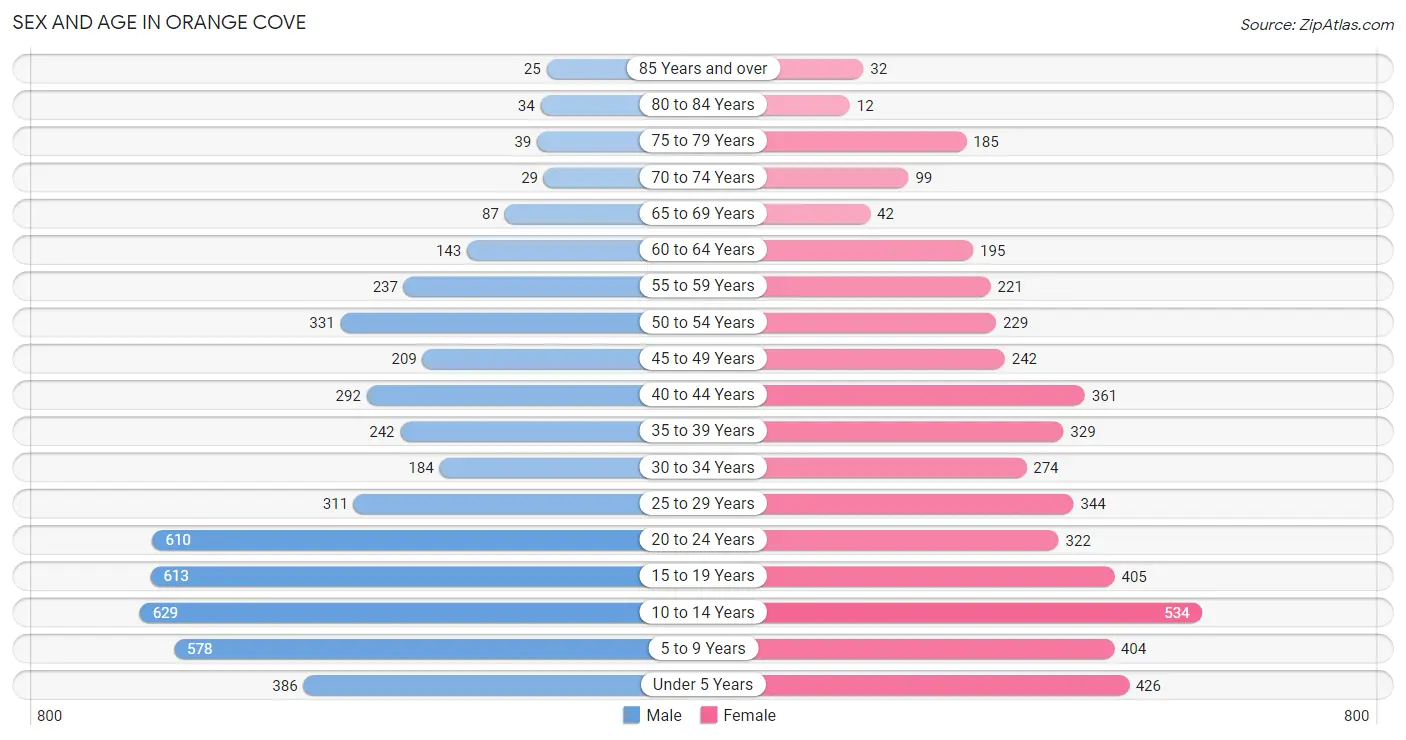
The most populous age groups in Orange Cove are 10 to 14 Years (629 | 12.6%) for men and 10 to 14 Years (534 | 11.5%) for women.
| Age Bracket | Male | Female |
| Under 5 Years | 386 (7.7%) | 426 (9.1%) |
| 5 to 9 Years | 578 (11.6%) | 404 (8.7%) |
| 10 to 14 Years | 629 (12.6%) | 534 (11.5%) |
| 15 to 19 Years | 613 (12.3%) | 405 (8.7%) |
| 20 to 24 Years | 610 (12.2%) | 322 (6.9%) |
| 25 to 29 Years | 311 (6.2%) | 344 (7.4%) |
| 30 to 34 Years | 184 (3.7%) | 274 (5.9%) |
| 35 to 39 Years | 242 (4.9%) | 329 (7.1%) |
| 40 to 44 Years | 292 (5.9%) | 361 (7.7%) |
| 45 to 49 Years | 209 (4.2%) | 242 (5.2%) |
| 50 to 54 Years | 331 (6.7%) | 229 (4.9%) |
| 55 to 59 Years | 237 (4.8%) | 221 (4.8%) |
| 60 to 64 Years | 143 (2.9%) | 195 (4.2%) |
| 65 to 69 Years | 87 (1.8%) | 42 (0.9%) |
| 70 to 74 Years | 29 (0.6%) | 99 (2.1%) |
| 75 to 79 Years | 39 (0.8%) | 185 (4.0%) |
| 80 to 84 Years | 34 (0.7%) | 12 (0.3%) |
| 85 Years and over | 25 (0.5%) | 32 (0.7%) |
| Total | 4,979 (100.0%) | 4,656 (100.0%) |
Families and Households in Orange Cove
Median Family Size in Orange Cove
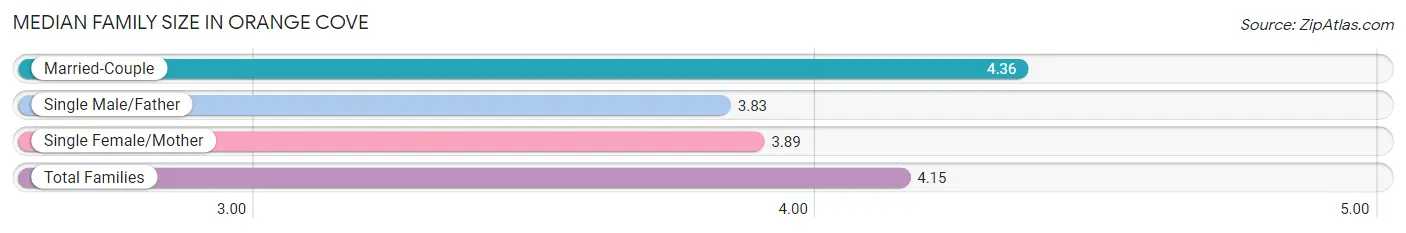
The median family size in Orange Cove is 4.15 persons per family, with married-couple families (1,226 | 56.7%) accounting for the largest median family size of 4.36 persons per family. On the other hand, single male/father families (182 | 8.4%) represent the smallest median family size with 3.83 persons per family.
| Family Type | # Families | Family Size |
| Married-Couple | 1,226 (56.7%) | 4.36 |
| Single Male/Father | 182 (8.4%) | 3.83 |
| Single Female/Mother | 755 (34.9%) | 3.89 |
| Total Families | 2,163 (100.0%) | 4.15 |
Median Household Size in Orange Cove
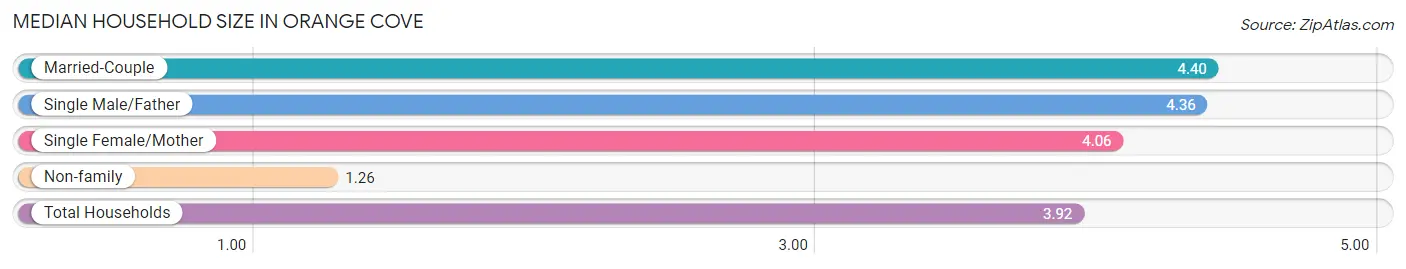
The median household size in Orange Cove is 3.92 persons per household, with married-couple households (1,226 | 49.8%) accounting for the largest median household size of 4.4 persons per household. non-family households (297 | 12.1%) represent the smallest median household size with 1.26 persons per household.
| Household Type | # Households | Household Size |
| Married-Couple | 1,226 (49.8%) | 4.40 |
| Single Male/Father | 182 (7.4%) | 4.36 |
| Single Female/Mother | 755 (30.7%) | 4.06 |
| Non-family | 297 (12.1%) | 1.26 |
| Total Households | 2,460 (100.0%) | 3.92 |
Household Size by Marriage Status in Orange Cove
Out of a total of 2,460 households in Orange Cove, 2,163 (87.9%) are family households, while 297 (12.1%) are nonfamily households. The most numerous type of family households are 4-person households, comprising 570, and the most common type of nonfamily households are 1-person households, comprising 267.
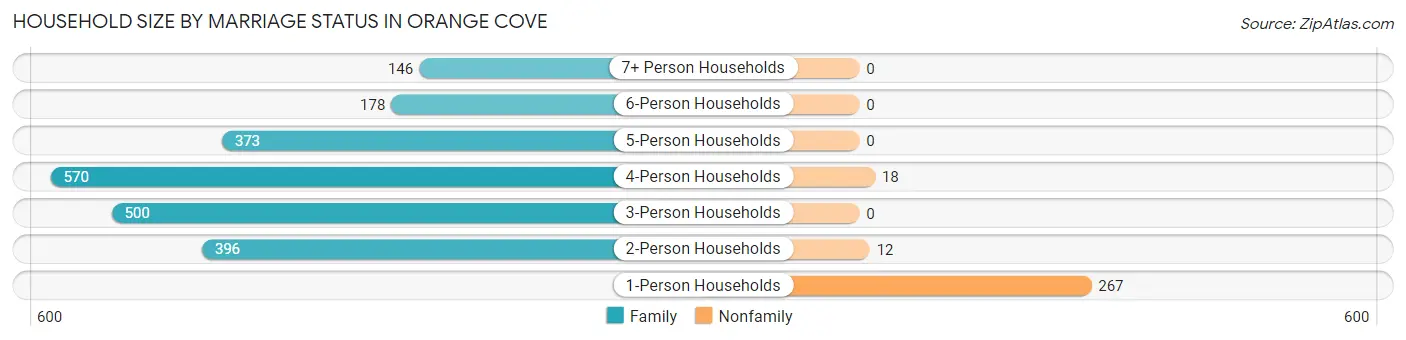
| Household Size | Family Households | Nonfamily Households |
| 1-Person Households | - | 267 (10.8%) |
| 2-Person Households | 396 (16.1%) | 12 (0.5%) |
| 3-Person Households | 500 (20.3%) | 0 (0.0%) |
| 4-Person Households | 570 (23.2%) | 18 (0.7%) |
| 5-Person Households | 373 (15.2%) | 0 (0.0%) |
| 6-Person Households | 178 (7.2%) | 0 (0.0%) |
| 7+ Person Households | 146 (5.9%) | 0 (0.0%) |
| Total | 2,163 (87.9%) | 297 (12.1%) |
Female Fertility in Orange Cove
Fertility by Age in Orange Cove
Average fertility rate in Orange Cove is 49.0 births per 1,000 women. Women in the age bracket of 15 to 19 years have the highest fertility rate with 77.0 births per 1,000 women. Women in the age bracket of 20 to 34 years acount for 48.2% of all women with births.
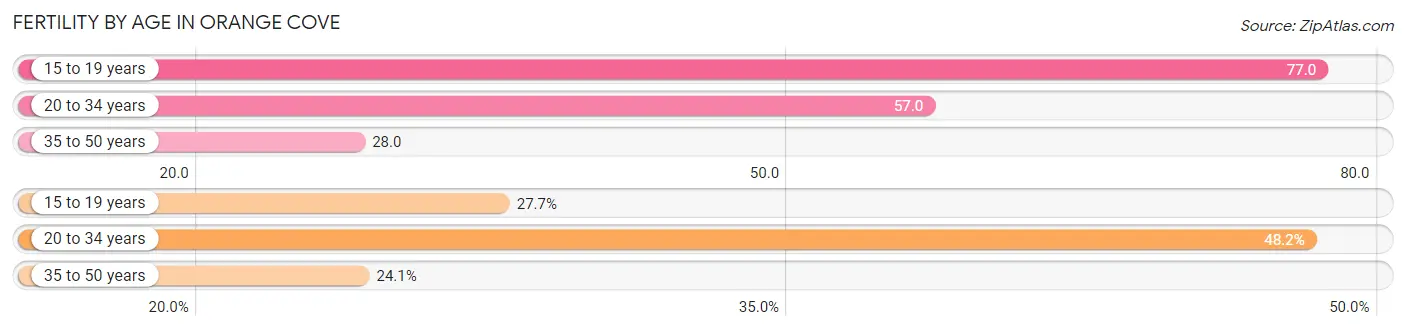
| Age Bracket | Women with Births | Births / 1,000 Women |
| 15 to 19 years | 31 (27.7%) | 77.0 |
| 20 to 34 years | 54 (48.2%) | 57.0 |
| 35 to 50 years | 27 (24.1%) | 28.0 |
| Total | 112 (100.0%) | 49.0 |
Fertility by Age by Marriage Status in Orange Cove
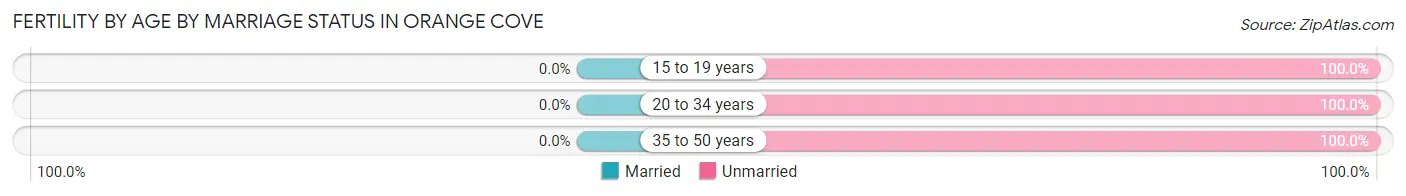
| Age Bracket | Married | Unmarried |
| 15 to 19 years | 0 (0.0%) | 31 (100.0%) |
| 20 to 34 years | 0 (0.0%) | 54 (100.0%) |
| 35 to 50 years | 0 (0.0%) | 27 (100.0%) |
| Total | 0 (0.0%) | 112 (100.0%) |
Fertility by Education in Orange Cove
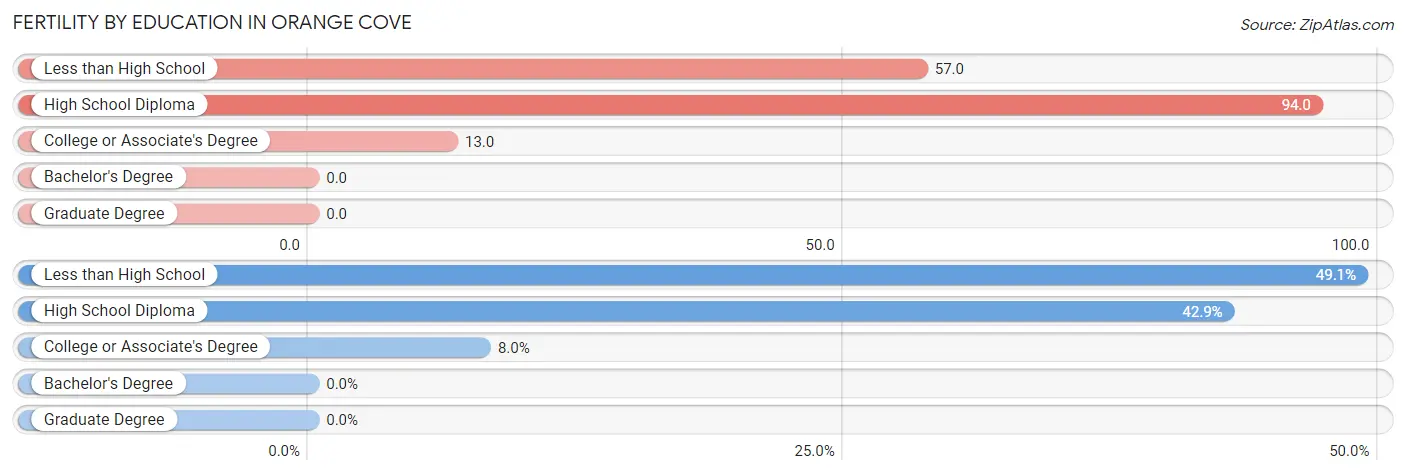
| Educational Attainment | Women with Births | Births / 1,000 Women |
| Less than High School | 55 (49.1%) | 57.0 |
| High School Diploma | 48 (42.9%) | 94.0 |
| College or Associate's Degree | 9 (8.0%) | 13.0 |
| Bachelor's Degree | 0 (0.0%) | 0.0 |
| Graduate Degree | 0 (0.0%) | 0.0 |
| Total | 112 (100.0%) | 49.0 |
Fertility by Education by Marriage Status in Orange Cove
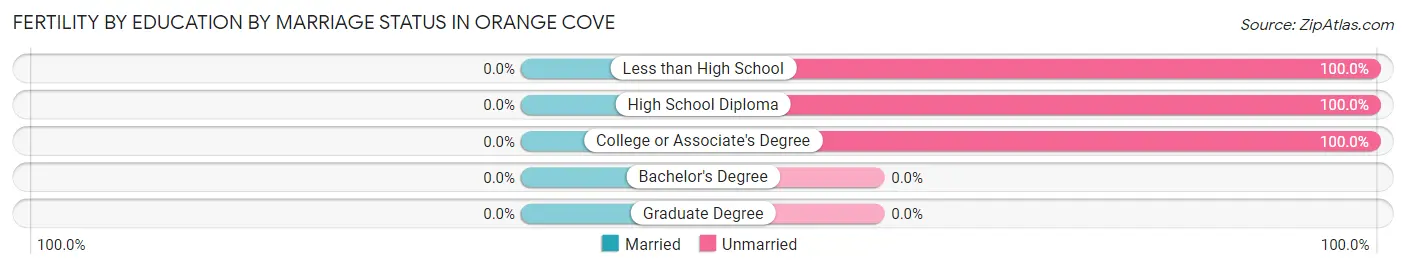
| Educational Attainment | Married | Unmarried |
| Less than High School | 0 (0.0%) | 55 (100.0%) |
| High School Diploma | 0 (0.0%) | 48 (100.0%) |
| College or Associate's Degree | 0 (0.0%) | 9 (100.0%) |
| Bachelor's Degree | 0 (0.0%) | 0 (0.0%) |
| Graduate Degree | 0 (0.0%) | 0 (0.0%) |
| Total | 0 (0.0%) | 112 (100.0%) |
Employment Characteristics in Orange Cove
Employment by Class of Employer in Orange Cove
Among the 3,204 employed individuals in Orange Cove, private company employees (2,559 | 79.9%), not-for-profit organizations (220 | 6.9%), and self-employed (not incorporated) (133 | 4.2%) make up the most common classes of employment.
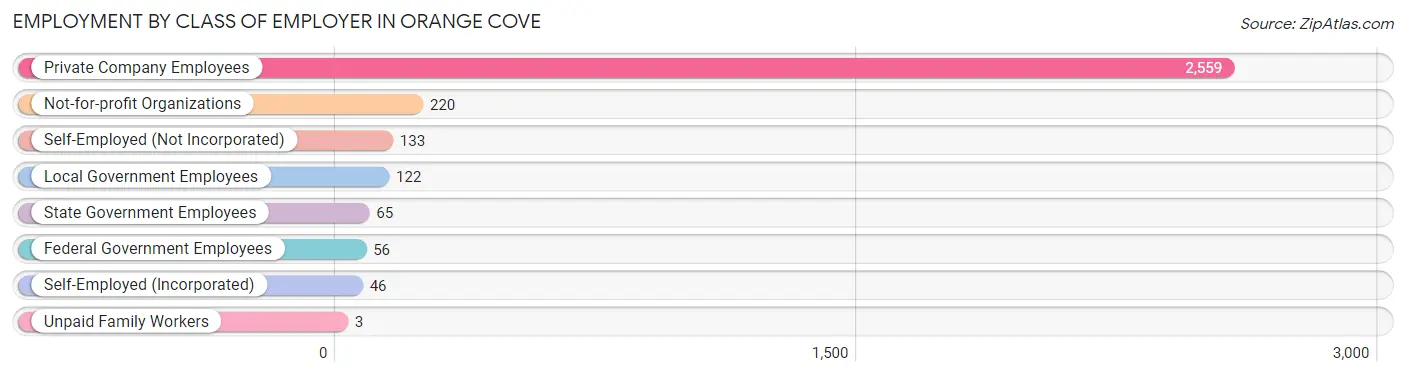
| Employer Class | # Employees | % Employees |
| Private Company Employees | 2,559 | 79.9% |
| Self-Employed (Incorporated) | 46 | 1.4% |
| Self-Employed (Not Incorporated) | 133 | 4.2% |
| Not-for-profit Organizations | 220 | 6.9% |
| Local Government Employees | 122 | 3.8% |
| State Government Employees | 65 | 2.0% |
| Federal Government Employees | 56 | 1.8% |
| Unpaid Family Workers | 3 | 0.1% |
| Total | 3,204 | 100.0% |
Employment Status by Age in Orange Cove
According to the labor force statistics for Orange Cove, out of the total population over 16 years of age (6,392), 59.5% or 3,803 individuals are in the labor force, with 13.7% or 521 of them unemployed. The age group with the highest labor force participation rate is 35 to 44 years, with 84.6% or 1,036 individuals in the labor force. Within the labor force, the 20 to 24 years age range has the highest percentage of unemployed individuals, with 18.7% or 115 of them being unemployed.
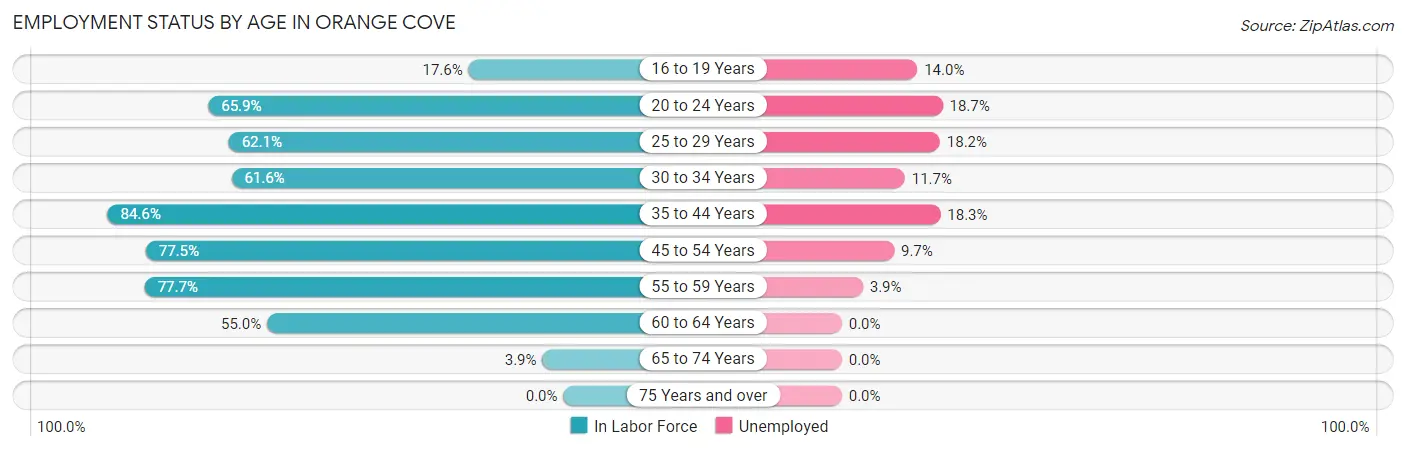
| Age Bracket | In Labor Force | Unemployed |
| 16 to 19 Years | 129 (17.6%) | 18 (14.0%) |
| 20 to 24 Years | 614 (65.9%) | 115 (18.7%) |
| 25 to 29 Years | 407 (62.1%) | 74 (18.2%) |
| 30 to 34 Years | 282 (61.6%) | 33 (11.7%) |
| 35 to 44 Years | 1,036 (84.6%) | 190 (18.3%) |
| 45 to 54 Years | 784 (77.5%) | 76 (9.7%) |
| 55 to 59 Years | 356 (77.7%) | 14 (3.9%) |
| 60 to 64 Years | 186 (55.0%) | 0 (0.0%) |
| 65 to 74 Years | 10 (3.9%) | 0 (0.0%) |
| 75 Years and over | 0 (0.0%) | 0 (0.0%) |
| Total | 3,803 (59.5%) | 521 (13.7%) |
Employment Status by Educational Attainment in Orange Cove
According to labor force statistics for Orange Cove, 73.6% of individuals (3,050) out of the total population between 25 and 64 years of age (4,144) are in the labor force, with 12.7% or 387 of them being unemployed. The group with the highest labor force participation rate are those with the educational attainment of less than high school, with 79.1% or 1,756 individuals in the labor force. Within the labor force, individuals with college / associate degree education have the highest percentage of unemployment, with 28.0% or 159 of them being unemployed.
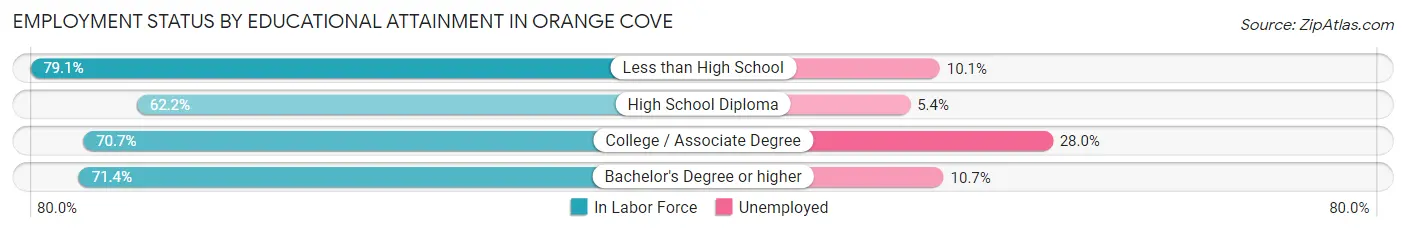
| Educational Attainment | In Labor Force | Unemployed |
| Less than High School | 1,756 (79.1%) | 224 (10.1%) |
| High School Diploma | 501 (62.2%) | 44 (5.4%) |
| College / Associate Degree | 568 (70.7%) | 225 (28.0%) |
| Bachelor's Degree or higher | 225 (71.4%) | 34 (10.7%) |
| Total | 3,050 (73.6%) | 526 (12.7%) |
Employment Occupations by Sex in Orange Cove
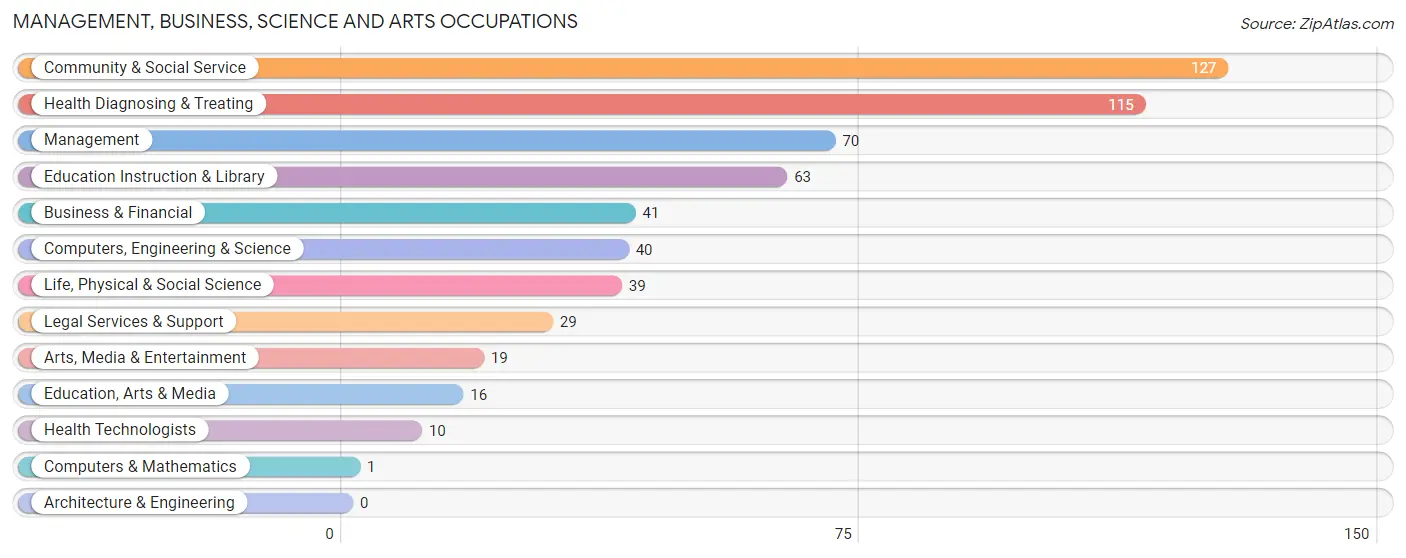
Management, Business, Science and Arts Occupations
The most common Management, Business, Science and Arts occupations in Orange Cove are Community & Social Service (127 | 3.9%), Health Diagnosing & Treating (115 | 3.5%), Management (70 | 2.1%), Education Instruction & Library (63 | 1.9%), and Business & Financial (41 | 1.3%).
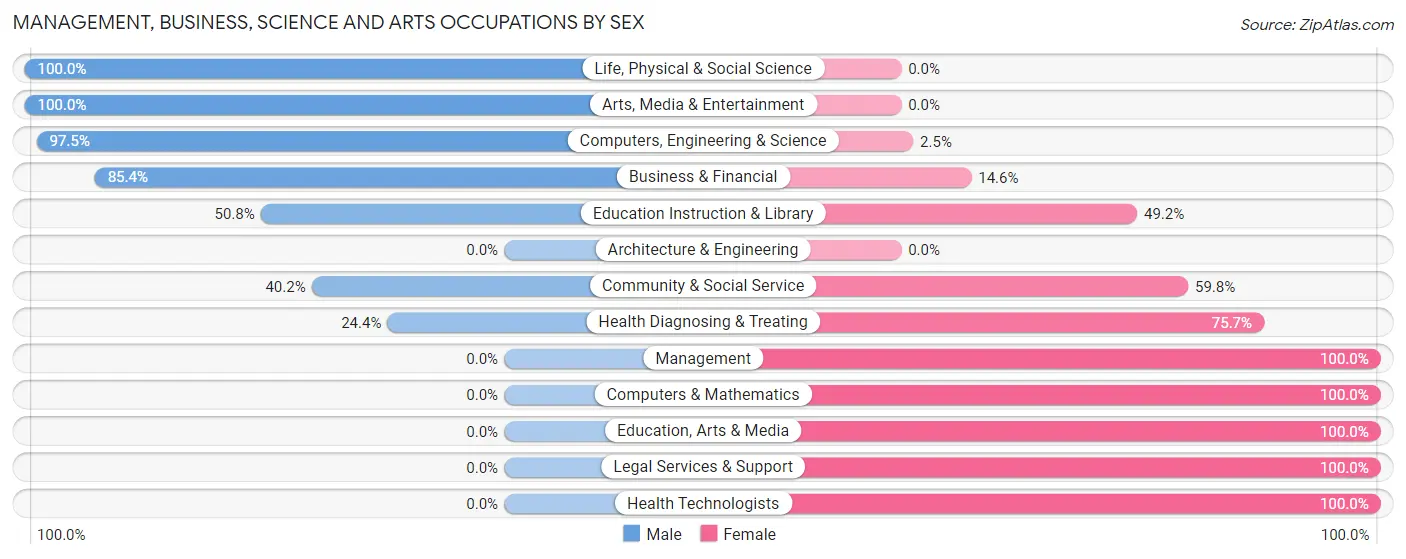
Management, Business, Science and Arts Occupations by Sex
Within the Management, Business, Science and Arts occupations in Orange Cove, the most male-oriented occupations are Life, Physical & Social Science (100.0%), Arts, Media & Entertainment (100.0%), and Computers, Engineering & Science (97.5%), while the most female-oriented occupations are Management (100.0%), Computers & Mathematics (100.0%), and Education, Arts & Media (100.0%).
| Occupation | Male | Female |
| Management | 0 (0.0%) | 70 (100.0%) |
| Business & Financial | 35 (85.4%) | 6 (14.6%) |
| Computers, Engineering & Science | 39 (97.5%) | 1 (2.5%) |
| Computers & Mathematics | 0 (0.0%) | 1 (100.0%) |
| Architecture & Engineering | 0 (0.0%) | 0 (0.0%) |
| Life, Physical & Social Science | 39 (100.0%) | 0 (0.0%) |
| Community & Social Service | 51 (40.2%) | 76 (59.8%) |
| Education, Arts & Media | 0 (0.0%) | 16 (100.0%) |
| Legal Services & Support | 0 (0.0%) | 29 (100.0%) |
| Education Instruction & Library | 32 (50.8%) | 31 (49.2%) |
| Arts, Media & Entertainment | 19 (100.0%) | 0 (0.0%) |
| Health Diagnosing & Treating | 28 (24.3%) | 87 (75.6%) |
| Health Technologists | 0 (0.0%) | 10 (100.0%) |
| Total (Category) | 153 (38.9%) | 240 (61.1%) |
| Total (Overall) | 1,815 (55.3%) | 1,469 (44.7%) |
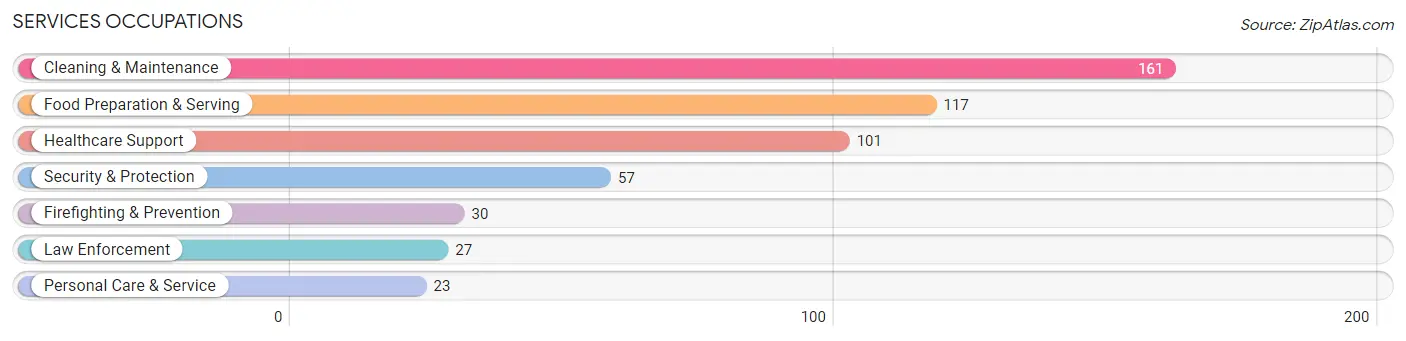
Services Occupations
The most common Services occupations in Orange Cove are Cleaning & Maintenance (161 | 4.9%), Food Preparation & Serving (117 | 3.6%), Healthcare Support (101 | 3.1%), Security & Protection (57 | 1.7%), and Firefighting & Prevention (30 | 0.9%).
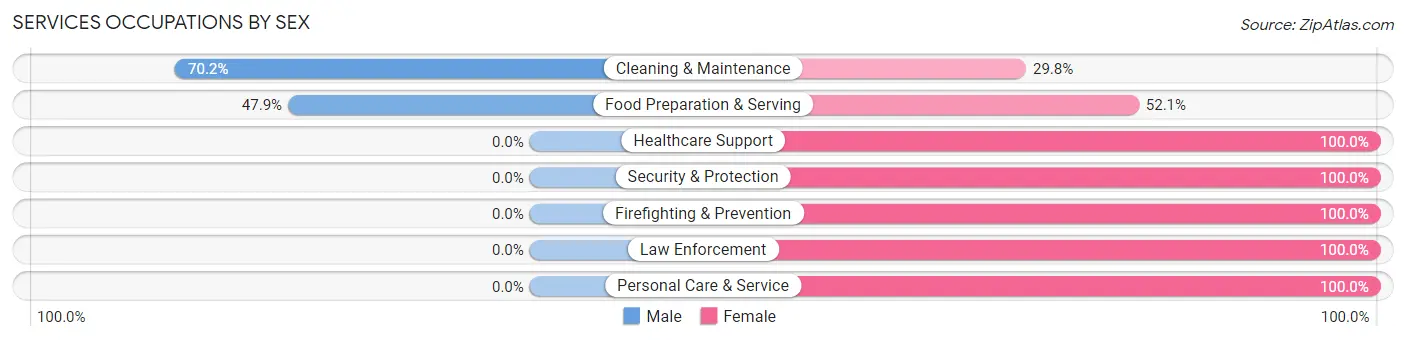
Services Occupations by Sex
Within the Services occupations in Orange Cove, the most male-oriented occupations are Cleaning & Maintenance (70.2%), and Food Preparation & Serving (47.9%), while the most female-oriented occupations are Healthcare Support (100.0%), Security & Protection (100.0%), and Firefighting & Prevention (100.0%).
| Occupation | Male | Female |
| Healthcare Support | 0 (0.0%) | 101 (100.0%) |
| Security & Protection | 0 (0.0%) | 57 (100.0%) |
| Firefighting & Prevention | 0 (0.0%) | 30 (100.0%) |
| Law Enforcement | 0 (0.0%) | 27 (100.0%) |
| Food Preparation & Serving | 56 (47.9%) | 61 (52.1%) |
| Cleaning & Maintenance | 113 (70.2%) | 48 (29.8%) |
| Personal Care & Service | 0 (0.0%) | 23 (100.0%) |
| Total (Category) | 169 (36.8%) | 290 (63.2%) |
| Total (Overall) | 1,815 (55.3%) | 1,469 (44.7%) |
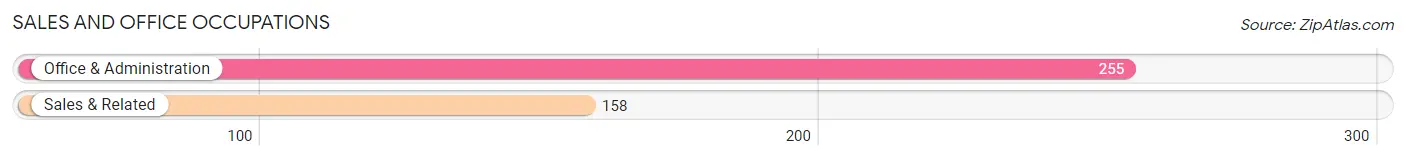
Sales and Office Occupations
The most common Sales and Office occupations in Orange Cove are Office & Administration (255 | 7.8%), and Sales & Related (158 | 4.8%).
Sales and Office Occupations by Sex
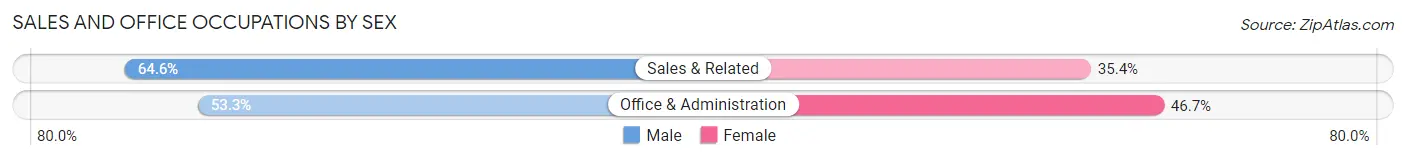
| Occupation | Male | Female |
| Sales & Related | 102 (64.6%) | 56 (35.4%) |
| Office & Administration | 136 (53.3%) | 119 (46.7%) |
| Total (Category) | 238 (57.6%) | 175 (42.4%) |
| Total (Overall) | 1,815 (55.3%) | 1,469 (44.7%) |
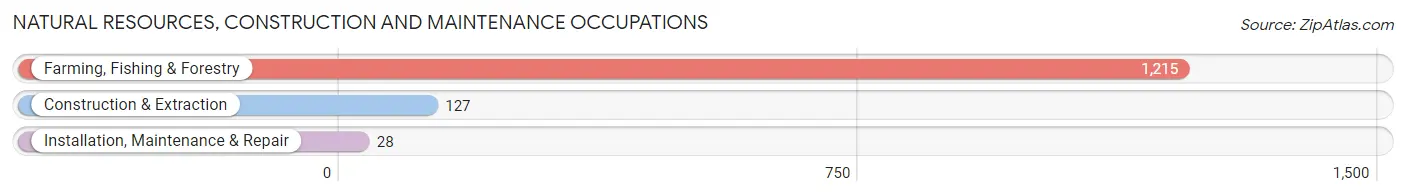
Natural Resources, Construction and Maintenance Occupations
The most common Natural Resources, Construction and Maintenance occupations in Orange Cove are Farming, Fishing & Forestry (1,215 | 37.0%), Construction & Extraction (127 | 3.9%), and Installation, Maintenance & Repair (28 | 0.9%).
Natural Resources, Construction and Maintenance Occupations by Sex
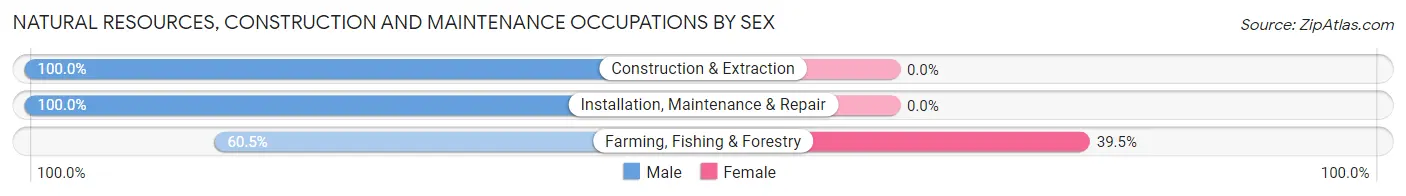
| Occupation | Male | Female |
| Farming, Fishing & Forestry | 735 (60.5%) | 480 (39.5%) |
| Construction & Extraction | 127 (100.0%) | 0 (0.0%) |
| Installation, Maintenance & Repair | 28 (100.0%) | 0 (0.0%) |
| Total (Category) | 890 (65.0%) | 480 (35.0%) |
| Total (Overall) | 1,815 (55.3%) | 1,469 (44.7%) |
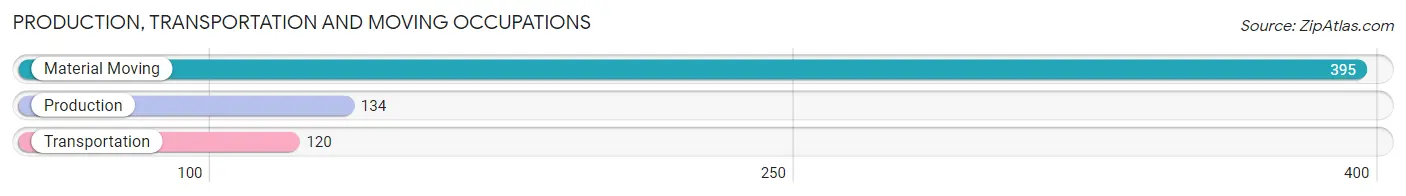
Production, Transportation and Moving Occupations
The most common Production, Transportation and Moving occupations in Orange Cove are Material Moving (395 | 12.0%), Production (134 | 4.1%), and Transportation (120 | 3.6%).
Production, Transportation and Moving Occupations by Sex
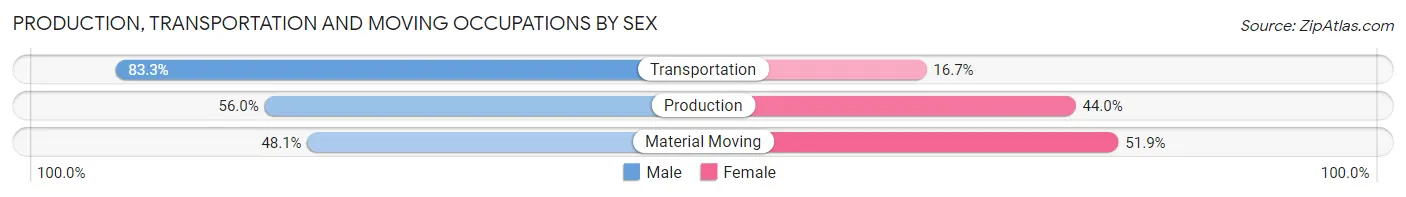
| Occupation | Male | Female |
| Production | 75 (56.0%) | 59 (44.0%) |
| Transportation | 100 (83.3%) | 20 (16.7%) |
| Material Moving | 190 (48.1%) | 205 (51.9%) |
| Total (Category) | 365 (56.2%) | 284 (43.8%) |
| Total (Overall) | 1,815 (55.3%) | 1,469 (44.7%) |
Employment Industries by Sex in Orange Cove
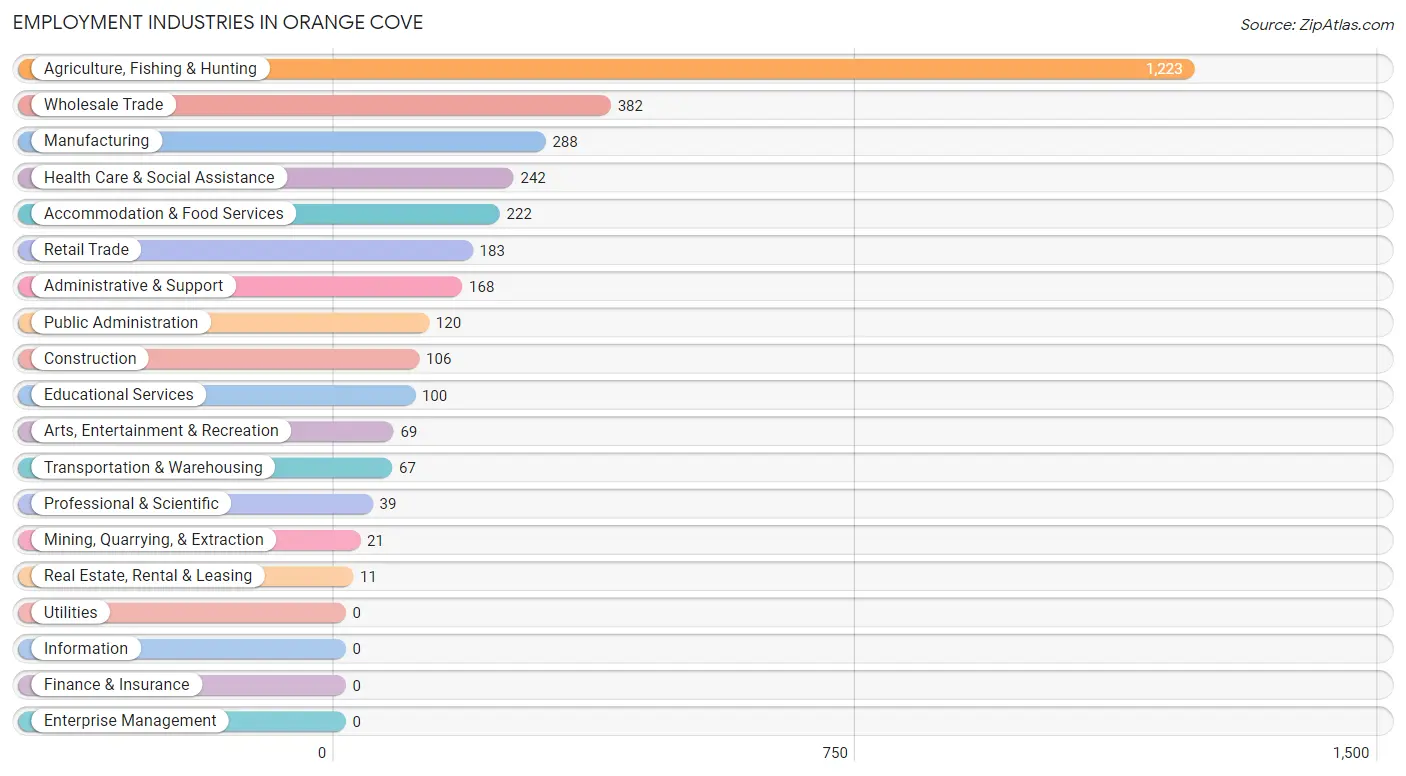
Employment Industries in Orange Cove
The major employment industries in Orange Cove include Agriculture, Fishing & Hunting (1,223 | 37.2%), Wholesale Trade (382 | 11.6%), Manufacturing (288 | 8.8%), Health Care & Social Assistance (242 | 7.4%), and Accommodation & Food Services (222 | 6.8%).
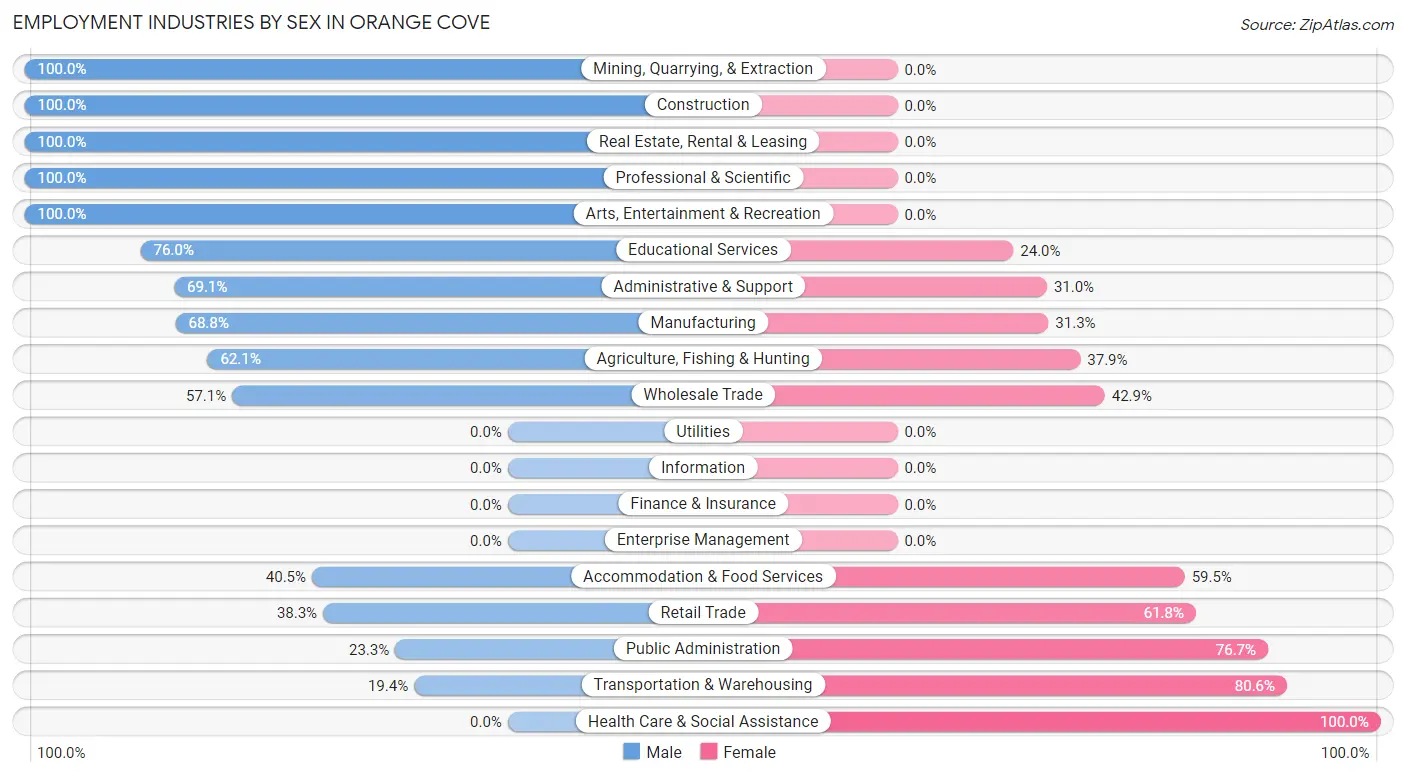
Employment Industries by Sex in Orange Cove
The Orange Cove industries that see more men than women are Mining, Quarrying, & Extraction (100.0%), Construction (100.0%), and Real Estate, Rental & Leasing (100.0%), whereas the industries that tend to have a higher number of women are Health Care & Social Assistance (100.0%), Transportation & Warehousing (80.6%), and Public Administration (76.7%).
| Industry | Male | Female |
| Agriculture, Fishing & Hunting | 760 (62.1%) | 463 (37.9%) |
| Mining, Quarrying, & Extraction | 21 (100.0%) | 0 (0.0%) |
| Construction | 106 (100.0%) | 0 (0.0%) |
| Manufacturing | 198 (68.8%) | 90 (31.2%) |
| Wholesale Trade | 218 (57.1%) | 164 (42.9%) |
| Retail Trade | 70 (38.3%) | 113 (61.8%) |
| Transportation & Warehousing | 13 (19.4%) | 54 (80.6%) |
| Utilities | 0 (0.0%) | 0 (0.0%) |
| Information | 0 (0.0%) | 0 (0.0%) |
| Finance & Insurance | 0 (0.0%) | 0 (0.0%) |
| Real Estate, Rental & Leasing | 11 (100.0%) | 0 (0.0%) |
| Professional & Scientific | 39 (100.0%) | 0 (0.0%) |
| Enterprise Management | 0 (0.0%) | 0 (0.0%) |
| Administrative & Support | 116 (69.1%) | 52 (30.9%) |
| Educational Services | 76 (76.0%) | 24 (24.0%) |
| Health Care & Social Assistance | 0 (0.0%) | 242 (100.0%) |
| Arts, Entertainment & Recreation | 69 (100.0%) | 0 (0.0%) |
| Accommodation & Food Services | 90 (40.5%) | 132 (59.5%) |
| Public Administration | 28 (23.3%) | 92 (76.7%) |
| Total | 1,815 (55.3%) | 1,469 (44.7%) |
Education in Orange Cove
School Enrollment in Orange Cove
The most common levels of schooling among the 3,662 students in Orange Cove are middle school (1,066 | 29.1%), high school (905 | 24.7%), and elementary school (814 | 22.2%).
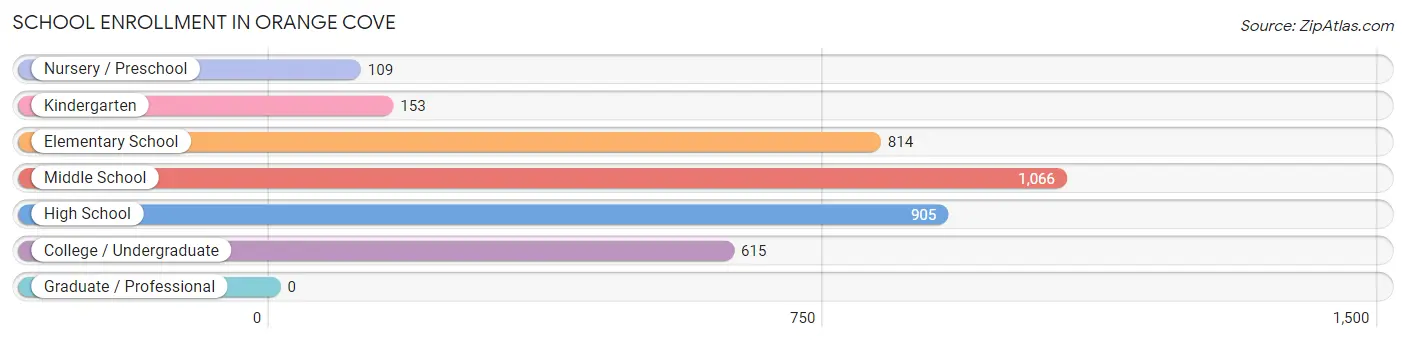
| School Level | # Students | % Students |
| Nursery / Preschool | 109 | 3.0% |
| Kindergarten | 153 | 4.2% |
| Elementary School | 814 | 22.2% |
| Middle School | 1,066 | 29.1% |
| High School | 905 | 24.7% |
| College / Undergraduate | 615 | 16.8% |
| Graduate / Professional | 0 | 0.0% |
| Total | 3,662 | 100.0% |
School Enrollment by Age by Funding Source in Orange Cove
Out of a total of 3,662 students who are enrolled in schools in Orange Cove, 37 (1.0%) attend a private institution, while the remaining 3,625 (99.0%) are enrolled in public schools. The age group of 25 to 34 year olds has the highest likelihood of being enrolled in private schools, with 10 (28.6% in the age bracket) enrolled. Conversely, the age group of 3 to 4 year olds has the lowest likelihood of being enrolled in a private school, with 97 (100.0% in the age bracket) attending a public institution.
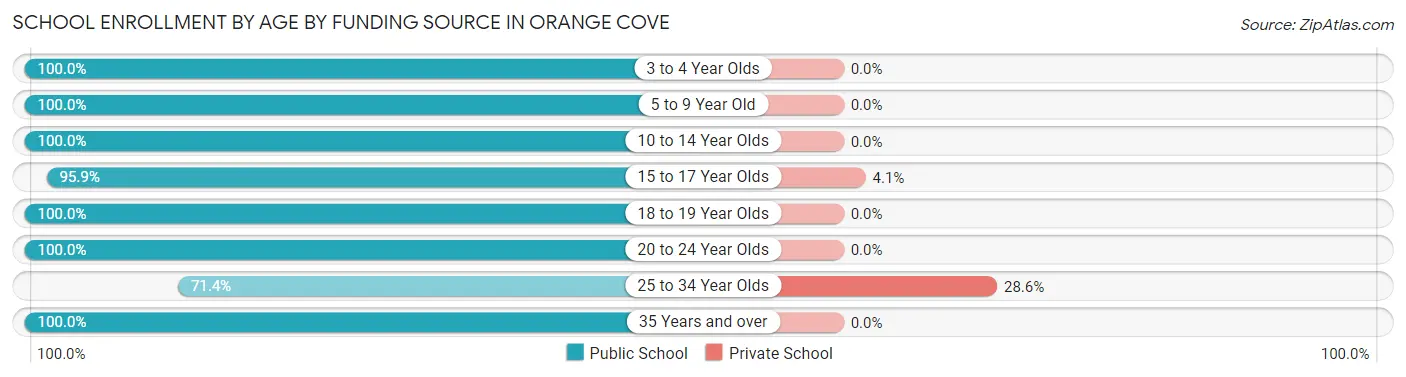
| Age Bracket | Public School | Private School |
| 3 to 4 Year Olds | 97 (100.0%) | 0 (0.0%) |
| 5 to 9 Year Old | 982 (100.0%) | 0 (0.0%) |
| 10 to 14 Year Olds | 1,128 (100.0%) | 0 (0.0%) |
| 15 to 17 Year Olds | 658 (95.9%) | 28 (4.1%) |
| 18 to 19 Year Olds | 286 (100.0%) | 0 (0.0%) |
| 20 to 24 Year Olds | 417 (100.0%) | 0 (0.0%) |
| 25 to 34 Year Olds | 25 (71.4%) | 10 (28.6%) |
| 35 Years and over | 31 (100.0%) | 0 (0.0%) |
| Total | 3,625 (99.0%) | 37 (1.0%) |
Educational Attainment by Field of Study in Orange Cove
Business (105 | 32.2%), computers & mathematics (47 | 14.4%), arts & humanities (39 | 12.0%), social sciences (37 | 11.4%), and physical & health sciences (35 | 10.7%) are the most common fields of study among 326 individuals in Orange Cove who have obtained a bachelor's degree or higher.
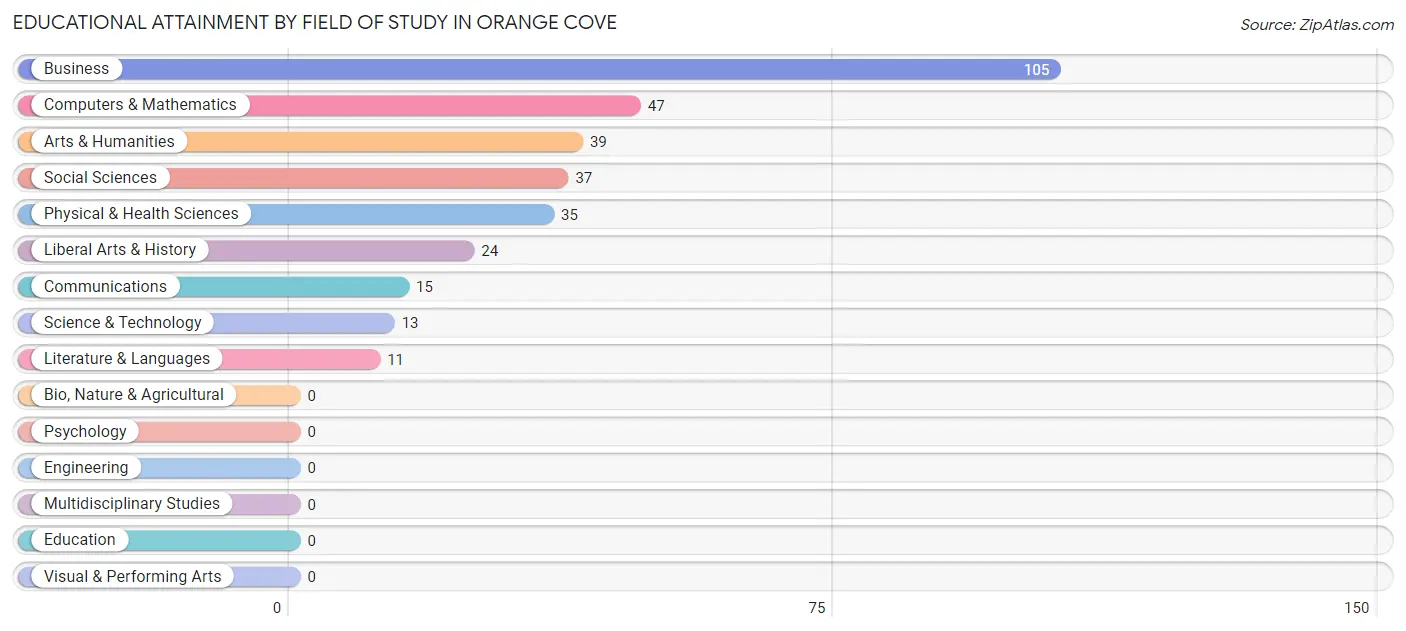
| Field of Study | # Graduates | % Graduates |
| Computers & Mathematics | 47 | 14.4% |
| Bio, Nature & Agricultural | 0 | 0.0% |
| Physical & Health Sciences | 35 | 10.7% |
| Psychology | 0 | 0.0% |
| Social Sciences | 37 | 11.4% |
| Engineering | 0 | 0.0% |
| Multidisciplinary Studies | 0 | 0.0% |
| Science & Technology | 13 | 4.0% |
| Business | 105 | 32.2% |
| Education | 0 | 0.0% |
| Literature & Languages | 11 | 3.4% |
| Liberal Arts & History | 24 | 7.4% |
| Visual & Performing Arts | 0 | 0.0% |
| Communications | 15 | 4.6% |
| Arts & Humanities | 39 | 12.0% |
| Total | 326 | 100.0% |
Transportation & Commute in Orange Cove
Vehicle Availability by Sex in Orange Cove
The most prevalent vehicle ownership categories in Orange Cove are males with 1 vehicle (476, accounting for 26.2%) and females with 1 vehicle (428, making up 34.3%).
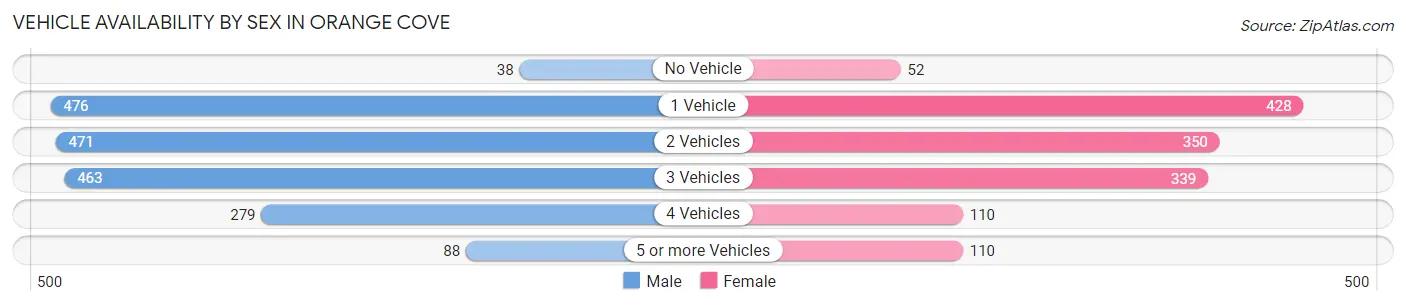
| Vehicles Available | Male | Female |
| No Vehicle | 38 (2.1%) | 52 (3.7%) |
| 1 Vehicle | 476 (26.2%) | 428 (30.8%) |
| 2 Vehicles | 471 (26.0%) | 350 (25.2%) |
| 3 Vehicles | 463 (25.5%) | 339 (24.4%) |
| 4 Vehicles | 279 (15.4%) | 110 (7.9%) |
| 5 or more Vehicles | 88 (4.9%) | 110 (7.9%) |
| Total | 1,815 (100.0%) | 1,389 (100.0%) |
Commute Time in Orange Cove
The most frequently occuring commute durations in Orange Cove are 30 to 34 minutes (555 commuters, 17.4%), 20 to 24 minutes (526 commuters, 16.5%), and 45 to 59 minutes (403 commuters, 12.7%).
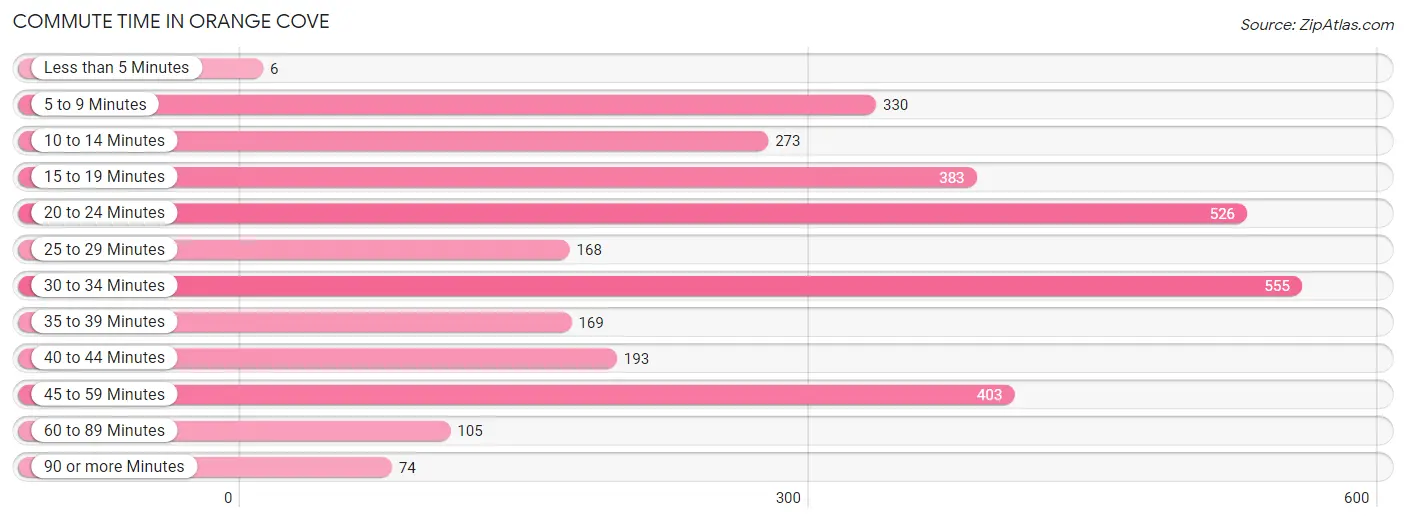
| Commute Time | # Commuters | % Commuters |
| Less than 5 Minutes | 6 | 0.2% |
| 5 to 9 Minutes | 330 | 10.4% |
| 10 to 14 Minutes | 273 | 8.6% |
| 15 to 19 Minutes | 383 | 12.0% |
| 20 to 24 Minutes | 526 | 16.5% |
| 25 to 29 Minutes | 168 | 5.3% |
| 30 to 34 Minutes | 555 | 17.4% |
| 35 to 39 Minutes | 169 | 5.3% |
| 40 to 44 Minutes | 193 | 6.1% |
| 45 to 59 Minutes | 403 | 12.7% |
| 60 to 89 Minutes | 105 | 3.3% |
| 90 or more Minutes | 74 | 2.3% |
Commute Time by Sex in Orange Cove
The most common commute times in Orange Cove are 20 to 24 minutes (367 commuters, 20.2%) for males and 30 to 34 minutes (252 commuters, 18.4%) for females.
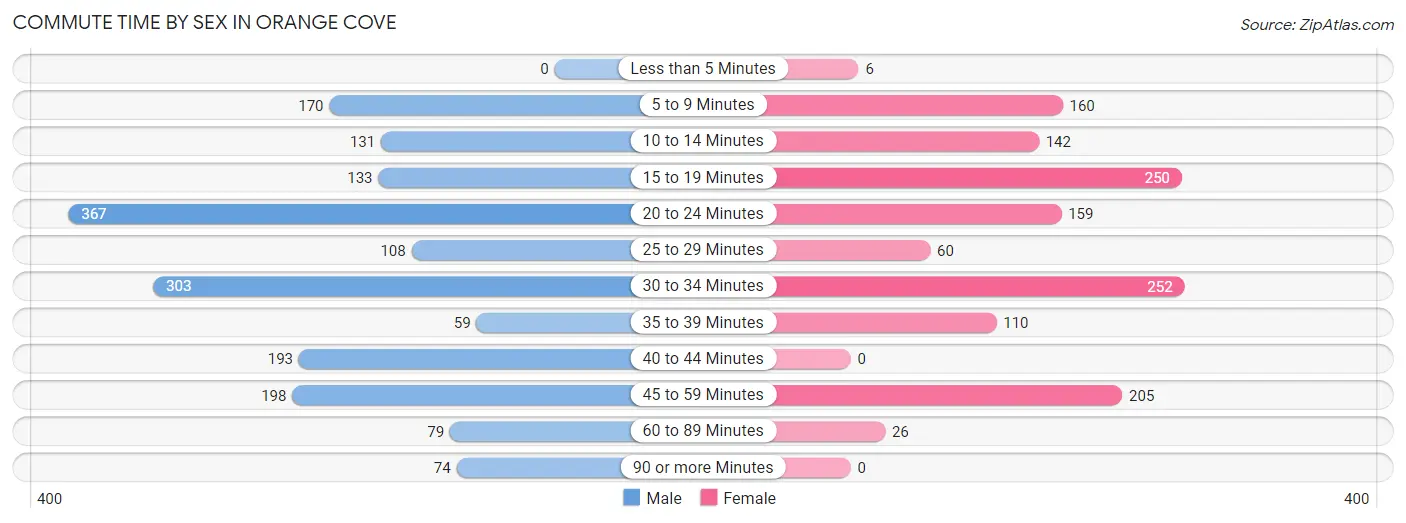
| Commute Time | Male | Female |
| Less than 5 Minutes | 0 (0.0%) | 6 (0.4%) |
| 5 to 9 Minutes | 170 (9.4%) | 160 (11.7%) |
| 10 to 14 Minutes | 131 (7.2%) | 142 (10.4%) |
| 15 to 19 Minutes | 133 (7.3%) | 250 (18.2%) |
| 20 to 24 Minutes | 367 (20.2%) | 159 (11.6%) |
| 25 to 29 Minutes | 108 (5.9%) | 60 (4.4%) |
| 30 to 34 Minutes | 303 (16.7%) | 252 (18.4%) |
| 35 to 39 Minutes | 59 (3.3%) | 110 (8.0%) |
| 40 to 44 Minutes | 193 (10.6%) | 0 (0.0%) |
| 45 to 59 Minutes | 198 (10.9%) | 205 (15.0%) |
| 60 to 89 Minutes | 79 (4.3%) | 26 (1.9%) |
| 90 or more Minutes | 74 (4.1%) | 0 (0.0%) |
Time of Departure to Work by Sex in Orange Cove
The most frequent times of departure to work in Orange Cove are 6:00 AM to 6:29 AM (346, 19.1%) for males and 7:30 AM to 7:59 AM (302, 22.0%) for females.
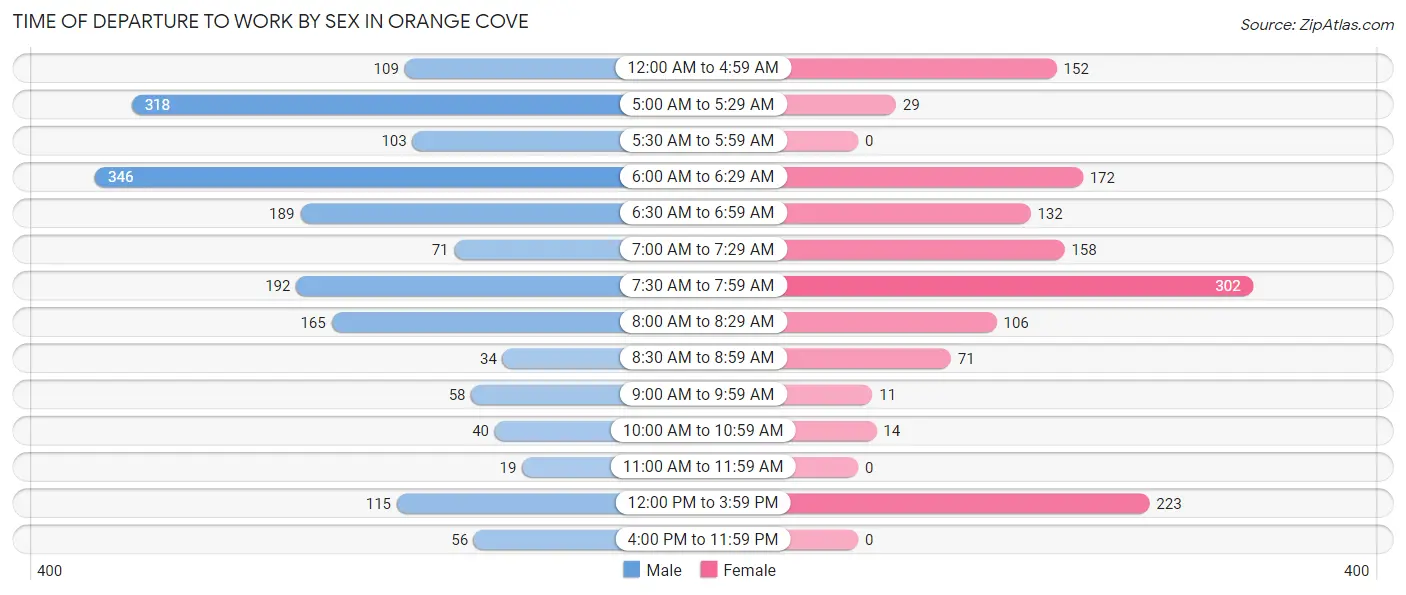
| Time of Departure | Male | Female |
| 12:00 AM to 4:59 AM | 109 (6.0%) | 152 (11.1%) |
| 5:00 AM to 5:29 AM | 318 (17.5%) | 29 (2.1%) |
| 5:30 AM to 5:59 AM | 103 (5.7%) | 0 (0.0%) |
| 6:00 AM to 6:29 AM | 346 (19.1%) | 172 (12.6%) |
| 6:30 AM to 6:59 AM | 189 (10.4%) | 132 (9.6%) |
| 7:00 AM to 7:29 AM | 71 (3.9%) | 158 (11.5%) |
| 7:30 AM to 7:59 AM | 192 (10.6%) | 302 (22.0%) |
| 8:00 AM to 8:29 AM | 165 (9.1%) | 106 (7.7%) |
| 8:30 AM to 8:59 AM | 34 (1.9%) | 71 (5.2%) |
| 9:00 AM to 9:59 AM | 58 (3.2%) | 11 (0.8%) |
| 10:00 AM to 10:59 AM | 40 (2.2%) | 14 (1.0%) |
| 11:00 AM to 11:59 AM | 19 (1.1%) | 0 (0.0%) |
| 12:00 PM to 3:59 PM | 115 (6.3%) | 223 (16.3%) |
| 4:00 PM to 11:59 PM | 56 (3.1%) | 0 (0.0%) |
| Total | 1,815 (100.0%) | 1,370 (100.0%) |
Housing Occupancy in Orange Cove
Occupancy by Ownership in Orange Cove
Of the total 2,460 dwellings in Orange Cove, owner-occupied units account for 946 (38.5%), while renter-occupied units make up 1,514 (61.5%).
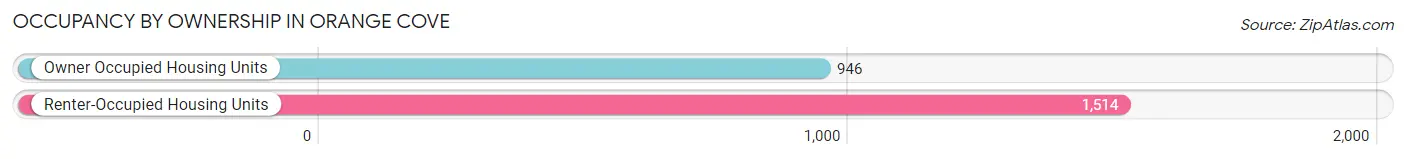
| Occupancy | # Housing Units | % Housing Units |
| Owner Occupied Housing Units | 946 | 38.5% |
| Renter-Occupied Housing Units | 1,514 | 61.5% |
| Total Occupied Housing Units | 2,460 | 100.0% |
Occupancy by Household Size in Orange Cove
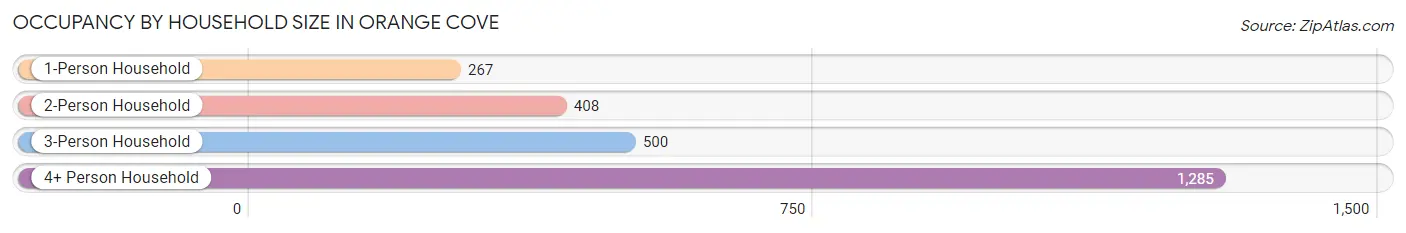
| Household Size | # Housing Units | % Housing Units |
| 1-Person Household | 267 | 10.8% |
| 2-Person Household | 408 | 16.6% |
| 3-Person Household | 500 | 20.3% |
| 4+ Person Household | 1,285 | 52.2% |
| Total Housing Units | 2,460 | 100.0% |
Occupancy by Ownership by Household Size in Orange Cove
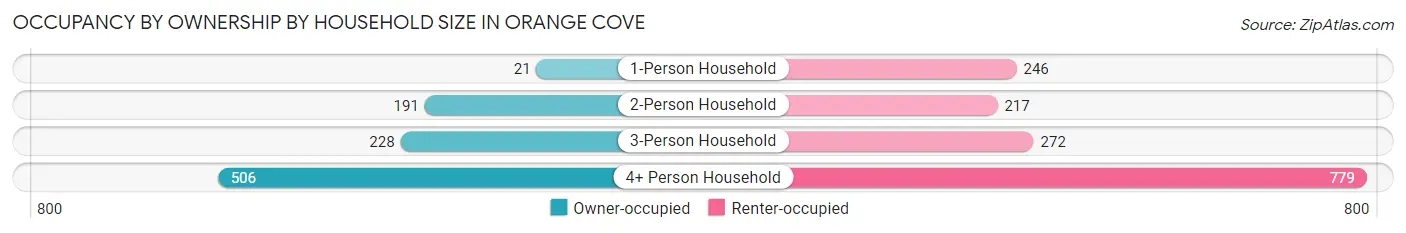
| Household Size | Owner-occupied | Renter-occupied |
| 1-Person Household | 21 (7.9%) | 246 (92.1%) |
| 2-Person Household | 191 (46.8%) | 217 (53.2%) |
| 3-Person Household | 228 (45.6%) | 272 (54.4%) |
| 4+ Person Household | 506 (39.4%) | 779 (60.6%) |
| Total Housing Units | 946 (38.5%) | 1,514 (61.5%) |
Occupancy by Educational Attainment in Orange Cove
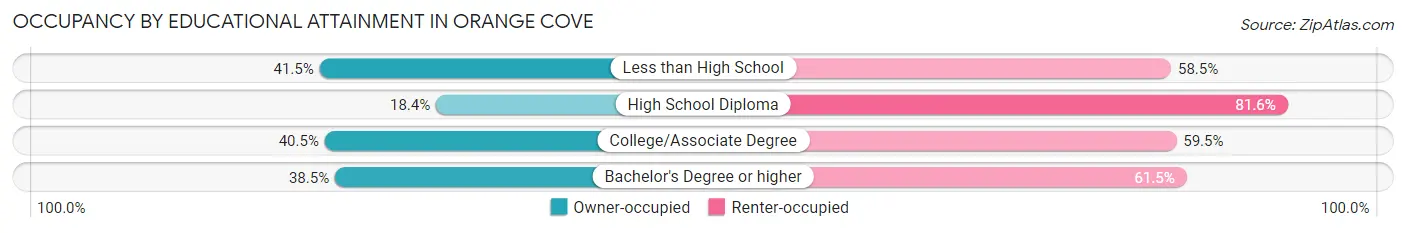
| Household Size | Owner-occupied | Renter-occupied |
| Less than High School | 647 (41.5%) | 911 (58.5%) |
| High School Diploma | 54 (18.4%) | 239 (81.6%) |
| College/Associate Degree | 215 (40.5%) | 316 (59.5%) |
| Bachelor's Degree or higher | 30 (38.5%) | 48 (61.5%) |
Occupancy by Age of Householder in Orange Cove
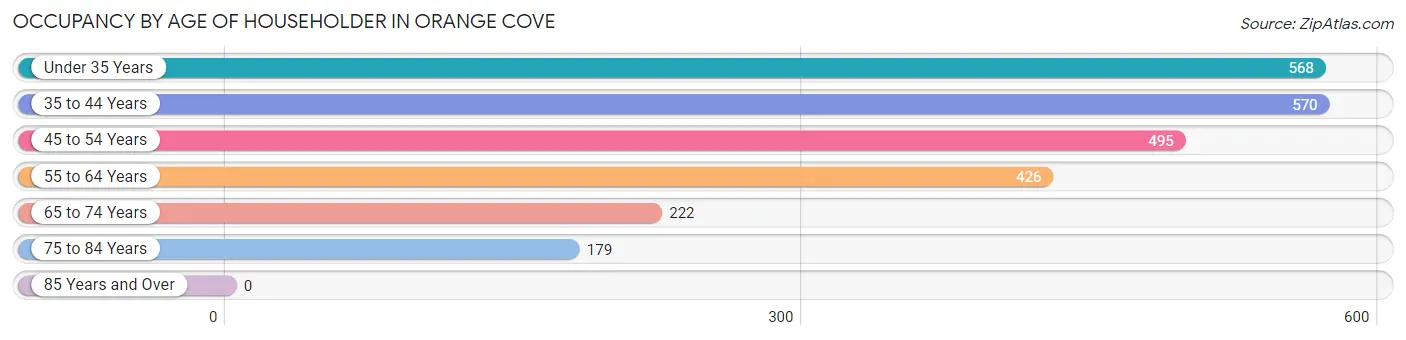
| Age Bracket | # Households | % Households |
| Under 35 Years | 568 | 23.1% |
| 35 to 44 Years | 570 | 23.2% |
| 45 to 54 Years | 495 | 20.1% |
| 55 to 64 Years | 426 | 17.3% |
| 65 to 74 Years | 222 | 9.0% |
| 75 to 84 Years | 179 | 7.3% |
| 85 Years and Over | 0 | 0.0% |
| Total | 2,460 | 100.0% |
Housing Finances in Orange Cove
Median Income by Occupancy in Orange Cove
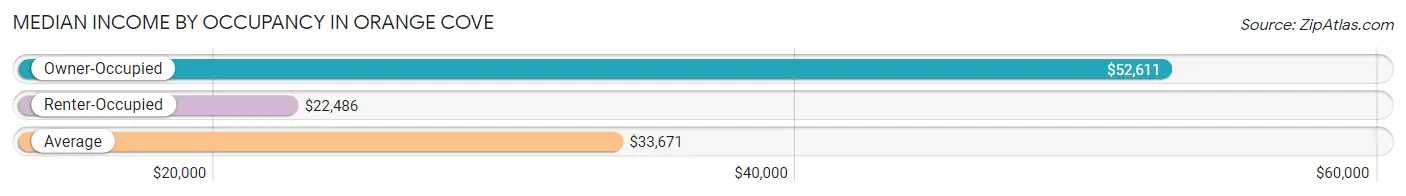
| Occupancy Type | # Households | Median Income |
| Owner-Occupied | 946 (38.5%) | $52,611 |
| Renter-Occupied | 1,514 (61.5%) | $22,486 |
| Average | 2,460 (100.0%) | $33,671 |
Occupancy by Householder Income Bracket in Orange Cove
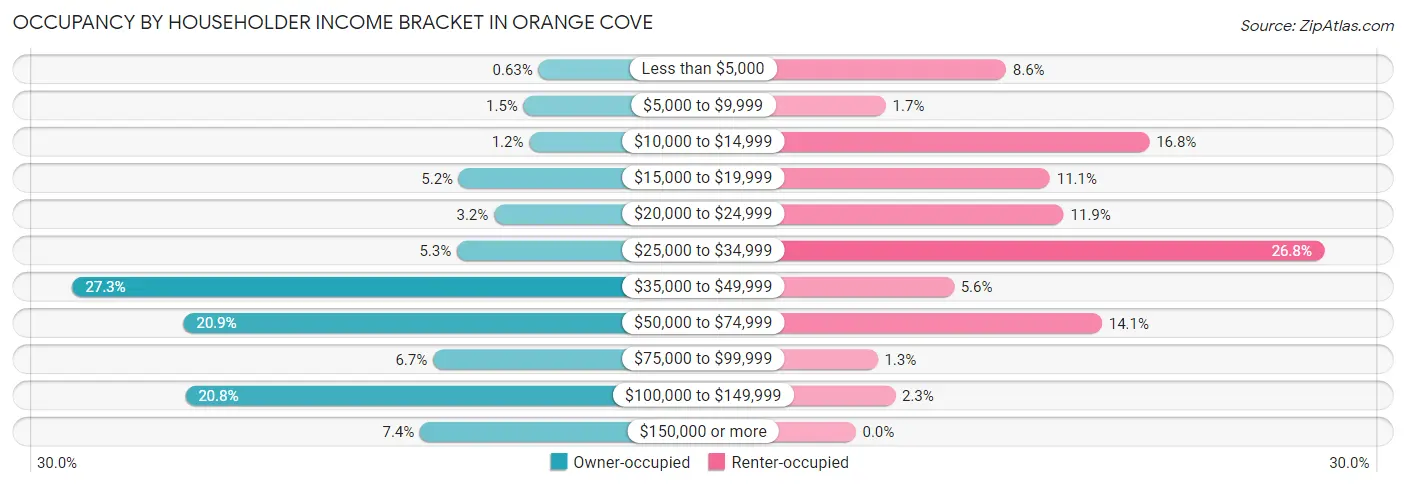
| Income Bracket | Owner-occupied | Renter-occupied |
| Less than $5,000 | 6 (0.6%) | 130 (8.6%) |
| $5,000 to $9,999 | 14 (1.5%) | 26 (1.7%) |
| $10,000 to $14,999 | 11 (1.2%) | 254 (16.8%) |
| $15,000 to $19,999 | 49 (5.2%) | 168 (11.1%) |
| $20,000 to $24,999 | 30 (3.2%) | 180 (11.9%) |
| $25,000 to $34,999 | 50 (5.3%) | 405 (26.8%) |
| $35,000 to $49,999 | 258 (27.3%) | 85 (5.6%) |
| $50,000 to $74,999 | 198 (20.9%) | 213 (14.1%) |
| $75,000 to $99,999 | 63 (6.7%) | 19 (1.3%) |
| $100,000 to $149,999 | 197 (20.8%) | 34 (2.2%) |
| $150,000 or more | 70 (7.4%) | 0 (0.0%) |
| Total | 946 (100.0%) | 1,514 (100.0%) |
Monthly Housing Cost Tiers in Orange Cove
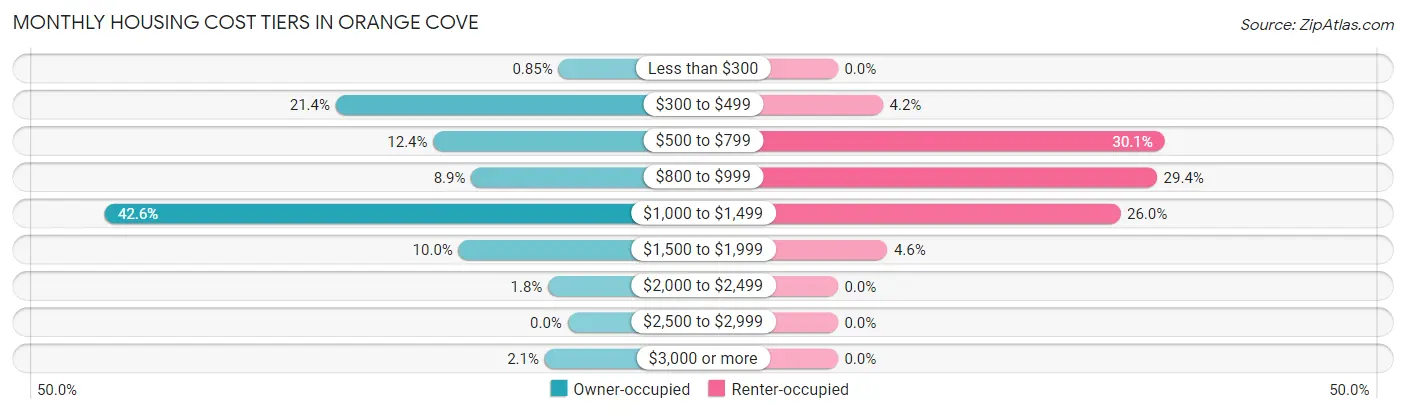
| Monthly Cost | Owner-occupied | Renter-occupied |
| Less than $300 | 8 (0.9%) | 0 (0.0%) |
| $300 to $499 | 202 (21.3%) | 63 (4.2%) |
| $500 to $799 | 117 (12.4%) | 456 (30.1%) |
| $800 to $999 | 84 (8.9%) | 445 (29.4%) |
| $1,000 to $1,499 | 403 (42.6%) | 394 (26.0%) |
| $1,500 to $1,999 | 95 (10.0%) | 69 (4.6%) |
| $2,000 to $2,499 | 17 (1.8%) | 0 (0.0%) |
| $2,500 to $2,999 | 0 (0.0%) | 0 (0.0%) |
| $3,000 or more | 20 (2.1%) | 0 (0.0%) |
| Total | 946 (100.0%) | 1,514 (100.0%) |
Physical Housing Characteristics in Orange Cove
Housing Structures in Orange Cove
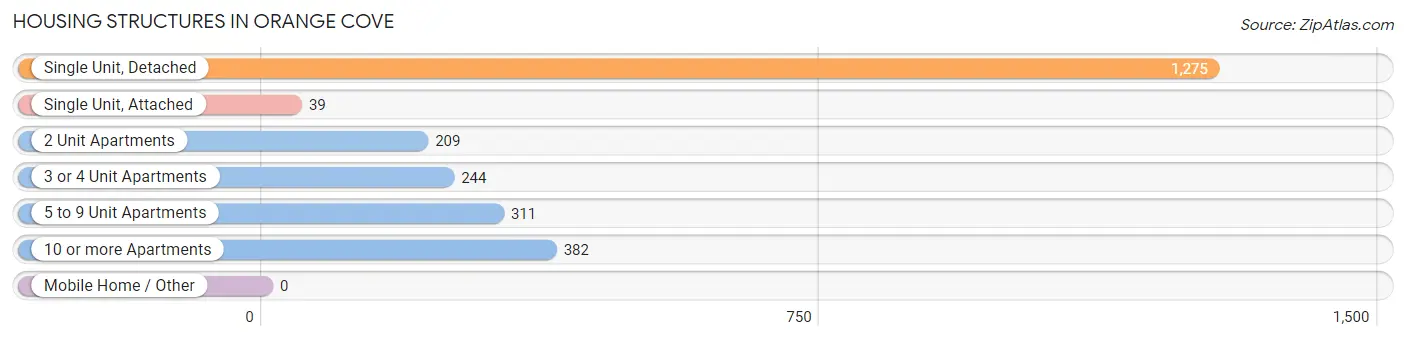
| Structure Type | # Housing Units | % Housing Units |
| Single Unit, Detached | 1,275 | 51.8% |
| Single Unit, Attached | 39 | 1.6% |
| 2 Unit Apartments | 209 | 8.5% |
| 3 or 4 Unit Apartments | 244 | 9.9% |
| 5 to 9 Unit Apartments | 311 | 12.6% |
| 10 or more Apartments | 382 | 15.5% |
| Mobile Home / Other | 0 | 0.0% |
| Total | 2,460 | 100.0% |
Housing Structures by Occupancy in Orange Cove
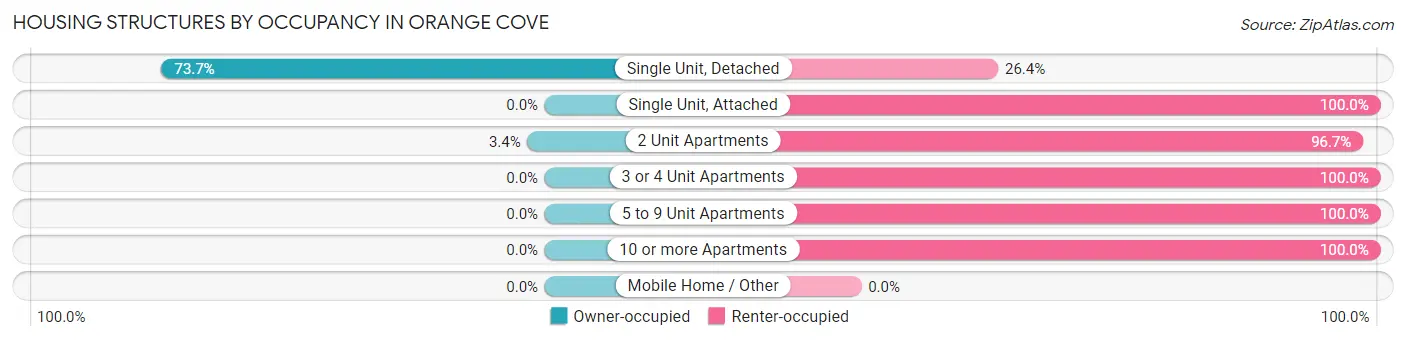
| Structure Type | Owner-occupied | Renter-occupied |
| Single Unit, Detached | 939 (73.7%) | 336 (26.4%) |
| Single Unit, Attached | 0 (0.0%) | 39 (100.0%) |
| 2 Unit Apartments | 7 (3.4%) | 202 (96.7%) |
| 3 or 4 Unit Apartments | 0 (0.0%) | 244 (100.0%) |
| 5 to 9 Unit Apartments | 0 (0.0%) | 311 (100.0%) |
| 10 or more Apartments | 0 (0.0%) | 382 (100.0%) |
| Mobile Home / Other | 0 (0.0%) | 0 (0.0%) |
| Total | 946 (38.5%) | 1,514 (61.5%) |
Housing Structures by Number of Rooms in Orange Cove
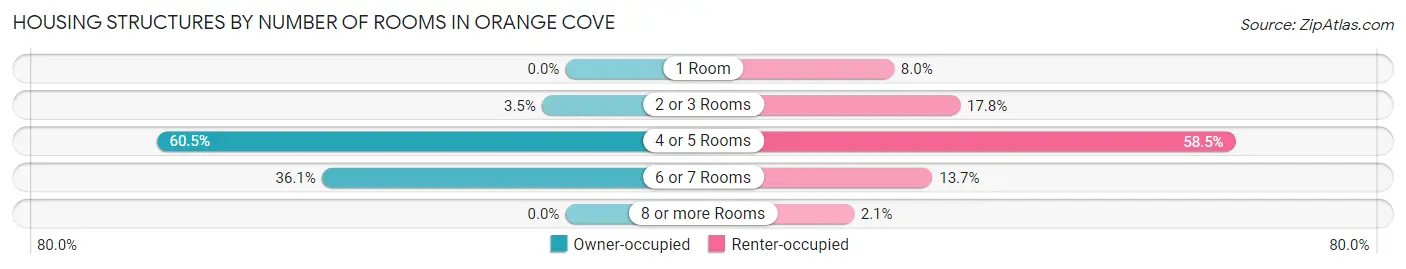
| Number of Rooms | Owner-occupied | Renter-occupied |
| 1 Room | 0 (0.0%) | 121 (8.0%) |
| 2 or 3 Rooms | 33 (3.5%) | 269 (17.8%) |
| 4 or 5 Rooms | 572 (60.5%) | 886 (58.5%) |
| 6 or 7 Rooms | 341 (36.0%) | 207 (13.7%) |
| 8 or more Rooms | 0 (0.0%) | 31 (2.1%) |
| Total | 946 (100.0%) | 1,514 (100.0%) |
Housing Structure by Heating Type in Orange Cove
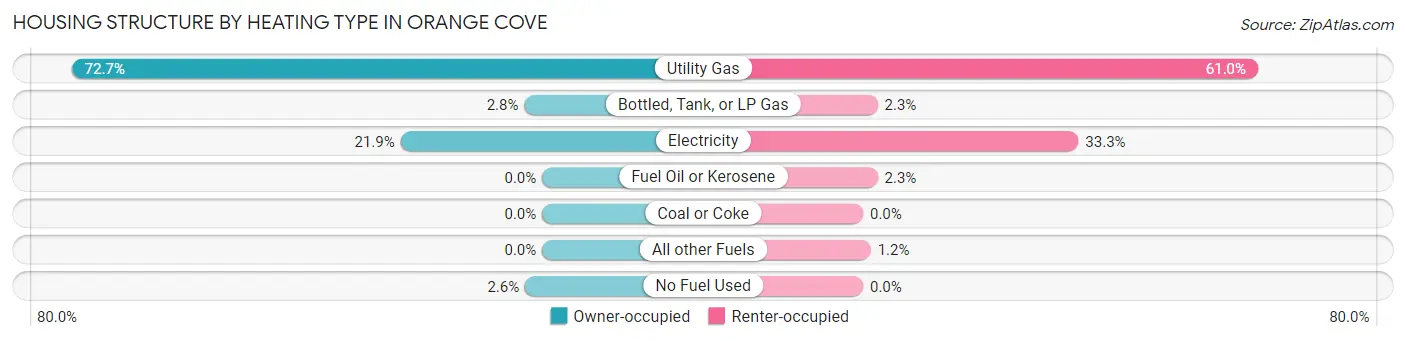
| Heating Type | Owner-occupied | Renter-occupied |
| Utility Gas | 688 (72.7%) | 924 (61.0%) |
| Bottled, Tank, or LP Gas | 26 (2.8%) | 34 (2.2%) |
| Electricity | 207 (21.9%) | 504 (33.3%) |
| Fuel Oil or Kerosene | 0 (0.0%) | 34 (2.2%) |
| Coal or Coke | 0 (0.0%) | 0 (0.0%) |
| All other Fuels | 0 (0.0%) | 18 (1.2%) |
| No Fuel Used | 25 (2.6%) | 0 (0.0%) |
| Total | 946 (100.0%) | 1,514 (100.0%) |
Household Vehicle Usage in Orange Cove
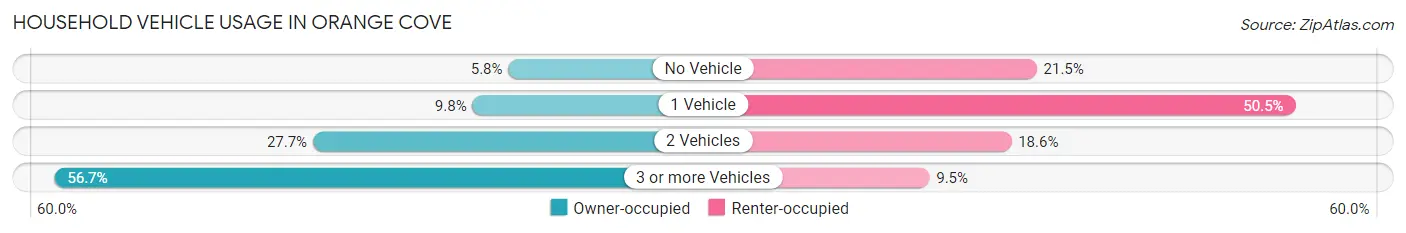
| Vehicles per Household | Owner-occupied | Renter-occupied |
| No Vehicle | 55 (5.8%) | 325 (21.5%) |
| 1 Vehicle | 93 (9.8%) | 764 (50.5%) |
| 2 Vehicles | 262 (27.7%) | 282 (18.6%) |
| 3 or more Vehicles | 536 (56.7%) | 143 (9.5%) |
| Total | 946 (100.0%) | 1,514 (100.0%) |
Real Estate & Mortgages in Orange Cove
Real Estate and Mortgage Overview in Orange Cove
| Characteristic | Without Mortgage | With Mortgage |
| Housing Units | 252 | 694 |
| Median Property Value | $208,300 | $207,800 |
| Median Household Income | $46,682 | $58 |
| Monthly Housing Costs | $425 | $20 |
| Real Estate Taxes | $2,150 | $65 |
Property Value by Mortgage Status in Orange Cove
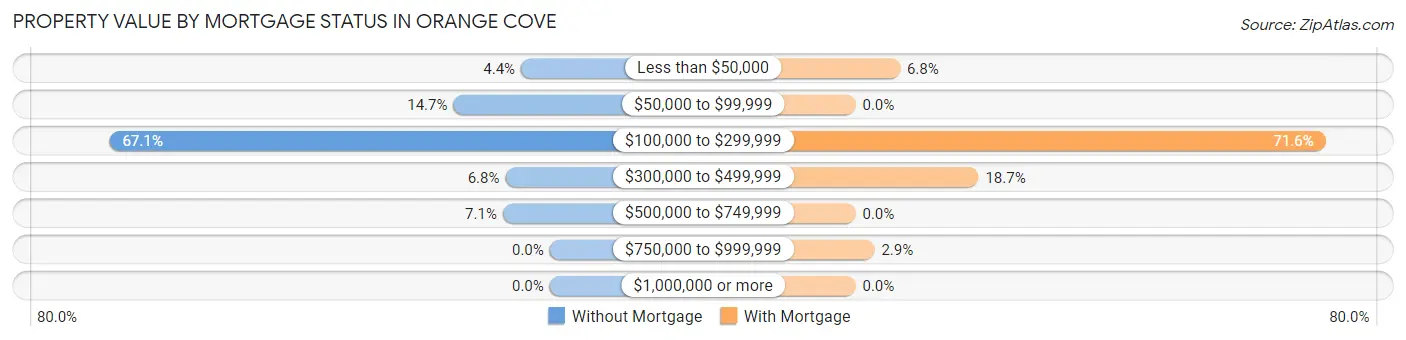
| Property Value | Without Mortgage | With Mortgage |
| Less than $50,000 | 11 (4.4%) | 47 (6.8%) |
| $50,000 to $99,999 | 37 (14.7%) | 0 (0.0%) |
| $100,000 to $299,999 | 169 (67.1%) | 497 (71.6%) |
| $300,000 to $499,999 | 17 (6.8%) | 130 (18.7%) |
| $500,000 to $749,999 | 18 (7.1%) | 0 (0.0%) |
| $750,000 to $999,999 | 0 (0.0%) | 20 (2.9%) |
| $1,000,000 or more | 0 (0.0%) | 0 (0.0%) |
| Total | 252 (100.0%) | 694 (100.0%) |
Household Income by Mortgage Status in Orange Cove
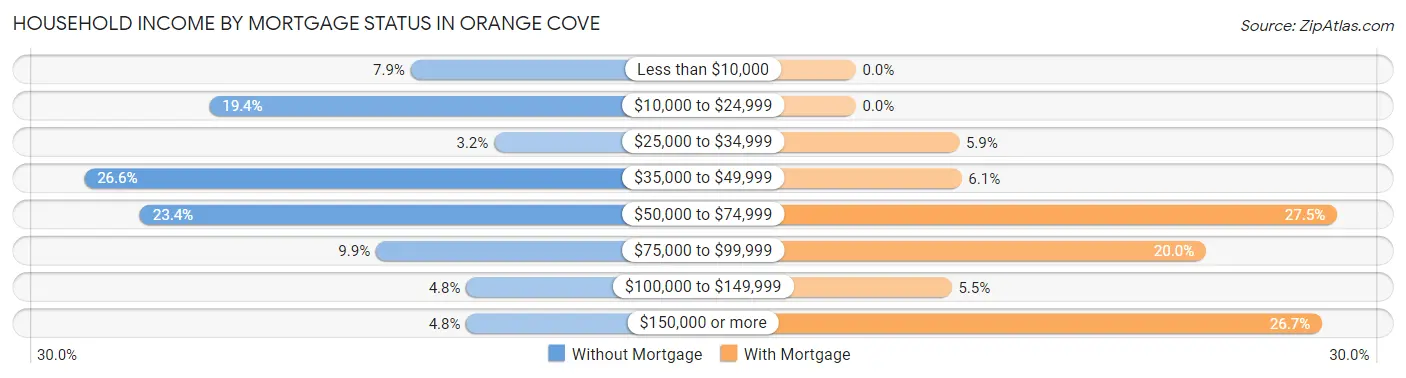
| Household Income | Without Mortgage | With Mortgage |
| Less than $10,000 | 20 (7.9%) | 0 (0.0%) |
| $10,000 to $24,999 | 49 (19.4%) | 0 (0.0%) |
| $25,000 to $34,999 | 8 (3.2%) | 41 (5.9%) |
| $35,000 to $49,999 | 67 (26.6%) | 42 (6.0%) |
| $50,000 to $74,999 | 59 (23.4%) | 191 (27.5%) |
| $75,000 to $99,999 | 25 (9.9%) | 139 (20.0%) |
| $100,000 to $149,999 | 12 (4.8%) | 38 (5.5%) |
| $150,000 or more | 12 (4.8%) | 185 (26.7%) |
| Total | 252 (100.0%) | 694 (100.0%) |
Property Value to Household Income Ratio in Orange Cove
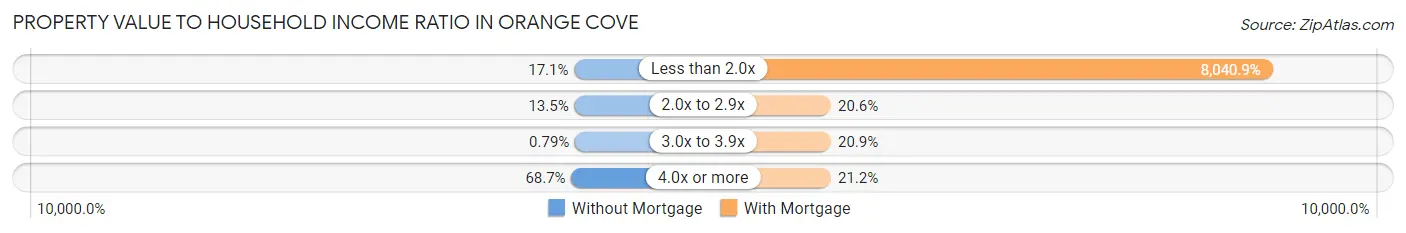
| Value-to-Income Ratio | Without Mortgage | With Mortgage |
| Less than 2.0x | 43 (17.1%) | 55,804 (8,040.9%) |
| 2.0x to 2.9x | 34 (13.5%) | 143 (20.6%) |
| 3.0x to 3.9x | 2 (0.8%) | 145 (20.9%) |
| 4.0x or more | 173 (68.6%) | 147 (21.2%) |
| Total | 252 (100.0%) | 694 (100.0%) |
Real Estate Taxes by Mortgage Status in Orange Cove
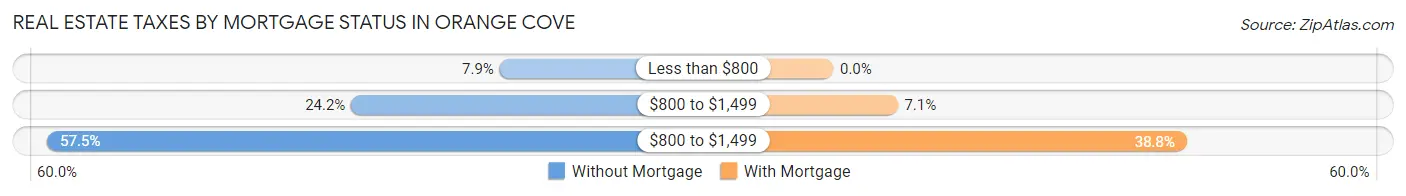
| Property Taxes | Without Mortgage | With Mortgage |
| Less than $800 | 20 (7.9%) | 0 (0.0%) |
| $800 to $1,499 | 61 (24.2%) | 49 (7.1%) |
| $800 to $1,499 | 145 (57.5%) | 269 (38.8%) |
| Total | 252 (100.0%) | 694 (100.0%) |
Health & Disability in Orange Cove
Health Insurance Coverage by Age in Orange Cove
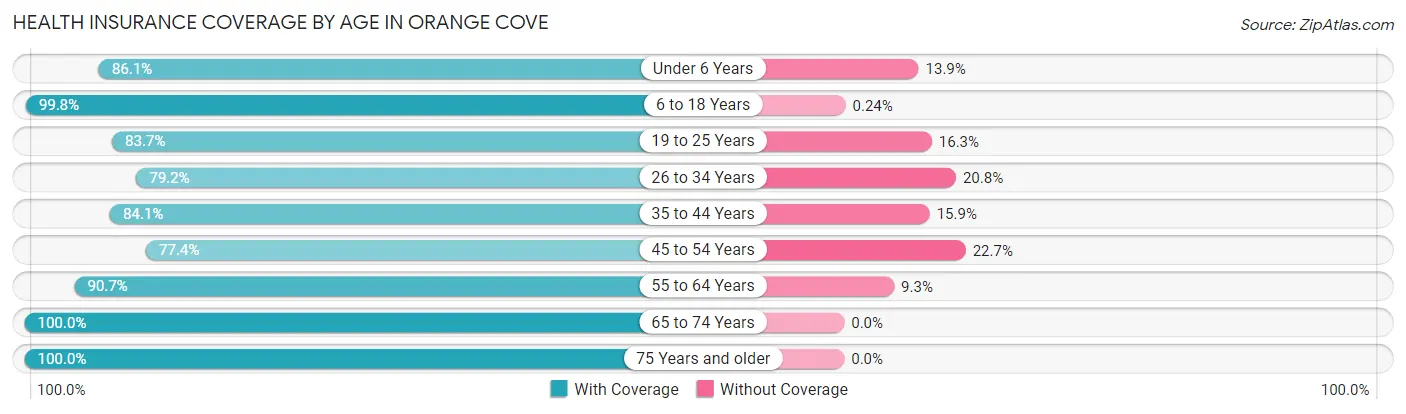
| Age Bracket | With Coverage | Without Coverage |
| Under 6 Years | 833 (86.1%) | 134 (13.9%) |
| 6 to 18 Years | 2,926 (99.8%) | 7 (0.2%) |
| 19 to 25 Years | 922 (83.7%) | 180 (16.3%) |
| 26 to 34 Years | 806 (79.2%) | 212 (20.8%) |
| 35 to 44 Years | 1,029 (84.1%) | 195 (15.9%) |
| 45 to 54 Years | 782 (77.3%) | 229 (22.7%) |
| 55 to 64 Years | 722 (90.7%) | 74 (9.3%) |
| 65 to 74 Years | 257 (100.0%) | 0 (0.0%) |
| 75 Years and older | 327 (100.0%) | 0 (0.0%) |
| Total | 8,604 (89.3%) | 1,031 (10.7%) |
Health Insurance Coverage by Citizenship Status in Orange Cove
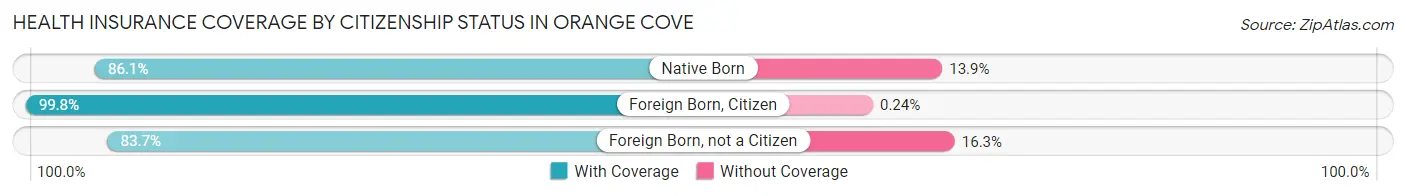
| Citizenship Status | With Coverage | Without Coverage |
| Native Born | 833 (86.1%) | 134 (13.9%) |
| Foreign Born, Citizen | 2,926 (99.8%) | 7 (0.2%) |
| Foreign Born, not a Citizen | 922 (83.7%) | 180 (16.3%) |
Health Insurance Coverage by Household Income in Orange Cove
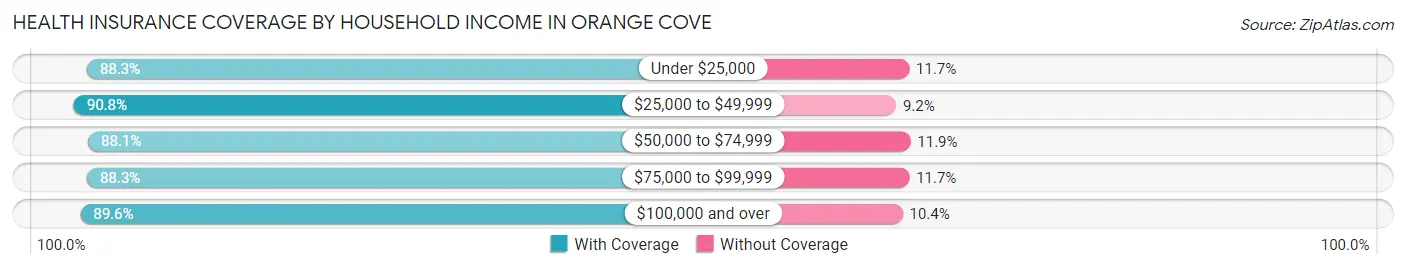
| Household Income | With Coverage | Without Coverage |
| Under $25,000 | 2,452 (88.3%) | 324 (11.7%) |
| $25,000 to $49,999 | 2,975 (90.8%) | 302 (9.2%) |
| $50,000 to $74,999 | 1,620 (88.1%) | 219 (11.9%) |
| $75,000 to $99,999 | 287 (88.3%) | 38 (11.7%) |
| $100,000 and over | 1,270 (89.6%) | 148 (10.4%) |
Public vs Private Health Insurance Coverage by Age in Orange Cove
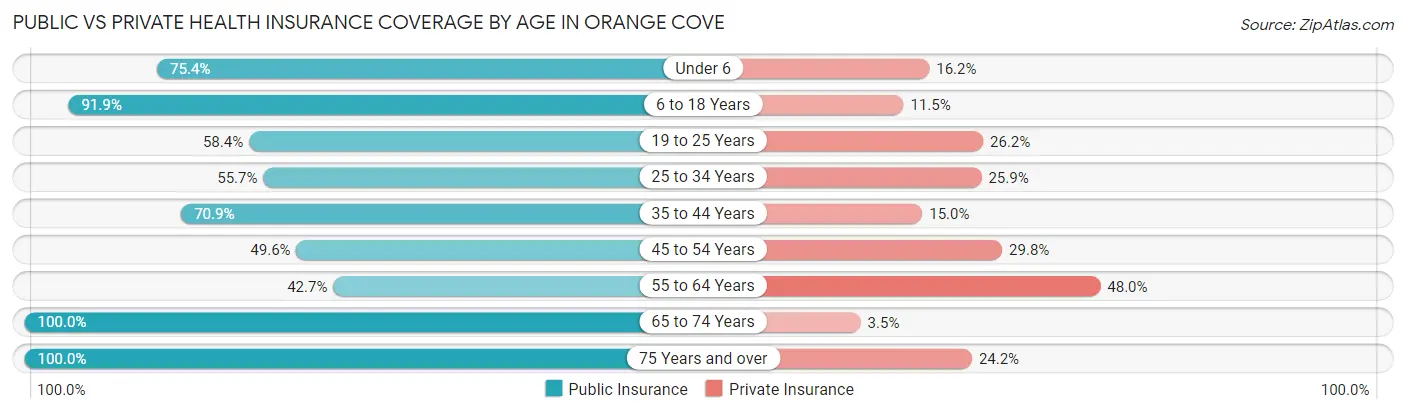
| Age Bracket | Public Insurance | Private Insurance |
| Under 6 | 729 (75.4%) | 157 (16.2%) |
| 6 to 18 Years | 2,694 (91.8%) | 336 (11.5%) |
| 19 to 25 Years | 643 (58.4%) | 289 (26.2%) |
| 25 to 34 Years | 567 (55.7%) | 264 (25.9%) |
| 35 to 44 Years | 868 (70.9%) | 183 (14.9%) |
| 45 to 54 Years | 501 (49.5%) | 301 (29.8%) |
| 55 to 64 Years | 340 (42.7%) | 382 (48.0%) |
| 65 to 74 Years | 257 (100.0%) | 9 (3.5%) |
| 75 Years and over | 327 (100.0%) | 79 (24.2%) |
| Total | 6,926 (71.9%) | 2,000 (20.8%) |
Disability Status by Sex by Age in Orange Cove
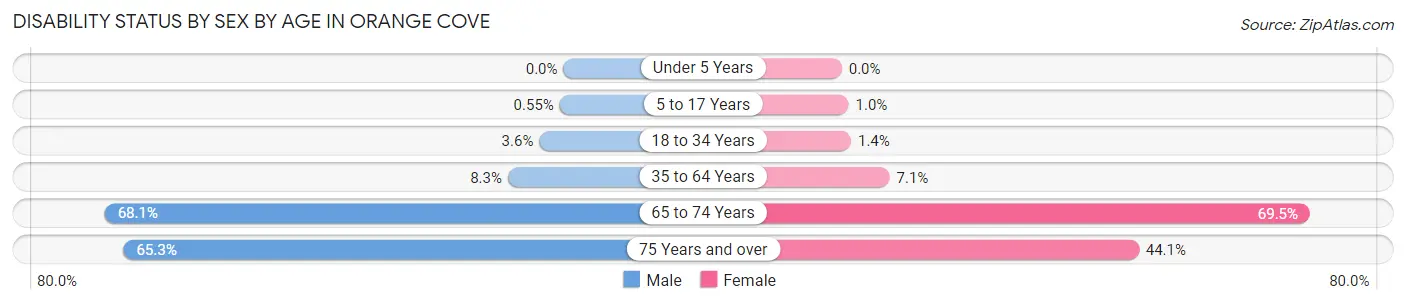
| Age Bracket | Male | Female |
| Under 5 Years | 0 (0.0%) | 0 (0.0%) |
| 5 to 17 Years | 9 (0.5%) | 12 (1.0%) |
| 18 to 34 Years | 46 (3.6%) | 15 (1.4%) |
| 35 to 64 Years | 120 (8.3%) | 112 (7.1%) |
| 65 to 74 Years | 79 (68.1%) | 98 (69.5%) |
| 75 Years and over | 64 (65.3%) | 101 (44.1%) |
Disability Class by Sex by Age in Orange Cove
Disability Class: Hearing Difficulty
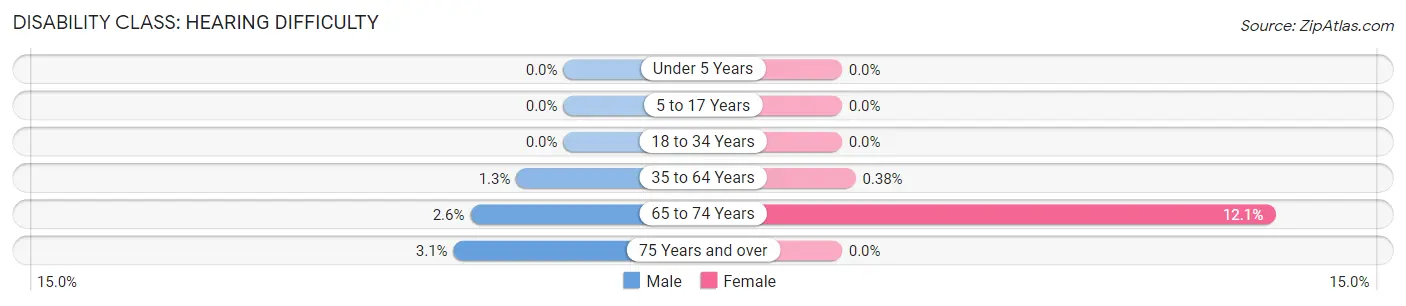
| Age Bracket | Male | Female |
| Under 5 Years | 0 (0.0%) | 0 (0.0%) |
| 5 to 17 Years | 0 (0.0%) | 0 (0.0%) |
| 18 to 34 Years | 0 (0.0%) | 0 (0.0%) |
| 35 to 64 Years | 19 (1.3%) | 6 (0.4%) |
| 65 to 74 Years | 3 (2.6%) | 17 (12.1%) |
| 75 Years and over | 3 (3.1%) | 0 (0.0%) |
Disability Class: Vision Difficulty
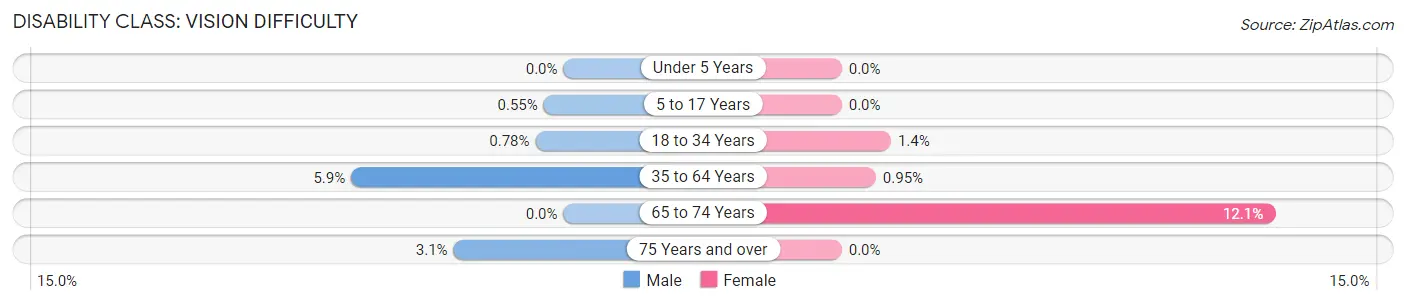
| Age Bracket | Male | Female |
| Under 5 Years | 0 (0.0%) | 0 (0.0%) |
| 5 to 17 Years | 9 (0.5%) | 0 (0.0%) |
| 18 to 34 Years | 10 (0.8%) | 15 (1.4%) |
| 35 to 64 Years | 86 (5.9%) | 15 (0.9%) |
| 65 to 74 Years | 0 (0.0%) | 17 (12.1%) |
| 75 Years and over | 3 (3.1%) | 0 (0.0%) |
Disability Class: Cognitive Difficulty
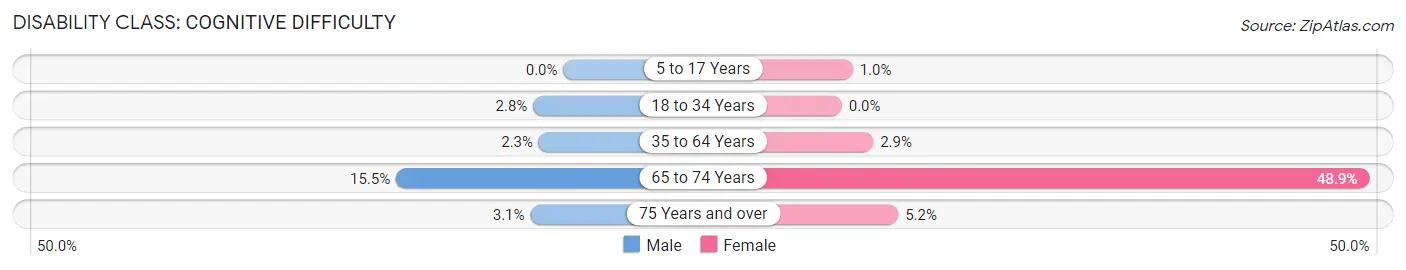
| Age Bracket | Male | Female |
| 5 to 17 Years | 0 (0.0%) | 12 (1.0%) |
| 18 to 34 Years | 36 (2.8%) | 0 (0.0%) |
| 35 to 64 Years | 33 (2.3%) | 46 (2.9%) |
| 65 to 74 Years | 18 (15.5%) | 69 (48.9%) |
| 75 Years and over | 3 (3.1%) | 12 (5.2%) |
Disability Class: Ambulatory Difficulty
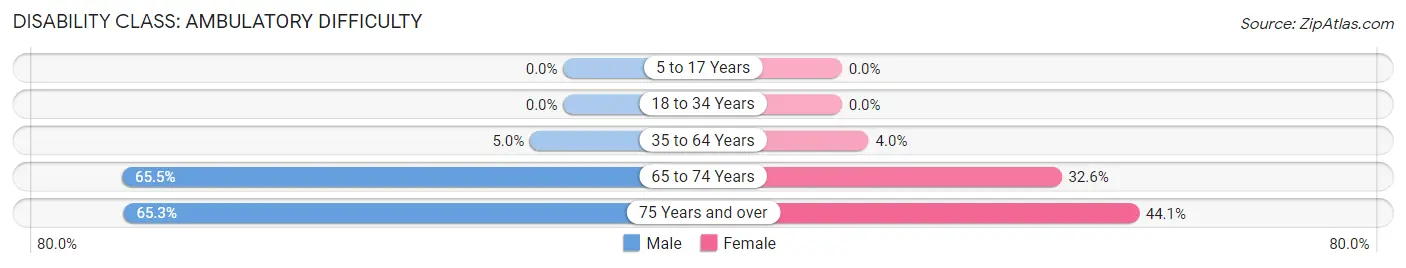
| Age Bracket | Male | Female |
| 5 to 17 Years | 0 (0.0%) | 0 (0.0%) |
| 18 to 34 Years | 0 (0.0%) | 0 (0.0%) |
| 35 to 64 Years | 72 (5.0%) | 63 (4.0%) |
| 65 to 74 Years | 76 (65.5%) | 46 (32.6%) |
| 75 Years and over | 64 (65.3%) | 101 (44.1%) |
Disability Class: Self-Care Difficulty
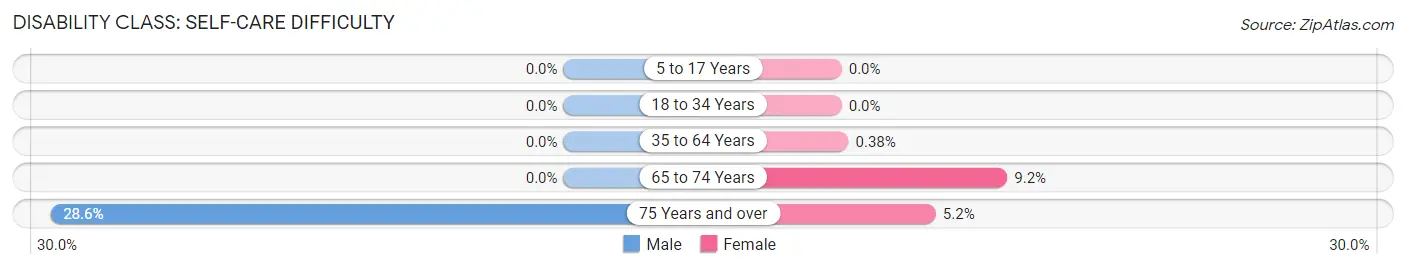
| Age Bracket | Male | Female |
| 5 to 17 Years | 0 (0.0%) | 0 (0.0%) |
| 18 to 34 Years | 0 (0.0%) | 0 (0.0%) |
| 35 to 64 Years | 0 (0.0%) | 6 (0.4%) |
| 65 to 74 Years | 0 (0.0%) | 13 (9.2%) |
| 75 Years and over | 28 (28.6%) | 12 (5.2%) |
Technology Access in Orange Cove
Computing Device Access in Orange Cove
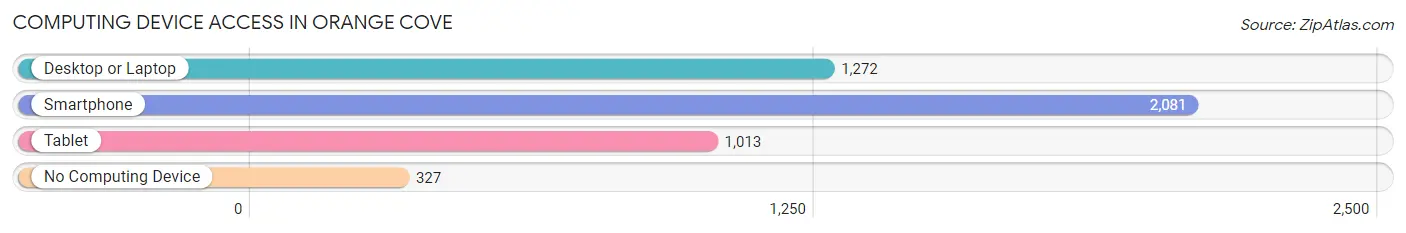
| Device Type | # Households | % Households |
| Desktop or Laptop | 1,272 | 51.7% |
| Smartphone | 2,081 | 84.6% |
| Tablet | 1,013 | 41.2% |
| No Computing Device | 327 | 13.3% |
| Total | 2,460 | 100.0% |
Internet Access in Orange Cove
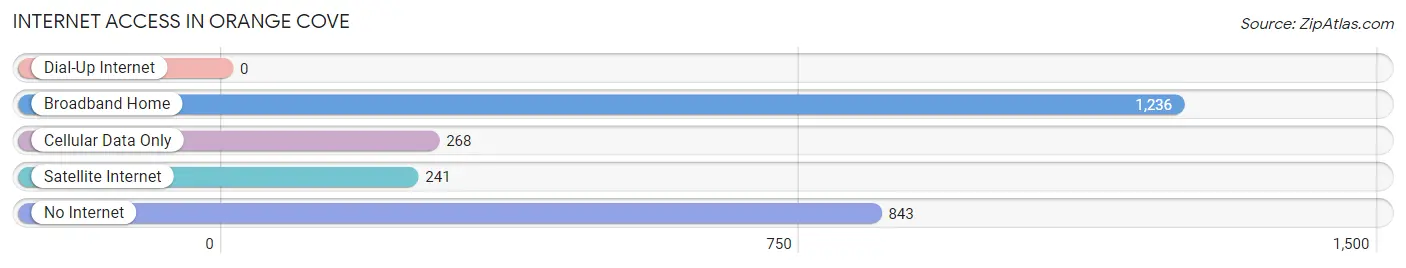
| Internet Type | # Households | % Households |
| Dial-Up Internet | 0 | 0.0% |
| Broadband Home | 1,236 | 50.2% |
| Cellular Data Only | 268 | 10.9% |
| Satellite Internet | 241 | 9.8% |
| No Internet | 843 | 34.3% |
| Total | 2,460 | 100.0% |
Orange Cove Summary
History
Orange Cove is a small city located in Fresno County, California. It is situated in the San Joaquin Valley, about 8 miles east of Fresno. The city was founded in 1891 by a group of settlers from the Midwest, who were looking for a place to settle and start a new life. The city was originally called Orangeville, but the name was changed to Orange Cove in 1895.
The city was originally an agricultural community, with the main crops being oranges, grapes, and other fruits. The city was also known for its dairy farms, which provided milk and other dairy products to the local population.
In the early 1900s, the city began to grow and develop. The first school was built in 1906, and the first library was established in 1908. The city also had its own post office, which opened in 1909.
In the 1920s, the city began to experience a population boom, as many people moved to the area to take advantage of the agricultural opportunities. The population grew from 1,000 in 1920 to over 5,000 by 1930.
During World War II, the city was home to a large number of military personnel, as the nearby air base was used as a training facility. After the war, the city continued to grow, and by the 1950s, the population had reached over 10,000.
In the 1960s, the city began to experience a decline in population, as many people moved away to find better job opportunities. The population dropped to around 8,000 by the 1970s.
In the 1980s, the city began to experience a resurgence, as new businesses and industries moved into the area. The population began to grow again, and by the 1990s, the population had reached over 10,000.
Today, Orange Cove is a small city with a population of around 11,000. The city is still primarily an agricultural community, with oranges, grapes, and other fruits being the main crops. The city also has a number of small businesses, including restaurants, retail stores, and other services.
Geography
Orange Cove is located in the San Joaquin Valley, about 8 miles east of Fresno. The city is situated on the banks of the Kings River, which flows through the city. The city is surrounded by rolling hills and farmland, and is located at an elevation of about 300 feet.
The climate in Orange Cove is generally mild, with temperatures ranging from the mid-50s in the winter to the mid-90s in the summer. The city receives an average of about 10 inches of rain per year.
Economy
Orange Cove is primarily an agricultural community, with oranges, grapes, and other fruits being the main crops. The city also has a number of small businesses, including restaurants, retail stores, and other services.
The city is home to a number of manufacturing companies, including a canning factory, a furniture factory, and a plastics factory. The city also has a number of small businesses, including restaurants, retail stores, and other services.
Demographics
As of the 2010 census, the population of Orange Cove was 11,076. The racial makeup of the city was 65.3% White, 1.3% African American, 0.7% Native American, 0.7% Asian, 0.1% Pacific Islander, 28.2% from other races, and 3.9% from two or more races. Hispanic or Latino of any race were 53.2% of the population.
The median household income in Orange Cove was $35,945, and the median family income was $41,945. The per capita income was $15,945. About 22.2% of families and 25.7% of the population were below the poverty line, including 33.3% of those under age 18 and 11.2% of those age 65 or over.
Common Questions
What is Per Capita Income in Orange Cove?
Per Capita income in Orange Cove is $12,306.
What is the Median Family Income in Orange Cove?
Median Family Income in Orange Cove is $33,691.
What is the Median Household income in Orange Cove?
Median Household Income in Orange Cove is $33,671.
What is Income or Wage Gap in Orange Cove?
Income or Wage Gap in Orange Cove is 30.7%.
Women in Orange Cove earn 69.3 cents for every dollar earned by a man.
What is Family Income Deficit in Orange Cove?
Family Income Deficit in Orange Cove is $10,644.
Families that are below poverty line in Orange Cove earn $10,644 less on average than the poverty threshold level.
What is Inequality or Gini Index in Orange Cove?
Inequality or Gini Index in Orange Cove is 0.43.
What is the Total Population of Orange Cove?
Total Population of Orange Cove is 9,635.
What is the Total Male Population of Orange Cove?
Total Male Population of Orange Cove is 4,979.
What is the Total Female Population of Orange Cove?
Total Female Population of Orange Cove is 4,656.
What is the Ratio of Males per 100 Females in Orange Cove?
There are 106.94 Males per 100 Females in Orange Cove.
What is the Ratio of Females per 100 Males in Orange Cove?
There are 93.51 Females per 100 Males in Orange Cove.
What is the Median Population Age in Orange Cove?
Median Population Age in Orange Cove is 24.4 Years.
What is the Average Family Size in Orange Cove
Average Family Size in Orange Cove is 4.2 People.
What is the Average Household Size in Orange Cove
Average Household Size in Orange Cove is 3.9 People.
How Large is the Labor Force in Orange Cove?
There are 3,803 People in the Labor Forcein in Orange Cove.
What is the Percentage of People in the Labor Force in Orange Cove?
59.5% of People are in the Labor Force in Orange Cove.
What is the Unemployment Rate in Orange Cove?
Unemployment Rate in Orange Cove is 13.7%.