Cities with the Highest Percentage of Population with a Degree in Physical and Health Sciences in Arizona
RELATED REPORTS & OPTIONS
Physical and Health Sciences
Arizona
Compare Cities
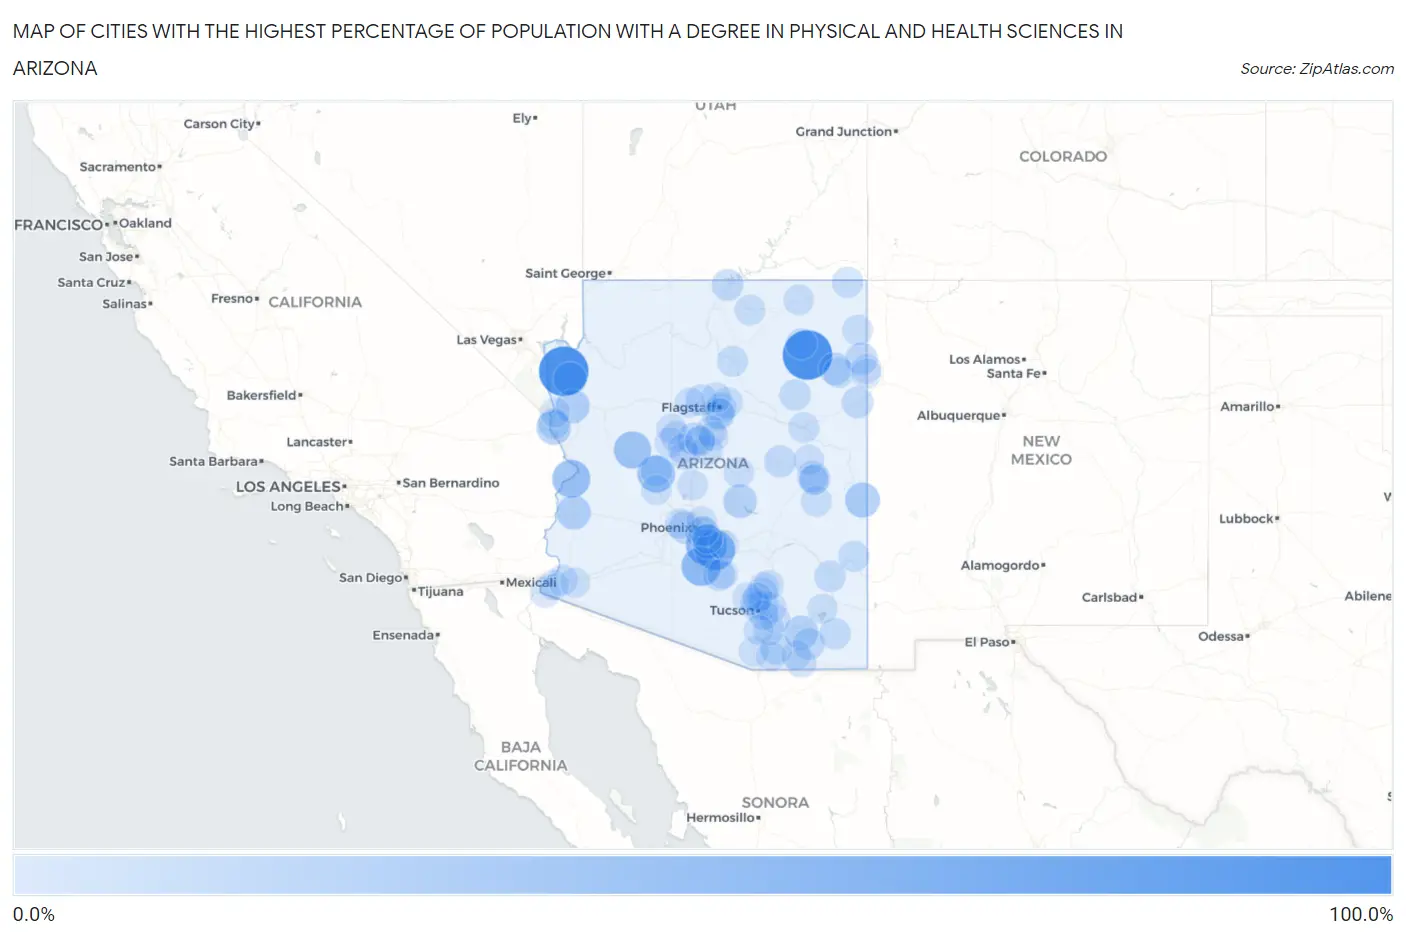
Map of Cities with the Highest Percentage of Population with a Degree in Physical and Health Sciences in Arizona
0.0%
100.0%
Cities with the Highest Percentage of Population with a Degree in Physical and Health Sciences in Arizona
| City | % Graduates | vs State | vs National | |
| 1. | Low Mountain | 100.0% | 2.9%(+97.1)#1 | 3.1%(+96.9)#4 |
| 2. | White Hills | 100.0% | 2.9%(+97.1)#2 | 3.1%(+96.9)#10 |
| 3. | Goodyear Village | 54.5% | 2.9%(+51.7)#3 | 3.1%(+51.4)#65 |
| 4. | Upper Santan Village | 53.1% | 2.9%(+50.2)#4 | 3.1%(+50.0)#70 |
| 5. | Stanfield | 47.8% | 2.9%(+44.9)#5 | 3.1%(+44.7)#107 |
| 6. | Bluewater | 41.2% | 2.9%(+38.3)#6 | 3.1%(+38.1)#129 |
| 7. | Yarnell | 39.1% | 2.9%(+36.2)#7 | 3.1%(+36.0)#149 |
| 8. | Bagdad | 37.5% | 2.9%(+34.6)#8 | 3.1%(+34.4)#166 |
| 9. | Alpine | 26.5% | 2.9%(+23.6)#9 | 3.1%(+23.4)#335 |
| 10. | Mohave Valley | 23.7% | 2.9%(+20.8)#10 | 3.1%(+20.6)#416 |
| 11. | Quartzsite | 22.5% | 2.9%(+19.6)#11 | 3.1%(+19.4)#453 |
| 12. | Golden Valley | 22.1% | 2.9%(+19.2)#12 | 3.1%(+19.0)#469 |
| 13. | St David | 21.6% | 2.9%(+18.7)#13 | 3.1%(+18.5)#484 |
| 14. | Tonto Basin | 19.6% | 2.9%(+16.8)#14 | 3.1%(+16.5)#566 |
| 15. | Dolan Springs | 17.2% | 2.9%(+14.3)#15 | 3.1%(+14.1)#690 |
| 16. | Tolleson | 15.0% | 2.9%(+12.2)#16 | 3.1%(+11.9)#865 |
| 17. | Burnside | 14.3% | 2.9%(+11.4)#17 | 3.1%(+11.2)#950 |
| 18. | Sawmill | 13.3% | 2.9%(+10.5)#18 | 3.1%(+10.2)#1,051 |
| 19. | Jerome | 12.4% | 2.9%(+9.48)#19 | 3.1%(+9.26)#1,178 |
| 20. | Guadalupe | 11.7% | 2.9%(+8.84)#20 | 3.1%(+8.62)#1,263 |
| 21. | Heber Overgaard | 11.3% | 2.9%(+8.44)#21 | 3.1%(+8.22)#1,323 |
| 22. | Tombstone | 10.9% | 2.9%(+8.01)#22 | 3.1%(+7.78)#1,393 |
| 23. | Page | 10.5% | 2.9%(+7.65)#23 | 3.1%(+7.43)#1,459 |
| 24. | Houck | 10.3% | 2.9%(+7.47)#24 | 3.1%(+7.25)#1,508 |
| 25. | Sonoita | 10.3% | 2.9%(+7.45)#25 | 3.1%(+7.23)#1,519 |
| 26. | Kachina Village | 10.3% | 2.9%(+7.43)#26 | 3.1%(+7.21)#1,525 |
| 27. | Arizona City | 10.3% | 2.9%(+7.39)#27 | 3.1%(+7.17)#1,538 |
| 28. | Parks | 10.3% | 2.9%(+7.38)#28 | 3.1%(+7.16)#1,540 |
| 29. | Swift Trail Junction | 9.6% | 2.9%(+6.69)#29 | 3.1%(+6.47)#1,707 |
| 30. | Dilkon | 9.2% | 2.9%(+6.35)#30 | 3.1%(+6.13)#1,808 |
| 31. | Sunizona | 9.1% | 2.9%(+6.21)#31 | 3.1%(+5.99)#1,857 |
| 32. | Pinon | 8.6% | 2.9%(+5.71)#32 | 3.1%(+5.49)#2,028 |
| 33. | Blue Ridge | 8.4% | 2.9%(+5.50)#33 | 3.1%(+5.27)#2,090 |
| 34. | Catalina | 8.2% | 2.9%(+5.34)#34 | 3.1%(+5.12)#2,145 |
| 35. | Red Mesa | 7.9% | 2.9%(+5.02)#35 | 3.1%(+4.80)#2,276 |
| 36. | Clifton | 7.8% | 2.9%(+4.94)#36 | 3.1%(+4.72)#2,313 |
| 37. | Cameron | 7.7% | 2.9%(+4.81)#37 | 3.1%(+4.59)#2,370 |
| 38. | Wagon Wheel | 7.4% | 2.9%(+4.54)#38 | 3.1%(+4.32)#2,514 |
| 39. | Corona De Tucson | 7.4% | 2.9%(+4.47)#39 | 3.1%(+4.25)#2,550 |
| 40. | Ganado | 7.2% | 2.9%(+4.31)#40 | 3.1%(+4.09)#2,659 |
| 41. | Doney Park | 7.2% | 2.9%(+4.27)#41 | 3.1%(+4.05)#2,671 |
| 42. | Peeples Valley | 7.1% | 2.9%(+4.26)#42 | 3.1%(+4.04)#2,687 |
| 43. | Mesquite Creek | 7.0% | 2.9%(+4.16)#43 | 3.1%(+3.94)#2,758 |
| 44. | Pinetop Lakeside | 6.9% | 2.9%(+4.03)#44 | 3.1%(+3.81)#2,828 |
| 45. | Holbrook | 6.9% | 2.9%(+4.02)#45 | 3.1%(+3.80)#2,834 |
| 46. | Whiteriver | 6.4% | 2.9%(+3.50)#46 | 3.1%(+3.28)#3,169 |
| 47. | Chino Valley | 6.4% | 2.9%(+3.48)#47 | 3.1%(+3.26)#3,184 |
| 48. | Kaibito | 6.3% | 2.9%(+3.45)#48 | 3.1%(+3.23)#3,204 |
| 49. | Camp Verde | 6.3% | 2.9%(+3.37)#49 | 3.1%(+3.15)#3,241 |
| 50. | Tsaile | 6.1% | 2.9%(+3.18)#50 | 3.1%(+2.96)#3,407 |
| 51. | Kayenta | 5.8% | 2.9%(+2.93)#51 | 3.1%(+2.71)#3,631 |
| 52. | Mountain View Ranches | 5.7% | 2.9%(+2.80)#52 | 3.1%(+2.58)#3,725 |
| 53. | Flagstaff | 5.5% | 2.9%(+2.65)#53 | 3.1%(+2.43)#3,872 |
| 54. | Fortuna Foothills | 5.4% | 2.9%(+2.54)#54 | 3.1%(+2.32)#3,980 |
| 55. | Tanque Verde | 5.4% | 2.9%(+2.48)#55 | 3.1%(+2.25)#4,053 |
| 56. | Payson | 5.3% | 2.9%(+2.41)#56 | 3.1%(+2.19)#4,109 |
| 57. | Saddlebrooke | 5.0% | 2.9%(+2.08)#57 | 3.1%(+1.86)#4,495 |
| 58. | Sierra Vista Southeast | 4.9% | 2.9%(+1.98)#58 | 3.1%(+1.76)#4,624 |
| 59. | Catalina Foothills | 4.9% | 2.9%(+1.97)#59 | 3.1%(+1.75)#4,647 |
| 60. | Mountainaire | 4.8% | 2.9%(+1.96)#60 | 3.1%(+1.74)#4,654 |
| 61. | Taylor | 4.8% | 2.9%(+1.90)#61 | 3.1%(+1.68)#4,721 |
| 62. | Fort Valley | 4.8% | 2.9%(+1.87)#62 | 3.1%(+1.65)#4,787 |
| 63. | Sedona | 4.7% | 2.9%(+1.77)#63 | 3.1%(+1.55)#4,898 |
| 64. | San Luis | 4.5% | 2.9%(+1.64)#64 | 3.1%(+1.42)#5,128 |
| 65. | Rincon Valley | 4.4% | 2.9%(+1.54)#65 | 3.1%(+1.32)#5,274 |
| 66. | Williamson | 4.4% | 2.9%(+1.53)#66 | 3.1%(+1.31)#5,299 |
| 67. | Verde Village | 4.4% | 2.9%(+1.50)#67 | 3.1%(+1.28)#5,339 |
| 68. | Lake Of The Woods | 4.3% | 2.9%(+1.45)#68 | 3.1%(+1.23)#5,428 |
| 69. | Dewey Humboldt | 4.3% | 2.9%(+1.41)#69 | 3.1%(+1.19)#5,479 |
| 70. | Litchfield Park | 4.2% | 2.9%(+1.37)#70 | 3.1%(+1.15)#5,554 |
| 71. | Eloy | 4.1% | 2.9%(+1.27)#71 | 3.1%(+1.04)#5,718 |
| 72. | Paulden | 4.1% | 2.9%(+1.25)#72 | 3.1%(+1.03)#5,751 |
| 73. | Willcox | 4.1% | 2.9%(+1.20)#73 | 3.1%(+0.982)#5,809 |
| 74. | Bellemont | 4.0% | 2.9%(+1.17)#74 | 3.1%(+0.948)#5,884 |
| 75. | Casas Adobes | 4.0% | 2.9%(+1.15)#75 | 3.1%(+0.931)#5,910 |
| 76. | Black Canyon City | 4.0% | 2.9%(+1.14)#76 | 3.1%(+0.920)#5,927 |
| 77. | Sun Lakes | 3.9% | 2.9%(+0.999)#77 | 3.1%(+0.778)#6,223 |
| 78. | Williams | 3.9% | 2.9%(+0.974)#78 | 3.1%(+0.753)#6,263 |
| 79. | Tubac | 3.8% | 2.9%(+0.894)#79 | 3.1%(+0.674)#6,431 |
| 80. | Flowing Wells | 3.7% | 2.9%(+0.827)#80 | 3.1%(+0.606)#6,554 |
| 81. | Tucson | 3.6% | 2.9%(+0.760)#81 | 3.1%(+0.539)#6,691 |
| 82. | Sahuarita | 3.6% | 2.9%(+0.755)#82 | 3.1%(+0.535)#6,719 |
| 83. | Paradise Valley | 3.6% | 2.9%(+0.740)#83 | 3.1%(+0.520)#6,741 |
| 84. | Window Rock | 3.6% | 2.9%(+0.692)#84 | 3.1%(+0.472)#6,842 |
| 85. | Patagonia | 3.5% | 2.9%(+0.624)#85 | 3.1%(+0.403)#7,020 |
| 86. | Oracle | 3.5% | 2.9%(+0.613)#86 | 3.1%(+0.393)#7,043 |
| 87. | Wickenburg | 3.4% | 2.9%(+0.542)#87 | 3.1%(+0.321)#7,219 |
| 88. | Prescott Valley | 3.4% | 2.9%(+0.521)#88 | 3.1%(+0.300)#7,265 |
| 89. | Wellton | 3.4% | 2.9%(+0.494)#89 | 3.1%(+0.273)#7,340 |
| 90. | Marana | 3.4% | 2.9%(+0.492)#90 | 3.1%(+0.271)#7,342 |
| 91. | Oro Valley | 3.4% | 2.9%(+0.477)#91 | 3.1%(+0.256)#7,377 |
| 92. | Yuma | 3.3% | 2.9%(+0.410)#92 | 3.1%(+0.189)#7,549 |
| 93. | Cottonwood | 3.3% | 2.9%(+0.383)#93 | 3.1%(+0.162)#7,611 |
| 94. | San Tan Valley | 3.2% | 2.9%(+0.353)#94 | 3.1%(+0.132)#7,680 |
| 95. | Bullhead City | 3.1% | 2.9%(+0.245)#95 | 3.1%(+0.025)#7,958 |
| 96. | Sierra Vista | 3.1% | 2.9%(+0.239)#96 | 3.1%(+0.019)#7,970 |
| 97. | Fort Defiance | 3.0% | 2.9%(+0.151)#97 | 3.1%(-0.069)#8,195 |
| 98. | Village Of Oak Creek Big Park | 3.0% | 2.9%(+0.139)#98 | 3.1%(-0.082)#8,251 |
| 99. | Tempe | 3.0% | 2.9%(+0.125)#99 | 3.1%(-0.095)#8,287 |
| 100. | Chandler | 3.0% | 2.9%(+0.109)#100 | 3.1%(-0.111)#8,337 |
Common Questions
What are the Top 10 Cities with the Highest Percentage of Population with a Degree in Physical and Health Sciences in Arizona?
Top 10 Cities with the Highest Percentage of Population with a Degree in Physical and Health Sciences in Arizona are:
#1
100.0%
#2
100.0%
#3
54.5%
#4
53.1%
#5
47.8%
#6
41.2%
#7
39.1%
#8
37.5%
#9
26.5%
#10
23.7%
What city has the Highest Percentage of Population with a Degree in Physical and Health Sciences in Arizona?
Low Mountain has the Highest Percentage of Population with a Degree in Physical and Health Sciences in Arizona with 100.0%.
What is the Percentage of Population with a Degree in Physical and Health Sciences in the State of Arizona?
Percentage of Population with a Degree in Physical and Health Sciences in Arizona is 2.9%.
What is the Percentage of Population with a Degree in Physical and Health Sciences in the United States?
Percentage of Population with a Degree in Physical and Health Sciences in the United States is 3.1%.