Cities with the Highest Percentage of Population with a Degree in Physical and Health Sciences in Utah
RELATED REPORTS & OPTIONS
Physical and Health Sciences
Utah
Compare Cities
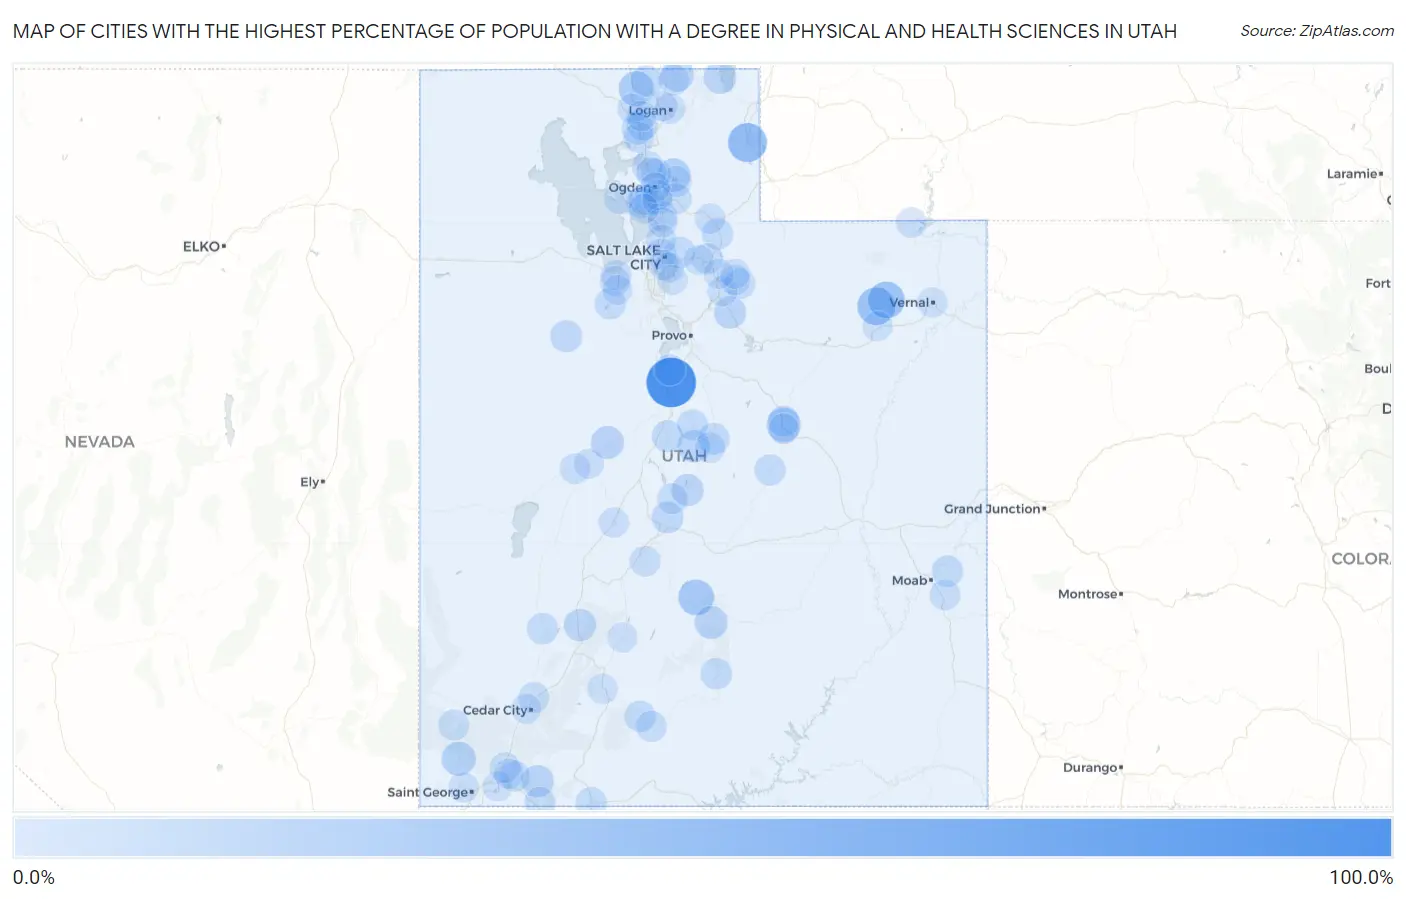
Map of Cities with the Highest Percentage of Population with a Degree in Physical and Health Sciences in Utah
0.0%
100.0%
Cities with the Highest Percentage of Population with a Degree in Physical and Health Sciences in Utah
| City | % Graduates | vs State | vs National | |
| 1. | Rocky Ridge | 100.0% | 2.8%(+97.2)#1 | 3.1%(+96.9)#2 |
| 2. | Woodruff | 45.7% | 2.8%(+42.9)#2 | 3.1%(+42.6)#114 |
| 3. | Neola | 38.9% | 2.8%(+36.1)#3 | 3.1%(+35.8)#153 |
| 4. | Whiterocks | 34.6% | 2.8%(+31.8)#4 | 3.1%(+31.5)#196 |
| 5. | Fremont | 29.4% | 2.8%(+26.6)#5 | 3.1%(+26.3)#273 |
| 6. | Plymouth | 26.0% | 2.8%(+23.2)#6 | 3.1%(+22.9)#341 |
| 7. | Carbonville | 22.5% | 2.8%(+19.7)#7 | 3.1%(+19.4)#454 |
| 8. | Veyo | 21.5% | 2.8%(+18.8)#8 | 3.1%(+18.4)#485 |
| 9. | Eden | 18.7% | 2.8%(+15.9)#9 | 3.1%(+15.6)#610 |
| 10. | Teasdale | 16.7% | 2.8%(+13.9)#10 | 3.1%(+13.6)#729 |
| 11. | Lynndyl | 16.7% | 2.8%(+13.9)#11 | 3.1%(+13.6)#739 |
| 12. | Sundance | 16.7% | 2.8%(+13.9)#12 | 3.1%(+13.6)#745 |
| 13. | Cove | 16.2% | 2.8%(+13.4)#13 | 3.1%(+13.1)#774 |
| 14. | Garden City | 14.9% | 2.8%(+12.1)#14 | 3.1%(+11.8)#887 |
| 15. | Wales | 13.8% | 2.8%(+11.0)#15 | 3.1%(+10.7)#1,008 |
| 16. | Springdale | 13.2% | 2.8%(+10.4)#16 | 3.1%(+10.1)#1,077 |
| 17. | Sterling | 13.2% | 2.8%(+10.4)#17 | 3.1%(+10.1)#1,081 |
| 18. | Beaver | 12.9% | 2.8%(+10.2)#18 | 3.1%(+9.84)#1,111 |
| 19. | Independence | 12.9% | 2.8%(+10.1)#19 | 3.1%(+9.80)#1,118 |
| 20. | Dugway | 11.5% | 2.8%(+8.71)#20 | 3.1%(+8.39)#1,295 |
| 21. | Redmond | 10.7% | 2.8%(+7.89)#21 | 3.1%(+7.57)#1,433 |
| 22. | Levan | 9.8% | 2.8%(+6.98)#22 | 3.1%(+6.66)#1,660 |
| 23. | Boulder | 9.7% | 2.8%(+6.90)#23 | 3.1%(+6.58)#1,679 |
| 24. | Bear River City | 9.6% | 2.8%(+6.87)#24 | 3.1%(+6.55)#1,688 |
| 25. | Clarkston | 9.6% | 2.8%(+6.87)#25 | 3.1%(+6.55)#1,689 |
| 26. | Castle Valley | 9.3% | 2.8%(+6.51)#26 | 3.1%(+6.19)#1,792 |
| 27. | Mount Pleasant | 9.3% | 2.8%(+6.50)#27 | 3.1%(+6.17)#1,795 |
| 28. | Minersville | 8.4% | 2.8%(+5.66)#28 | 3.1%(+5.33)#2,076 |
| 29. | Coalville | 8.1% | 2.8%(+5.36)#29 | 3.1%(+5.03)#2,175 |
| 30. | Honeyville | 8.1% | 2.8%(+5.34)#30 | 3.1%(+5.02)#2,180 |
| 31. | Stockton | 8.1% | 2.8%(+5.33)#31 | 3.1%(+5.01)#2,185 |
| 32. | Tropic | 7.8% | 2.8%(+5.03)#32 | 3.1%(+4.71)#2,320 |
| 33. | Silver Summit | 7.8% | 2.8%(+4.98)#33 | 3.1%(+4.66)#2,341 |
| 34. | Emigration Canyon | 7.6% | 2.8%(+4.83)#34 | 3.1%(+4.51)#2,422 |
| 35. | West Point | 7.4% | 2.8%(+4.63)#35 | 3.1%(+4.31)#2,515 |
| 36. | Spring Glen | 7.3% | 2.8%(+4.56)#36 | 3.1%(+4.24)#2,560 |
| 37. | Kanab | 7.3% | 2.8%(+4.50)#37 | 3.1%(+4.18)#2,599 |
| 38. | Huntington | 7.2% | 2.8%(+4.46)#38 | 3.1%(+4.14)#2,630 |
| 39. | Genola | 7.2% | 2.8%(+4.43)#39 | 3.1%(+4.11)#2,644 |
| 40. | Fountain Green | 7.1% | 2.8%(+4.33)#40 | 3.1%(+4.01)#2,718 |
| 41. | Henrieville | 6.9% | 2.8%(+4.12)#41 | 3.1%(+3.80)#2,844 |
| 42. | South Willard | 6.8% | 2.8%(+4.05)#42 | 3.1%(+3.72)#2,895 |
| 43. | Hildale | 6.8% | 2.8%(+4.00)#43 | 3.1%(+3.68)#2,920 |
| 44. | White | 6.5% | 2.8%(+3.75)#44 | 3.1%(+3.43)#3,061 |
| 45. | Enterprise | 6.5% | 2.8%(+3.70)#45 | 3.1%(+3.38)#3,099 |
| 46. | Enoch | 6.4% | 2.8%(+3.64)#46 | 3.1%(+3.32)#3,146 |
| 47. | Woodland | 6.4% | 2.8%(+3.62)#47 | 3.1%(+3.30)#3,158 |
| 48. | Sunset | 6.2% | 2.8%(+3.47)#48 | 3.1%(+3.15)#3,242 |
| 49. | Centerfield | 6.2% | 2.8%(+3.43)#49 | 3.1%(+3.11)#3,302 |
| 50. | Corinne | 6.1% | 2.8%(+3.34)#50 | 3.1%(+3.02)#3,366 |
| 51. | Huntsville | 6.0% | 2.8%(+3.26)#51 | 3.1%(+2.93)#3,436 |
| 52. | Spanish Valley | 5.7% | 2.8%(+2.90)#52 | 3.1%(+2.58)#3,726 |
| 53. | Virgin | 5.6% | 2.8%(+2.78)#53 | 3.1%(+2.46)#3,835 |
| 54. | Mountain Green | 5.5% | 2.8%(+2.76)#54 | 3.1%(+2.43)#3,865 |
| 55. | Annabella | 5.5% | 2.8%(+2.73)#55 | 3.1%(+2.41)#3,882 |
| 56. | Richmond | 5.3% | 2.8%(+2.56)#56 | 3.1%(+2.24)#4,068 |
| 57. | Hinckley | 5.3% | 2.8%(+2.49)#57 | 3.1%(+2.16)#4,145 |
| 58. | Henefer | 5.2% | 2.8%(+2.38)#58 | 3.1%(+2.06)#4,263 |
| 59. | Stansbury Park | 4.6% | 2.8%(+1.83)#59 | 3.1%(+1.51)#4,964 |
| 60. | North Ogden | 4.6% | 2.8%(+1.83)#60 | 3.1%(+1.51)#4,966 |
| 61. | West Wood | 4.6% | 2.8%(+1.79)#61 | 3.1%(+1.47)#5,031 |
| 62. | Clinton | 4.5% | 2.8%(+1.73)#62 | 3.1%(+1.41)#5,135 |
| 63. | Fruit Heights | 4.5% | 2.8%(+1.73)#63 | 3.1%(+1.41)#5,140 |
| 64. | Salt Lake City | 4.5% | 2.8%(+1.71)#64 | 3.1%(+1.39)#5,172 |
| 65. | Woods Cross | 4.4% | 2.8%(+1.65)#65 | 3.1%(+1.33)#5,259 |
| 66. | Spring City | 4.4% | 2.8%(+1.59)#66 | 3.1%(+1.26)#5,363 |
| 67. | Garland | 4.2% | 2.8%(+1.45)#67 | 3.1%(+1.13)#5,579 |
| 68. | Francis | 4.2% | 2.8%(+1.39)#68 | 3.1%(+1.07)#5,670 |
| 69. | Pleasant View | 4.1% | 2.8%(+1.31)#69 | 3.1%(+0.985)#5,806 |
| 70. | Manila | 4.1% | 2.8%(+1.30)#70 | 3.1%(+0.982)#5,817 |
| 71. | East Basin | 4.1% | 2.8%(+1.28)#71 | 3.1%(+0.961)#5,857 |
| 72. | South Ogden | 4.1% | 2.8%(+1.28)#72 | 3.1%(+0.955)#5,866 |
| 73. | Toquerville | 4.1% | 2.8%(+1.27)#73 | 3.1%(+0.951)#5,883 |
| 74. | Erda | 4.0% | 2.8%(+1.25)#74 | 3.1%(+0.925)#5,915 |
| 75. | Logan | 4.0% | 2.8%(+1.22)#75 | 3.1%(+0.901)#5,958 |
| 76. | South Salt Lake | 4.0% | 2.8%(+1.22)#76 | 3.1%(+0.894)#5,992 |
| 77. | Fillmore | 4.0% | 2.8%(+1.21)#77 | 3.1%(+0.889)#6,001 |
| 78. | Hurricane | 3.8% | 2.8%(+0.984)#78 | 3.1%(+0.662)#6,459 |
| 79. | South Weber | 3.7% | 2.8%(+0.937)#79 | 3.1%(+0.615)#6,540 |
| 80. | Farmington | 3.7% | 2.8%(+0.919)#80 | 3.1%(+0.597)#6,594 |
| 81. | Vernal | 3.7% | 2.8%(+0.902)#81 | 3.1%(+0.580)#6,623 |
| 82. | Millcreek | 3.6% | 2.8%(+0.832)#82 | 3.1%(+0.510)#6,766 |
| 83. | Santa Clara | 3.5% | 2.8%(+0.743)#83 | 3.1%(+0.421)#6,980 |
| 84. | Heber | 3.5% | 2.8%(+0.736)#84 | 3.1%(+0.414)#6,995 |
| 85. | Benson | 3.4% | 2.8%(+0.655)#85 | 3.1%(+0.333)#7,190 |
| 86. | Hooper | 3.4% | 2.8%(+0.651)#86 | 3.1%(+0.329)#7,203 |
| 87. | Summit Park | 3.4% | 2.8%(+0.625)#87 | 3.1%(+0.303)#7,259 |
| 88. | Panguitch | 3.4% | 2.8%(+0.612)#88 | 3.1%(+0.290)#7,291 |
| 89. | Delta | 3.4% | 2.8%(+0.606)#89 | 3.1%(+0.284)#7,310 |
| 90. | Circleville | 3.4% | 2.8%(+0.593)#90 | 3.1%(+0.271)#7,346 |
| 91. | Kamas | 3.3% | 2.8%(+0.539)#91 | 3.1%(+0.217)#7,487 |
| 92. | Cottonwood Heights | 3.3% | 2.8%(+0.530)#92 | 3.1%(+0.208)#7,503 |
| 93. | La Verkin | 3.3% | 2.8%(+0.495)#93 | 3.1%(+0.173)#7,589 |
| 94. | Ogden | 3.3% | 2.8%(+0.476)#94 | 3.1%(+0.154)#7,632 |
| 95. | Roosevelt | 3.2% | 2.8%(+0.448)#95 | 3.1%(+0.126)#7,690 |
| 96. | Tooele | 3.2% | 2.8%(+0.409)#96 | 3.1%(+0.086)#7,796 |
| 97. | Deweyville | 3.2% | 2.8%(+0.397)#97 | 3.1%(+0.075)#7,833 |
| 98. | Syracuse | 3.1% | 2.8%(+0.364)#98 | 3.1%(+0.042)#7,914 |
| 99. | Cedar City | 3.1% | 2.8%(+0.289)#99 | 3.1%(-0.033)#8,110 |
| 100. | Hideout | 3.1% | 2.8%(+0.284)#100 | 3.1%(-0.038)#8,128 |
Common Questions
What are the Top 10 Cities with the Highest Percentage of Population with a Degree in Physical and Health Sciences in Utah?
Top 10 Cities with the Highest Percentage of Population with a Degree in Physical and Health Sciences in Utah are:
#1
100.0%
#2
45.7%
#3
38.9%
#4
34.6%
#5
29.4%
#6
26.0%
#7
22.5%
#8
21.5%
#9
18.7%
#10
16.7%
What city has the Highest Percentage of Population with a Degree in Physical and Health Sciences in Utah?
Rocky Ridge has the Highest Percentage of Population with a Degree in Physical and Health Sciences in Utah with 100.0%.
What is the Percentage of Population with a Degree in Physical and Health Sciences in the State of Utah?
Percentage of Population with a Degree in Physical and Health Sciences in Utah is 2.8%.
What is the Percentage of Population with a Degree in Physical and Health Sciences in the United States?
Percentage of Population with a Degree in Physical and Health Sciences in the United States is 3.1%.