Cities with the Highest Percentage of Population with a Degree in Physical and Health Sciences in West Virginia
RELATED REPORTS & OPTIONS
Physical and Health Sciences
West Virginia
Compare Cities
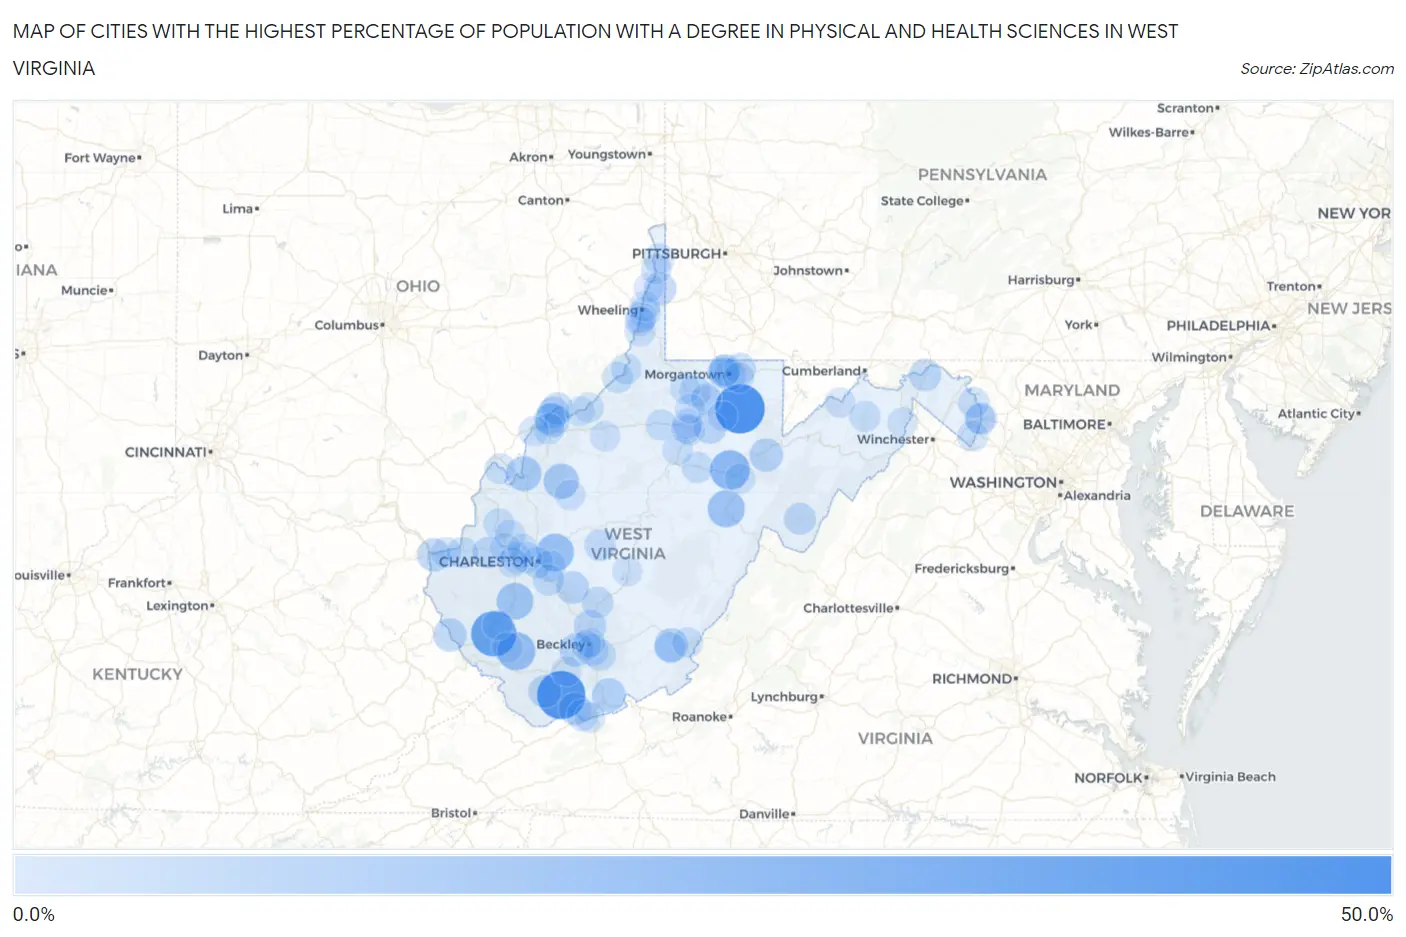
Map of Cities with the Highest Percentage of Population with a Degree in Physical and Health Sciences in West Virginia
0.0%
50.0%
Cities with the Highest Percentage of Population with a Degree in Physical and Health Sciences in West Virginia
| City | % Graduates | vs State | vs National | |
| 1. | Newburg | 50.0% | 3.3%(+46.7)#1 | 3.1%(+46.9)#87 |
| 2. | Northfork | 46.7% | 3.3%(+43.4)#2 | 3.1%(+43.6)#110 |
| 3. | Mount Gay Shamrock | 39.0% | 3.3%(+35.8)#3 | 3.1%(+35.9)#151 |
| 4. | Junior | 25.0% | 3.3%(+21.7)#4 | 3.1%(+21.9)#367 |
| 5. | Mallory | 21.4% | 3.3%(+18.2)#5 | 3.1%(+18.3)#488 |
| 6. | Pinch | 20.0% | 3.3%(+16.8)#6 | 3.1%(+16.9)#530 |
| 7. | Huttonsville | 18.8% | 3.3%(+15.5)#7 | 3.1%(+15.7)#608 |
| 8. | Danville | 17.6% | 3.3%(+14.4)#8 | 3.1%(+14.5)#659 |
| 9. | Reedy | 14.3% | 3.3%(+11.0)#9 | 3.1%(+11.2)#960 |
| 10. | Ravenswood | 14.1% | 3.3%(+10.9)#10 | 3.1%(+11.0)#981 |
| 11. | Dupont | 11.4% | 3.3%(+8.17)#11 | 3.1%(+8.33)#1,305 |
| 12. | North Hills | 11.0% | 3.3%(+7.72)#12 | 3.1%(+7.88)#1,377 |
| 13. | Athens | 10.7% | 3.3%(+7.46)#13 | 3.1%(+7.63)#1,419 |
| 14. | Fairlea | 10.2% | 3.3%(+6.97)#14 | 3.1%(+7.14)#1,552 |
| 15. | Lester | 10.0% | 3.3%(+6.74)#15 | 3.1%(+6.90)#1,599 |
| 16. | Hendricks | 9.7% | 3.3%(+6.41)#16 | 3.1%(+6.58)#1,680 |
| 17. | Kermit | 9.5% | 3.3%(+6.26)#17 | 3.1%(+6.42)#1,726 |
| 18. | Ceredo | 9.4% | 3.3%(+6.16)#18 | 3.1%(+6.32)#1,746 |
| 19. | Welch | 8.6% | 3.3%(+5.30)#19 | 3.1%(+5.46)#2,039 |
| 20. | Montgomery | 8.1% | 3.3%(+4.86)#20 | 3.1%(+5.02)#2,179 |
| 21. | Flemington | 8.0% | 3.3%(+4.74)#21 | 3.1%(+4.90)#2,246 |
| 22. | Bethany | 7.8% | 3.3%(+4.54)#22 | 3.1%(+4.70)#2,326 |
| 23. | Mount Hope | 7.7% | 3.3%(+4.48)#23 | 3.1%(+4.65)#2,348 |
| 24. | Bath Berkeley Springs | 7.3% | 3.3%(+4.02)#24 | 3.1%(+4.19)#2,595 |
| 25. | Bramwell | 7.1% | 3.3%(+3.88)#25 | 3.1%(+4.04)#2,700 |
| 26. | Arthurdale | 7.1% | 3.3%(+3.80)#26 | 3.1%(+3.96)#2,750 |
| 27. | Granville | 6.9% | 3.3%(+3.61)#27 | 3.1%(+3.78)#2,857 |
| 28. | Culloden | 6.8% | 3.3%(+3.54)#28 | 3.1%(+3.70)#2,909 |
| 29. | Williamstown | 6.8% | 3.3%(+3.52)#29 | 3.1%(+3.68)#2,918 |
| 30. | Boaz | 6.3% | 3.3%(+3.08)#30 | 3.1%(+3.24)#3,193 |
| 31. | Franklin | 6.3% | 3.3%(+3.04)#31 | 3.1%(+3.20)#3,220 |
| 32. | Harpers Ferry | 6.2% | 3.3%(+2.91)#32 | 3.1%(+3.07)#3,333 |
| 33. | Coal Fork | 5.6% | 3.3%(+2.38)#33 | 3.1%(+2.55)#3,758 |
| 34. | Morgantown | 5.6% | 3.3%(+2.37)#34 | 3.1%(+2.54)#3,766 |
| 35. | Fayetteville | 5.6% | 3.3%(+2.35)#35 | 3.1%(+2.51)#3,788 |
| 36. | Beaver | 5.6% | 3.3%(+2.32)#36 | 3.1%(+2.49)#3,806 |
| 37. | Shady Spring | 5.4% | 3.3%(+2.17)#37 | 3.1%(+2.33)#3,971 |
| 38. | Clay | 5.4% | 3.3%(+2.14)#38 | 3.1%(+2.31)#3,993 |
| 39. | Brush Fork | 5.3% | 3.3%(+2.09)#39 | 3.1%(+2.25)#4,056 |
| 40. | Star City | 5.3% | 3.3%(+2.06)#40 | 3.1%(+2.23)#4,080 |
| 41. | Cheat Lake | 5.3% | 3.3%(+2.05)#41 | 3.1%(+2.21)#4,094 |
| 42. | Vienna | 5.3% | 3.3%(+2.04)#42 | 3.1%(+2.20)#4,098 |
| 43. | Barboursville | 5.2% | 3.3%(+1.96)#43 | 3.1%(+2.13)#4,198 |
| 44. | Farmington | 5.1% | 3.3%(+1.87)#44 | 3.1%(+2.03)#4,316 |
| 45. | Dunbar | 5.0% | 3.3%(+1.74)#45 | 3.1%(+1.90)#4,443 |
| 46. | Charleston | 4.9% | 3.3%(+1.65)#46 | 3.1%(+1.81)#4,558 |
| 47. | Chesapeake | 4.8% | 3.3%(+1.55)#47 | 3.1%(+1.71)#4,694 |
| 48. | Buckhannon | 4.6% | 3.3%(+1.33)#48 | 3.1%(+1.49)#5,004 |
| 49. | Salem | 4.6% | 3.3%(+1.32)#49 | 3.1%(+1.48)#5,017 |
| 50. | Bethlehem | 4.3% | 3.3%(+1.03)#50 | 3.1%(+1.19)#5,483 |
| 51. | Buffalo | 4.3% | 3.3%(+1.01)#51 | 3.1%(+1.17)#5,510 |
| 52. | St Albans | 4.2% | 3.3%(+0.920)#52 | 3.1%(+1.08)#5,635 |
| 53. | Romney | 4.2% | 3.3%(+0.920)#53 | 3.1%(+1.08)#5,638 |
| 54. | Paden City | 4.1% | 3.3%(+0.851)#54 | 3.1%(+1.01)#5,771 |
| 55. | Parkersburg | 4.1% | 3.3%(+0.790)#55 | 3.1%(+0.953)#5,882 |
| 56. | Shepherdstown | 4.0% | 3.3%(+0.775)#56 | 3.1%(+0.938)#5,902 |
| 57. | Ronceverte | 3.9% | 3.3%(+0.602)#57 | 3.1%(+0.765)#6,245 |
| 58. | New Martinsville | 3.8% | 3.3%(+0.514)#58 | 3.1%(+0.677)#6,426 |
| 59. | Shannondale | 3.7% | 3.3%(+0.435)#59 | 3.1%(+0.598)#6,591 |
| 60. | Huntington | 3.7% | 3.3%(+0.420)#60 | 3.1%(+0.583)#6,619 |
| 61. | Man | 3.5% | 3.3%(+0.234)#61 | 3.1%(+0.397)#7,036 |
| 62. | New Haven | 3.4% | 3.3%(+0.142)#62 | 3.1%(+0.305)#7,256 |
| 63. | Winfield | 3.4% | 3.3%(+0.118)#63 | 3.1%(+0.281)#7,318 |
| 64. | Moundsville | 3.3% | 3.3%(+0.087)#64 | 3.1%(+0.250)#7,388 |
| 65. | Westover | 3.3% | 3.3%(+0.058)#65 | 3.1%(+0.221)#7,475 |
| 66. | White Sulphur Springs | 3.3% | 3.3%(+0.043)#66 | 3.1%(+0.206)#7,507 |
| 67. | Stonewood | 3.2% | 3.3%(-0.053)#67 | 3.1%(+0.110)#7,748 |
| 68. | Benwood | 3.2% | 3.3%(-0.071)#68 | 3.1%(+0.092)#7,787 |
| 69. | Brookhaven | 3.2% | 3.3%(-0.083)#69 | 3.1%(+0.080)#7,815 |
| 70. | Pleasant Valley | 3.1% | 3.3%(-0.169)#70 | 3.1%(-0.006)#8,031 |
| 71. | Jane Lew | 3.0% | 3.3%(-0.232)#71 | 3.1%(-0.069)#8,206 |
| 72. | Weirton | 3.0% | 3.3%(-0.261)#72 | 3.1%(-0.098)#8,291 |
| 73. | Harrisville | 2.9% | 3.3%(-0.356)#73 | 3.1%(-0.193)#8,567 |
| 74. | Spencer | 2.9% | 3.3%(-0.364)#74 | 3.1%(-0.201)#8,584 |
| 75. | Wheeling | 2.9% | 3.3%(-0.381)#75 | 3.1%(-0.218)#8,626 |
| 76. | Bolivar | 2.9% | 3.3%(-0.398)#76 | 3.1%(-0.235)#8,671 |
| 77. | Clarksburg | 2.9% | 3.3%(-0.401)#77 | 3.1%(-0.239)#8,684 |
| 78. | Beckley | 2.9% | 3.3%(-0.402)#78 | 3.1%(-0.239)#8,685 |
| 79. | Keyser | 2.9% | 3.3%(-0.411)#79 | 3.1%(-0.249)#8,727 |
| 80. | Bluefield | 2.8% | 3.3%(-0.460)#80 | 3.1%(-0.297)#8,872 |
| 81. | Capon Bridge | 2.8% | 3.3%(-0.485)#81 | 3.1%(-0.322)#8,964 |
| 82. | Nutter Fort | 2.7% | 3.3%(-0.517)#82 | 3.1%(-0.355)#9,058 |
| 83. | Tornado | 2.7% | 3.3%(-0.545)#83 | 3.1%(-0.382)#9,148 |
| 84. | Mcmechen | 2.7% | 3.3%(-0.608)#84 | 3.1%(-0.445)#9,342 |
| 85. | St Marys | 2.5% | 3.3%(-0.754)#85 | 3.1%(-0.591)#9,779 |
| 86. | Follansbee | 2.5% | 3.3%(-0.755)#86 | 3.1%(-0.592)#9,786 |
| 87. | Elkins | 2.4% | 3.3%(-0.841)#87 | 3.1%(-0.678)#10,025 |
| 88. | Washington | 2.4% | 3.3%(-0.882)#88 | 3.1%(-0.719)#10,147 |
| 89. | Teays Valley | 2.1% | 3.3%(-1.12)#89 | 3.1%(-0.953)#10,855 |
| 90. | Cross Lanes | 2.1% | 3.3%(-1.17)#90 | 3.1%(-1.01)#11,005 |
| 91. | Fairmont | 2.1% | 3.3%(-1.20)#91 | 3.1%(-1.03)#11,084 |
| 92. | Mabscott | 2.0% | 3.3%(-1.21)#92 | 3.1%(-1.05)#11,130 |
| 93. | Mitchell Heights | 2.0% | 3.3%(-1.22)#93 | 3.1%(-1.06)#11,160 |
| 94. | Mannington | 2.0% | 3.3%(-1.24)#94 | 3.1%(-1.08)#11,207 |
| 95. | Mullens | 2.0% | 3.3%(-1.25)#95 | 3.1%(-1.09)#11,244 |
| 96. | Summersville | 2.0% | 3.3%(-1.30)#96 | 3.1%(-1.14)#11,418 |
| 97. | Beech Bottom | 1.9% | 3.3%(-1.34)#97 | 3.1%(-1.18)#11,524 |
| 98. | Belmont | 1.8% | 3.3%(-1.43)#98 | 3.1%(-1.26)#11,783 |
| 99. | Shinnston | 1.8% | 3.3%(-1.44)#99 | 3.1%(-1.28)#11,828 |
| 100. | Grafton | 1.8% | 3.3%(-1.50)#100 | 3.1%(-1.34)#11,999 |
Common Questions
What are the Top 10 Cities with the Highest Percentage of Population with a Degree in Physical and Health Sciences in West Virginia?
Top 10 Cities with the Highest Percentage of Population with a Degree in Physical and Health Sciences in West Virginia are:
#1
50.0%
#2
46.7%
#3
39.0%
#4
25.0%
#5
21.4%
#6
20.0%
#7
18.8%
#8
17.6%
#9
14.3%
#10
14.1%
What city has the Highest Percentage of Population with a Degree in Physical and Health Sciences in West Virginia?
Newburg has the Highest Percentage of Population with a Degree in Physical and Health Sciences in West Virginia with 50.0%.
What is the Percentage of Population with a Degree in Physical and Health Sciences in the State of West Virginia?
Percentage of Population with a Degree in Physical and Health Sciences in West Virginia is 3.3%.
What is the Percentage of Population with a Degree in Physical and Health Sciences in the United States?
Percentage of Population with a Degree in Physical and Health Sciences in the United States is 3.1%.