Zip Codes with the Highest Percentage of Population with a Degree in Physical and Health Sciences in Gardena, CA
RELATED REPORTS & OPTIONS
Physical and Health Sciences
Gardena
Compare Zip Codes
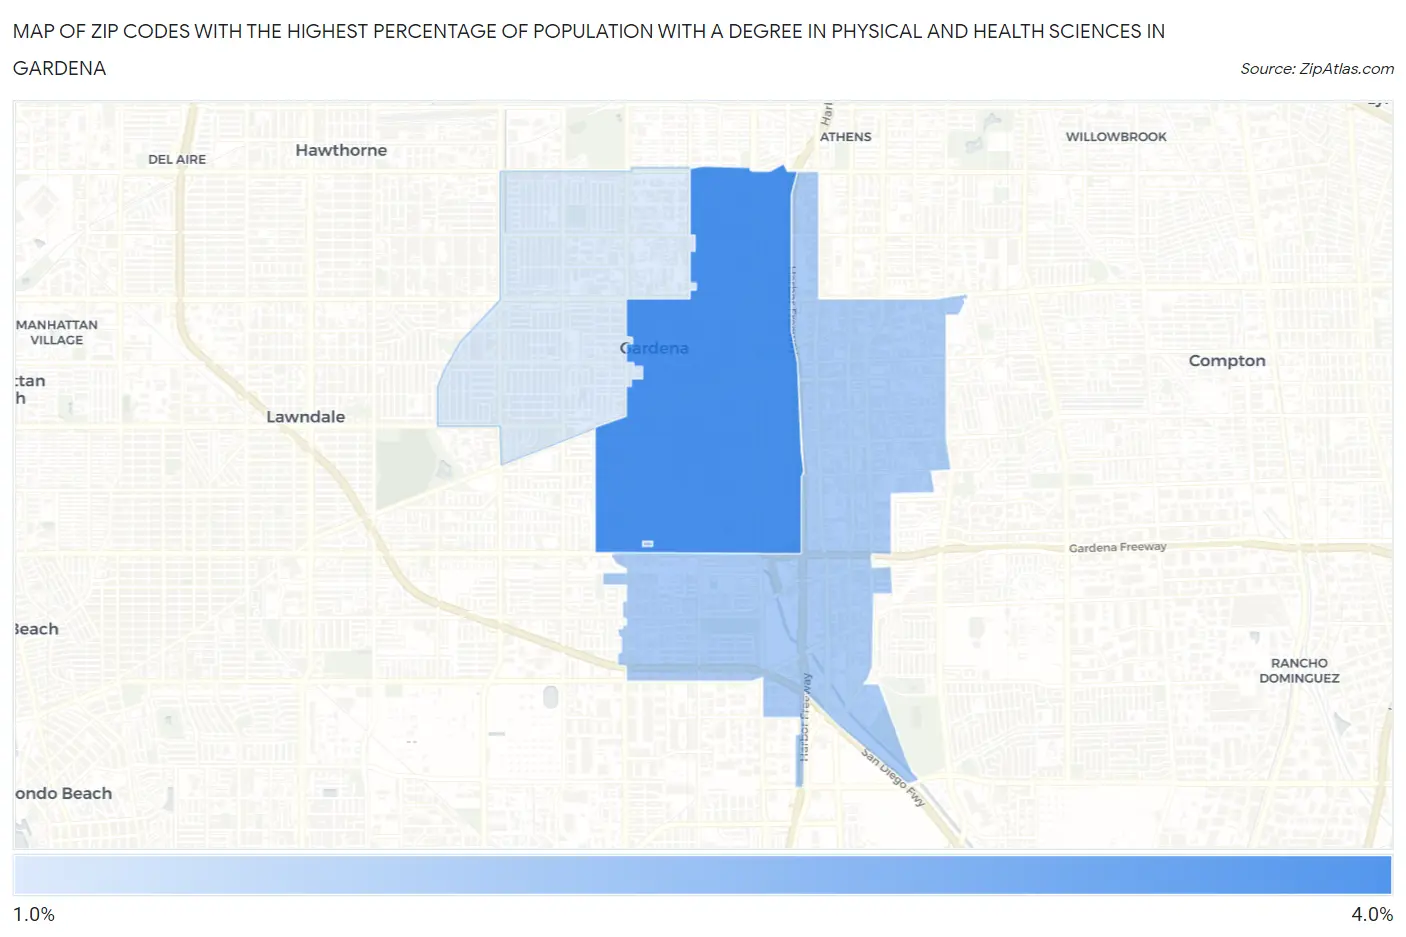
Map of Zip Codes with the Highest Percentage of Population with a Degree in Physical and Health Sciences in Gardena
1.0%
3.4%
Zip Codes with the Highest Percentage of Population with a Degree in Physical and Health Sciences in Gardena, CA
| Zip Code | % Graduates | vs State | vs National | |
| 1. | 90247 | 3.4% | 3.1%(+0.312)#485 | 3.1%(+0.328)#8,700 |
| 2. | 90248 | 1.8% | 3.1%(-1.27)#1,061 | 3.1%(-1.25)#15,774 |
| 3. | 90249 | 1.0% | 3.1%(-2.07)#1,268 | 3.1%(-2.05)#19,091 |
1
Common Questions
What are the Top Zip Codes with the Highest Percentage of Population with a Degree in Physical and Health Sciences in Gardena, CA?
Top Zip Codes with the Highest Percentage of Population with a Degree in Physical and Health Sciences in Gardena, CA are:
What zip code has the Highest Percentage of Population with a Degree in Physical and Health Sciences in Gardena, CA?
90247 has the Highest Percentage of Population with a Degree in Physical and Health Sciences in Gardena, CA with 3.4%.
What is the Percentage of Population with a Degree in Physical and Health Sciences in Gardena, CA?
Percentage of Population with a Degree in Physical and Health Sciences in Gardena is 2.5%.
What is the Percentage of Population with a Degree in Physical and Health Sciences in California?
Percentage of Population with a Degree in Physical and Health Sciences in California is 3.1%.
What is the Percentage of Population with a Degree in Physical and Health Sciences in the United States?
Percentage of Population with a Degree in Physical and Health Sciences in the United States is 3.1%.