Cities with the Highest Percentage of Population with a Degree in Physical and Health Sciences in Oregon
RELATED REPORTS & OPTIONS
Physical and Health Sciences
Oregon
Compare Cities
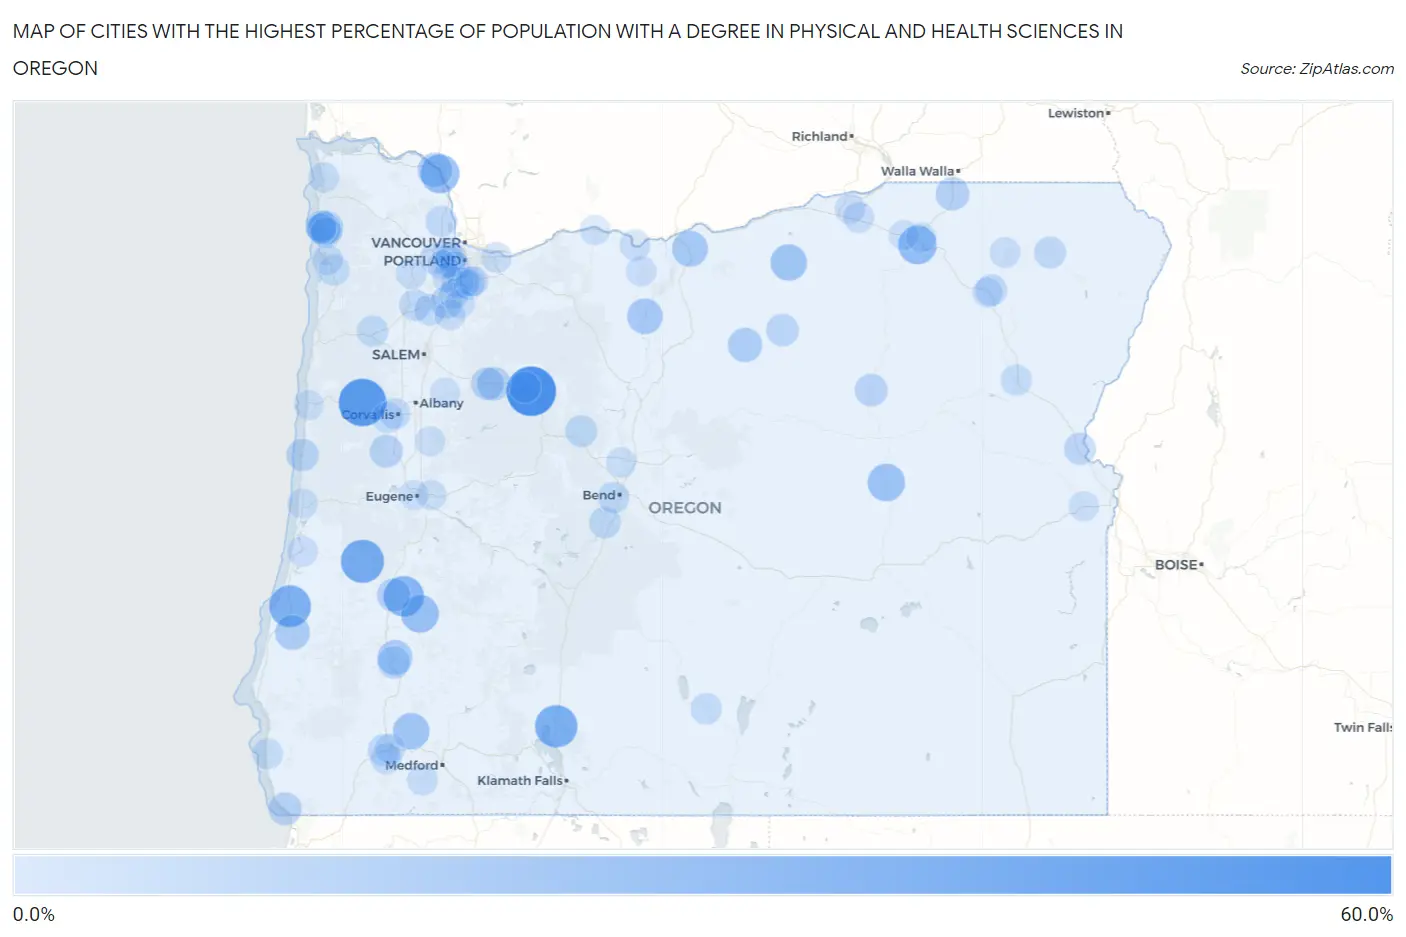
Map of Cities with the Highest Percentage of Population with a Degree in Physical and Health Sciences in Oregon
0.0%
60.0%
Cities with the Highest Percentage of Population with a Degree in Physical and Health Sciences in Oregon
| City | % Graduates | vs State | vs National | |
| 1. | Idanha | 55.6% | 3.9%(+51.7)#1 | 3.1%(+52.5)#63 |
| 2. | Summit | 50.0% | 3.9%(+46.1)#2 | 3.1%(+46.9)#90 |
| 3. | Elkton | 38.5% | 3.9%(+34.6)#3 | 3.1%(+35.4)#161 |
| 4. | Chiloquin | 36.4% | 3.9%(+32.5)#4 | 3.1%(+33.3)#179 |
| 5. | Bunker Hill | 35.2% | 3.9%(+31.3)#5 | 3.1%(+32.1)#190 |
| 6. | Fair Oaks | 31.6% | 3.9%(+27.7)#6 | 3.1%(+28.5)#232 |
| 7. | Green Meadows | 31.5% | 3.9%(+27.6)#7 | 3.1%(+28.4)#235 |
| 8. | Barnesdale | 30.4% | 3.9%(+26.5)#8 | 3.1%(+27.3)#252 |
| 9. | Prescott | 27.3% | 3.9%(+23.4)#9 | 3.1%(+24.2)#315 |
| 10. | Tutuilla | 26.7% | 3.9%(+22.8)#10 | 3.1%(+23.6)#329 |
| 11. | Cherry Grove | 25.0% | 3.9%(+21.1)#11 | 3.1%(+21.9)#364 |
| 12. | Glide | 24.5% | 3.9%(+20.6)#12 | 3.1%(+21.4)#404 |
| 13. | Seneca | 23.5% | 3.9%(+19.6)#13 | 3.1%(+20.4)#424 |
| 14. | Running Y Ranch | 23.4% | 3.9%(+19.5)#14 | 3.1%(+20.3)#427 |
| 15. | Ione | 21.3% | 3.9%(+17.4)#15 | 3.1%(+18.2)#497 |
| 16. | Wimer | 20.8% | 3.9%(+16.9)#16 | 3.1%(+17.7)#511 |
| 17. | Wasco | 19.4% | 3.9%(+15.5)#17 | 3.1%(+16.3)#574 |
| 18. | Maupin | 18.9% | 3.9%(+15.0)#18 | 3.1%(+15.8)#597 |
| 19. | Myrtle Creek | 17.4% | 3.9%(+13.5)#19 | 3.1%(+14.3)#674 |
| 20. | Coquille | 17.0% | 3.9%(+13.1)#20 | 3.1%(+13.9)#696 |
| 21. | Rainier | 16.3% | 3.9%(+12.4)#21 | 3.1%(+13.2)#759 |
| 22. | Fossil | 15.8% | 3.9%(+11.9)#22 | 3.1%(+12.7)#800 |
| 23. | Falcon Heights | 14.9% | 3.9%(+11.0)#23 | 3.1%(+11.8)#886 |
| 24. | Nehalem | 14.3% | 3.9%(+10.4)#24 | 3.1%(+11.2)#955 |
| 25. | Milton Freewater | 13.8% | 3.9%(+9.90)#25 | 3.1%(+10.7)#1,005 |
| 26. | Oakland | 13.6% | 3.9%(+9.74)#26 | 3.1%(+10.5)#1,023 |
| 27. | Bayside Gardens | 13.4% | 3.9%(+9.53)#27 | 3.1%(+10.3)#1,045 |
| 28. | Gates | 13.3% | 3.9%(+9.35)#28 | 3.1%(+10.2)#1,070 |
| 29. | Harbor | 12.5% | 3.9%(+8.60)#29 | 3.1%(+9.40)#1,153 |
| 30. | Alpine | 12.2% | 3.9%(+8.26)#30 | 3.1%(+9.06)#1,200 |
| 31. | Mill City | 12.0% | 3.9%(+8.07)#31 | 3.1%(+8.87)#1,223 |
| 32. | Long Creek | 11.5% | 3.9%(+7.64)#32 | 3.1%(+8.44)#1,288 |
| 33. | Tri City | 11.3% | 3.9%(+7.35)#33 | 3.1%(+8.15)#1,331 |
| 34. | Lonerock | 11.1% | 3.9%(+7.21)#34 | 3.1%(+8.01)#1,368 |
| 35. | Yachats | 10.9% | 3.9%(+7.00)#35 | 3.1%(+7.80)#1,390 |
| 36. | Butteville | 10.3% | 3.9%(+6.36)#36 | 3.1%(+7.16)#1,545 |
| 37. | Huntington | 9.8% | 3.9%(+5.94)#37 | 3.1%(+6.74)#1,645 |
| 38. | Neahkahnie | 9.8% | 3.9%(+5.88)#38 | 3.1%(+6.68)#1,656 |
| 39. | San Marine | 9.8% | 3.9%(+5.87)#39 | 3.1%(+6.67)#1,658 |
| 40. | Wallowa | 9.6% | 3.9%(+5.67)#40 | 3.1%(+6.47)#1,702 |
| 41. | Camp Sherman | 9.4% | 3.9%(+5.48)#41 | 3.1%(+6.28)#1,762 |
| 42. | Redwood | 9.2% | 3.9%(+5.35)#42 | 3.1%(+6.15)#1,803 |
| 43. | Sunriver | 9.2% | 3.9%(+5.35)#43 | 3.1%(+6.15)#1,805 |
| 44. | Island City | 9.2% | 3.9%(+5.33)#44 | 3.1%(+6.13)#1,809 |
| 45. | Lafayette | 9.1% | 3.9%(+5.17)#45 | 3.1%(+5.97)#1,867 |
| 46. | Rivergrove | 9.0% | 3.9%(+5.13)#46 | 3.1%(+5.93)#1,879 |
| 47. | Tetherow | 8.5% | 3.9%(+4.60)#47 | 3.1%(+5.40)#2,051 |
| 48. | St Paul | 8.3% | 3.9%(+4.43)#48 | 3.1%(+5.23)#2,110 |
| 49. | Detroit | 8.3% | 3.9%(+4.43)#49 | 3.1%(+5.23)#2,125 |
| 50. | Scappoose | 8.3% | 3.9%(+4.43)#50 | 3.1%(+5.23)#2,127 |
| 51. | Willamina | 8.2% | 3.9%(+4.32)#51 | 3.1%(+5.12)#2,143 |
| 52. | Stafford | 8.1% | 3.9%(+4.23)#52 | 3.1%(+5.03)#2,177 |
| 53. | Paisley | 8.0% | 3.9%(+4.10)#53 | 3.1%(+4.90)#2,247 |
| 54. | Tillamook | 7.8% | 3.9%(+3.85)#54 | 3.1%(+4.65)#2,345 |
| 55. | Baker City | 7.7% | 3.9%(+3.84)#55 | 3.1%(+4.64)#2,350 |
| 56. | Philomath | 7.6% | 3.9%(+3.72)#56 | 3.1%(+4.52)#2,418 |
| 57. | Corvallis | 7.4% | 3.9%(+3.48)#57 | 3.1%(+4.28)#2,540 |
| 58. | New Hope | 7.2% | 3.9%(+3.35)#58 | 3.1%(+4.15)#2,623 |
| 59. | Svensen | 7.2% | 3.9%(+3.35)#59 | 3.1%(+4.15)#2,624 |
| 60. | Wheeler | 7.2% | 3.9%(+3.29)#60 | 3.1%(+4.09)#2,661 |
| 61. | Gold Beach | 7.1% | 3.9%(+3.22)#61 | 3.1%(+4.02)#2,713 |
| 62. | Ruch | 7.0% | 3.9%(+3.14)#62 | 3.1%(+3.94)#2,760 |
| 63. | Cedar Hills | 6.9% | 3.9%(+3.04)#63 | 3.1%(+3.84)#2,810 |
| 64. | The Dalles | 6.9% | 3.9%(+3.02)#64 | 3.1%(+3.82)#2,824 |
| 65. | Gearhart | 6.9% | 3.9%(+2.97)#65 | 3.1%(+3.77)#2,860 |
| 66. | Troutdale | 6.8% | 3.9%(+2.90)#66 | 3.1%(+3.70)#2,908 |
| 67. | Bay City | 6.6% | 3.9%(+2.71)#67 | 3.1%(+3.51)#3,026 |
| 68. | Elgin | 6.5% | 3.9%(+2.62)#68 | 3.1%(+3.42)#3,070 |
| 69. | Hillsboro | 6.5% | 3.9%(+2.59)#69 | 3.1%(+3.39)#3,088 |
| 70. | Gaston | 6.5% | 3.9%(+2.55)#70 | 3.1%(+3.35)#3,115 |
| 71. | Bethany | 6.4% | 3.9%(+2.55)#71 | 3.1%(+3.35)#3,127 |
| 72. | Stanfield | 6.4% | 3.9%(+2.53)#72 | 3.1%(+3.33)#3,135 |
| 73. | Reedsport | 6.3% | 3.9%(+2.39)#73 | 3.1%(+3.19)#3,228 |
| 74. | Cedar Mill | 6.2% | 3.9%(+2.29)#74 | 3.1%(+3.09)#3,317 |
| 75. | Hermiston | 6.0% | 3.9%(+2.12)#75 | 3.1%(+2.92)#3,447 |
| 76. | Dufur | 5.9% | 3.9%(+2.03)#76 | 3.1%(+2.83)#3,520 |
| 77. | Hubbard | 5.9% | 3.9%(+2.02)#77 | 3.1%(+2.82)#3,532 |
| 78. | Florence | 5.7% | 3.9%(+1.82)#78 | 3.1%(+2.62)#3,691 |
| 79. | Raleigh Hills | 5.7% | 3.9%(+1.82)#79 | 3.1%(+2.62)#3,692 |
| 80. | Eagle Crest | 5.7% | 3.9%(+1.79)#80 | 3.1%(+2.59)#3,724 |
| 81. | Grants Pass | 5.7% | 3.9%(+1.78)#81 | 3.1%(+2.58)#3,730 |
| 82. | Wilsonville | 5.7% | 3.9%(+1.76)#82 | 3.1%(+2.56)#3,748 |
| 83. | Bull Mountain | 5.6% | 3.9%(+1.72)#83 | 3.1%(+2.52)#3,780 |
| 84. | Mission | 5.6% | 3.9%(+1.66)#84 | 3.1%(+2.46)#3,829 |
| 85. | La Grande | 5.5% | 3.9%(+1.60)#85 | 3.1%(+2.40)#3,899 |
| 86. | Springfield | 5.5% | 3.9%(+1.58)#86 | 3.1%(+2.38)#3,918 |
| 87. | Pendleton | 5.4% | 3.9%(+1.54)#87 | 3.1%(+2.34)#3,958 |
| 88. | Scio | 5.4% | 3.9%(+1.46)#88 | 3.1%(+2.26)#4,046 |
| 89. | Saunders Lake | 5.3% | 3.9%(+1.41)#89 | 3.1%(+2.21)#4,097 |
| 90. | Hood River | 5.3% | 3.9%(+1.39)#90 | 3.1%(+2.19)#4,118 |
| 91. | West Linn | 5.3% | 3.9%(+1.37)#91 | 3.1%(+2.17)#4,132 |
| 92. | Barlow | 5.3% | 3.9%(+1.36)#92 | 3.1%(+2.16)#4,166 |
| 93. | Gladstone | 5.2% | 3.9%(+1.34)#93 | 3.1%(+2.14)#4,185 |
| 94. | Vale | 5.2% | 3.9%(+1.33)#94 | 3.1%(+2.13)#4,193 |
| 95. | Newport | 5.2% | 3.9%(+1.29)#95 | 3.1%(+2.09)#4,235 |
| 96. | Manzanita | 5.2% | 3.9%(+1.28)#96 | 3.1%(+2.08)#4,246 |
| 97. | Brownsville | 5.2% | 3.9%(+1.27)#97 | 3.1%(+2.07)#4,256 |
| 98. | Jennings Lodge | 5.1% | 3.9%(+1.24)#98 | 3.1%(+2.04)#4,295 |
| 99. | Aloha | 5.1% | 3.9%(+1.18)#99 | 3.1%(+1.98)#4,365 |
| 100. | Eugene | 5.1% | 3.9%(+1.16)#100 | 3.1%(+1.96)#4,389 |
Common Questions
What are the Top 10 Cities with the Highest Percentage of Population with a Degree in Physical and Health Sciences in Oregon?
Top 10 Cities with the Highest Percentage of Population with a Degree in Physical and Health Sciences in Oregon are:
What city has the Highest Percentage of Population with a Degree in Physical and Health Sciences in Oregon?
Idanha has the Highest Percentage of Population with a Degree in Physical and Health Sciences in Oregon with 55.6%.
What is the Percentage of Population with a Degree in Physical and Health Sciences in the State of Oregon?
Percentage of Population with a Degree in Physical and Health Sciences in Oregon is 3.9%.
What is the Percentage of Population with a Degree in Physical and Health Sciences in the United States?
Percentage of Population with a Degree in Physical and Health Sciences in the United States is 3.1%.