Cities with the Highest Percentage of Population with a Degree in Physical and Health Sciences in Nebraska
RELATED REPORTS & OPTIONS
Physical and Health Sciences
Nebraska
Compare Cities
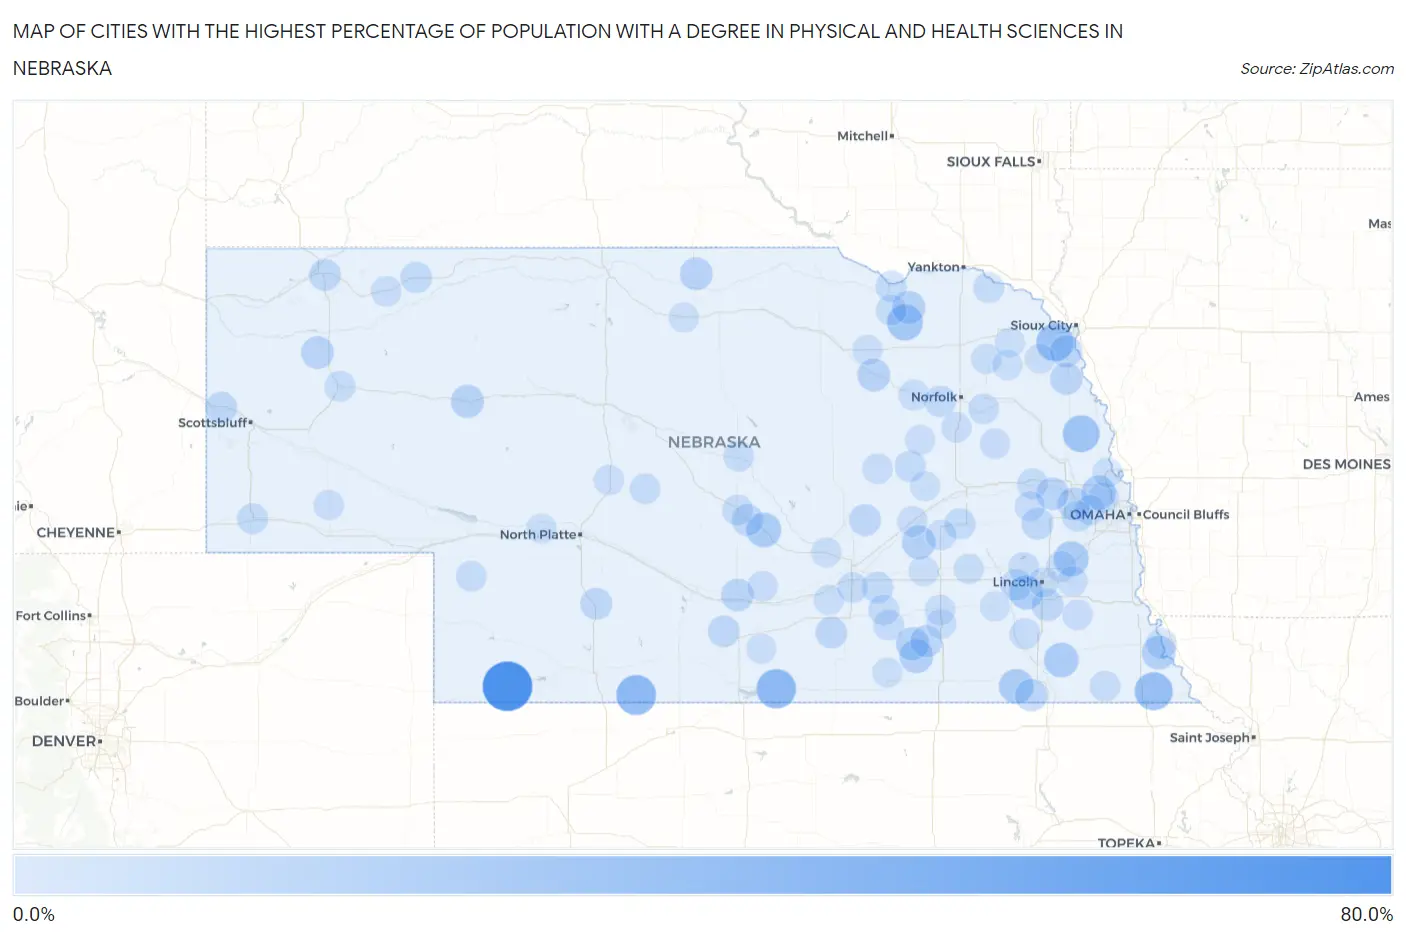
Map of Cities with the Highest Percentage of Population with a Degree in Physical and Health Sciences in Nebraska
0.0%
80.0%
Cities with the Highest Percentage of Population with a Degree in Physical and Health Sciences in Nebraska
| City | % Graduates | vs State | vs National | |
| 1. | Max | 79.2% | 2.7%(+76.5)#1 | 3.1%(+76.1)#29 |
| 2. | Linoma Beach | 57.9% | 2.7%(+55.2)#2 | 3.1%(+54.8)#57 |
| 3. | Lebanon | 40.0% | 2.7%(+37.3)#3 | 3.1%(+36.9)#143 |
| 4. | Bloomington | 38.9% | 2.7%(+36.2)#4 | 3.1%(+35.8)#154 |
| 5. | Salem | 33.3% | 2.7%(+30.7)#5 | 3.1%(+30.2)#211 |
| 6. | Hubbard | 31.4% | 2.7%(+28.8)#6 | 3.1%(+28.3)#238 |
| 7. | Craig | 28.6% | 2.7%(+25.9)#7 | 3.1%(+25.5)#289 |
| 8. | Bazile Mills | 25.0% | 2.7%(+22.3)#8 | 3.1%(+21.9)#393 |
| 9. | Greenwood | 21.5% | 2.7%(+18.8)#9 | 3.1%(+18.4)#487 |
| 10. | Litchfield | 20.7% | 2.7%(+18.0)#10 | 3.1%(+17.6)#518 |
| 11. | Diller | 20.0% | 2.7%(+17.3)#11 | 3.1%(+16.9)#543 |
| 12. | Filley | 20.0% | 2.7%(+17.3)#12 | 3.1%(+16.9)#554 |
| 13. | Washington | 18.4% | 2.7%(+15.7)#13 | 3.1%(+15.3)#623 |
| 14. | Denton | 17.9% | 2.7%(+15.2)#14 | 3.1%(+14.8)#652 |
| 15. | Nemaha | 17.1% | 2.7%(+14.5)#15 | 3.1%(+14.0)#691 |
| 16. | Davenport | 16.7% | 2.7%(+14.0)#16 | 3.1%(+13.6)#723 |
| 17. | Polk | 16.1% | 2.7%(+13.5)#17 | 3.1%(+13.0)#777 |
| 18. | Center | 14.3% | 2.7%(+11.6)#18 | 3.1%(+11.2)#959 |
| 19. | Hyannis | 14.3% | 2.7%(+11.6)#19 | 3.1%(+11.2)#969 |
| 20. | Ong | 14.3% | 2.7%(+11.6)#20 | 3.1%(+11.2)#974 |
| 21. | Hemingford | 13.0% | 2.7%(+10.3)#21 | 3.1%(+9.90)#1,104 |
| 22. | Springview | 12.9% | 2.7%(+10.2)#22 | 3.1%(+9.80)#1,117 |
| 23. | Clearwater | 12.8% | 2.7%(+10.1)#23 | 3.1%(+9.72)#1,124 |
| 24. | Leshara | 12.5% | 2.7%(+9.82)#24 | 3.1%(+9.40)#1,169 |
| 25. | Elm Creek | 12.2% | 2.7%(+9.54)#25 | 3.1%(+9.12)#1,193 |
| 26. | Cedar Bluffs | 12.1% | 2.7%(+9.44)#26 | 3.1%(+9.02)#1,202 |
| 27. | Odell | 11.8% | 2.7%(+9.09)#27 | 3.1%(+8.66)#1,256 |
| 28. | Homer | 11.4% | 2.7%(+8.75)#28 | 3.1%(+8.33)#1,306 |
| 29. | Walthill | 11.1% | 2.7%(+8.43)#29 | 3.1%(+8.01)#1,349 |
| 30. | Shickley | 10.3% | 2.7%(+7.62)#30 | 3.1%(+7.19)#1,533 |
| 31. | Maywood | 10.0% | 2.7%(+7.32)#31 | 3.1%(+6.90)#1,608 |
| 32. | Roca | 10.0% | 2.7%(+7.32)#32 | 3.1%(+6.90)#1,615 |
| 33. | Chadron | 10.0% | 2.7%(+7.30)#33 | 3.1%(+6.88)#1,624 |
| 34. | Palmer | 9.6% | 2.7%(+6.94)#34 | 3.1%(+6.52)#1,697 |
| 35. | Roseland | 9.4% | 2.7%(+6.70)#35 | 3.1%(+6.28)#1,763 |
| 36. | Mason City | 9.3% | 2.7%(+6.63)#36 | 3.1%(+6.20)#1,783 |
| 37. | Morrill | 9.2% | 2.7%(+6.47)#37 | 3.1%(+6.05)#1,821 |
| 38. | Loomis | 9.1% | 2.7%(+6.41)#38 | 3.1%(+5.99)#1,850 |
| 39. | Weston | 9.1% | 2.7%(+6.41)#39 | 3.1%(+5.99)#1,856 |
| 40. | Giltner | 8.7% | 2.7%(+6.02)#40 | 3.1%(+5.60)#1,984 |
| 41. | Pleasant Dale | 8.7% | 2.7%(+6.02)#41 | 3.1%(+5.60)#1,987 |
| 42. | Battle Creek | 8.5% | 2.7%(+5.77)#42 | 3.1%(+5.35)#2,072 |
| 43. | Gordon | 8.4% | 2.7%(+5.69)#43 | 3.1%(+5.27)#2,091 |
| 44. | St Edward | 7.5% | 2.7%(+4.87)#44 | 3.1%(+4.45)#2,453 |
| 45. | Shelby | 7.5% | 2.7%(+4.82)#45 | 3.1%(+4.40)#2,473 |
| 46. | Niobrara | 7.4% | 2.7%(+4.73)#46 | 3.1%(+4.31)#2,526 |
| 47. | Kimball | 6.7% | 2.7%(+3.99)#47 | 3.1%(+3.57)#2,975 |
| 48. | Yutan | 6.5% | 2.7%(+3.86)#48 | 3.1%(+3.44)#3,059 |
| 49. | Wynot | 6.2% | 2.7%(+3.57)#49 | 3.1%(+3.15)#3,268 |
| 50. | Brownville | 6.2% | 2.7%(+3.57)#50 | 3.1%(+3.15)#3,272 |
| 51. | Alliance | 6.1% | 2.7%(+3.45)#51 | 3.1%(+3.03)#3,362 |
| 52. | Clay Center | 6.0% | 2.7%(+3.31)#52 | 3.1%(+2.88)#3,470 |
| 53. | North Bend | 5.9% | 2.7%(+3.25)#53 | 3.1%(+2.83)#3,518 |
| 54. | Clatonia | 5.9% | 2.7%(+3.21)#54 | 3.1%(+2.78)#3,570 |
| 55. | Pawnee City | 5.8% | 2.7%(+3.09)#55 | 3.1%(+2.67)#3,657 |
| 56. | Doniphan | 5.8% | 2.7%(+3.09)#56 | 3.1%(+2.67)#3,658 |
| 57. | Malcolm | 5.8% | 2.7%(+3.09)#57 | 3.1%(+2.67)#3,664 |
| 58. | Arnold | 5.7% | 2.7%(+3.00)#58 | 3.1%(+2.57)#3,736 |
| 59. | Sargent | 5.6% | 2.7%(+2.96)#59 | 3.1%(+2.53)#3,773 |
| 60. | Harvard | 5.6% | 2.7%(+2.88)#60 | 3.1%(+2.46)#3,828 |
| 61. | Bennington | 5.5% | 2.7%(+2.82)#61 | 3.1%(+2.40)#3,896 |
| 62. | Ansley | 5.4% | 2.7%(+2.75)#62 | 3.1%(+2.33)#3,976 |
| 63. | Grant | 5.4% | 2.7%(+2.69)#63 | 3.1%(+2.26)#4,036 |
| 64. | Verdigre | 5.2% | 2.7%(+2.53)#64 | 3.1%(+2.11)#4,218 |
| 65. | Stanton | 5.2% | 2.7%(+2.50)#65 | 3.1%(+2.08)#4,240 |
| 66. | Waverly | 5.1% | 2.7%(+2.43)#66 | 3.1%(+2.01)#4,338 |
| 67. | Tilden | 5.1% | 2.7%(+2.43)#67 | 3.1%(+2.01)#4,339 |
| 68. | Rushville | 5.0% | 2.7%(+2.32)#68 | 3.1%(+1.90)#4,448 |
| 69. | Cedar Rapids | 4.9% | 2.7%(+2.26)#69 | 3.1%(+1.84)#4,523 |
| 70. | Riverdale | 4.8% | 2.7%(+2.09)#70 | 3.1%(+1.66)#4,771 |
| 71. | Stromsburg | 4.7% | 2.7%(+2.03)#71 | 3.1%(+1.61)#4,842 |
| 72. | Fairmont | 4.7% | 2.7%(+2.01)#72 | 3.1%(+1.59)#4,866 |
| 73. | Clarkson | 4.7% | 2.7%(+1.97)#73 | 3.1%(+1.55)#4,904 |
| 74. | Waterloo | 4.4% | 2.7%(+1.77)#74 | 3.1%(+1.34)#5,237 |
| 75. | Stapleton | 4.3% | 2.7%(+1.67)#75 | 3.1%(+1.25)#5,399 |
| 76. | Clarks | 4.3% | 2.7%(+1.67)#76 | 3.1%(+1.25)#5,400 |
| 77. | Prague | 4.3% | 2.7%(+1.67)#77 | 3.1%(+1.25)#5,401 |
| 78. | Madison | 4.3% | 2.7%(+1.58)#78 | 3.1%(+1.16)#5,535 |
| 79. | Utica | 4.2% | 2.7%(+1.49)#79 | 3.1%(+1.07)#5,672 |
| 80. | Carroll | 4.2% | 2.7%(+1.49)#80 | 3.1%(+1.07)#5,686 |
| 81. | Gurley | 4.2% | 2.7%(+1.49)#81 | 3.1%(+1.07)#5,687 |
| 82. | Douglas | 4.2% | 2.7%(+1.49)#82 | 3.1%(+1.07)#5,690 |
| 83. | Eagle | 4.1% | 2.7%(+1.44)#83 | 3.1%(+1.02)#5,767 |
| 84. | Emerson | 3.8% | 2.7%(+1.17)#84 | 3.1%(+0.746)#6,283 |
| 85. | Orchard | 3.8% | 2.7%(+1.17)#85 | 3.1%(+0.746)#6,290 |
| 86. | Ainsworth | 3.8% | 2.7%(+1.10)#86 | 3.1%(+0.679)#6,419 |
| 87. | Nelson | 3.8% | 2.7%(+1.10)#87 | 3.1%(+0.674)#6,436 |
| 88. | Cairo | 3.8% | 2.7%(+1.08)#88 | 3.1%(+0.660)#6,464 |
| 89. | Wilcox | 3.7% | 2.7%(+1.03)#89 | 3.1%(+0.604)#6,578 |
| 90. | Dorchester | 3.6% | 2.7%(+0.960)#90 | 3.1%(+0.537)#6,709 |
| 91. | Newman Grove | 3.6% | 2.7%(+0.938)#91 | 3.1%(+0.515)#6,754 |
| 92. | Bradshaw | 3.6% | 2.7%(+0.938)#92 | 3.1%(+0.515)#6,757 |
| 93. | Prosser | 3.6% | 2.7%(+0.895)#93 | 3.1%(+0.472)#6,877 |
| 94. | Wayne | 3.5% | 2.7%(+0.867)#94 | 3.1%(+0.444)#6,923 |
| 95. | Sutherland | 3.5% | 2.7%(+0.812)#95 | 3.1%(+0.389)#7,060 |
| 96. | Blair | 3.4% | 2.7%(+0.742)#96 | 3.1%(+0.320)#7,225 |
| 97. | Lincoln | 3.4% | 2.7%(+0.710)#97 | 3.1%(+0.287)#7,302 |
| 98. | Genoa | 3.3% | 2.7%(+0.657)#98 | 3.1%(+0.234)#7,434 |
| 99. | Concord | 3.3% | 2.7%(+0.657)#99 | 3.1%(+0.234)#7,448 |
| 100. | Geneva | 3.2% | 2.7%(+0.556)#100 | 3.1%(+0.134)#7,679 |
Common Questions
What are the Top 10 Cities with the Highest Percentage of Population with a Degree in Physical and Health Sciences in Nebraska?
Top 10 Cities with the Highest Percentage of Population with a Degree in Physical and Health Sciences in Nebraska are:
#1
79.2%
#2
40.0%
#3
38.9%
#4
33.3%
#5
31.4%
#6
28.6%
#7
25.0%
#8
21.5%
#9
20.7%
#10
20.0%
What city has the Highest Percentage of Population with a Degree in Physical and Health Sciences in Nebraska?
Max has the Highest Percentage of Population with a Degree in Physical and Health Sciences in Nebraska with 79.2%.
What is the Percentage of Population with a Degree in Physical and Health Sciences in the State of Nebraska?
Percentage of Population with a Degree in Physical and Health Sciences in Nebraska is 2.7%.
What is the Percentage of Population with a Degree in Physical and Health Sciences in the United States?
Percentage of Population with a Degree in Physical and Health Sciences in the United States is 3.1%.