Cities with the Highest Percentage of Population with a Degree in Physical and Health Sciences in Montana
RELATED REPORTS & OPTIONS
Physical and Health Sciences
Montana
Compare Cities
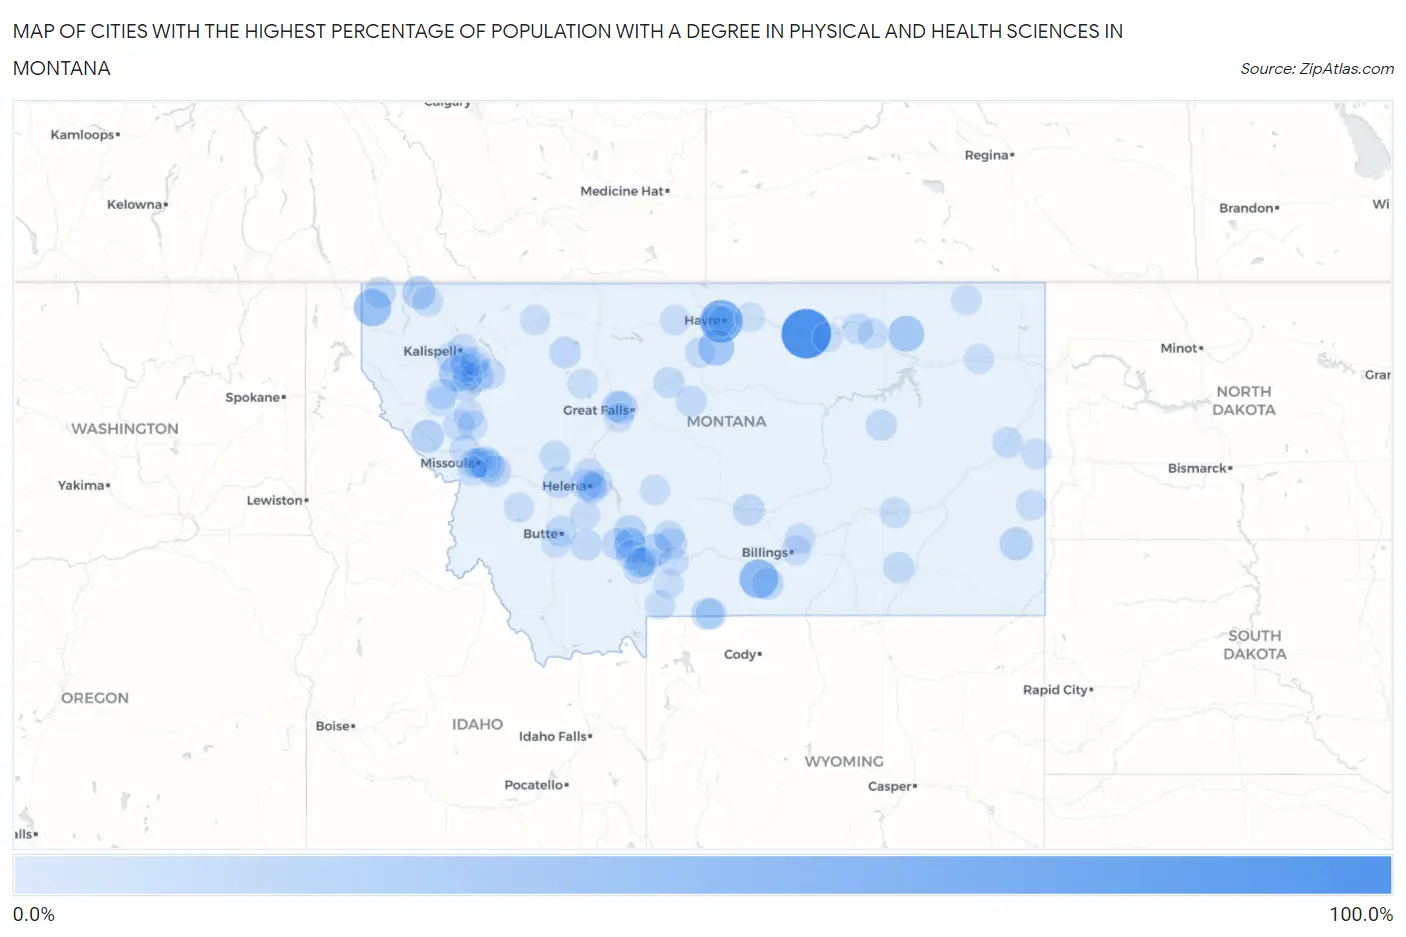
Map of Cities with the Highest Percentage of Population with a Degree in Physical and Health Sciences in Montana
0.0%
100.0%
Cities with the Highest Percentage of Population with a Degree in Physical and Health Sciences in Montana
| City | % Graduates | vs State | vs National | |
| 1. | Dodson | 100.0% | 3.7%(+96.3)#1 | 3.1%(+96.9)#18 |
| 2. | Dewey | 100.0% | 3.7%(+96.3)#2 | 3.1%(+96.9)#24 |
| 3. | New Miami Colony | 66.7% | 3.7%(+62.9)#3 | 3.1%(+63.6)#41 |
| 4. | West Havre | 64.5% | 3.7%(+60.8)#4 | 3.1%(+61.4)#44 |
| 5. | Rimini | 50.0% | 3.7%(+46.3)#5 | 3.1%(+46.9)#93 |
| 6. | Mammoth | 50.0% | 3.7%(+46.3)#6 | 3.1%(+46.9)#102 |
| 7. | Boyd | 45.5% | 3.7%(+41.7)#7 | 3.1%(+42.4)#116 |
| 8. | Sylvanite | 38.7% | 3.7%(+35.0)#8 | 3.1%(+35.6)#157 |
| 9. | St Pierre | 31.8% | 3.7%(+28.1)#9 | 3.1%(+28.7)#229 |
| 10. | St Marie | 31.5% | 3.7%(+27.8)#10 | 3.1%(+28.4)#236 |
| 11. | Lake Mary Ronan | 27.3% | 3.7%(+23.5)#11 | 3.1%(+24.2)#316 |
| 12. | Eureka | 18.9% | 3.7%(+15.2)#12 | 3.1%(+15.8)#595 |
| 13. | Bridger | 18.8% | 3.7%(+15.1)#13 | 3.1%(+15.7)#602 |
| 14. | Ekalaka | 18.6% | 3.7%(+14.9)#14 | 3.1%(+15.5)#613 |
| 15. | Superior | 17.3% | 3.7%(+13.5)#15 | 3.1%(+14.2)#685 |
| 16. | Beaver Creek | 16.7% | 3.7%(+12.9)#16 | 3.1%(+13.6)#722 |
| 17. | Sun Prairie | 15.4% | 3.7%(+11.6)#17 | 3.1%(+12.3)#835 |
| 18. | Bear Dance | 15.0% | 3.7%(+11.3)#18 | 3.1%(+11.9)#871 |
| 19. | Manhattan | 14.8% | 3.7%(+11.1)#19 | 3.1%(+11.7)#898 |
| 20. | Ponderosa Pines | 14.7% | 3.7%(+11.0)#20 | 3.1%(+11.6)#901 |
| 21. | Turah | 14.4% | 3.7%(+10.6)#21 | 3.1%(+11.3)#934 |
| 22. | Bonner West Riverside | 14.3% | 3.7%(+10.6)#22 | 3.1%(+11.2)#943 |
| 23. | Cyr | 13.5% | 3.7%(+9.79)#23 | 3.1%(+10.4)#1,038 |
| 24. | Clinton | 13.5% | 3.7%(+9.75)#24 | 3.1%(+10.4)#1,040 |
| 25. | Maverick Mountain | 13.3% | 3.7%(+9.61)#25 | 3.1%(+10.2)#1,062 |
| 26. | Fromberg | 13.1% | 3.7%(+9.39)#26 | 3.1%(+10.0)#1,084 |
| 27. | Silver Gate | 13.0% | 3.7%(+9.32)#27 | 3.1%(+9.94)#1,098 |
| 28. | Helena West Side | 12.3% | 3.7%(+8.57)#28 | 3.1%(+9.20)#1,185 |
| 29. | Lindisfarne | 12.2% | 3.7%(+8.48)#29 | 3.1%(+9.11)#1,196 |
| 30. | Three Forks | 11.8% | 3.7%(+8.07)#30 | 3.1%(+8.70)#1,247 |
| 31. | Clyde Park | 11.6% | 3.7%(+7.90)#31 | 3.1%(+8.53)#1,277 |
| 32. | Ryegate | 11.5% | 3.7%(+7.81)#32 | 3.1%(+8.44)#1,287 |
| 33. | Dupuyer | 11.1% | 3.7%(+7.38)#33 | 3.1%(+8.01)#1,365 |
| 34. | Yaak | 10.7% | 3.7%(+6.99)#34 | 3.1%(+7.61)#1,424 |
| 35. | Unionville | 10.6% | 3.7%(+6.83)#35 | 3.1%(+7.45)#1,457 |
| 36. | Avon | 10.2% | 3.7%(+6.48)#36 | 3.1%(+7.10)#1,561 |
| 37. | Whitehall | 9.6% | 3.7%(+5.84)#37 | 3.1%(+6.47)#1,705 |
| 38. | Fort Benton | 9.5% | 3.7%(+5.74)#38 | 3.1%(+6.37)#1,737 |
| 39. | Gallatin River Ranch | 9.4% | 3.7%(+5.65)#39 | 3.1%(+6.28)#1,764 |
| 40. | Dixon | 9.3% | 3.7%(+5.58)#40 | 3.1%(+6.20)#1,782 |
| 41. | Lame Deer | 9.3% | 3.7%(+5.53)#41 | 3.1%(+6.16)#1,797 |
| 42. | Walkerville | 9.1% | 3.7%(+5.36)#42 | 3.1%(+5.99)#1,840 |
| 43. | Jordan | 9.1% | 3.7%(+5.36)#43 | 3.1%(+5.99)#1,852 |
| 44. | Vaughn | 9.0% | 3.7%(+5.26)#44 | 3.1%(+5.89)#1,896 |
| 45. | Wilsall | 8.7% | 3.7%(+4.97)#45 | 3.1%(+5.60)#1,989 |
| 46. | Saco | 8.7% | 3.7%(+4.97)#46 | 3.1%(+5.60)#1,991 |
| 47. | Geraldine | 8.6% | 3.7%(+4.84)#47 | 3.1%(+5.47)#2,037 |
| 48. | Fortine | 8.0% | 3.7%(+4.27)#48 | 3.1%(+4.90)#2,244 |
| 49. | Gallatin Gateway | 7.9% | 3.7%(+4.14)#49 | 3.1%(+4.77)#2,291 |
| 50. | Glendive | 7.8% | 3.7%(+4.06)#50 | 3.1%(+4.69)#2,331 |
| 51. | Havre | 7.7% | 3.7%(+3.93)#51 | 3.1%(+4.56)#2,403 |
| 52. | Kila | 7.5% | 3.7%(+3.81)#52 | 3.1%(+4.43)#2,459 |
| 53. | Lincoln | 7.4% | 3.7%(+3.68)#53 | 3.1%(+4.31)#2,518 |
| 54. | Lonepine | 7.4% | 3.7%(+3.68)#54 | 3.1%(+4.31)#2,534 |
| 55. | Cooke City | 7.4% | 3.7%(+3.68)#55 | 3.1%(+4.31)#2,537 |
| 56. | Woods Bay | 7.3% | 3.7%(+3.55)#56 | 3.1%(+4.17)#2,601 |
| 57. | Baker | 7.2% | 3.7%(+3.46)#57 | 3.1%(+4.09)#2,660 |
| 58. | Hinsdale | 7.1% | 3.7%(+3.42)#58 | 3.1%(+4.04)#2,699 |
| 59. | Frenchtown | 7.1% | 3.7%(+3.36)#59 | 3.1%(+3.98)#2,735 |
| 60. | Forsyth | 7.0% | 3.7%(+3.30)#60 | 3.1%(+3.93)#2,766 |
| 61. | Four Corners | 7.0% | 3.7%(+3.25)#61 | 3.1%(+3.87)#2,799 |
| 62. | Helena Valley Northwest | 6.9% | 3.7%(+3.19)#62 | 3.1%(+3.82)#2,827 |
| 63. | Churchill | 6.6% | 3.7%(+2.92)#63 | 3.1%(+3.55)#3,008 |
| 64. | Big Sandy | 6.6% | 3.7%(+2.83)#64 | 3.1%(+3.46)#3,052 |
| 65. | South Hills | 6.5% | 3.7%(+2.82)#65 | 3.1%(+3.45)#3,057 |
| 66. | Bozeman | 6.5% | 3.7%(+2.73)#66 | 3.1%(+3.36)#3,103 |
| 67. | King Arthur Park | 6.4% | 3.7%(+2.71)#67 | 3.1%(+3.33)#3,132 |
| 68. | Shepherd | 6.3% | 3.7%(+2.59)#68 | 3.1%(+3.22)#3,211 |
| 69. | Somers | 6.2% | 3.7%(+2.48)#69 | 3.1%(+3.10)#3,307 |
| 70. | Swan Lake | 6.2% | 3.7%(+2.43)#70 | 3.1%(+3.05)#3,347 |
| 71. | Boulder | 5.8% | 3.7%(+2.04)#71 | 3.1%(+2.67)#3,656 |
| 72. | Charlo | 5.8% | 3.7%(+2.04)#72 | 3.1%(+2.67)#3,667 |
| 73. | Helena | 5.4% | 3.7%(+1.64)#73 | 3.1%(+2.26)#4,034 |
| 74. | Wibaux | 5.3% | 3.7%(+1.59)#74 | 3.1%(+2.22)#4,084 |
| 75. | St Ignatius | 5.3% | 3.7%(+1.58)#75 | 3.1%(+2.20)#4,101 |
| 76. | Scobey | 5.3% | 3.7%(+1.57)#76 | 3.1%(+2.19)#4,108 |
| 77. | Ulm | 5.2% | 3.7%(+1.45)#77 | 3.1%(+2.07)#4,252 |
| 78. | White Sulphur Springs | 5.1% | 3.7%(+1.42)#78 | 3.1%(+2.05)#4,279 |
| 79. | Malta | 5.1% | 3.7%(+1.35)#79 | 3.1%(+1.98)#4,366 |
| 80. | Rudyard | 5.1% | 3.7%(+1.34)#80 | 3.1%(+1.96)#4,384 |
| 81. | East Missoula | 5.1% | 3.7%(+1.33)#81 | 3.1%(+1.95)#4,395 |
| 82. | Browning | 4.9% | 3.7%(+1.21)#82 | 3.1%(+1.84)#4,520 |
| 83. | Orchard Homes | 4.8% | 3.7%(+1.09)#83 | 3.1%(+1.72)#4,685 |
| 84. | Philipsburg | 4.8% | 3.7%(+1.04)#84 | 3.1%(+1.66)#4,751 |
| 85. | Helena Valley Southeast | 4.6% | 3.7%(+0.896)#85 | 3.1%(+1.52)#4,946 |
| 86. | Rollins | 4.6% | 3.7%(+0.871)#86 | 3.1%(+1.50)#4,992 |
| 87. | Evergreen | 4.5% | 3.7%(+0.765)#87 | 3.1%(+1.39)#5,166 |
| 88. | Corwin Springs | 4.5% | 3.7%(+0.751)#88 | 3.1%(+1.38)#5,193 |
| 89. | Missoula | 4.3% | 3.7%(+0.613)#89 | 3.1%(+1.24)#5,416 |
| 90. | Lakeside | 4.3% | 3.7%(+0.532)#90 | 3.1%(+1.16)#5,531 |
| 91. | Lockwood | 4.2% | 3.7%(+0.487)#91 | 3.1%(+1.11)#5,602 |
| 92. | Choteau | 4.2% | 3.7%(+0.453)#92 | 3.1%(+1.08)#5,643 |
| 93. | Poplar | 4.0% | 3.7%(+0.273)#93 | 3.1%(+0.900)#5,972 |
| 94. | Pray | 4.0% | 3.7%(+0.234)#94 | 3.1%(+0.861)#6,064 |
| 95. | Hot Springs | 3.7% | 3.7%(-0.068)#95 | 3.1%(+0.559)#6,667 |
| 96. | Chinook | 3.6% | 3.7%(-0.090)#96 | 3.1%(+0.537)#6,697 |
| 97. | Bigfork | 3.6% | 3.7%(-0.101)#97 | 3.1%(+0.526)#6,729 |
| 98. | Lolo | 3.6% | 3.7%(-0.115)#98 | 3.1%(+0.512)#6,761 |
| 99. | Butte Silver Bow Balance | 3.6% | 3.7%(-0.166)#99 | 3.1%(+0.461)#6,894 |
| 100. | Livingston | 3.4% | 3.7%(-0.362)#100 | 3.1%(+0.265)#7,359 |
Common Questions
What are the Top 10 Cities with the Highest Percentage of Population with a Degree in Physical and Health Sciences in Montana?
Top 10 Cities with the Highest Percentage of Population with a Degree in Physical and Health Sciences in Montana are:
#1
100.0%
#2
64.5%
#3
45.5%
#4
38.7%
#5
31.8%
#6
31.5%
#7
27.3%
#8
18.9%
#9
18.8%
#10
18.6%
What city has the Highest Percentage of Population with a Degree in Physical and Health Sciences in Montana?
Dodson has the Highest Percentage of Population with a Degree in Physical and Health Sciences in Montana with 100.0%.
What is the Percentage of Population with a Degree in Physical and Health Sciences in the State of Montana?
Percentage of Population with a Degree in Physical and Health Sciences in Montana is 3.7%.
What is the Percentage of Population with a Degree in Physical and Health Sciences in the United States?
Percentage of Population with a Degree in Physical and Health Sciences in the United States is 3.1%.