Cities with the Highest Percentage of Population with a Degree in Physical and Health Sciences in Washington
RELATED REPORTS & OPTIONS
Physical and Health Sciences
Washington
Compare Cities
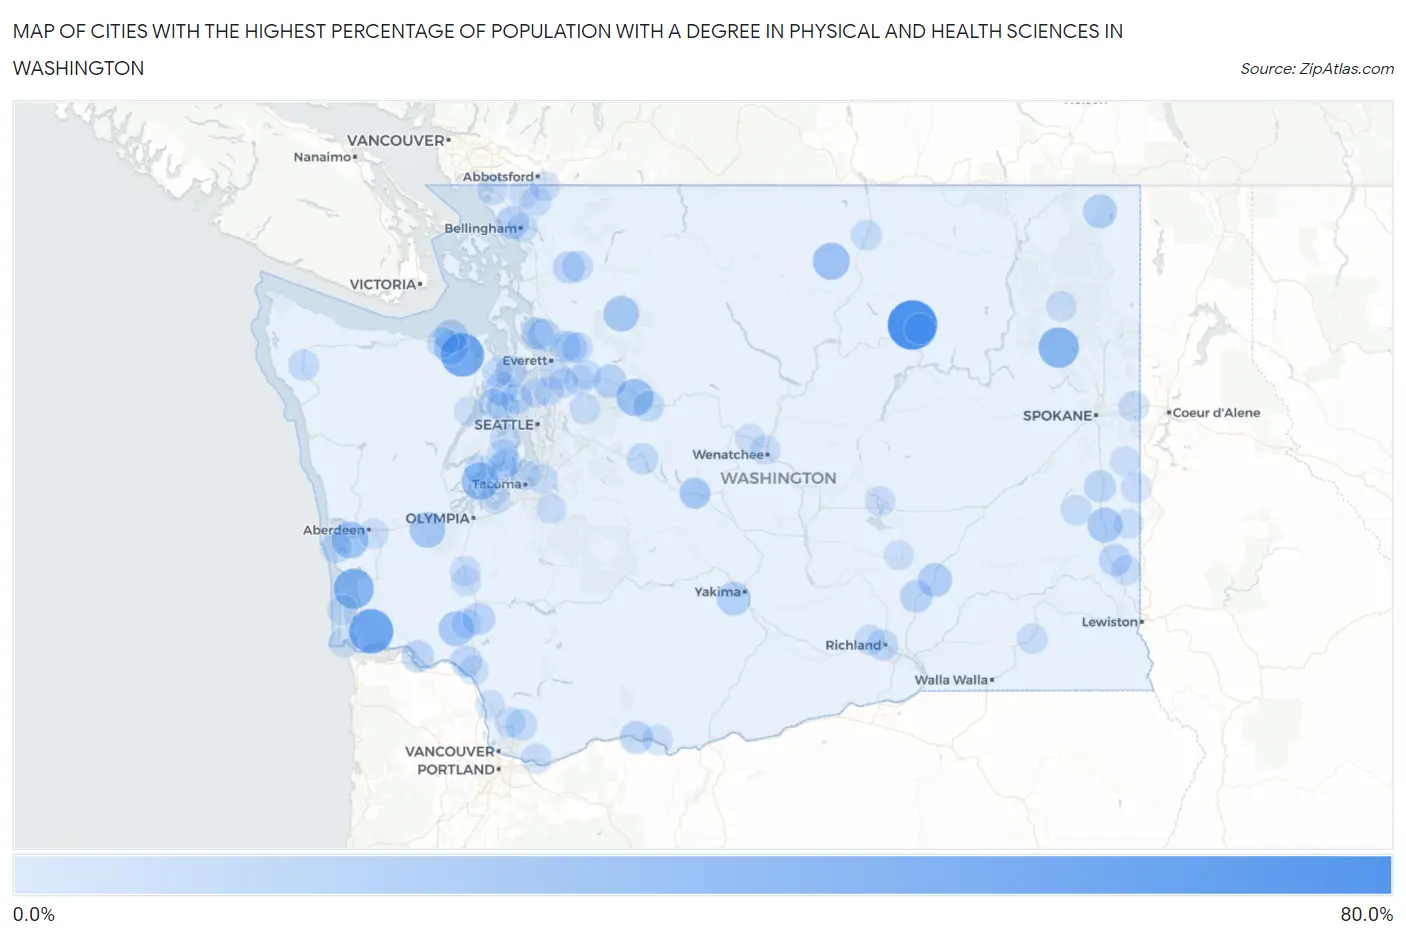
Map of Cities with the Highest Percentage of Population with a Degree in Physical and Health Sciences in Washington
0.0%
80.0%
Cities with the Highest Percentage of Population with a Degree in Physical and Health Sciences in Washington
| City | % Graduates | vs State | vs National | |
| 1. | Nespelem Community | 66.7% | 3.4%(+63.3)#1 | 3.1%(+63.6)#39 |
| 2. | Naselle | 49.4% | 3.4%(+46.0)#2 | 3.1%(+46.3)#103 |
| 3. | Blyn | 46.4% | 3.4%(+43.1)#3 | 3.1%(+43.3)#111 |
| 4. | Springdale | 36.8% | 3.4%(+33.5)#4 | 3.1%(+33.7)#176 |
| 5. | Bay Center | 36.4% | 3.4%(+33.0)#5 | 3.1%(+33.3)#180 |
| 6. | Sunland Estates | 31.2% | 3.4%(+27.9)#6 | 3.1%(+28.2)#240 |
| 7. | Herron Island | 27.5% | 3.4%(+24.1)#7 | 3.1%(+24.4)#310 |
| 8. | Baring | 26.7% | 3.4%(+23.3)#8 | 3.1%(+23.6)#331 |
| 9. | Conconully | 26.1% | 3.4%(+22.7)#9 | 3.1%(+23.0)#340 |
| 10. | Markham | 25.0% | 3.4%(+21.6)#10 | 3.1%(+21.9)#381 |
| 11. | Malone | 21.8% | 3.4%(+18.5)#11 | 3.1%(+18.7)#477 |
| 12. | Darrington | 21.8% | 3.4%(+18.4)#12 | 3.1%(+18.7)#478 |
| 13. | Ryderwood | 20.6% | 3.4%(+17.3)#13 | 3.1%(+17.5)#519 |
| 14. | Steptoe | 20.0% | 3.4%(+16.6)#14 | 3.1%(+16.9)#553 |
| 15. | Bell Hill | 17.4% | 3.4%(+14.0)#15 | 3.1%(+14.3)#675 |
| 16. | Connell | 16.8% | 3.4%(+13.4)#16 | 3.1%(+13.7)#711 |
| 17. | Metaline | 16.7% | 3.4%(+13.3)#17 | 3.1%(+13.6)#734 |
| 18. | Ahtanum | 16.3% | 3.4%(+13.0)#18 | 3.1%(+13.2)#760 |
| 19. | Jamestown | 15.7% | 3.4%(+12.3)#19 | 3.1%(+12.6)#806 |
| 20. | Gold Bar | 14.9% | 3.4%(+11.6)#20 | 3.1%(+11.8)#879 |
| 21. | Lofall | 14.3% | 3.4%(+11.0)#21 | 3.1%(+11.2)#936 |
| 22. | Marietta Alderwood | 13.8% | 3.4%(+10.5)#22 | 3.1%(+10.7)#1,003 |
| 23. | Bingen | 13.7% | 3.4%(+10.3)#23 | 3.1%(+10.6)#1,019 |
| 24. | Mesa | 13.2% | 3.4%(+9.79)#24 | 3.1%(+10.1)#1,080 |
| 25. | Albion | 12.4% | 3.4%(+8.98)#25 | 3.1%(+9.25)#1,179 |
| 26. | Toledo | 12.3% | 3.4%(+8.89)#26 | 3.1%(+9.16)#1,187 |
| 27. | Cathlamet | 11.8% | 3.4%(+8.45)#27 | 3.1%(+8.72)#1,244 |
| 28. | Lake Goodwin | 11.7% | 3.4%(+8.35)#28 | 3.1%(+8.63)#1,262 |
| 29. | Rosalia | 11.3% | 3.4%(+7.90)#29 | 3.1%(+8.17)#1,329 |
| 30. | Lyman | 11.1% | 3.4%(+7.74)#30 | 3.1%(+8.01)#1,352 |
| 31. | Kayak Point | 11.0% | 3.4%(+7.67)#31 | 3.1%(+7.94)#1,373 |
| 32. | Lochsloy | 11.0% | 3.4%(+7.62)#32 | 3.1%(+7.89)#1,376 |
| 33. | Snoqualmie Pass | 10.2% | 3.4%(+6.79)#33 | 3.1%(+7.06)#1,569 |
| 34. | Longview Heights | 10.1% | 3.4%(+6.68)#34 | 3.1%(+6.95)#1,587 |
| 35. | Hansville | 10.0% | 3.4%(+6.68)#35 | 3.1%(+6.95)#1,590 |
| 36. | Kitsap Lake | 10.0% | 3.4%(+6.60)#36 | 3.1%(+6.87)#1,626 |
| 37. | Lake Cassidy | 9.3% | 3.4%(+5.93)#37 | 3.1%(+6.20)#1,785 |
| 38. | Venersborg | 9.2% | 3.4%(+5.86)#38 | 3.1%(+6.13)#1,806 |
| 39. | Burley | 9.0% | 3.4%(+5.64)#39 | 3.1%(+5.91)#1,887 |
| 40. | Richland | 9.0% | 3.4%(+5.63)#40 | 3.1%(+5.91)#1,889 |
| 41. | Forks | 8.7% | 3.4%(+5.36)#41 | 3.1%(+5.64)#1,967 |
| 42. | Cohassett Beach | 8.6% | 3.4%(+5.23)#42 | 3.1%(+5.50)#2,021 |
| 43. | Keyport | 8.6% | 3.4%(+5.22)#43 | 3.1%(+5.49)#2,029 |
| 44. | Skykomish | 8.6% | 3.4%(+5.20)#44 | 3.1%(+5.47)#2,038 |
| 45. | Nespelem | 8.3% | 3.4%(+4.96)#45 | 3.1%(+5.23)#2,122 |
| 46. | Hamilton | 8.2% | 3.4%(+4.85)#46 | 3.1%(+5.12)#2,144 |
| 47. | Grapeview | 8.2% | 3.4%(+4.81)#47 | 3.1%(+5.08)#2,157 |
| 48. | Cle Elum | 8.0% | 3.4%(+4.63)#48 | 3.1%(+4.90)#2,233 |
| 49. | Tonasket | 7.6% | 3.4%(+4.27)#49 | 3.1%(+4.54)#2,409 |
| 50. | Carlsborg | 7.6% | 3.4%(+4.22)#50 | 3.1%(+4.50)#2,428 |
| 51. | Anderson Island | 7.4% | 3.4%(+3.98)#51 | 3.1%(+4.25)#2,551 |
| 52. | Tekoa | 7.4% | 3.4%(+3.98)#52 | 3.1%(+4.25)#2,553 |
| 53. | Cherry Grove | 7.3% | 3.4%(+3.90)#53 | 3.1%(+4.17)#2,602 |
| 54. | East Port Orchard | 7.2% | 3.4%(+3.87)#54 | 3.1%(+4.14)#2,629 |
| 55. | Chewelah | 7.1% | 3.4%(+3.75)#55 | 3.1%(+4.02)#2,711 |
| 56. | Rosedale | 7.1% | 3.4%(+3.73)#56 | 3.1%(+4.00)#2,721 |
| 57. | Ocean Park | 7.1% | 3.4%(+3.72)#57 | 3.1%(+3.99)#2,728 |
| 58. | West Richland | 7.1% | 3.4%(+3.71)#58 | 3.1%(+3.98)#2,737 |
| 59. | Dayton | 7.0% | 3.4%(+3.67)#59 | 3.1%(+3.94)#2,756 |
| 60. | Otis Orchards East Farms | 7.0% | 3.4%(+3.62)#60 | 3.1%(+3.89)#2,789 |
| 61. | Lake Marcel Stillwater | 7.0% | 3.4%(+3.60)#61 | 3.1%(+3.87)#2,800 |
| 62. | Blaine | 6.9% | 3.4%(+3.53)#62 | 3.1%(+3.80)#2,833 |
| 63. | St John | 6.9% | 3.4%(+3.52)#63 | 3.1%(+3.80)#2,842 |
| 64. | Lake Bosworth | 6.8% | 3.4%(+3.46)#64 | 3.1%(+3.73)#2,891 |
| 65. | Indianola | 6.8% | 3.4%(+3.45)#65 | 3.1%(+3.72)#2,900 |
| 66. | Washougal | 6.7% | 3.4%(+3.35)#66 | 3.1%(+3.62)#2,951 |
| 67. | Clear Lake Cdp Pierce County | 6.6% | 3.4%(+3.27)#67 | 3.1%(+3.54)#3,015 |
| 68. | Eastmont | 6.5% | 3.4%(+3.12)#68 | 3.1%(+3.40)#3,082 |
| 69. | South Cle Elum | 6.5% | 3.4%(+3.08)#69 | 3.1%(+3.35)#3,113 |
| 70. | Bangor Base | 6.4% | 3.4%(+3.07)#70 | 3.1%(+3.35)#3,125 |
| 71. | Browns Point | 6.4% | 3.4%(+3.00)#71 | 3.1%(+3.27)#3,180 |
| 72. | Centralia | 6.3% | 3.4%(+2.93)#72 | 3.1%(+3.21)#3,217 |
| 73. | Lynden | 6.3% | 3.4%(+2.89)#73 | 3.1%(+3.16)#3,237 |
| 74. | Cascade Valley | 6.2% | 3.4%(+2.85)#74 | 3.1%(+3.12)#3,296 |
| 75. | Lyle | 6.2% | 3.4%(+2.78)#75 | 3.1%(+3.05)#3,346 |
| 76. | Pullman | 6.1% | 3.4%(+2.70)#76 | 3.1%(+2.97)#3,398 |
| 77. | Canterwood | 6.0% | 3.4%(+2.66)#77 | 3.1%(+2.93)#3,438 |
| 78. | Monroe | 5.9% | 3.4%(+2.50)#78 | 3.1%(+2.77)#3,589 |
| 79. | Everson | 5.8% | 3.4%(+2.48)#79 | 3.1%(+2.75)#3,599 |
| 80. | Cosmopolis | 5.8% | 3.4%(+2.41)#80 | 3.1%(+2.68)#3,646 |
| 81. | Vader | 5.8% | 3.4%(+2.40)#81 | 3.1%(+2.67)#3,659 |
| 82. | Sumas | 5.7% | 3.4%(+2.37)#82 | 3.1%(+2.64)#3,679 |
| 83. | Esperance | 5.7% | 3.4%(+2.34)#83 | 3.1%(+2.62)#3,693 |
| 84. | Lakeland South | 5.7% | 3.4%(+2.33)#84 | 3.1%(+2.60)#3,714 |
| 85. | Bothell West | 5.6% | 3.4%(+2.23)#85 | 3.1%(+2.50)#3,801 |
| 86. | Woods Creek | 5.6% | 3.4%(+2.21)#86 | 3.1%(+2.48)#3,810 |
| 87. | Wenatchee | 5.6% | 3.4%(+2.18)#87 | 3.1%(+2.46)#3,850 |
| 88. | Orting | 5.5% | 3.4%(+2.11)#88 | 3.1%(+2.38)#3,914 |
| 89. | Cathcart | 5.5% | 3.4%(+2.08)#89 | 3.1%(+2.35)#3,949 |
| 90. | Kelso | 5.3% | 3.4%(+1.98)#90 | 3.1%(+2.25)#4,058 |
| 91. | Brinnon | 5.3% | 3.4%(+1.97)#91 | 3.1%(+2.24)#4,065 |
| 92. | Port Ludlow | 5.3% | 3.4%(+1.88)#92 | 3.1%(+2.16)#4,173 |
| 93. | Garfield | 5.2% | 3.4%(+1.85)#93 | 3.1%(+2.12)#4,204 |
| 94. | Bellingham | 5.2% | 3.4%(+1.79)#94 | 3.1%(+2.06)#4,261 |
| 95. | Fairfield | 5.2% | 3.4%(+1.78)#95 | 3.1%(+2.05)#4,271 |
| 96. | Cashmere | 5.1% | 3.4%(+1.68)#96 | 3.1%(+1.95)#4,400 |
| 97. | Chehalis | 5.0% | 3.4%(+1.59)#97 | 3.1%(+1.86)#4,499 |
| 98. | Ilwaco | 5.0% | 3.4%(+1.58)#98 | 3.1%(+1.85)#4,507 |
| 99. | Othello | 4.9% | 3.4%(+1.54)#99 | 3.1%(+1.81)#4,561 |
| 100. | Woodland | 4.9% | 3.4%(+1.51)#100 | 3.1%(+1.78)#4,597 |
Common Questions
What are the Top 10 Cities with the Highest Percentage of Population with a Degree in Physical and Health Sciences in Washington?
Top 10 Cities with the Highest Percentage of Population with a Degree in Physical and Health Sciences in Washington are:
#1
66.7%
#2
49.4%
#3
46.4%
#4
36.8%
#5
36.4%
#6
27.5%
#7
26.7%
#8
26.1%
#9
25.0%
#10
21.8%
What city has the Highest Percentage of Population with a Degree in Physical and Health Sciences in Washington?
Nespelem Community has the Highest Percentage of Population with a Degree in Physical and Health Sciences in Washington with 66.7%.
What is the Percentage of Population with a Degree in Physical and Health Sciences in the State of Washington?
Percentage of Population with a Degree in Physical and Health Sciences in Washington is 3.4%.
What is the Percentage of Population with a Degree in Physical and Health Sciences in the United States?
Percentage of Population with a Degree in Physical and Health Sciences in the United States is 3.1%.